

The Lenovo ThinkStation P3 Tower Gen 2 is a mid-range workstation, specifically engineered to meet the demands of professional workflows across various fields, including engineering, media, science, and software development. It is designed for users who prioritize reliability and performance while remaining budget-conscious (relatively).
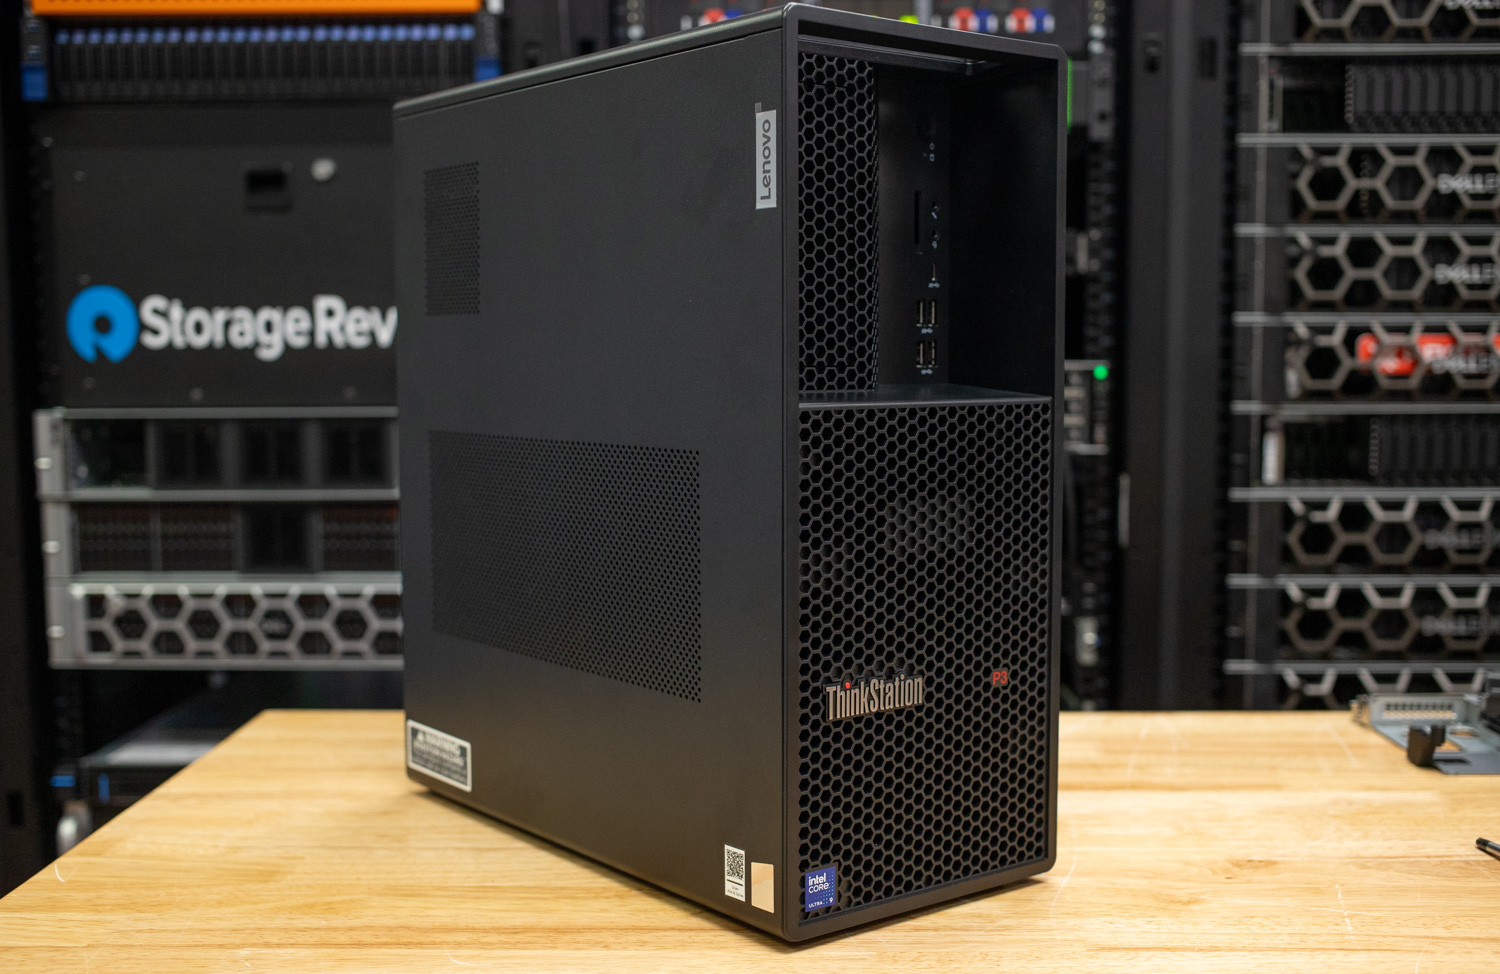
This workstation features a sleek chassis that allows for mostly tool-less access, facilitating easy upgrades and maintenance. It boasts a comprehensive selection of I/O ports, ensuring versatile connectivity options for various peripherals.
At its core, the ThinkStation P3 is powered by Intel’s Core Ultra 9 285 processor, which includes 16 efficiency cores and delivers an impressive 36 TOPS (Tera Operations Per Second) through its dedicated Neural Processing Unit (NPU). This architecture enables efficient multitasking and supports threaded applications, making it an excellent choice for demanding computing tasks, all while being more affordable than high-end workstations.
The base workstation configuration comes with 64GB of RAM and 1TB of M.2 storage, but it can accommodate configurations exceeding the standard. You can also choose from three high-end GPU options.
Specifications
| ThinkStation P3 Tower Gen 2 (Intel) – Technical Specifications | Specification | |
| Performance | ||
| Processors |
|
|
| Operating System | Windows 11 Pro | |
| Neural Processing Unit | Up to 36 TOPS AI performance | |
| Graphics | Integrated Intel® Graphics
|
|
| Memory | Up to 256GB DDR5 5600MT/s* | |
| Storage |
|
|
| Connectivity & Ports | ||
| Front Ports |
|
|
| Rear Ports |
|
|
| Expansion Options | Serial port, expansion cards, Flex IO (HDMI, VGA, USB-C w/DP, DisplayPort) | |
| Wireless | Optional WiFi 7 BE200 (2×2) & Bluetooth 5.4 vPro | |
| Design & Build | ||
| Dimensions (H×W×D) | 415 × 180 × 370 mm (16.34″ × 7.09″ × 14.57″) | |
| Weight | Starting at 8.65 kg (19.07 lbs) | |
| Color | Black | |
| Power Supply | ||
| Options | 1100W / 750W / 500W, all 92% efficient | |
| Security | ||
| Features | ThinkShield Security dTPM 2.0, BIOS admin & power-on passwords UEFI Secure Boot, self-healing BIOS Kensington® lock slot, padlock loop Optional: chassis intrusion switch, cable lock, e-lock |
|
| Sustainability & Certifications | ||
| Materials | 95% PCC recycled plastic front bezel 90% EPE cushioning Plastic-free packaging with 90% recycled/FSC-certified content |
|
| Certifications | ENERGY STAR, RoHS, TCO 10.0, EPEAT Gold with Climate+ | |
| Software & Included Items | ||
| Preloaded Software | Lenovo Commercial Vantage, Office 365 (trial) | |
| In the Box | ThinkStation P3 Tower Gen 2, USB Keyboard, USB Mouse, Quick Start Guide | |
Build and Design
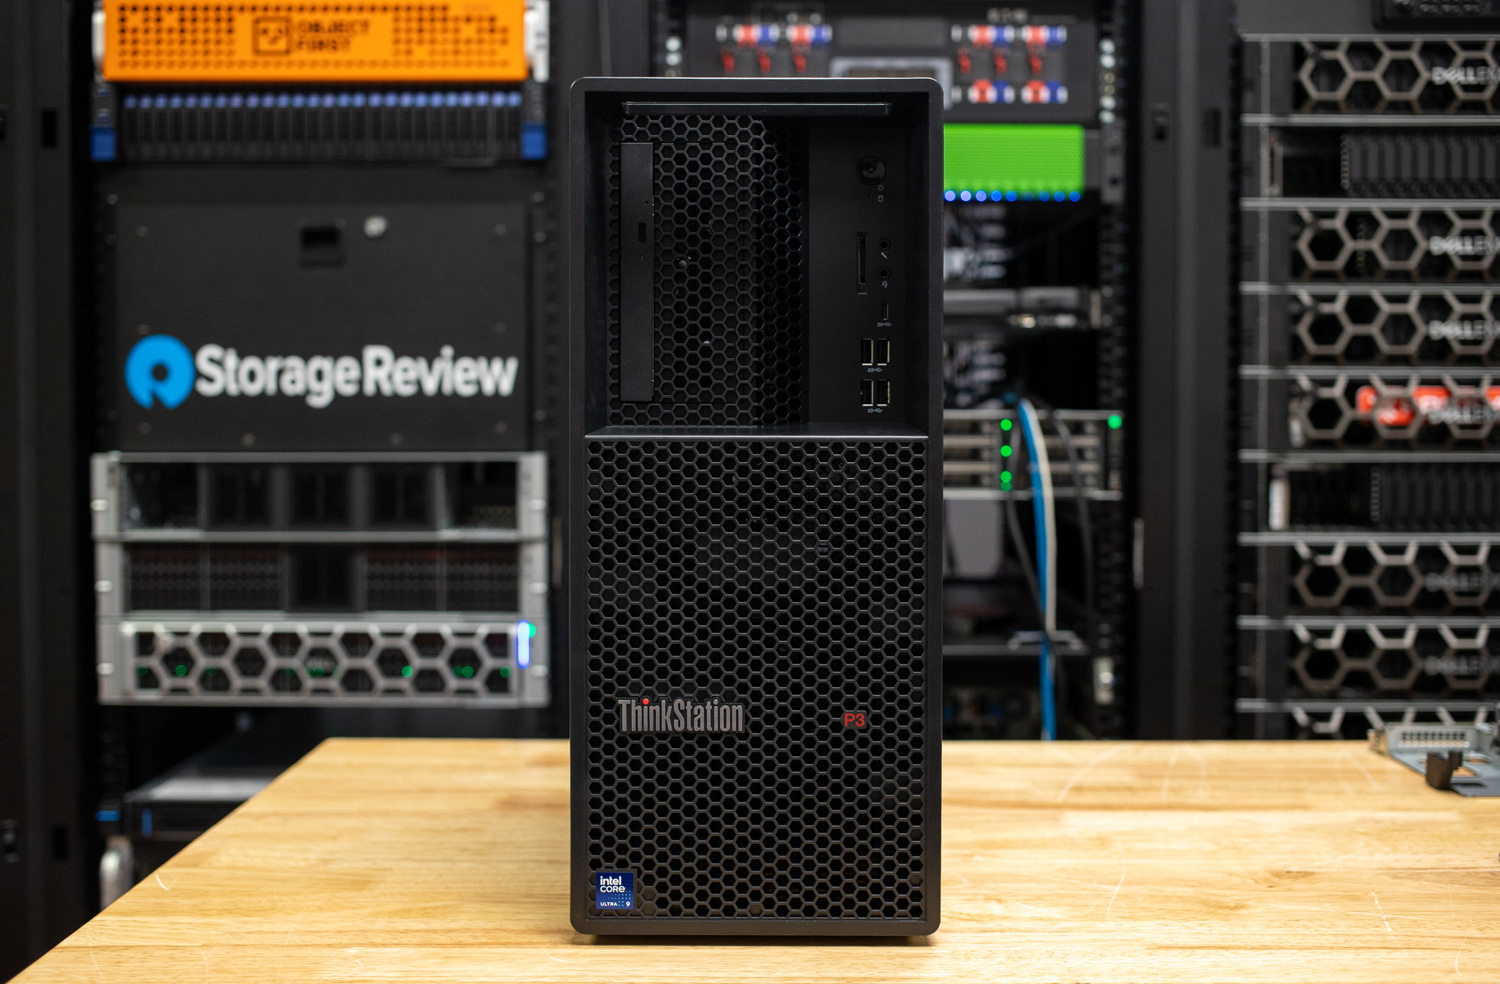
The ThinkStation P3 Tower is designed with a chassis that prioritizes optimal airflow for enhanced performance. Its front panel showcases a honeycomb structure, which contributes to the aesthetic appeal and facilitates superior ventilation. Additionally, the chassis is equipped with significant cut-out areas located on both the left side and rear, further promoting efficient airflow management. The overall design features smooth, rounded edges, providing a modern and polished look. Notably, an integrated handle is seamlessly incorporated into the top front side of the chassis, allowing for convenient maneuverability and ease of transport.
At 16.3″ x 14.6″ x 7.1″, this workstation has a relatively compact profile, making it suitable for most setups.
The front panel includes two USB-A Gen 1 ports, two USB-A Gen 2 ports, a media/memory card slot, and two 3.5mm jacks, one for a microphone and one for line output. The power button is also located on the front panel.
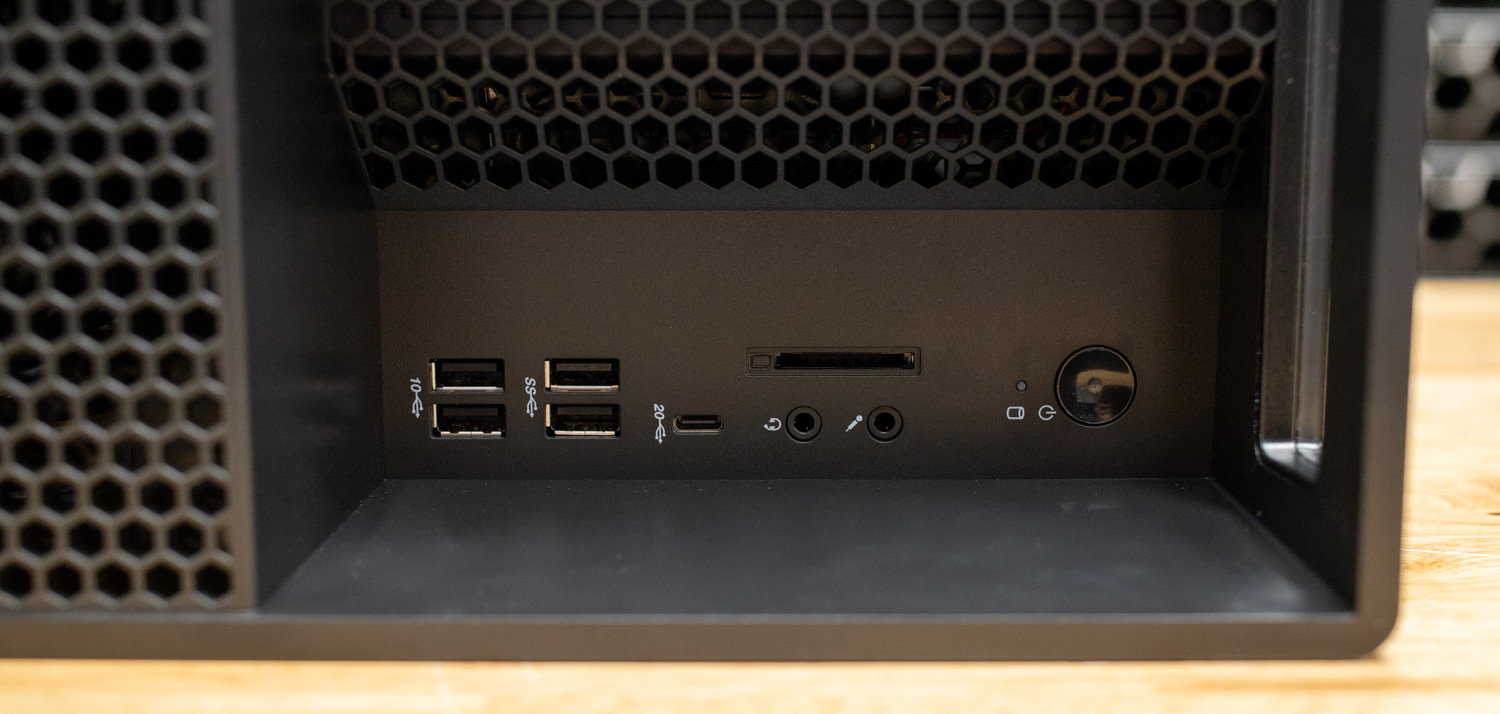
On the back, there are two USB-A 2.0 ports, two USB-A Gen 1 ports, and one HDMI 2.1 port. Additionally, a 3.5mm headphone/microphone combo jack and a Gigabit Ethernet port are available. There are seven total DisplayPorts on the workstation: four on the Graphics card, two on the motherboard, and a single flexIO DisplayPort. The Flex IO on our review system includes options such as DisplayPort, 5GB USB-C with DisplayPort function, and an HDMI or VGA port.
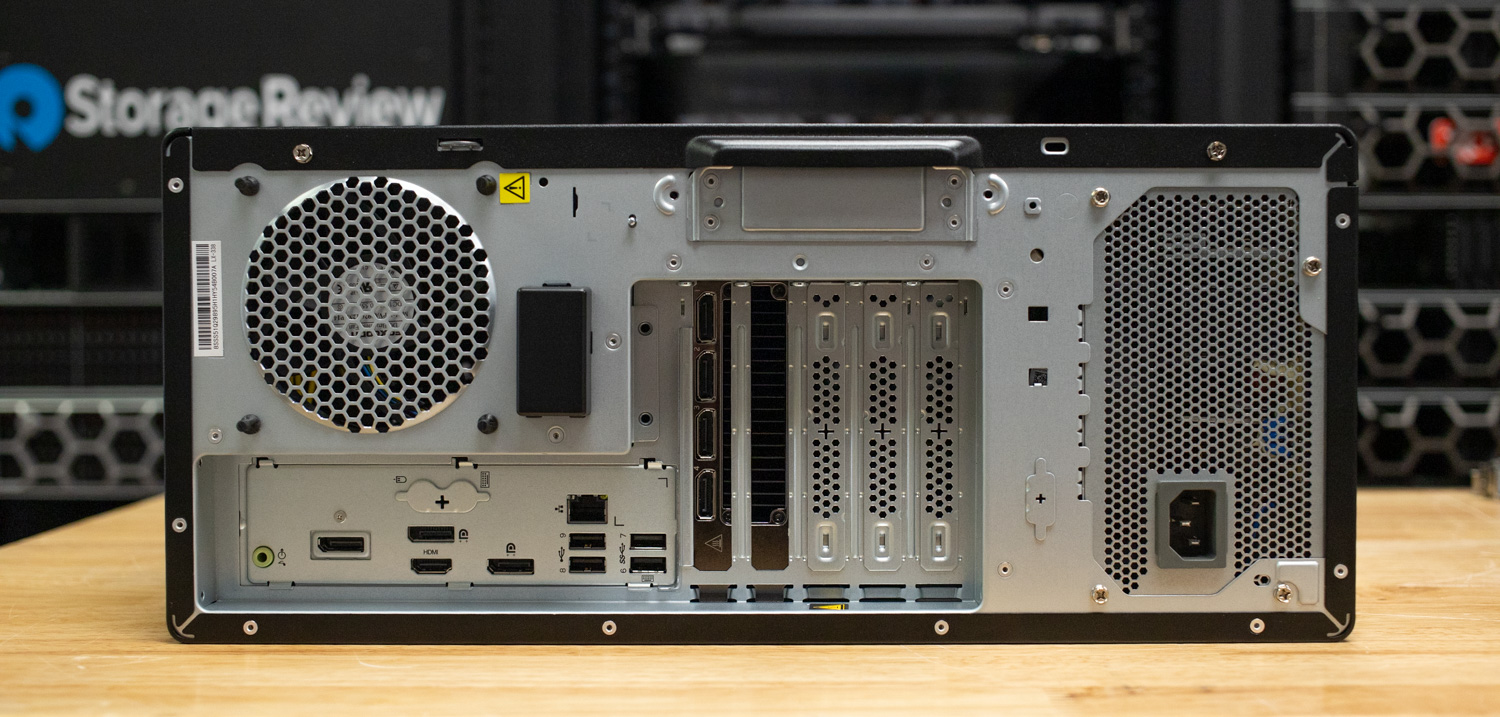
This model does not include external bays but features a front-access HDD bay. Users can expand the storage capacity with three optional additional disk bays, alongside the standard 3.5” / 2.5” bay. The system supports a maximum of seven drives configured as either three SATA HDDs/SSDs and four M.2 SSDs or four SATA HDDs/SSDs and two M.2 SSDs. This flexibility allows for substantial storage expansion.
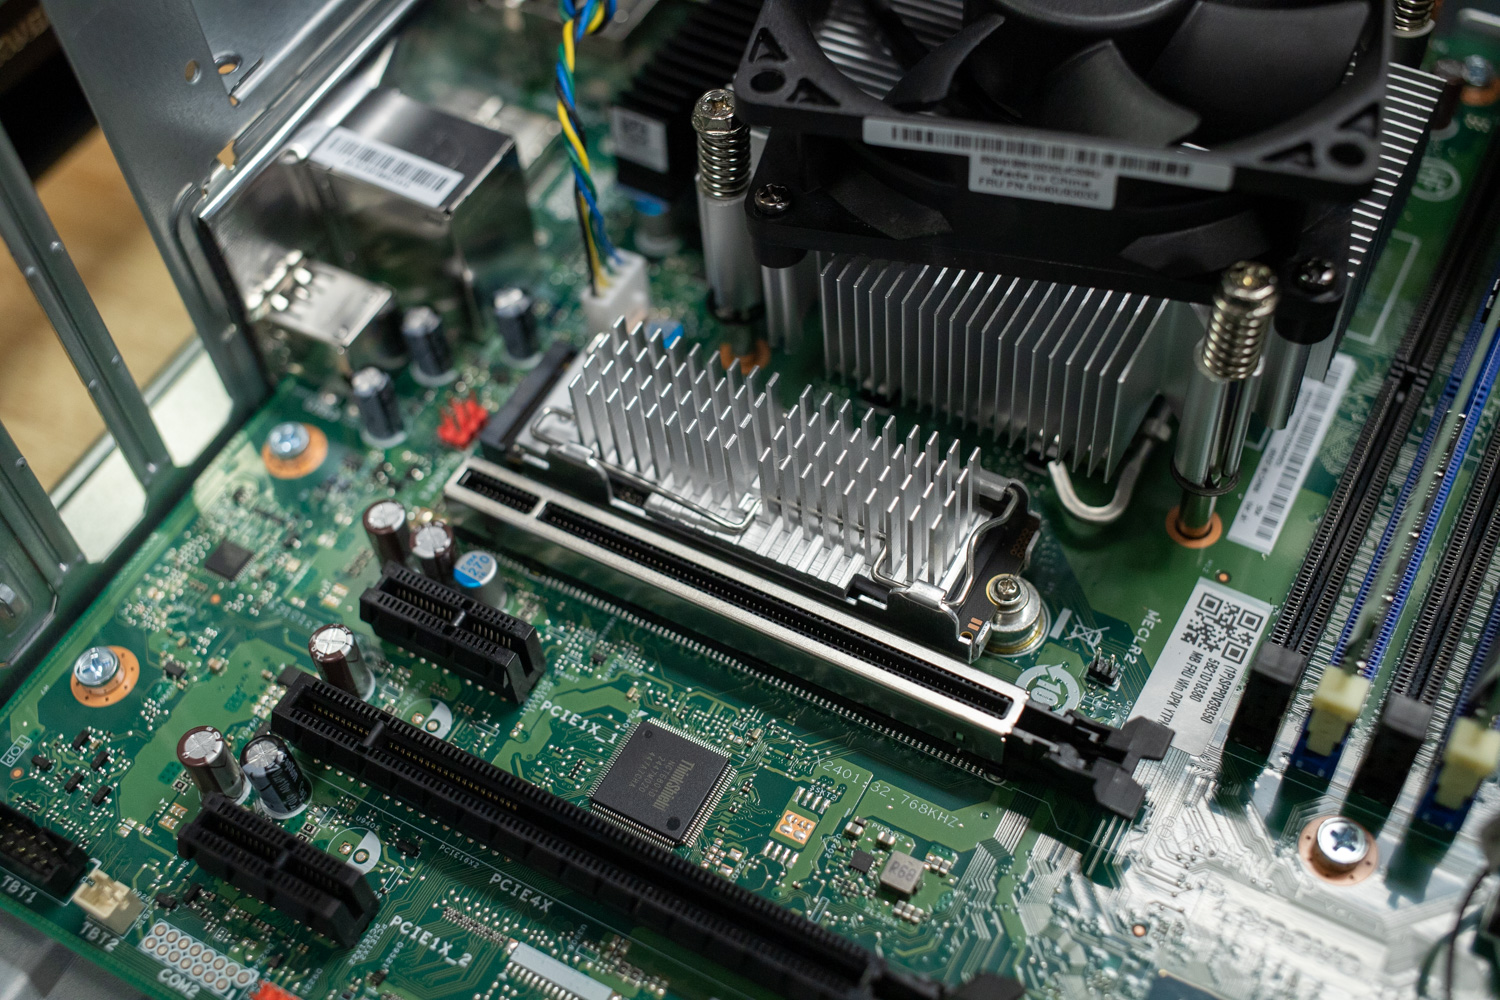
There is a broad range of M.2 slots on the ThinkStation P3 Tower Gen 2: one M.2 slot for WLAN, two onboard M.2 PCIe 4.0 slots, one onboard M.2 PCIe 5.0 slot (supports PCIe 4.0 and 5.0 SSDs), and a single M.2 to PCIe adapter supporting M.2 PCIe 4.0 SSDs. The base model comes equipped with 64GB of DDR5 RAM (2 x 32GB) but can be expanded to support up to 256GB.
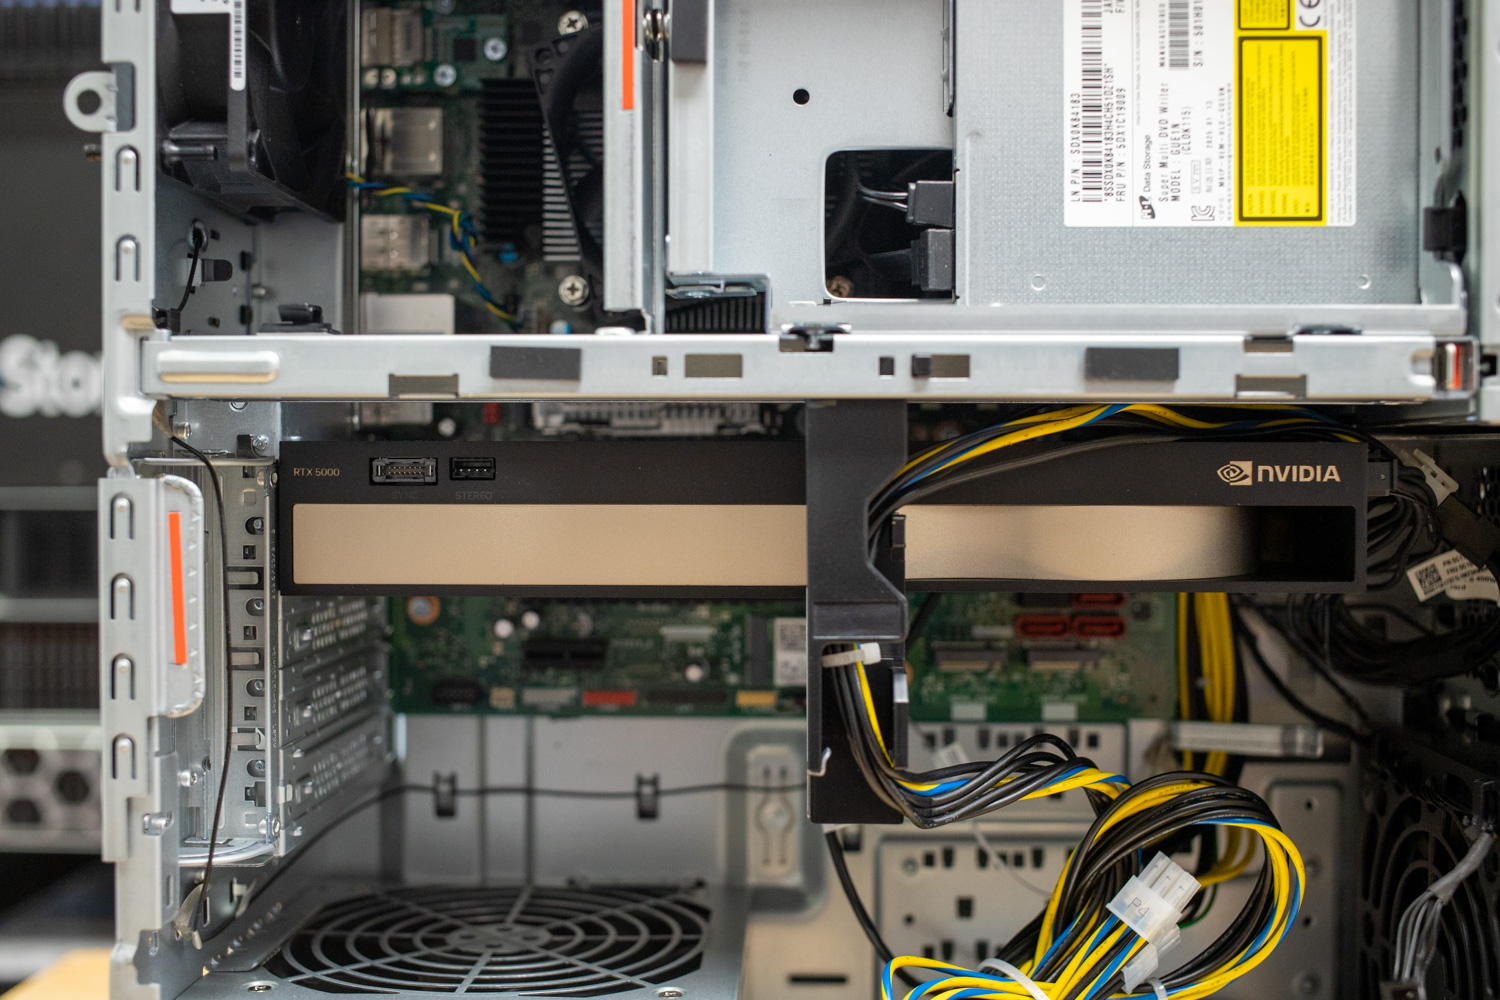
The workstation features a total of four PCIe slots. The preinstalled GPU is connected to the PCIe 5.0 x16 full-length slot, which provides 75W of power. Below this slot, there is a PCIe 3.0 x1 half-length slot (25W), but it is covered by the installed GPU. Further down, you’ll find a PCIe 4.0 x16 half-length slot (25W) and another PCIe 3.0 x1 slot. It’s important to note that the choice of power supplies (PSU), available in 500W, 750W, and 1100W options, will impact which components can be installed in the workstation.
Serviceability
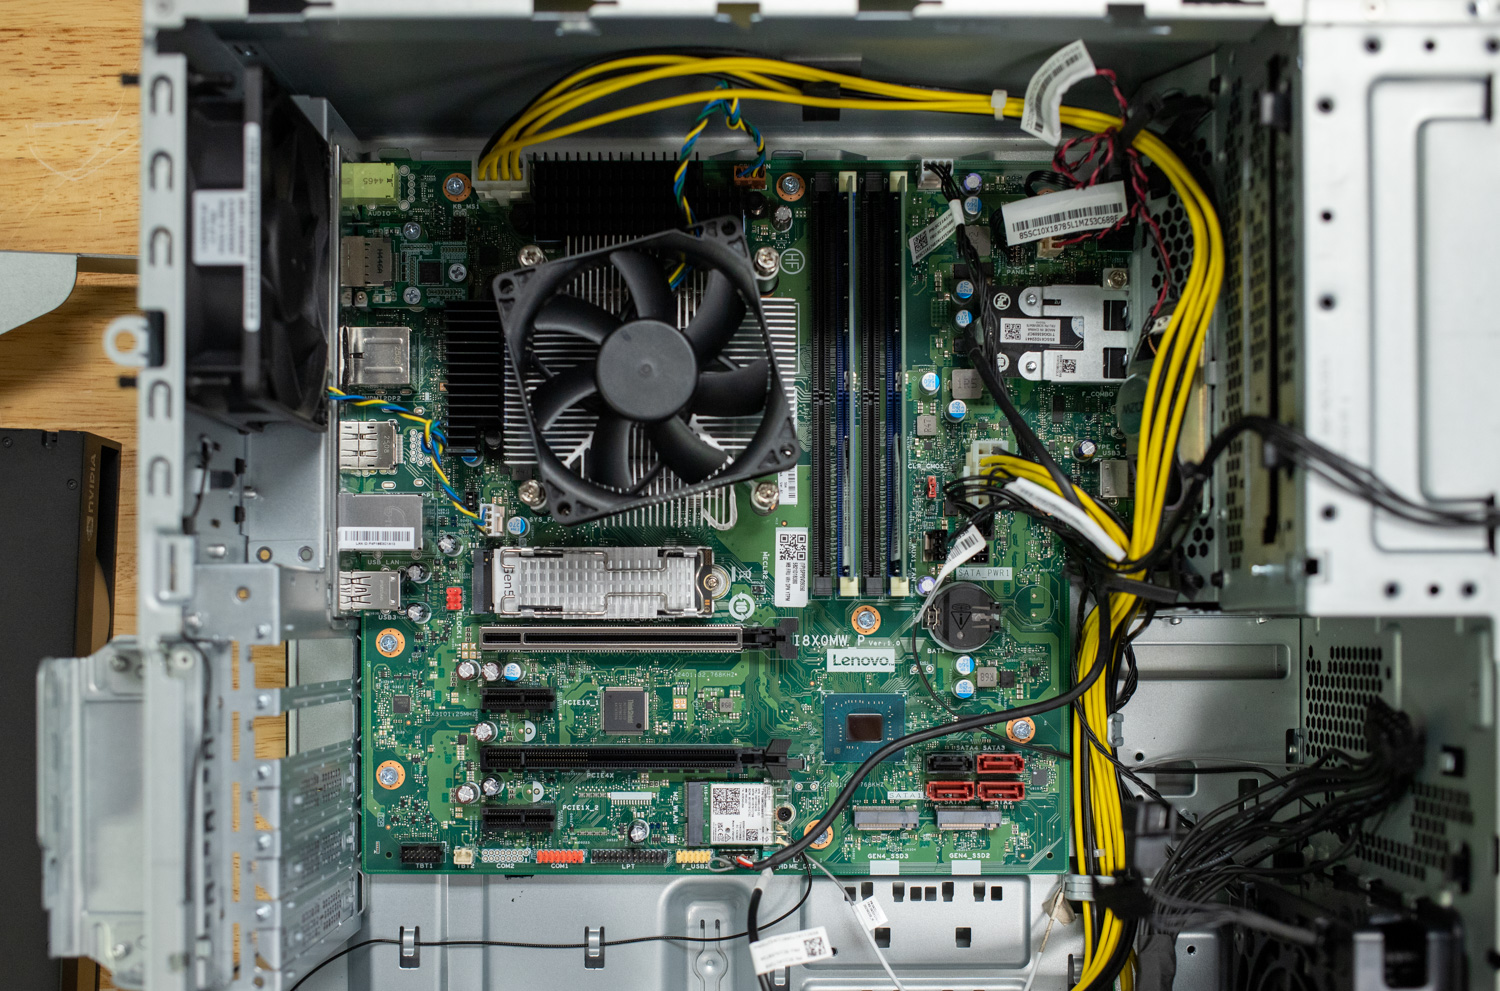
To service most components in this workstation, you can use your hands after removing the two Phillips head screws that hold the case side panel on. Accessing the interior of the case is straightforward. The only obstacles are a fan and a drive bay, both of which can be easily removed.
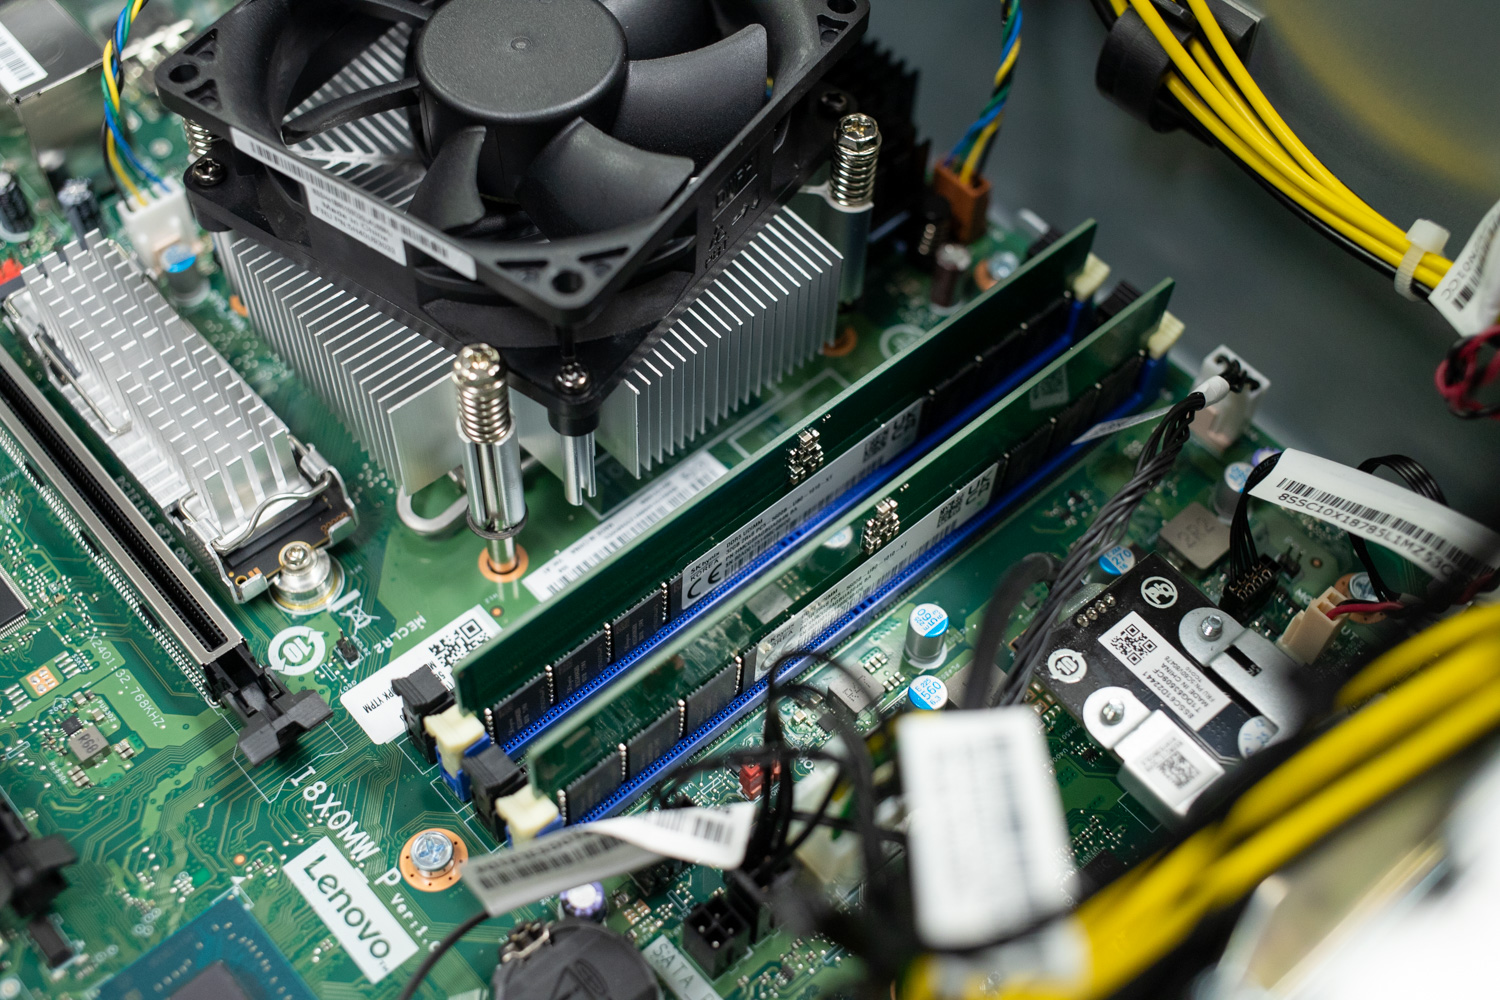
A compact cooler is installed over the Intel CPU and is easily removed for repairs. The M.2 SSD is conveniently located directly below the CPU.
To reach the four DDR5 slots, you will need to remove the drive bay covering that section of the motherboard. The power supply is securely screwed in place but can be easily removed for troubleshooting. All cables are organized with cable ties for efficient maintenance.
This workstation features a single NVIDIA RTX 5000 Ada graphics card installed in the top PCIe slot, with an option to add another card beneath it. Additionally, the workstation is equipped with four fans, with room for two more in the side panel to ensure effective airflow to all components.
Performance
Our ThinkStation P3 Tower Gen 2 setup includes:
- Intel Core Ultra 9 285
- NVIDIA RTX 5000 Ada Generation
- 64GB RAM
Our system is equipped with a powerful CPU and GPU and includes the second-largest amount of RAM available. The configuration combinations make this workstation suitable for its target market of mid-range users. The choice of GPU primarily determines the pricing for these packages.
We compared our system to the previous generation ThinkStation PX configured as follows:
- Intel Xeon Gold 5420+
- NVIDIA RTX A5500
- 256GB RAM
UL Procyon AI Inference Benchmark
The Procyon AI Inference Benchmark delivers reliable and efficient performance testing by streamlining AI Inference evaluation across diverse platforms. Developed in collaboration with leading AI hardware vendors, it minimizes complexity from variable models and system configurations to enable consistent, repeatable benchmarking. Optimized to measure CPU, GPU, or AI Accelerators, it offers meaningful insights into how well different systems handle real-world AI tasks.
The Procyon AI Inference Benchmark CPU test measures performance between the Intel Core Ultra 9 285 on the P3 Tower and the Intel Xeon Gold 5420+ on the ThinkStation PX. Overall, the benchmarks indicate that the Intel Core Ultra 9 outperforms the Xeon Gold 5420+, scoring 196 compared to 167. The superiority of the Intel Core Ultra 9 is particularly evident in the MobileNet V3 test, where it achieved an average time of 0.94 ms, significantly better than the 3.29 ms of the Intel Xeon Gold 5420+.
In the YOLO V3 and REAL-ESRGAN tests, the P3 Tower averaged a slower pace of 43.43 ms, whereas the PX workstation performed better with an average of 32.22 ms. When it came to the largest workloads, the P3 Tower recorded a time of 2,019.39 ms, while the ThinkStation PX had a reduced time of 1,433.09 ms. Overall, the Intel Core Ultra 9 performs well with smaller workloads; however, the Intel Xeon Gold 5420+ was able to operate quickly with the larger workloads when the other CPU slowed down.
| CPU Results (Average Time in ms) | Lenovo ThinkStation P3 Tower Gen 2 (Intel Core Ultra 9 285) | Lenovo ThinkStation PX (Intel) Workstation (Intel Xeon Gold 5420+) |
| AI Computer Vision Overall Score | 196 | 167 |
| MobileNet V3 | 0.94 ms | 3.29 ms |
| ResNet 50 | 6.83 ms | 7.17 ms |
| Inception V4 | 19.66 ms | 23.05 ms |
| DeepLab V3 | 24.89 ms | 27.97 ms |
| YOLO V3 | 43.43 ms | 32.22 ms |
| REAL-ESRGAN | 2019.39 ms | 1433.09 ms |
Next, we compare the NVIDIA Ada Generation RTX 5000 with the NVIDIA RTX A5500 using the same benchmark. The results indicate that our P3 Tower handles GPU tasks consistently better than the ThinkStation PX, with scores of 1,168 and 771, respectively. The newer RTX 5000 Ada exhibits a significant performance improvement during the MobileNet V3 test, achieving a time of 0.46 ms compared to the average of 0.64 ms for the A5500. This trend continues across various benchmarks, with the following times recorded: ResNet V3 at 1.07 ms, Inception V4 at 2.71 ms, DeepLab V3 at 12.27 ms, YOLO V3 at 4.63 ms, and REAL-ESRGAN at 81.82 ms. The GPU delivers a performance boost for AI workloads that is not available in previous-generation builds.
| GPU Results (Average Time in ms) | Lenovo ThinkStation P3 Tower Gen 2 (NVIDIA RTX 5000 Ada Generation) | Lenovo ThinkStation PX (Intel) Workstation (NVIDIA RTX A5500) |
| AI Computer Vision Overall Score | 1,168 | 771 |
| MobileNet V3 | 0.46 ms | 0.64 ms |
| ResNet 50 | 1.07 ms | 1.60 ms |
| Inception V4 | 2.71 ms | 4.24 ms |
| DeepLab V3 | 12.27 ms | 19.58 ms |
| YOLO V3 | 4.63 ms | 6.82 ms |
| REAL-ESRGAN | 81.82 ms | 127.85 ms |
The TensorRT test evaluates the throughput of AI models while minimizing latency. The P3 Tower demonstrates superior performance due to the newer model having AI acceleration, achieving an overall score of 1,706 compared to 1,308 from the ThinkStation PX. For smaller workloads, the P3 Tower achieves a time of 0.24 ms, while the ThinkStation PX requires 0.32 ms, indicating a lower average time for the P3 Tower. Similarly, for larger workloads, the average times are 84.04 ms for the P3 Tower and 152.69 ms for the PX. The only notable exception is with DeepLab V3, where the P3 Tower falls short, averaging 3.92 ms compared to 3.20 ms from the ThinkStation PX. Although designed as a mid-range workstation, the ThinkStation P3 Tower Gen 2 offers several significant benefits.
| TensorRT Results (Average Time in ms) | Lenovo ThinkStation P3 Tower Gen 2 | Lenovo ThinkStation PX (Intel) Workstation |
| AI Computer Vision Overall Score | 1,706 | 1,308 |
| MobileNet V3 | 0.24 ms | 0.32 ms |
| ResNet 50 | 0.94 ms | 1.17 ms |
| Inception V4 | 2.76 ms | 3.82 ms |
| DeepLab V3 | 3.92 ms | 3.20 ms |
| YOLO V3 | 3.09 ms | 4.45 ms |
| REAL-ESRGAN | 84.04 ms | 152.69 ms |
UL Procyon: AI Text Generation
The Procyon AI Text Generation Benchmark streamlines AI LLM performance testing by providing a concise and consistent evaluation method. It allows for repeated testing across multiple LLM models while minimizing the complexity of large model sizes and variable factors. Developed with AI hardware leaders, it optimizes the use of local AI accelerators for more reliable and efficient performance assessments. The results measured below were tested using TensorRT.
In the Procyon AI Text Generation test, the P3 Tower has an edge due to the processing power of the NVIDIA 5000 Ada Generation, which features 12,800 CUDA cores and a 256-bit memory bus, compared to the NVIDIA A5500 with 10,240 CUDA cores and a 384-bit memory bus. The 5000 Ada posted Phi and Mistral scores of 4,344 and 4,136, with output token rates of 160.757 tokens/s and 117.784 tokens/s, respectively, noticeably ahead of the A5500’s 142.314 tokens/s and 108.534 tokens/s. This trend continues in Llama3 and Llama2, where the 5000 Ada pulls out ahead, yielding 96.565 tokens/s and 30.285 seconds overall in Llama3 and 57.523 tokens/s and 50.269 seconds in Llama2. The 5000 Ada remains at the top, also performing well under heavier models. It offers compelling value for users seeking a system capable of AI acceleration without entering higher-tier pricing.
| UL Procyon: AI Text Generation | Lenovo ThinkStation P3 Tower Gen 2 (NVIDIA RTX 5000 Ada Generation) | Lenovo ThinkStation PX (Intel) Workstation (NVIDIA RTX A5500) |
| Phi Overall Score | 4,344 | 3,118 |
| Phi Output Time To First Token | 0.218 s | 0.375 s |
| Phi Output Tokens Per Second | 160.757 tokens/s | 142.314 tokens/s |
| Phi Overall Duration | 18.356 s | 21.489 s |
| Mistral Overall Score | 4,136 | 3,045 |
| Mistral Output Time To First Token | 0.314 s | 0.533 s |
| Mistral Output Tokens Per Second | 117.784 tokens/s | 108.534 tokens/s |
| Mistral Overall Duration | 25.142 s | 28.584 s |
| Llama3 Overall Score | 3,611 | 2,792 |
| Llama3 Output Time To First Token | 0.301 s | 0.495s |
| Llama3 Output Tokens Per Second | 96.565 tokens/s | 95.027 tokens/s |
| Llama3 Overall Duration | 30.285 s | 32.223 s |
| Llama2 Overall Score | 3,942 | 2,806 |
| Llama2 Output Time To First Token | 0.502 s | 0.806 s |
| Llama2 Output Tokens Per Second | 57.623 tokens/s | 52.258 tokens/s |
| Llama2 Overall Duration | 50.269 s | 57.759 s |
UL Procyon: AI Image Generation
The Procyon AI Image Generation Benchmark provides a consistent and accurate method for measuring AI inference performance across various hardware, ranging from low-power NPUs to high-end GPUs. It includes three tests: Stable Diffusion XL (FP16) for high-end GPUs, Stable Diffusion 1.5 (FP16) for moderately powerful GPUs, and Stable Diffusion 1.5 (INT8) for low-power devices. The benchmark uses the optimal inference engine for each system, ensuring fair and comparable results.
In the Procyon AI Image Generation benchmark, the P3 Tower continues to excel in GPU-related tasks. The Stable Diffusion 1.5 FP16 test scored 3,734, far ahead of the ThinkStation PX’s 2,386. The average image generation time of 1.674 seconds on the 5000 Ada is substantially faster than that of the A5500 at 2.619 seconds per image. The INT8 variant of the same model also follows suit, scoring 45,881 on the 5000 Ada compared to 27,743 on the A5500. It resulted in 0.681 seconds per image, marginally faster than the average time of the compared system. In Stable Diffusion XL FP16, the pattern persists, with 3,293 for the 5000 Ada and 2,012 for the A5500. Consistent with the previous results, this newer GPU operates with a higher efficiency than the A5500 on the ThinkStation PX.
| UL Procyon: AI Image Generation | Lenovo ThinkStation P3 Tower Gen 2 (NVIDIA RTX 5000 Ada Generation) | Lenovo ThinkStation PX (Intel) Workstation (NVIDIA RTX A5500) |
| Stable Diffusion 1.5 (FP16) – Overall Score | 3,734 | 2,386 |
| Stable Diffusion 1.5 (FP16) – Overall Time | 26.779 s | 41.911 s |
| Stable Diffusion 1.5 (FP16) – Image Generation Speed | 1.674 s/image | 2.619 s/image |
| Stable Diffusion 1.5 (INT8) – Overall Score | 45,881 | 27,743 |
| Stable Diffusion 1.5 (INT8) – Overall Time | 5.449 s | 9.011 s |
| Stable Diffusion 1.5 (INT8) – Image Generation Speed | 0.681 s/image | 1.126 s/image |
| Stable Diffusion XL (FP16) – Overall Score | 3,293 | 2,012 |
| Stable Diffusion XL (FP16) – Overall Time | 182.179 s | 298.158 s |
| Stable Diffusion XL (FP16) – Image Generation Speed | 11.386 s/image | 18.635 s/image |
UL Procyon AI Computer Vision
UL Procyon AI Inference is designed to gauge a workstation’s performance in professional applications. It should be noted that this test does not utilize multiple CPU capabilities. Specifically, this tool benchmarks the workstation’s ability to handle AI-driven tasks and workflows, providing a detailed assessment of its efficiency and speed in processing complex AI algorithms and applications.
The P3 Tower, designed for AI workloads, demonstrated performance comparable to the ThinkStation PX across all test categories. A strong indicator of their similar processing speeds in handling AI tasks is their identical overall score of 71. Examining the individual test results, we find that MobileNet V3 achieves 1.62 ms, ResNet 50 achieves 20.17 ms, Inception V4 achieves 60.94 ms, DeepLab V3 achieves 60.83 ms, YOLO V3 achieves 160.27 ms, and Real-ESRGAN achieves 62.59 ms. The efficiency of this workstation allows it to match the high-end performance of the previous generation of workstations.
| UL Procyon: AI Computer Vision Inference Times CPU (Lower is better) | Lenovo ThinkStation P3 Tower Gen 2 | Lenovo ThinkStation PX (Intel) Workstation |
|---|---|---|
| MobileNet V3 | 1.62 ms | 1.62 ms |
| ResNet 50 | 20.17 ms | 20.02 ms |
| Inception V4 | 60.94 ms | 60.15 ms |
| DeepLab V3 | 60.83 ms | 61.13 ms |
| YOLO V3 | 160.27 ms | 158.32 ms |
| Real-ESRGAN | 6259.97 ms | 6266.98 ms |
| Overall Score (higher is better) | 71 | 71 |
SPECworkstation 4
The SPECworkstation 4.0 benchmark is a comprehensive tool for evaluating all key aspects of workstation performance. It offers a real-world measure of CPU, graphics, accelerator, and disk performance, ensuring professionals have the data to make informed decisions about their hardware investments. The benchmark includes a dedicated set of tests focusing on AI and ML workloads, including data science tasks and ONNX runtime-based inference tests, reflecting the growing importance of AI/ML in workstation environments. It encompasses seven industry verticals and four hardware subsystems, providing a detailed and relevant measure of the performance of today’s workstations.
In SPECworkstation, results varied between the two systems depending on the workload. The PX tower led in Energy (3.16 vs. 2.49), Financial Services (3.84 vs. 2.44), and Life Sciences (3.78 vs. 2.84), showing the benefits of its server-class CPU in compute-heavy domains. Media & Entertainment and Product Design were closer, with the PX slightly ahead at 2.78 vs. 2.69 and 2.73 vs. 2.46, respectively. Productivity & Development was the only category where the P3 Tower pulled ahead, scoring 1.50 compared to the PX’s 1.09, demonstrating how the ThinkStation PX can attack workloads on the CPU with greater success.
| SPECworkstation 4.0.0 (Higher is better) |
Lenovo ThinkStation P3 Tower Gen 2 |
Lenovo ThinkStation PX (Intel) Workstation |
| Energy | 2.49 | 3.16 |
| Financial Services | 2.44 | 3.84 |
| Life Sciences | 2.84 | 3.78 |
| Media & Entertainment | 2.69 | 2.78 |
| Product Design | 2.46 | 2.73 |
| Productivity & Development | 1.50 | 1.09 |
Luxmark
Luxmark is a GPU benchmark that utilizes LuxRender, an open-source ray-tracing renderer, to evaluate a system’s performance in handling highly detailed 3D scenes. This benchmark is relevant for assessing the graphical rendering capabilities of servers and workstations, especially for visual effects and architectural visualization applications, where accurate light simulation is crucial.
In LuxMark, the Lenovo ThinkStation P3 fills the performance gap where the ThinkStation PX could not. In Hallbench, the P3 scored 26,792 compared to the PX’s 20,289, while in Food it reached 12,562 versus 7,827. This advantage stems mainly from the P3’s NVIDIA RTX 5000 Ada GPU, which delivers stronger OpenCL rendering performance than the PX’s RTX A5500.
| Luxmark (Higher is better) | Lenovo ThinkStation P3 Tower Gen 2 | Lenovo ThinkStation PX (Intel) Workstation |
| Hallbench | 26,792 | 20,289 |
| Food | 12,562 | 7,827 |
7-Zip Compression
The 7-Zip Compression Benchmark evaluates CPU performance during compression and decompression tasks, measuring ratings in GIPS (Giga Instructions Per Second) and CPU usage. Higher GIPS and efficient CPU usage indicate superior performance.
In the 7-Zip compression benchmark, the ThinkStation PX held a clear advantage in overall throughput, posting a total rating of 202.384 GIPS compared to the P3 Tower’s 138.701 GIPS. Looking at the resulting ratings, which reflect sustained performance, the PX also led with 206.619 GIPS in compression and 198.149 GIPS in decompression, while the P3 recorded 134.748 GIPS and 142.655 GIPS, respectively. These results highlight the PX’s strength in sustained, highly parallel data processing, aided by its server-class CPU. Demonstrating how the capabilities of the CPU of a high-end build surpass those of the mid-range build, ThinkStation P3 Tower Gen 2.
| 7-Zip Compression Benchmark (Higher is Better) | Lenovo ThinkStation P3 Tower Gen 2 | Lenovo ThinkStation PX (Intel) Workstation | |||
| Compression | |||||
| Current CPU Usage | 1,899% | 5,146% | |||
| Current Rating/Usage | 6.970 GIPS | 4.020 GIPS | |||
| Current Rating | 132.461 GIPS | 206.868 GIPS | |||
| Resulting CPU Usage | 1,894% | 5,169% | |||
| Resulting Rating/Usage | 7.115 GIPS | 3.997 GIPS | |||
| Resulting Rating | 134.748 GIPS | 206.619 GIPS | |||
| Decompression | |||||
| Current CPU Usage | 2,191% | 4,976% | |||
| Current Rating/Usage | 6.937 GIPS | 4.027 GIPS | |||
| Current Rating | 152.009 GIPS | 200.366 GIPS | |||
| Resulting CPU Usage | 1,979% | 5199% | |||
| Resulting Rating/Usage | 7,209 GIPS | 3.815 GIPS | |||
| Resulting Rating | 142.655 GIPS | 198.149 GIPS | |||
| Total Rating | |||||
| Total CPU Usage | 1,937% | 5,184% | |||
| Total Rating/Usage | 7.162 GIPS | 3.906 GIPS | |||
| Total Rating | 138.701 GIPS | 202.384 GIPS | |||
Blackmagic RAW Speed Test
The Blackmagic RAW Speed Test is a performance benchmarking tool that measures a system’s capabilities for handling video playback and editing using the Blackmagic RAW codec. It evaluates how well a system can decode and play back high-resolution video files, providing frame rates for both CPU- and GPU-based processing.
In the Blackmagic RAW Speed Test, the ThinkStation PX Workstation slightly edged out the P3 Tower in 8K CPU decoding, scoring 142 fps versus 125 fps. However, the P3 Tower took the lead in 8K OpenCL decoding, reaching 179 fps compared to the PX’s 150 fps. This is a fantastic visual that shows the strong suits of each build.
| Blackmagic RAW Speed Test | Lenovo ThinkStation P3 Tower Gen 2 | Lenovo ThinkStation PX (Intel) Workstation |
|---|---|---|
| 8K CPU | 125 | 142 |
| 8K OPENCL | 179 | 150 |
Blackmagic Disk Speed Test
The Blackmagic Disk Speed Test evaluates storage performance by measuring read and write speeds, providing insights into a system’s ability to handle data-intensive tasks, such as video editing and large file transfers.
The Lenovo ThinkStation P3 Tower Gen 2 delivers outstanding disk performance, recording 7,304.2 MB/s in read speeds and 7,006.2 MB/s in write speeds. This indicates a greater compatibility for high-speed transfers than the ThinkStation PX Workstation, which posted 3,958.2 MB/s read and 2,474.2 MB/s write.
| Disk Speed Test (higher is better) | Lenovo ThinkStation P3 Tower Gen 2 |
Lenovo ThinkStation PX (Intel) Workstation |
| Read | 7304.2 MB/s | 3958.2 MB/s |
| Write | 7006.2 MB/s | 2474.2 MB/s |
Blender 4.3
Blender is an open-source 3D modeling application. This benchmark was run using the Blender Benchmark utility. The score is measured in samples per minute, with higher values indicating better performance.
In Blender’s CPU rendering tests, the ThinkStation PX Workstation delivered higher sample rates than the P3 Tower, a difference attributable primarily to its server-class CPU. In the Monster scene, the PX achieved 450.8 samples per minute compared to the P3’s 163.7, while in Junkshop it scored 319.9 versus 106.8. The Classroom scene showed a similar trend, with the PX reaching 222.7 samples per minute against the P3’s 80.9.
| Blender CPU (Samples per minute, Higher is better) | Lenovo ThinkStation P3 Tower Gen 2 | Lenovo ThinkStation PX (Intel) Workstation |
| Monster | 163.7 | 450.8 |
| Junkshop | 106.8 | 319.9 |
| Classroom | 80.9 | 222.7 |
On the other hand, the P3 Tower equipped with an NVIDIA RTX 5000 Ada is ideal for Blender’s GPU rendering tests. In the Monster scene, it produced 3,884.68 samples per minute compared to the PX’s 2,277.83. Junkshop saw the P3 at 1,743.56 versus 1,415.61, while Classroom came in at 1,876.89 versus 1,252.93.
| Blender GPU (Samples per minute, Higher is better) | Lenovo ThinkStation P3 Tower Gen 2 | Lenovo ThinkStation PX (Intel) Workstation |
| Monster | 3,884.68 | 2,277.83 |
| Junkshop | 1,743.56 | 1,415.61 |
| Classroom | 1,876.89 | 1,252.93 |
y-cruncher
y-cruncher is a multithreaded and scalable program that can compute Pi and other mathematical constants to trillions of digits. Since its launch in 2009, it has become a popular benchmarking and stress-testing application for overclockers and hardware enthusiasts.
In Y-Cruncher, again, the ThinkStation PX adequately processes workloads at a capacity that the ThinkStation P3 does not exhibit. At 1 billion digits, the PX completed the run in 6.389 seconds compared to the P3’s 22.112 seconds, and at 10 billion digits, it finished in 85.968 seconds versus 340.904 seconds for the P3. The PX also extended its lead at higher workloads, recording 253.808 seconds for 25 billion and 576.144 seconds for 50 billion digits, while the P3 Tower was not tested at these scales due to the configured memory size.
| Y-Cruncher (Total Computation Time) | Lenovo ThinkStation P3 Tower Gen 2 | Lenovo ThinkStation PX (Intel) Workstation |
|---|---|---|
| 1 Billion | 22.112 s | 6.389 s |
| 2.5 Billion | 68.345 s | 17.146 s |
| 5 Billion | 146.977 s | 38.561 s |
| 10 Billion | 340.904 s | 85.968 s |
| 25 Billion | N/A | 253.808 s |
| 50 Billion | N/A | 576.144 s |
Geekbench 6
Geekbench 6 is a cross-platform benchmark that measures overall system performance.
In Geekbench 6, the ThinkStation P3 excelled in all categories. For CPU performance, the P3 scored 3,175 in single-core and 21,033 in multi-core, compared to the PX’s 2,193 and 18,495, respectively. GPU performance showed an even larger gap, with the P3’s NVIDIA RTX 5000 Ada reaching 244,185 in OpenCL against the PX’s 178,307 with its RTX A5500.
| Geekbench 6 (Higher is better) | Lenovo ThinkStation P3 Tower Gen 2 | Lenovo ThinkStation PX (Intel) Workstation |
|---|---|---|
| CPU Single-Core | 3,175 | 2,193 |
| CPU Multi-Core | 21,033 | 18,495 |
| GPU OpenCL | 244,185 | 178,307 |
Cinebench R23
The Cinebench R23 benchmark tool evaluates a system’s CPU performance by rendering a complex 3D scene using the Cinema 4D engine. It measures single-core and multi-core performance, providing a comprehensive view of the CPU’s capabilities in handling 3D rendering tasks.
In Cinebench R23, the Lenovo ThinkStation P3 Tower Gen 2 scored 30,760 in multi-core and 2,294 in single-core, while the PX Workstation posted 64,079 and 1,597, respectively. The PX and P3 Tower Gen 2 offer distinct strengths– where the PX focuses elsewhere, the P3 Tower Gen 2 delivers impressive single-core performance.
| Cinebench R23 (Higher is better) | Lenovo ThinkStation P3 Tower Gen 2 | Lenovo ThinkStation PX (Intel) Workstation |
|---|---|---|
| Multi-Core | 30,760 | 64,079 |
| Single-Core | 2,294 | 1,597 |
Cinebench 2024
Cinebench 2024 extends R23’s benchmark capabilities by adding GPU performance evaluation. It continues to test CPU performance but also includes tests that measure the GPU’s ability to handle rendering tasks.
In Cinebench 2024, the Lenovo ThinkStation P3 scored 1,851 in multi-core and 142 in single-core, compared to the PX, which scored 3,354 and 88. GPU performance also favored the P3, with its NVIDIA RTX 5000 Ada reaching 23,746 versus the PX’s 16,672 from the RTX A5500. These results highlight the PX’s dominance in heavily threaded CPU workloads, while the P3 leads in single-core efficiency and GPU rendering power.
| Cinebench 2024 (Higher is better) | Lenovo ThinkStation P3 Tower Gen 2 | Lenovo ThinkStation PX (Intel) Workstation |
|---|---|---|
| Multi-Core | 1,851 | 3,354 |
| Single-Core | 142 | 88 |
| GPU | 23,746 | 16,672 |
Conclusion
Lenovo’s vision for the P3 Tower was evident during our tests. The system consistently delivered reliable and efficient performance, proving its capability to manage demanding workloads. In particular, the P3 Tower excelled in AI benchmarks, matching the performance of the previous generation ThinkStation PX. This performance highlights how AI is redefining expectations within this price range.
The P3 Tower, equipped with the NVIDIA RTX 5000 Ada GPU, significantly enhances real-world performance, as demonstrated in various tests. For instance, in the UL Procyon AI Image Generation test, the P3 Tower achieved an impressive overall score of 3,734, compared to the NVIDIA RTX A5500’s score of 2,386, marking a 62% improvement across all three AI Image Generation benchmarks when using the optimal inference engine.
In the Luxmark test, the performance difference is also notable. The P3 Tower scored 26,792 in Hallbench, while the PX only managed 20,289. Additionally, in the Food benchmark, the PX scored 7,827, whereas the P3 Tower outperformed it with a score of 12,562. Overall, the P3 Tower demonstrates a clear advantage in performance.
The P3 Tower is a mid-range build, featuring the Intel Core Ultra 285 CPU with 24 cores. In our benchmarks, it demonstrates superior efficiency compared to the Xeon Gold processor. For instance, in the 7-Zip Compression benchmark, the Xeon Gold’s total CPU usage is 5,184%, while the Core Ultra uses only 1,937%. The Xeon Gold achieves a rating of 3.906 GIPS, whereas the Core Ultra reaches 7.162 GIPS. Consequently, the Core Ultra’s total rating is 138.701 GIPS, compared to the Xeon Gold’s 202.384 GIPS, indicating a nearly 46% decrease in total GIPS.
An efficient CPU and effective GPU make the ThinkStation P3 Tower Gen 2 a powerful mid-high-range system priced at $7,939. It bridges high-end performance and affordability, offering a versatile workstation that delivers premium results without a hefty price tag.


 Amazon