

In part one of this review, we looked at the feasibility of buying this RAID card to get 6.0Gbps, which showed measurable performance gains when using SSDs. In part two, we investigate whether 6.0Gbps SATA improves hard drive performance.
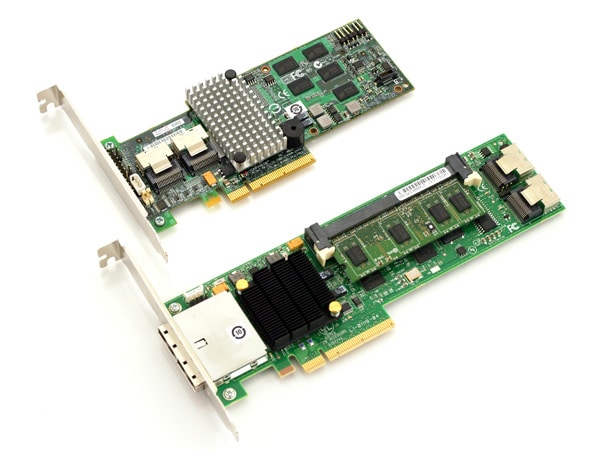
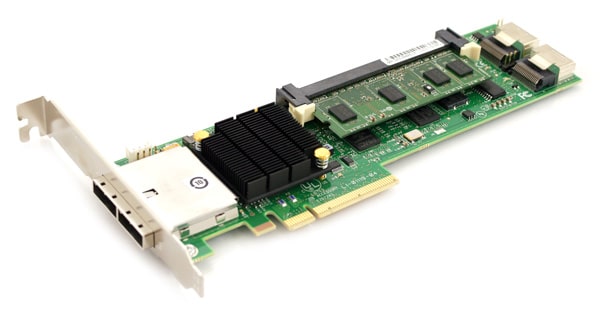
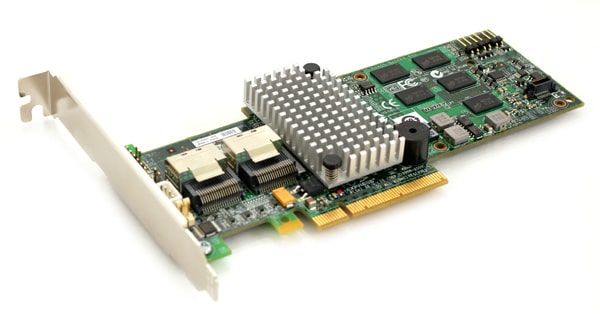
The 9260-8i is the faster of the two, offering a faster processor and cache speed. Both support the same RAID levels. Additionally, both cards use a PCI-express 2.0 slot and offer eight internal SAS/SATA ports. The primary difference between these cards as far as this review is concerned is the SATA connection speed; the 8888ELP has up to 3.0Gbps of throughput while the 9260-8i offers 6.0Gbps using the new SATA III standard. Part one of our review showed that there was indeed a difference between the two cards when it came to performance; for example, we saw the Corsair Force F120 peak at 260MB/s transfer speed with the 8888ELP but increase to 295MB/s with the faster 9260-8i. The same was the case with the Crucial RealSSD C300, which had up to a 30% performance difference. It is unknown at this point, however, whether this difference will also be apparent with hard drives.
LSI MegaRAID 8888ELP Quick Specifications:
- 3Gb/s throughput per port
- LSI SAS1078 RAID on Chip (ROC)
- 500MHz PowerPC
- 512MB DDRII Cache (667MHz)
- RAID levels 0, 1, 5 and 6
- RAID spans 10, 50 and 60
LSI MegaRAID 9260-8i Quick Specifications:
- 6Gb/s throughput per port
- LSI SAS2108 RAID-on-Chip (ROC)
- 800MHz PowerPC
- 512MB DDRII cache (800MHz)
- RAID levels 0, 1, 5 and 6
- RAID spans 10, 50 and 60
Today we will investigate the difference using fourth-generation Seagate Savvio 10K.4 hard drives (ST9600204SS). Not to be confused with ordinary 2.5-inch consumer hard drives, the Savvio series are enterprise-class and have a 15mm height (normal 2.5-inch drives used in notebook computers are 9.5mm or 12.5mm). The Savvio 10K.4 features a scorching 10,000RPM spindle speed, 16MB cache, and 6.0Gbps SATA connection. The drive is available in 450GB and 600GB capacities. These drives are optimized for server-style loads, especially ones involving multiple requests.
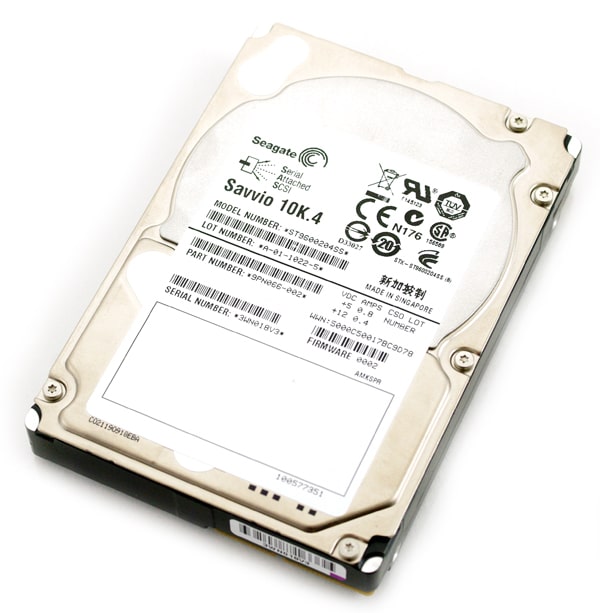
Seagate says the drives have a 135MB/s maximum sustained data transfer rate, so we have our doubts as to whether upgrading to a 6.0Gbps SATA card like the LSI MegaRAID 9260-8i will make a difference vs. the 3.0Gbps SATA interface used on the 8888ELP.
Synthetic Benchmarks
We benchmarked the Seagate Savvio 10K.4 drives using the LSI MegaRAID cards; notice which ones were run with 3.0Gbps and 6.0Gbps. Additionally, we used different RAID levels to run the benchmarks: RAID 0 (striped data across two drives) RAID 1 (two drives, mirrored), and RAID 5 (three drives).
IOMETER
Seequential read/write benchmarks generally represent the highest possible transfer speeds for a given storage device. Comparing the 3.0Gbps vs. 6.0Gbps results against one another, there isn’t a perceptible difference; all of the results are within a stone’s throw. However, notice the large difference in performance between the RAID levels; RAID5 and RAID0 both show the highest levels of performance. RAID1 is much slower on both reads and writes since data is not striped across one or more drives. The one interesting takeaway from this benchmark is the difference in read speeds between the 3.0Gbps and the 6.0Gbps cards; the 6.0Gbps card shows a 32% performance improvement. Let’s see if this pattern is repeated in the benchmarks that follow.
Given we are using the same hard drives for all the benchmarks, the differences you see are a direct result of the RAID configurations and the RAID cards. We are seeing some discrepancies with the RAID0 3.0Gbps and RAID5 3.0Gbps results, where the write speeds are higher than the read speeds. The write speeds in both cases are well ahead of the 6.0Gbps results using the same RAID levels.
On the flip side, notice the RAID1 3.0Gbps vs. 6.0Gbps results; the write speeds are nearly identical; however the read speeds are 20% higher for the 6.0Gbps card. These results are in line with the sequential read/write benchmark. Again, this could simply be the result of using different RAID cards (the 9260-8i has a faster processor and cache than the 8888ELP).
This next set of benchmarks are for random reads and writes. This presents a more realistic look of what to expect performance-wise between the 3.0Gbps and 6.0Gbps RAID cards, as most hard drive queries read from multiple places on the hard disk platter(s).
All of the results show essentially no difference on each of the RAID levels, regardless of 3.0Gbps vs. 6.0Gbps.
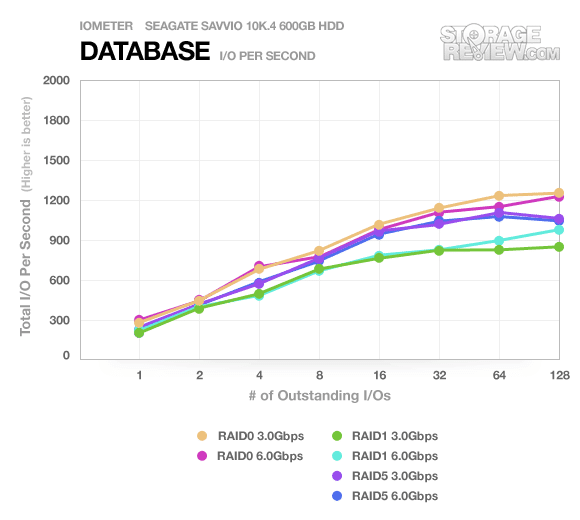
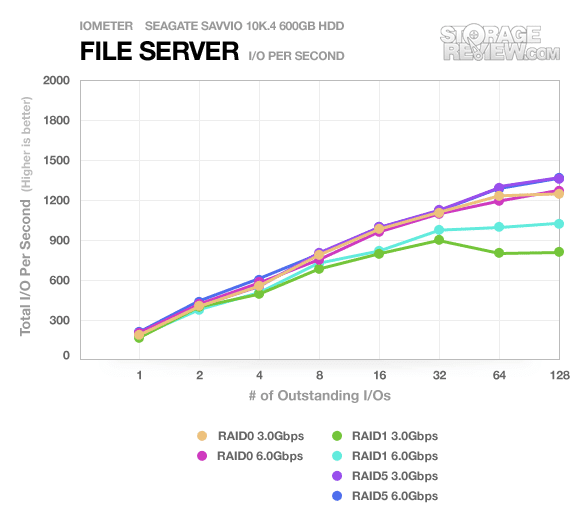
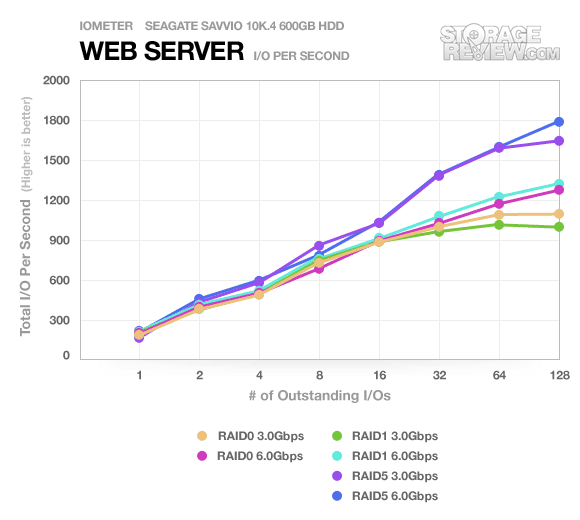
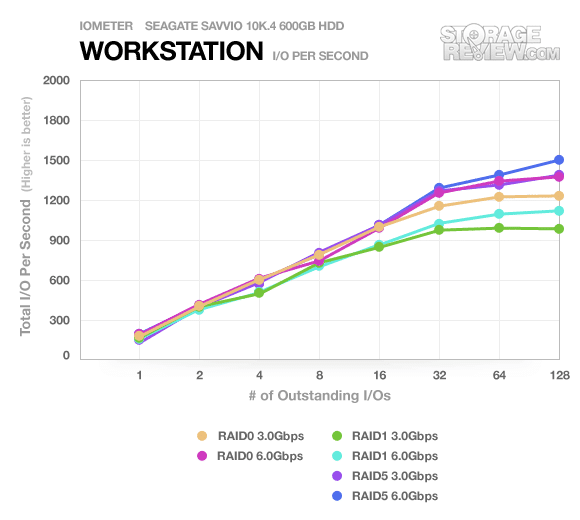
This last set of IOMETER benchmarks put server-style loads on the drives, forcing them to respond to multiple commands at once. They make heavy use of Native Command Queuing (NCQ) and have a queue depth range from 1 to 128.
The RAID1 results stay below the RAID5 and RAID0 levels, which is expected; RAID1 is not designed for performance to begin with. Something very interesting is happening in this set of benchmarks however; notice how the 6.0Gbps benchmarks sharply pull away from the 3.0Gbps results when the queue depth reaches 32 to 64.
Real-World Benchmarks
Our real-world benchmarks provide the best indication of what to expect from these drives in actual usage scenarios.
In this test we include: playing one 720P HD movie in Media Player Classic, one 480P SD movie playing in VLC, three movies downloading simultaneously through iTunes, and one 1080i HDTV stream being recorded through Windows Media Center over a 15 minute period. Higher IOps and MB/s rates with lower latency times are preferred. In this trace we recorded 2,986MB being written to the drive and 1,924MB being read.
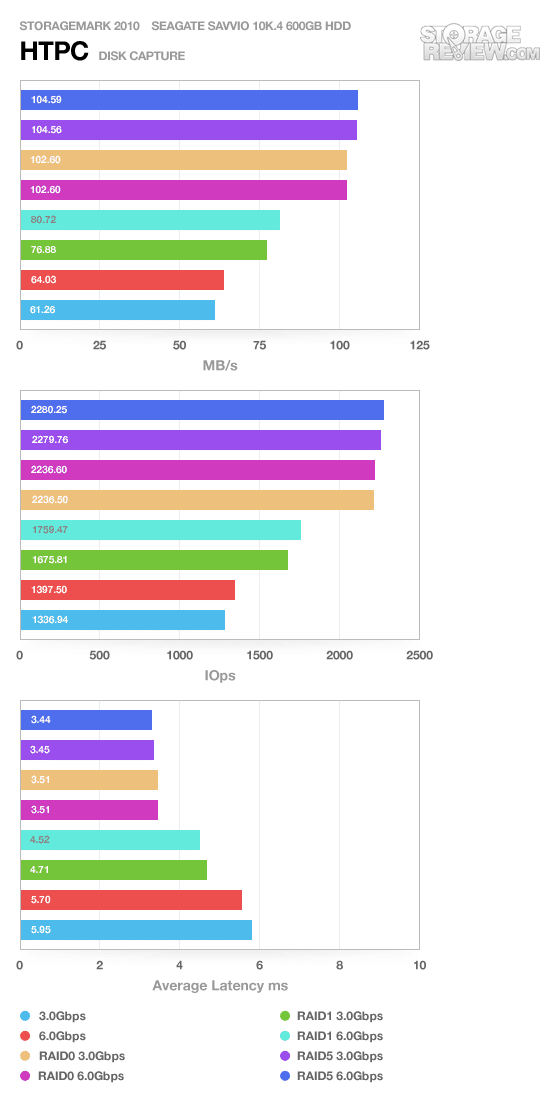
In this read performance-focused test, the RAID5 setups come out on top. There is zero performance difference between the 3.0Gbps and 6.0Gbps versions; the same goes for the RAID0 setups.
The RAID1 setups differ slightly in performance, however; 6.0Gbps shows about a five percent advantage. This is a very small difference but nonetheless, it exists and is significant because there is no difference for the other setups. Given the low data transfer rate, it is unlikely this is a result of the 3.0Gbps vs. 6.0Gbps interface differences.
Our next real-life test covers disk activity in a gaming environment. Unlike the HTPC trace, this one relies heavily on the read performance of a drive. To give a simple breakdown of read/write percentages, the HTPC test is 64% write, 36% read, the Productivity test is 59% write and 41% read, while the gaming trace is 6% write and 94% read. The test consists of a Windows 7 Ultimate 64-bit system pre-configured with Steam, with Grand Theft Auto 4, Left 4 Dead 2, and Mass Effect 2 already downloaded and installed. The trace captures the heavy read activity of each game loading from the start, as well as textures as the game progresses. In this trace we recorded 426MB being written to the drive and 7,235MB being read.
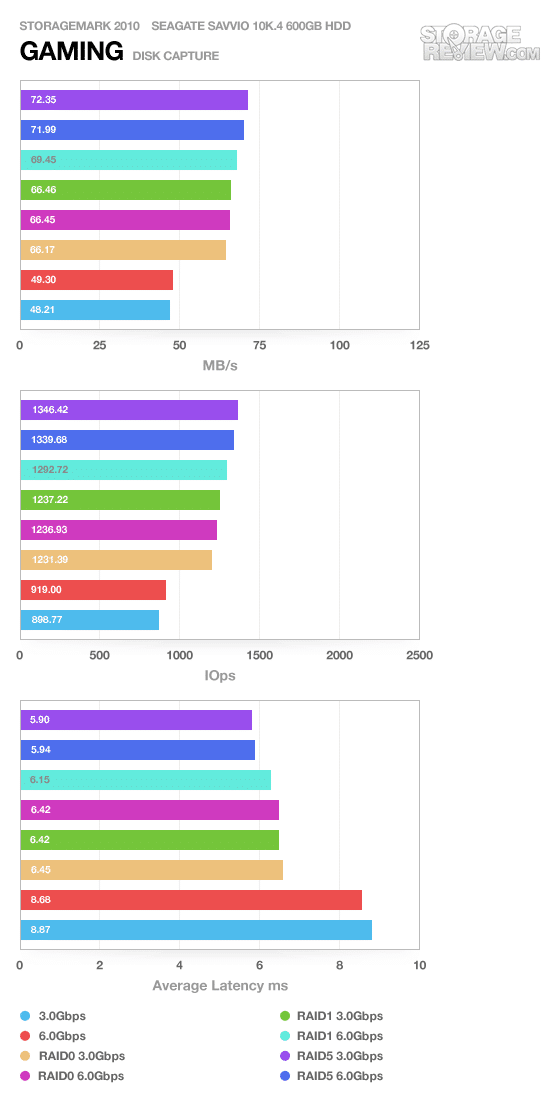
Our gaming benchmark focuses on the read performance of the drives. We can see generally identical performance across all of the RAID configurations between 3.0Gbps and 6.0Gbps. The differences we are setting are probably due to the 9260-8i’s faster processor and cache.
Our last real-life test covers disk activity in a productivity scenario. For all intents and purposes this test shows drive performance under normal daily activity for most users. This test includes: a three hour period operating in an office productivity environment with 32-bit Vista running Outlook 2007 connected to an Exchange server, web browsing using Chrome and IE8, editing files within Office 2007, viewing PDFs in Adobe Reader, and an hour of local music playback with two hours of additional online music via Pandora. In this trace we recorded 4,830MB being written to the drive and 2,758MB being read.
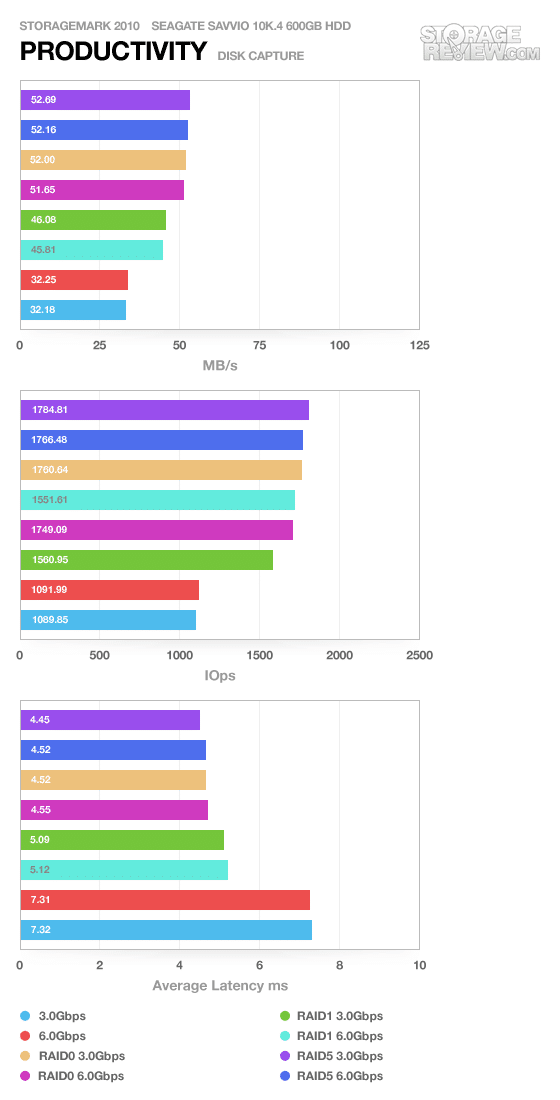
Last but not least, productivity is an identical story; there is no credible performance difference between the 3.0Gbps and 6.0Gbps setups.
Conclusion
Unlike SSDs, hard drives do not benefit from the faster transfer speed of LSI’s MegaRAID 9260-8i card and its 6.0Gbps SATA III interface vs. the SATA II MegaRAID 8888ELP. This is not an unexpected result given hard drives, even the ultra high-performance Seagate Savvio enterprise drives we used for testing can’t take full advantage of 3.0Gbps SATA speeds, let alone 6.0Gbps. To date we have not tested a platter-based drive that was able to consistently saturate SATA 3.0Gbps.
If you plan on sticking with hard drives for the long haul, it is probably not a wise financial decision to upgrade to a 6.0Gbps RAID card; there is zero perceptible performance gain. Now if you happen to have SSDs on the horizon, or ideas of using features such as CacheCade… it might be worthwhile to consider an upgrade especially if you might have some untapped budget or an itch to give your system a major boost in power by adding some new SATA 6.0Gbps SSDs to the mix.


 Amazon