

During their Step Ahead event in Beijing, Memblaze launched a new series of 500 NVME drives as well as an expansion of its 900 line to 910 and 916. We will be looking at the 910 series in this review. The new 910 drives are offered in two form factors and leverage 64-Layer 3D NAND, which allows the drives to come in capacities as high as 16TB. This higher density can lead to denser racks or rack consolidation in the data center.
Aside from leveraging 64-Layer to hit higher capacities, the Memblaze PBlaze5 910 claims higher performance than previous models. The company states the drive can hit sequential reads up to 3.5GB/s and throughput up to 835K IOPS, all the while having sub-millisecond latency. The drive also comes with built in high availability, being dual ported, thus a single path of failure is removed. The 910 has 1 DWPD of endurance as well as two million hours MTBF. Ideal use cases include: database, searching, indexing, CDN, Cloud and Hyper-scale, SDS, deep learning and big data analytics, ERP, SAP HANA, BOSS, banking, taxing, high frequency trading, and online payment.
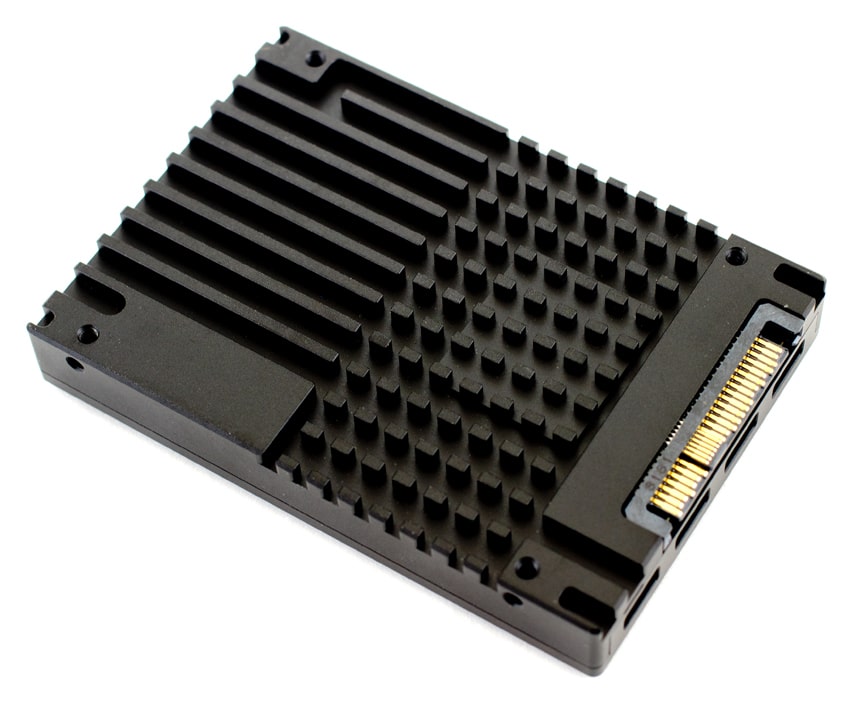
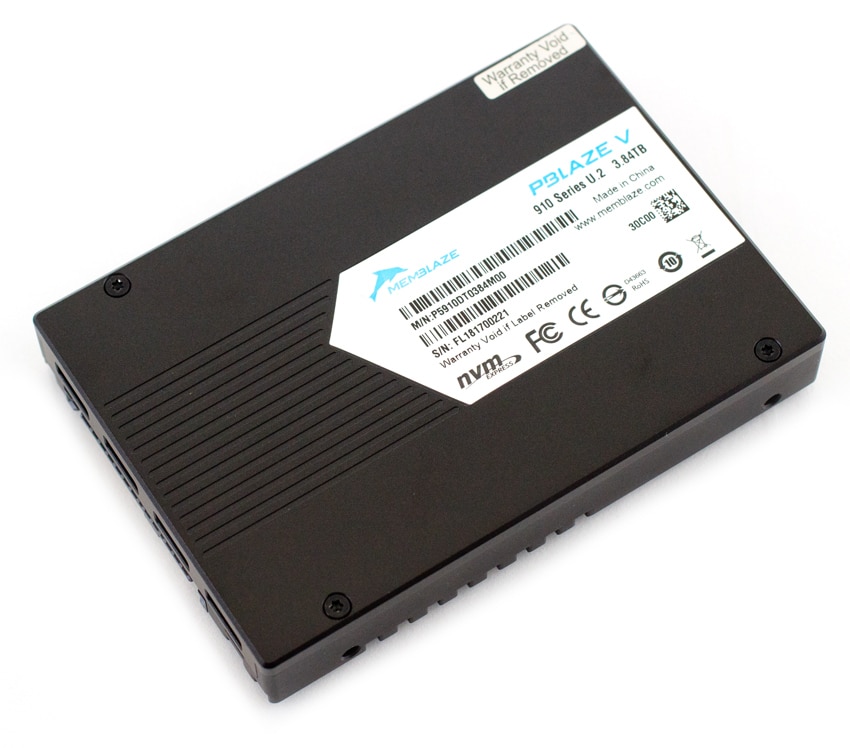
For this review we will be looking at the 3.84TB, U.2 of the PBlaze5 910.
Memblaze PBlaze5 910 NVMe SSD Specifications
| Form factor | U.2 | ||
| Capacity | 3.84TB | 7.68TB | 15.36TB |
| NAND | 3D eTLC | ||
| Interface | PCIe 3.0 x 4 | ||
| Protocol | NVMe 1.2a | ||
| Performance | |||
| Sequential Read (128KB) | 3.5GB/s | 3.5GB/s | 3.3GB/s |
| Sequential Write (128KB) | 3.1GB/s | 3.5GB/s | 3.3GB/s |
| Sustained Random Read (4KB) | 835K IOPS | 830K IOPS | 826K IOPS |
| Sustained Random Write (4KB) | 99K IOPS | 135K IOPS | 150K IOPS |
| Latency R/W | 87/12μs | ||
| DWPD | 1 | ||
| UBER | <10^-17 | ||
| MTBF | 2 million hours | ||
| Power consumption | 7~25W | ||
Performance
Testbed
Our Enterprise SSD reviews leverage a Lenovo ThinkSystem SR850 for application tests and a Dell PowerEdge R740xd for synthetic benchmarks. The ThinkSystem SR850 is a well-equipped quad-CPU platform, offering CPU power well in excess of what's needed to stress high-performance local storage. Synthetic tests that don't require a lot of CPU resources use the more traditional dual-processor server. In both cases, the intent is to showcase local storage in the best light possible that aligns with storage vendor maximum drive specs.
Lenovo ThinkSystem SR850
- 4 x Intel Platinum 8160 CPU (2.1GHz x 24 Cores)
- 16 x 32GB DDR4-2666Mhz ECC DRAM
- 2 x RAID 930-8i 12Gb/s RAID Cards
- 8 NVMe Bays
- VMware ESXI 6.5
Dell PowerEdge R740xd
- 2 x Intel Gold 6130 CPU (2.1GHz x 16 Cores)
- 16 x 16GB DDR4-2666MHz ECC DRAM
- 1x PERC 730 2GB 12Gb/s RAID Card
- Add-in NVMe Adapter
- Ubuntu-16.04.3-desktop-amd64
Testing Background and Comparables
The StorageReview Enterprise Test Lab provides a flexible architecture for conducting benchmarks of enterprise storage devices in an environment comparable to what administrators encounter in real deployments. The Enterprise Test Lab incorporates a variety of servers, networking, power conditioning, and other network infrastructure that allows our staff to establish real-world conditions to accurately gauge performance during our reviews.
We incorporate these details about the lab environment and protocols into reviews so that IT professionals and those responsible for storage acquisition can understand the conditions under which we have achieved the following results. None of our reviews are paid for or overseen by the manufacturer of equipment we are testing. Additional details about the StorageReview Enterprise Test Lab and an overview of its networking capabilities are available on those respective pages.
Comparables for this review:
- Memblaze PBlaze5 3.2TB
- Memblaze PBlaze4 3.2TB
- Intel P3700 2TB
- Intel P4500 2TB
- HGST SN100 3.2TB
- Toshiba PX04 1.6TB
Application Workload Analysis
In order to understand the performance characteristics of enterprise storage devices, it is essential to model the infrastructure and the application workloads found in live-production environments. Our benchmarks for the Memblaze PBlaze5 910 are therefore the MySQL OLTP performance via SysBench and Microsoft SQL Server OLTP performance with a simulated TCP-C workload. For our application workloads, each drive will be running 2-4 identically configured VMs.
SQL Server Performance
Each SQL Server VM is configured with two vDisks: 100GB volume for boot and a 500GB volume for the database and log files. From a system-resource perspective, we configured each VM with 16 vCPUs, 64GB of DRAM and leveraged the LSI Logic SAS SCSI controller. While our Sysbench workloads tested previously saturated the platform in both storage I/O and capacity, the SQL test is looking for latency performance.
This test uses SQL Server 2014 running on Windows Server 2012 R2 guest VMs, and is stressed by Quest's Benchmark Factory for Databases. StorageReview’s Microsoft SQL Server OLTP testing protocol employs the current draft of the Transaction Processing Performance Council’s Benchmark C (TPC-C), an online transaction-processing benchmark that simulates the activities found in complex application environments. The TPC-C benchmark comes closer than synthetic performance benchmarks to gauging the performance strengths and bottlenecks of storage infrastructure in database environments. Each instance of our SQL Server VM for this review uses a 333GB (1,500 scale) SQL Server database and measures the transactional performance and latency under a load of 15,000 virtual users.
SQL Server Testing Configuration (per VM)
- Windows Server 2012 R2
- Storage Footprint: 600GB allocated, 500GB used
- SQL Server 2014
- Database Size: 1,500 scale
- Virtual Client Load: 15,000
- RAM Buffer: 48GB
- Test Length: 3 hours
- 2.5 hours preconditioning
- 30 minutes sample period
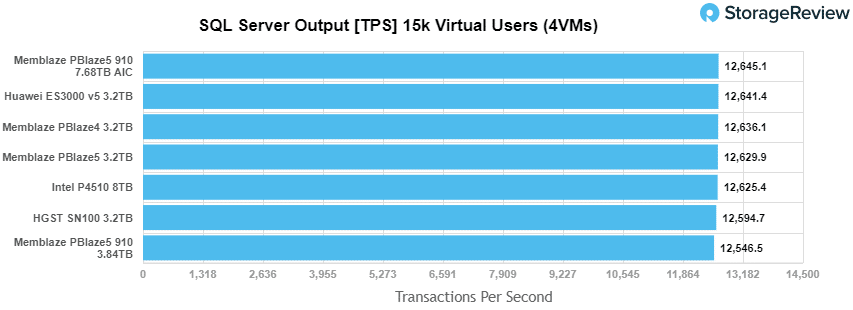
For our SQL Server transactional benchmark, the Memblaze PBlaze5 910 U.2 came in at the bottom of the pack with 12,546.5 TPS, lower than three other PBlaze drives.
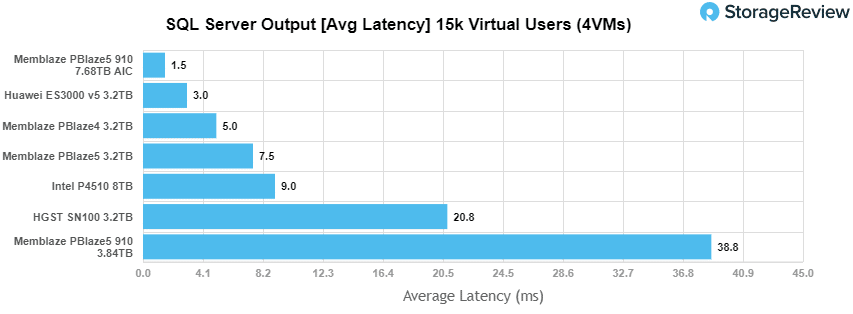
Surprisingly, the 910 also had the highest latency at 38.8ms.
Sysbench Performance
The next application benchmark consists of a Percona MySQL OLTP database measured via SysBench. This test measures average TPS (Transactions Per Second), average latency, and average 99th percentile latency as well.
Each Sysbench VM is configured with three vDisks: one for boot (~92GB), one with the pre-built database (~447GB), and the third for the database under test (270GB). From a system resource perspective, we configured each VM with 16 vCPUs, 60GB of DRAM and leveraged the LSI Logic SAS SCSI controller.
Sysbench Testing Configuration (per VM)
- CentOS 6.3 64-bit
- Percona XtraDB 5.5.30-rel30.1
- Database Tables: 100
- Database Size: 10,000,000
- Database Threads: 32
- RAM Buffer: 24GB
- Test Length: 3 hours
- 2 hours preconditioning 32 threads
- 1 hour 32 threads
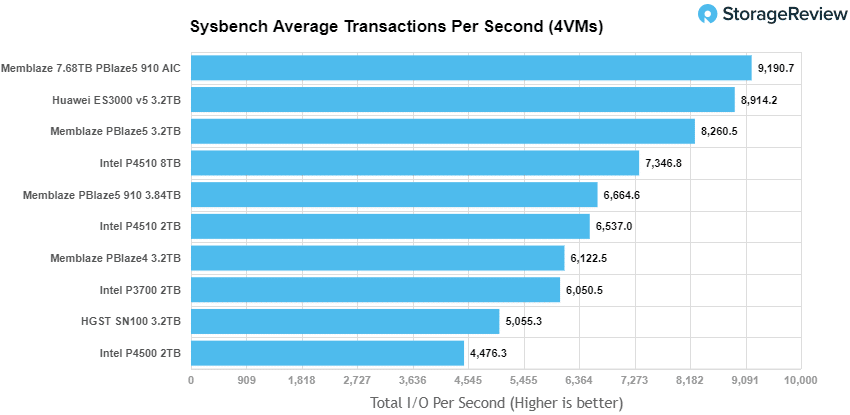
With the Sysbench transactional benchmark, the U.2 910 did better hitting 6,664.6 TPS landing about in the middle of the pack tested.
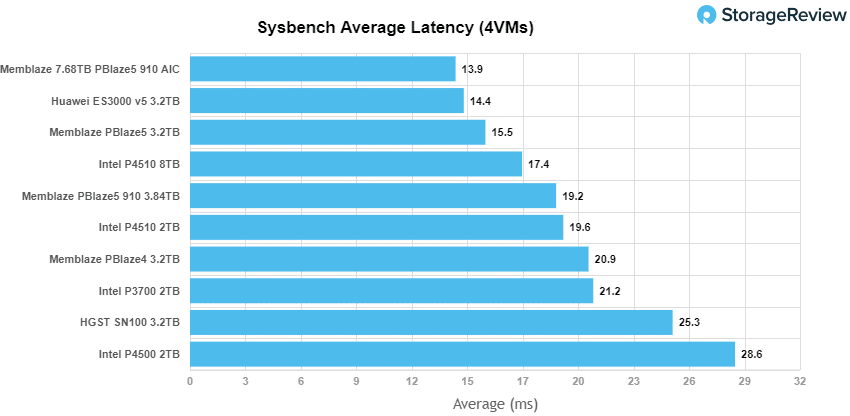
With Sysbench average latency the U.2 910 again found itself in the middle of the pack with a latency of 19.2ms.
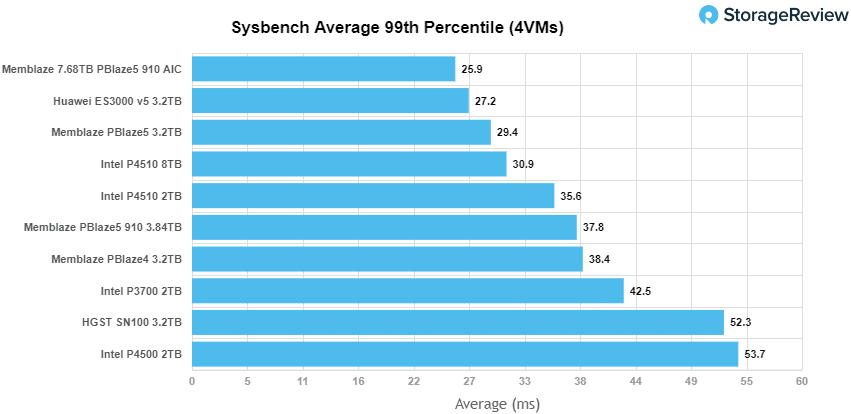
Our worst-case scenario latency benchmark saw the U.2 910 land again near the middle with 37.8ms.
Houdini by SideFX
The Houdini test is specifically designed to evaluate storage performance as it relates to CGI rendering. The test bed for this application is a variant of the core Dell PowerEdge R740xd server type we use in the lab with dual Intel 6130 CPUs and 64GB DRAM. In this case, we installed Ubuntu Desktop (ubuntu-16.04.3-desktop-amd64) running bare metal. Output of the benchmark is measured in seconds to complete, with fewer being better.
The Maelstrom demo represents a section of the rendering pipeline that highlights the performance capabilities of storage by demonstrating its ability to effectively use the swap file as a form of extended memory. The test does not write out the result data or process the points in order to isolate the wall-time effect of the latency impact to the underlying storage component. The test itself is composed of five phases, three of which we run as part of the benchmark, which are as follows:
- Loads packed points from disk. This is the time to read from disk. This is single threaded, which may limit overall throughput.
- Unpacks the points into a single flat array in order to allow them to be processed. If the points do not have dependency on other points, the working set could be adjusted to stay in-core. This step is multi-threaded.
- (Not Run) Process the points.
- Repacks them into bucketed blocks suitable for storing back to disk. This step is multi-threaded.
- (Not Run) Write the bucketed blocks back out to disk.
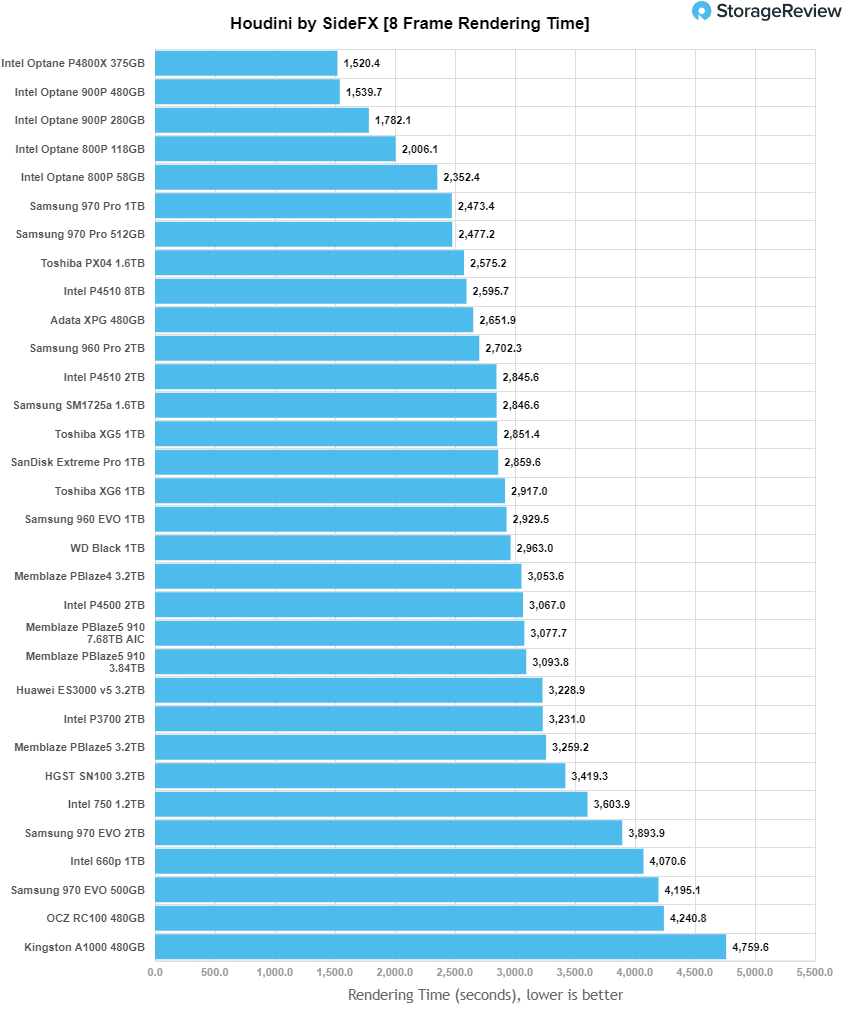
With the Houdini test the 910 U.2 placed middle to lower end, but right in line with other Memblaze products with a score of 3,093.8 seconds.
VDBench Workload Analysis
When it comes to benchmarking storage devices, application testing is best, and synthetic testing comes in second place. While not a perfect representation of actual workloads, synthetic tests do help to baseline storage devices with a repeatability factor that makes it easy to do apples-to-apples comparison between competing solutions. These workloads offer a range of different testing profiles ranging from "four corners" tests, common database transfer size tests, to trace captures from different VDI environments. All of these tests leverage the common vdBench workload generator, with a scripting engine to automate and capture results over a large compute testing cluster. This allows us to repeat the same workloads across a wide range of storage devices, including flash arrays and individual storage devices. Our testing process for these benchmarks fills the entire drive surface with data, then partitions a drive section equal to 25% of the drive capacity to simulate how the drive might respond to application workloads. This is different than full entropy tests which use 100% of the drive and take them into steady state. As a result, these figures will reflect higher-sustained write speeds.
Profiles:
- 4K Random Read: 100% Read, 128 threads, 0-120% iorate
- 4K Random Write: 100% Write, 64 threads, 0-120% iorate
- 64K Sequential Read: 100% Read, 16 threads, 0-120% iorate
- 64K Sequential Write: 100% Write, 8 threads, 0-120% iorate
- Synthetic Database: SQL and Oracle
- VDI Full Clone and Linked Clone Traces
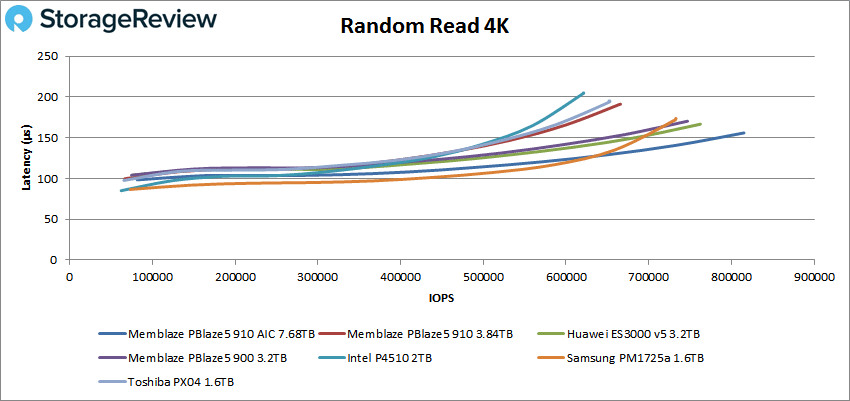
In our first VDBench Workload Analysis, Random 4K Read, the Memblaze PBlaze5 910 U.2 was able to stay under 1ms throughout with a peak of 665,679 IOPS and a latency of 191.3μs placing the drive roughly in the middle.
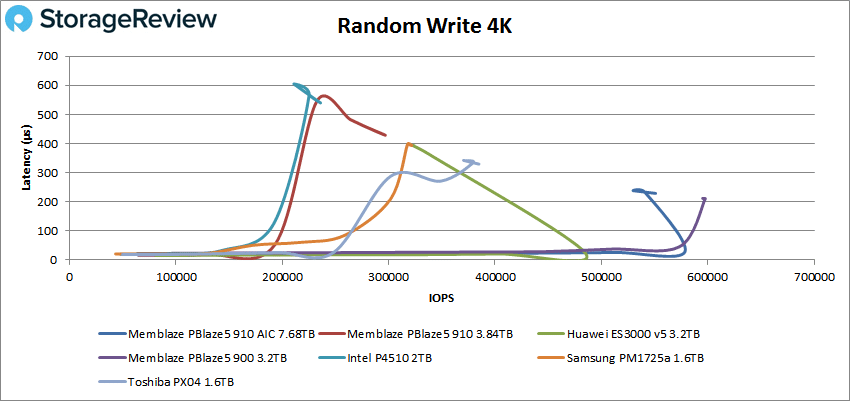
4K random write again saw sub-millisecond latency throughout. The 910 U.2 placed second to last with a peak performance of 296,639 IOPS and a latency of 429.6μs.
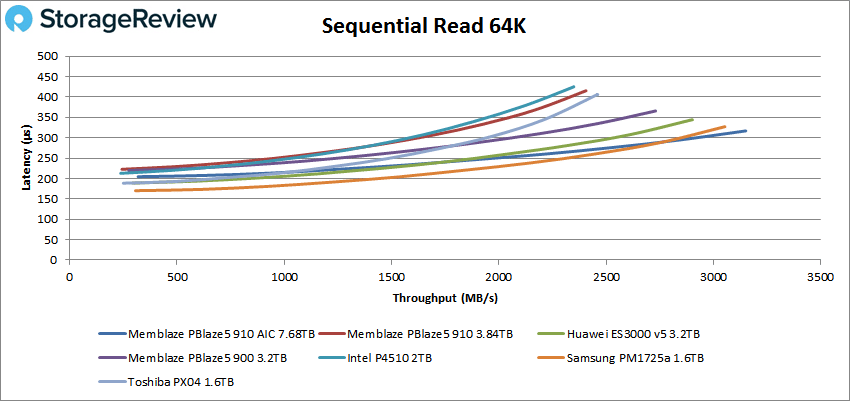
Switching over to sequential workloads, the 910 U.2 once again placed second to last in 64K sequential reads with a peak score of 38,472 IOPS or 2.4GB/s with a latency of 415.3μs.
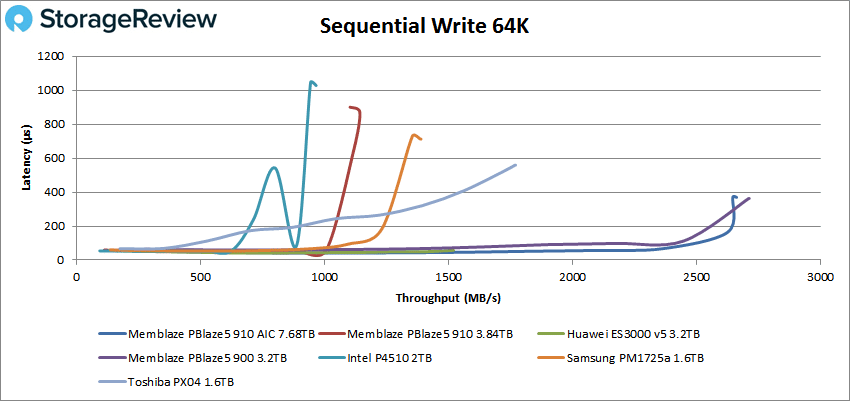
Staying in second to last place, the 910 U.2 peaked with about 18K IOPS or 1.1GB/s at a latency of roughly 870μs in the 64K sequential write.
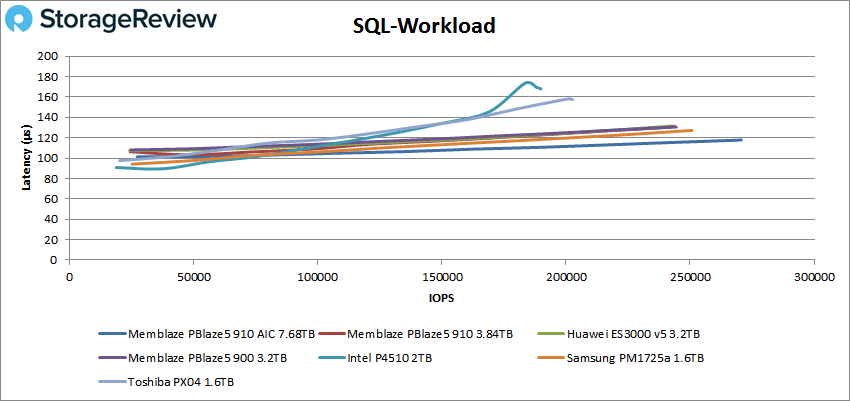
Moving on to SQL workloads the 910 U.2 peaked at 243,228 IOPS with only 130.4μs latency placing the drive fourth overall.
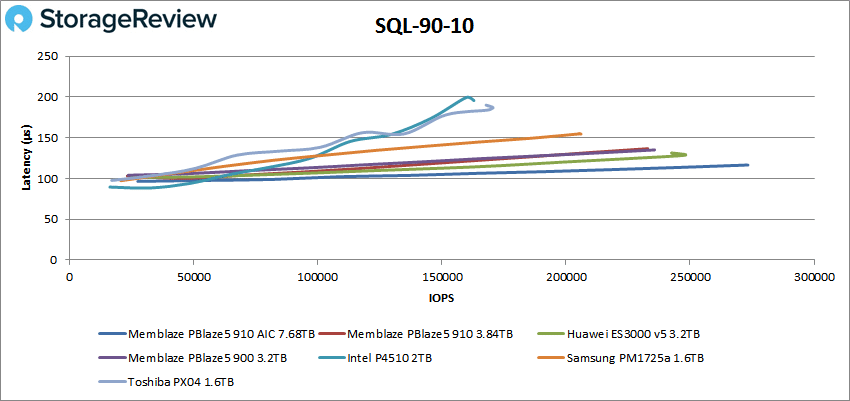
SQL 90-10 saw the 910 retain fourth place with a peak score of 232,061 IOPS and a latency of 136.5μs.
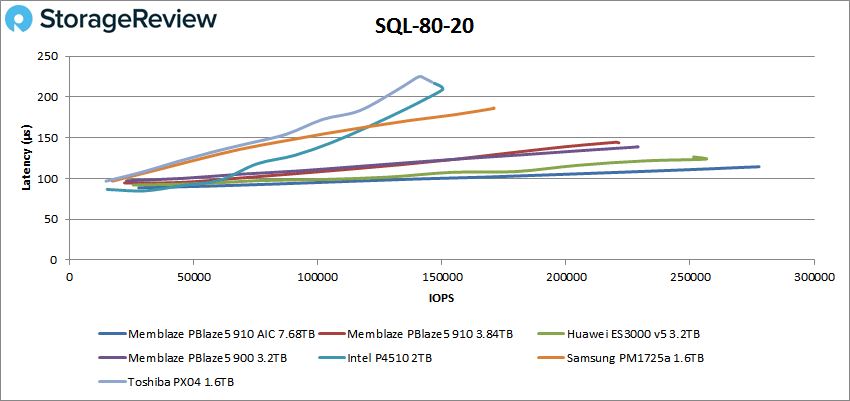
Still in fourth, the 910 U.2 peaked at 220,195 IOPS with a latency of 144.6μs in the SQL 80-20 benchmark.
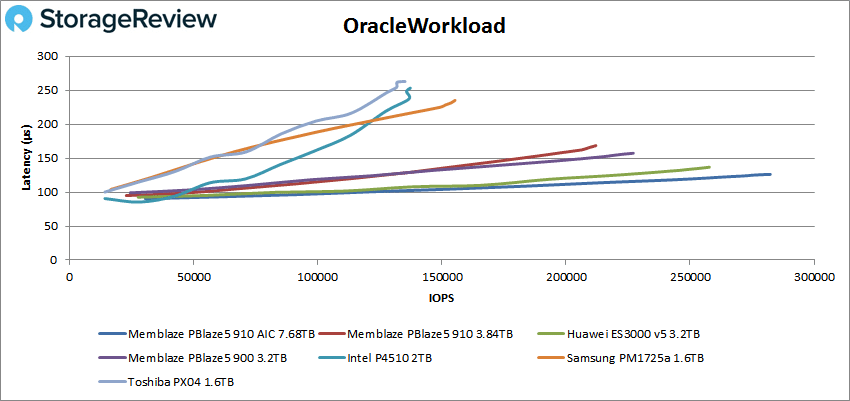
With our Oracle workload the 910 U.2 continued to stay in fourth place with a peak score of 212,052 IOPS and a latency of 168.5μs.
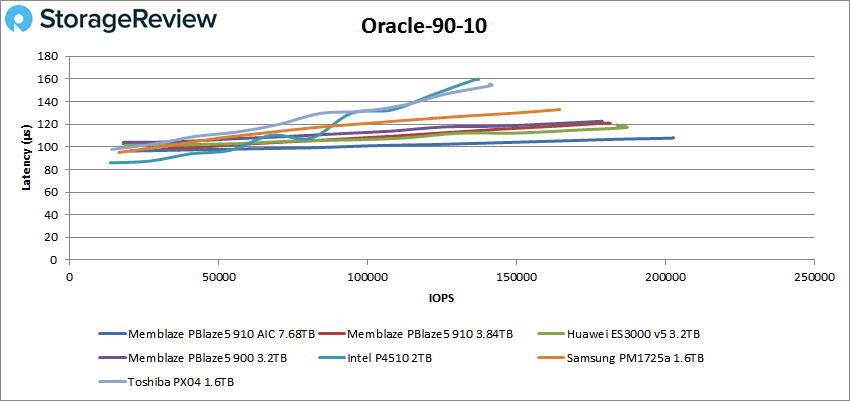
For Oracle 90-10 the 910 U.2 moved into third place with a peak of 180,723 IOPS and a latency of 121.1μs.
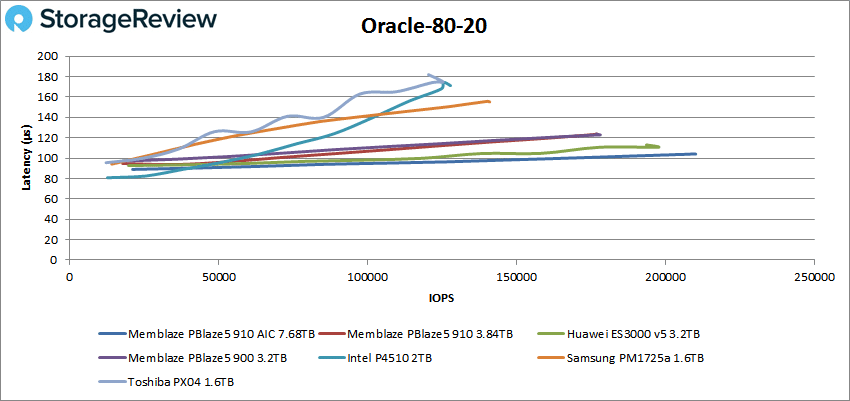
In Oracle 80-20 the 910 nearly tied with the 900 for third with a peak performance of 177,143 IOPS and a latency of 123.5μs.
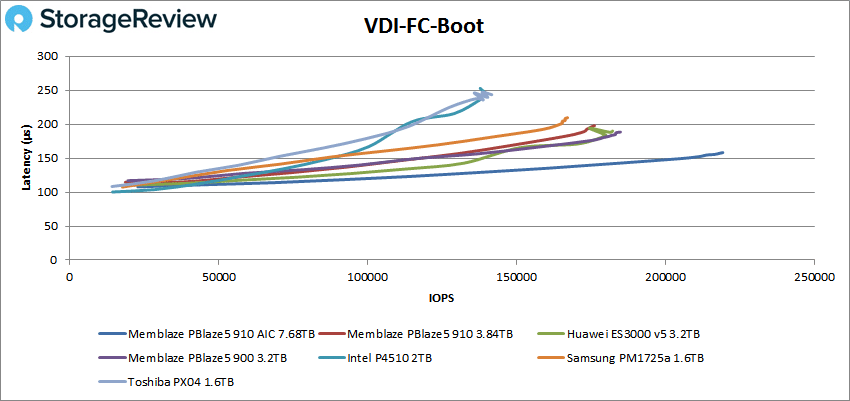
Next, we move on to our VDI clone test, Full and Linked. For VDI Full Clone Boot, the 910 U.2 landed in fourth with a peak performance of 176,239 IOPS and a latency of 197.9μs.
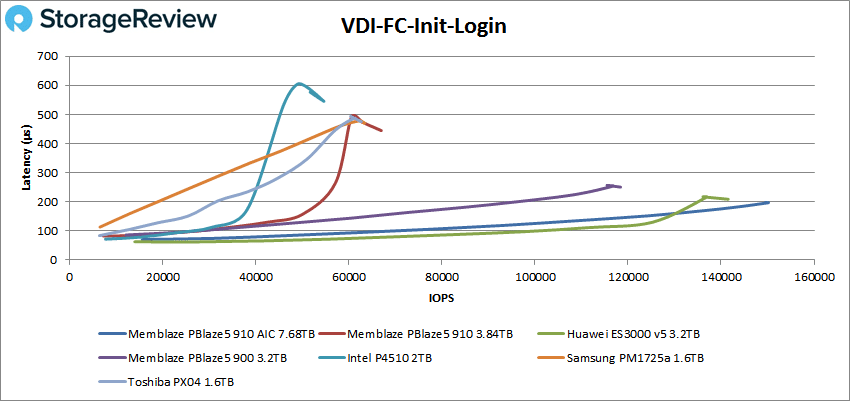
VDI FC Initial Login saw the 910 U.2 in fourth still but farther behind the top three drives with a peak performance of 66,925 IOPS and a latency of 445.1μs.
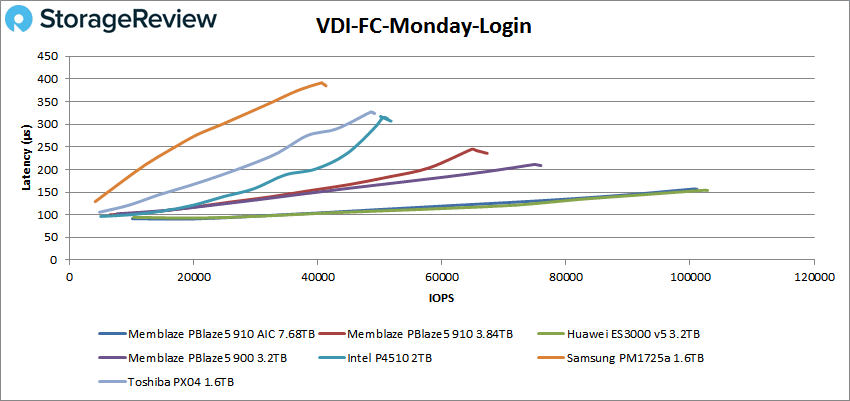
With VDI FC Monday Login the 910 U.2 ended in fourth place with 67,309 IOPS and a latency of 235.7μs.
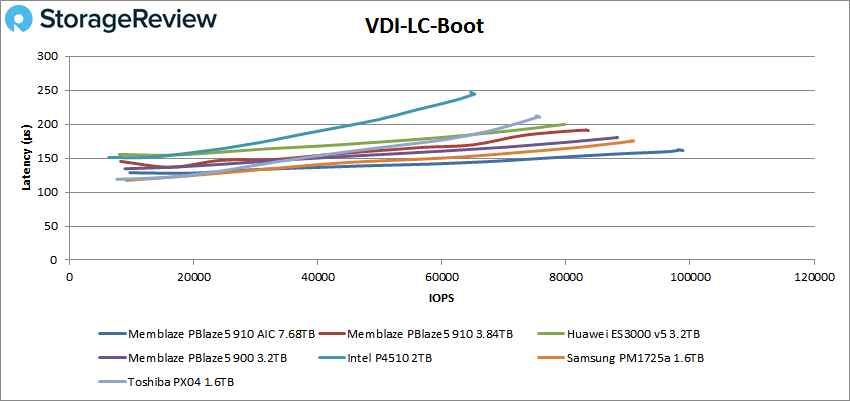
Switching over to Linked Clone (LC) we first look at the boot test. Here, the 910 U.2 came in fourth with 83,210 IOPS and a latency of 191.2μs.
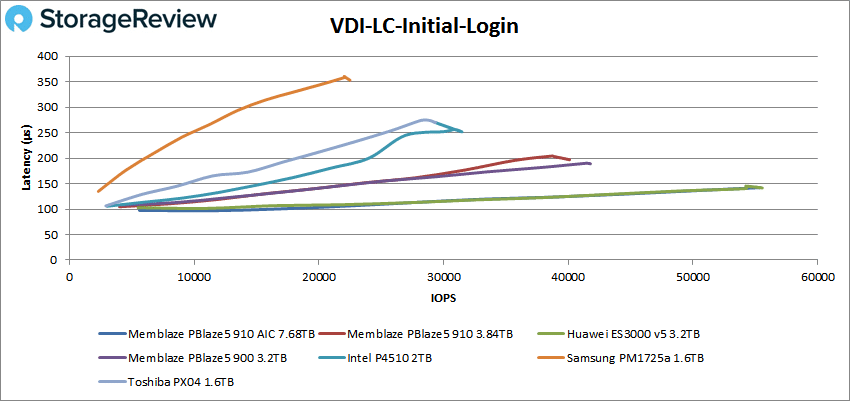
VDI LC Initial Login had the 910 U.2 hold steady in fourth with 40,035 IOPS and a latency of 197.4μs.
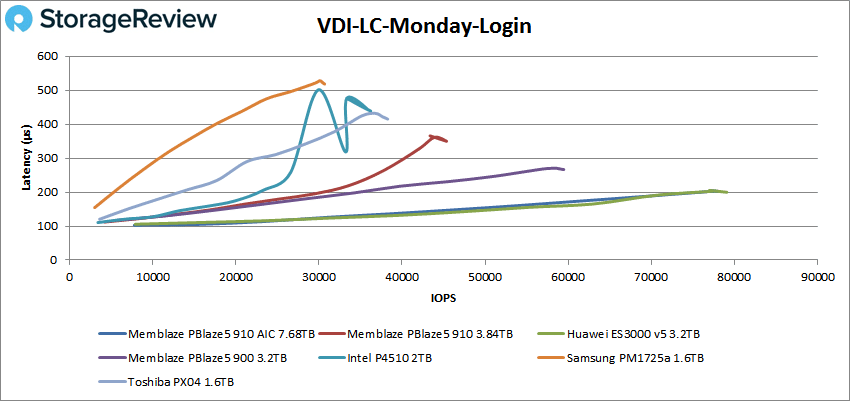
Finally the VDI LC Monday Login had the 910 U.2 peak at 45,349 IOPS and a latency of 349μs for fourth place again.
Conclusion
The Memblaze PBlaze5 910 is the companies new NVMe data center drive that leverage 64-Layer 3D NAND. The drive comes in two form factors (U.2 for this review) and in capacities of 3.84TB, 7.68TB, and 15.36TB. Memblaze claims performance of up to 3.5GB/s read, 3.5GB/s write, and throughput of up to 835K IOPS read and 150K IOPS write. The drive meets the criteria for a plethora of use cases and comes with security options such as AES 256 data encryption and supports TRIM function up to 8TB/s.
Looking at application workload analysis performance, the 910 U.2 came in last place in our SQL Server benchmarks with 12,546.5 TPS and an average latency of 38.8ms. In Sysbench the drive performed a bit better landing in the middle of the pack with 6,664.6 TPS, and average latency of 19.2ms, and a worst case scenario latency of 37.8ms. In our Houdini by SideFX benchmark the 910 U.2 had a score of 3,093.8 seconds putting it in the lower end of the field but in line with other Memblaze products.
For VDBench the Memblaze PBlaze5 910 U.2 had sub-millisecond latency throughout all tests. The drive tended to fall in the middle to mid-bottom of the pack in all tests. Key results include 666K IOPS on 4K read, 297K IOPs on 4K write, 2.4GB/s on 64K read, and 1.1GB/s on 64K write. The SQL results held around a quarter million IOPS with the Oracle tests running between 177K IOPS and 212K IOPS.
Overall it gave good performance, but performance did start to slip compared to the previous generation PBlaze5 900.


 Amazon