

In March of last year, Micron announced a new 2.5" form factor for their P320h application accelerator card. PCIe cards have been the de facto standard for any enterprise looking to drive maximum responsiveness from their storage. The form factor does suffer though from issues that don't bother traditional 2.5" and 3.5" form factors such as hot swapability. It's rarely practical to power down a server and remove it from a rack to service the storage inside. Thus, the 2.5" PCIe form factor enables the speed that the PCIe interface can deliver, with the serviceability that standard drives offer. Of course a new interface means little without server support, and as part of the announcement from Micron, Dell stepped up with server support for the new drives in many of their 12th Gen PowerEdge servers. The Dell servers, like our Dell PowerEdge R720 12G with Express Flash (Dell's branding of 2.5" PCIe), offers up to four 2.5" P320h drives accessible by standard access in the front of the server via a specialized backplane.
As the 2.5" PCIe drives are essentially halved versions of the larger siblings, the capacities are reduced accordingly. Micron and Dell offer the drives in 175GB and 350GB capacities for up to 1.2TB populating all four slots in a PowerEdge 12G server. Interestingly, the performance of the drives isn't cut exactly in half even though they're 4 lanes as opposed to 8 lanes in full size cards. Both capacities offer random read IOPS in the 415,000 range, compared to 785,000 in the full size card, and sequential read throughput is up to 1.75Gb/s, compared to 3.2Gb/s.
Even though servers can gain the performance of PCIe flash in the front of the system, there is a bit of compromise. The backplane takes up the space usually dedicated to the second batch of 8 x 2.5" drive bays commonly found in a 2U server for instance. So in the 2U case, a server can be configured with up to four 2.5" P320h flash drives and up to 8 standard 2.5" drive bays. The other obvious potential concern is that these drives cannot be configured in a hardware RAID due to the interface. They can however be put in software RAID.
For their part, Dell addresses these issues in a few ways. First, trade-offs like drive bay quantity or overall capacity are generally accepted by those deploying this platform as their concern is more about driving a certain level of storage performance to applications while picking up the added benefit of serviceability. For those who have databases that are too large for a single 2.5" P320h to handle and software RAID isn't viable, Dell has released Fluid Cache software, that can enable the 2.5" P320h drive(s) to accelerate higher capacity hard drives in the other bays. It's also worth noting that this particular deployment isn't for everyone; it's still very much an emerging solution that pulls together best of breed hardware to offer something that otherwise doesn't exist in the server market.
In this review our configuration includes a Dell R720 with all four Express Flash slots populated with 350GB 2.5" Micron P320h drives.
Micron P320h 2.5" PCIe Specifications
- Capacities
- 175GB (MTFDGAL175SAH-1N3AB)
- 350GB (MTFDGAL350SAH-1N3AB)
- Micron SLC NAND (34nm)
- Interface: x4 PCIe Gen2
- Connector: SATA/SAS/PCIe combination
- Micron RAIN (redundant array of independent NAND) technology
- Self-Monitoring, Analysis, and Reporting Technology (SMART) command set support
- Performance
- Sequential read/write performance: Up to 1.75/1.1 GB/s
- Random read/write performance: Up to 415,000/145,000 IOPS
- Latency: <50μs
- Power
- Active power consumption: 25W (max)
- Idle/Standby/Sleep power consumption (average): 6.5W
- Operating Temperature: 0C- 70C – temperature throttling support
- Shock and Vibration
- Shock: 400G at 2.0ms
- Vibration: 3.1 Grms, 5–500 Hz, 30 mins per axis
- Uncorrectable Bit Error Rate: <1 sector per 1017 bit read
- MTTF: 2 million device hours
- Endurance – Drive Lifetime: 12.5PB (175GB), 25PB (350GB)
- Dell server support – PowerEdge 12G backplane supports up to four drives
- Dimensions (HxWxL): 15 x 69.85 x 100.5 mm
- Weight: 172g (175GB), 175g (350GB)
Design and Build
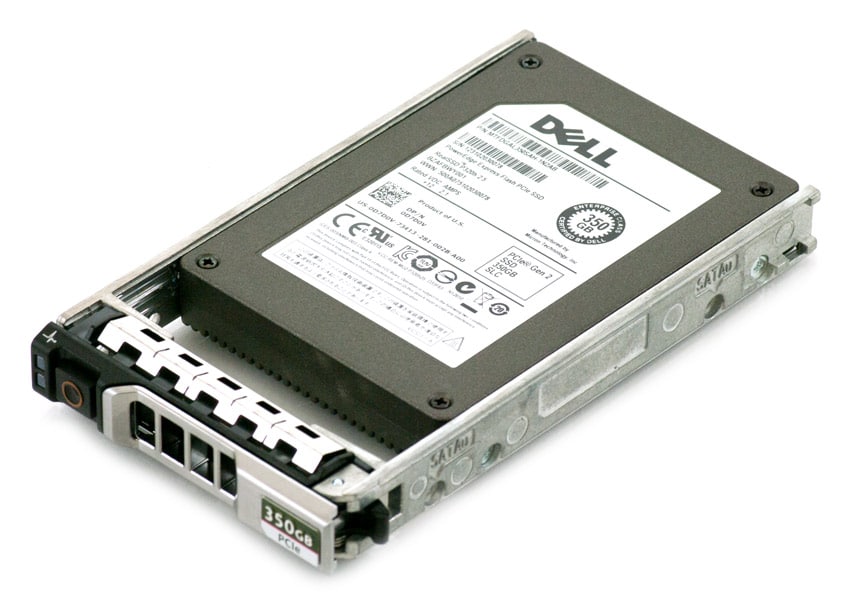
Thinking about Micron's 2.5" P320h, it's essentially as if Micron cut a standard PCIe P320h in half and repackaged it in the 15mm 2.5" form factor. From the surface most people would never notice; even the port looks quite similar to a standard SAS interface. The magic though is in the specialized backplane as we can see in the R720 below.
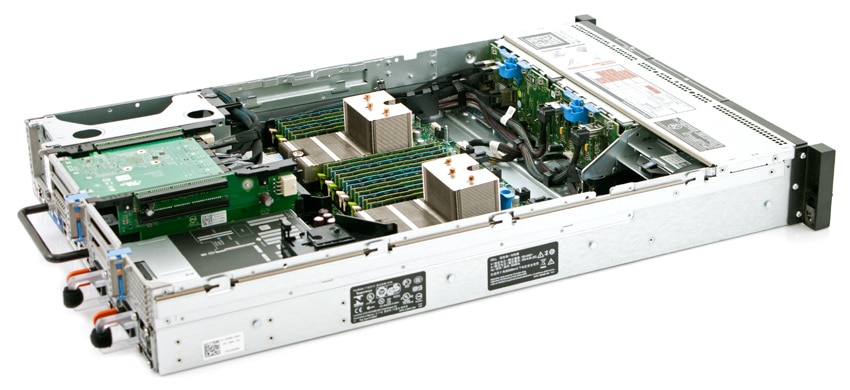
The specialized backplane supports up to four 2.5" P320h drives that are cabled to a PCIe expander card in the back of the server. The layout inside the R720 is clean and easily serviceable. In fact, Dell has confirmed that the backplane, expander card and cabling can all be upgraded as the storage evolves, namely to NVMe. The flexibility of the platform is compelling for early adopters who want to be able to migrate their storage to the latest and greatest.
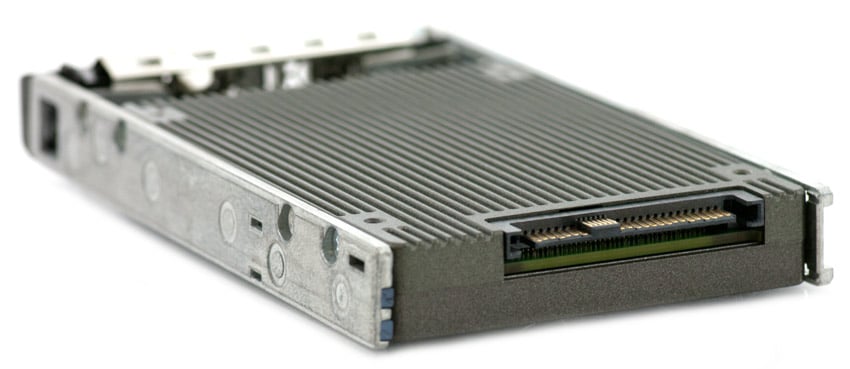
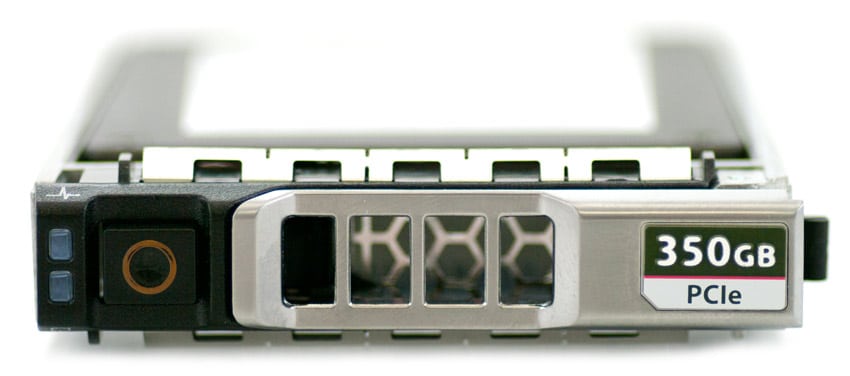
As we examine the individual drives themselves, the case is constructed of solid aluminum and its gray color has a lasting, industrial look. The top cover features a Dell product information label that contains all of the relevant information (capacity, model, etc.). The side profiles show the four screw holes that enable the drive to be mounted in hot-swap drive caddies. Moving to the rear of the unit, there is an Express Bay SFF-8639 connector, which is similar to a SAS or SATA connector, but carries x4 PCIe signal as well.
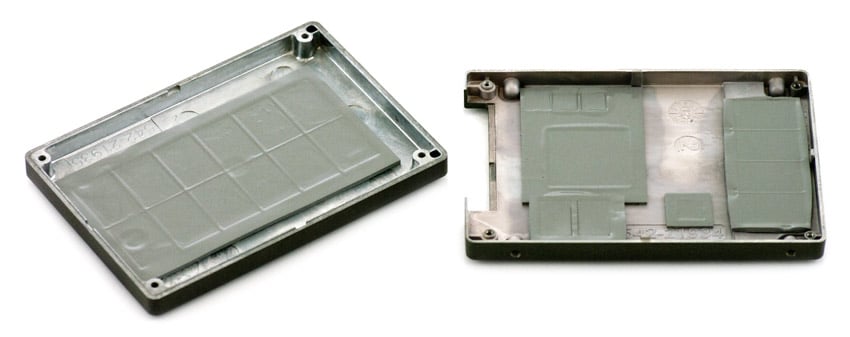
The bottom of the case is ridged to aid in passively cooling the drive, and with the drive disassembled, we can see that the inside of the bottom of the case is lined with several thermal heat pads. These thermal pads pull in the heat which then dissipates through case.
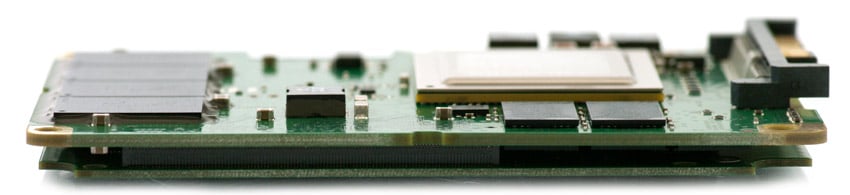
Inside, the 2.5" Micron P320h, there is a custom 16-channel Micron/IDT ASIC controller, similar to the one used in the full-size HHHL Micron P320h but with half the memory channels. Micron also supplies the NAND packages which are spread across two PCBs, totaling 512GB which is over-provisioned to 350GB usable.
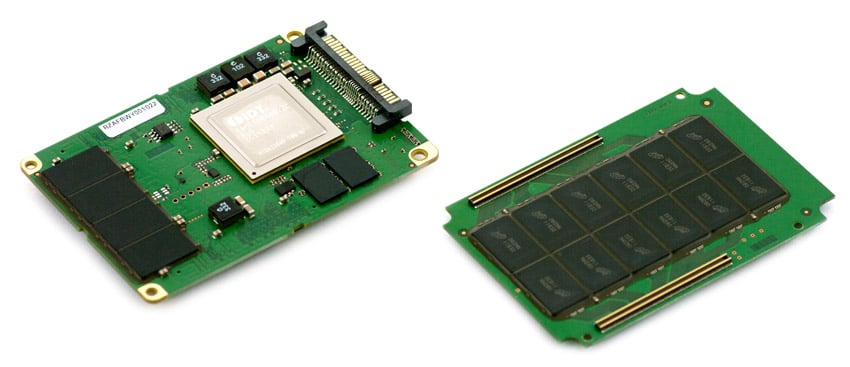
The top PCB includes the connector, controller and DRAM and 8 NAND packages. The bottom PCB has a streamlined layout with 12 NAND packages lining the center on one side and 12 on the other. It also houses two connectors on each side of the PCB to connect both daughter boards.
Testing Background
We used our Dell PowerEdge R720 12G as the testing platform for the 2.5" Micron P320h, as it came equipped with Dell's Express Flash configuration that utilizes the Micron SSD. Our test system was configured with the following hardware:
- 2 x Intel Xeon E5-2640 (2.6GHz, 15MB Cache, 6-cores)
- Intel C602 Chipset
- Memory – 192GB (24 x 8GB) 1333Mhz DDR3 Registered RDIMMs
- CentOS 6.3 64-Bit
- 8 x 300GB Seagate Savvio 15K.3 in RAID10 for boot
Application Performance Analysis
In the enterprise market there is a huge difference between how products perform on paper and how they perform in a production environment. At StorageReview we understand the importance of expanding into Application testing, with our first test being our MarkLogic NoSQL Database Storage Benchmark. While synthetic tests will continue to be an important part of our reviews, we plan on expanding our application tests to cover a wide range of areas, including VDI performance, VM load generation, expanded database performance tests, and many other areas.
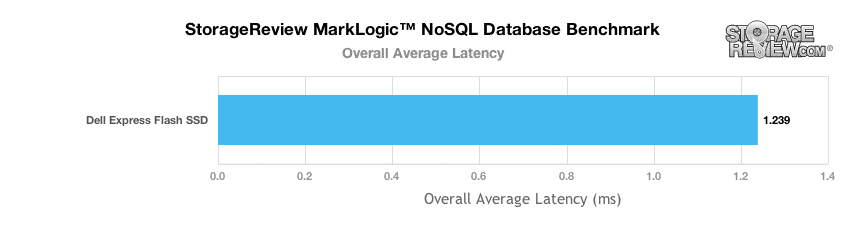
In our MarkLogic NoSQL Database environment, we test groups of four SATA or SAS SSDs, single full-size PCIe solutions with a usable capacity greater than or equal to 200GB. Since our Dell PowerEdge R720 12G came equipped with four Express Flash SSDs, we leveraged all of them in our MarkLogic test, dedicating one per database cluster. Our NoSQL database requires roughly 650GB of free space to work with, evenly divided between four database nodes. In our testing environment, we use an SCST host (which the R720 sat in as) and present each individual SSD in JBOD, with one allocated per database node. The test repeats itself over 24 intervals, requiring between 30-36 hours total for the SSDs in this category. Measuring the internal latencies seen by the MarkLogic software, we record both total average latency, as well as interval latency for each SSD.
The Dell PowerEdge R720 12G is the first server in the compute segment we've run through the MarkLogic NoSQL test that's offered high-performance flash from the factory. It averaged an overall latency of 1.239ms, which was excellent, taking the top spot in our overall ranking.
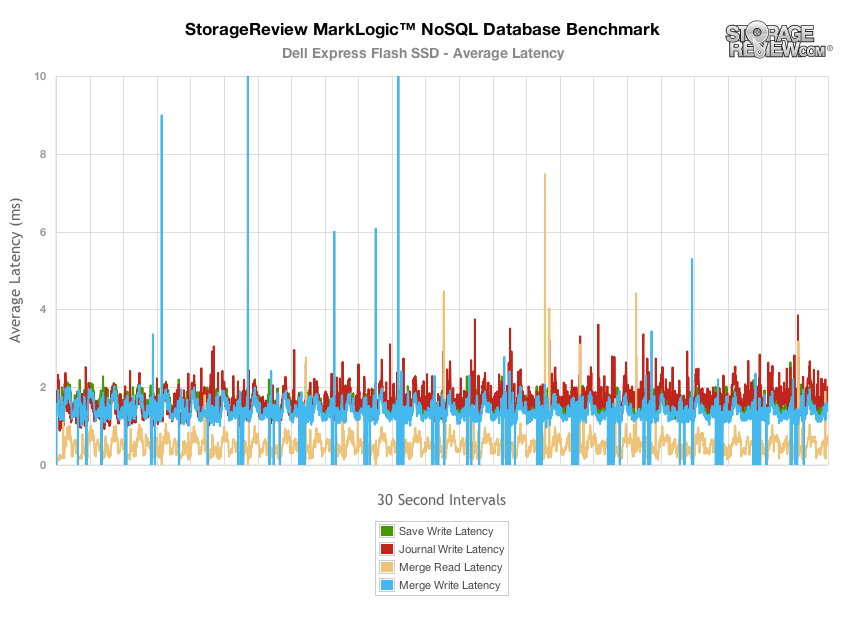
Looking at the overall average latency in each area we measured, we recorded peaks as high as 16ms, with most peaks measuring between 3-11ms.
Enterprise Synthetic Workload Analysis
Flash performance varies throughout the preconditioning phase of each storage device. Our enterprise storage benchmark process begins with an analysis of the way the drive performs during a thorough preconditioning phase. Each of the comparable drives are secure erased using the vendor's tools, preconditioned into steady-state with the same workload the device will be tested with under a heavy load of 16 threads with an outstanding queue of 16 per thread, and then tested in set intervals in multiple thread/queue depth profiles to show performance under light and heavy usage.
Preconditioning and Primary Steady-State Tests:
- Throughput (Read+Write IOPS Aggregate)
- Average Latency (Read+Write Latency Averaged Together)
- Max Latency (Peak Read or Write Latency)
- Latency Standard Deviation (Read+Write Standard Deviation Averaged Together)
Our Enterprise Synthetic Workload Analysis includes four profiles based on real-world tasks. These profiles have been developed to make it easier to compare to our past benchmarks as well as widely-published values such as max 4K read and write speed and 8K 70/30, which is commonly used for enterprise drives. We also included two legacy mixed workloads, the traditional File Server and Webserver, each offering a wide mix of transfer sizes.
- 4k
- 100% Read or 100% Write
- 100% 4k
- 8k 70/30
- 70% Read, 30% Write
- 100% 8k
- 128k (Sequential)
- 100% Read or 100% Write
- 100% 128k
- File Server
- 80% Read, 20% Write
- 10% 512b, 5% 1k, 5% 2k, 60% 4k, 2% 8k, 4% 16k, 4% 32k, 10% 64k
- Webserver
- 100% Read
- 22% 512b, 15% 1k, 8% 2k, 23% 4k, 15% 8k, 2% 16k, 6% 32k, 7% 64k, 1% 128k, 1% 512k
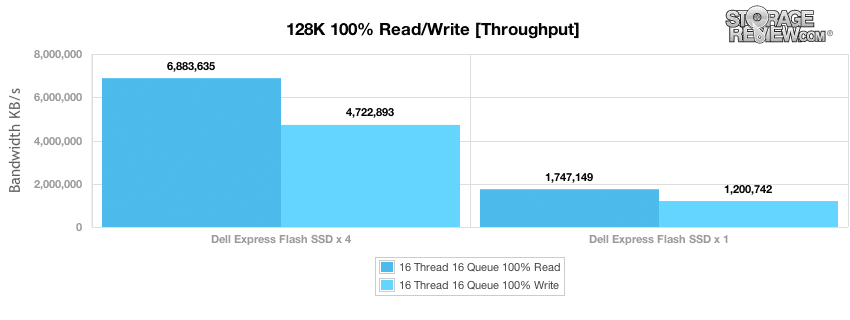
Our first test is the 128k test which is a large block sequential test that shows the highest sequential transfer speed. Taking a look at 128k performance for both 100% write and 100% read activity, the Micron P320h x 4 achieved 6.88 GB/s read and 4.7GB/s write.
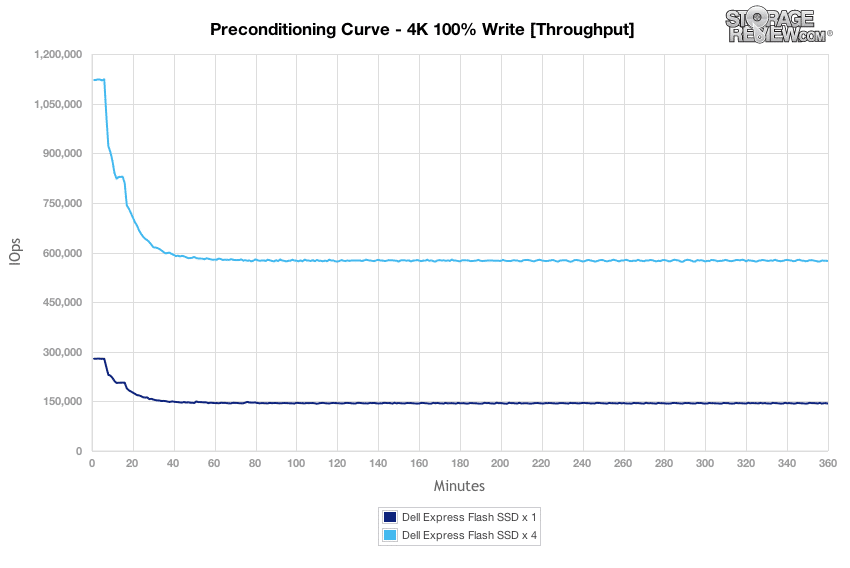
In our next enterprise workload, we look at a fully random 4k write preconditioning profile with an outstanding workload of 16T/16Q. The Micron P320h x 4 measured a burst speed of 1.1 million IOPS which leveled off just under 600,000 IOPS. The single P320h measured nearly the same speeds at scale.
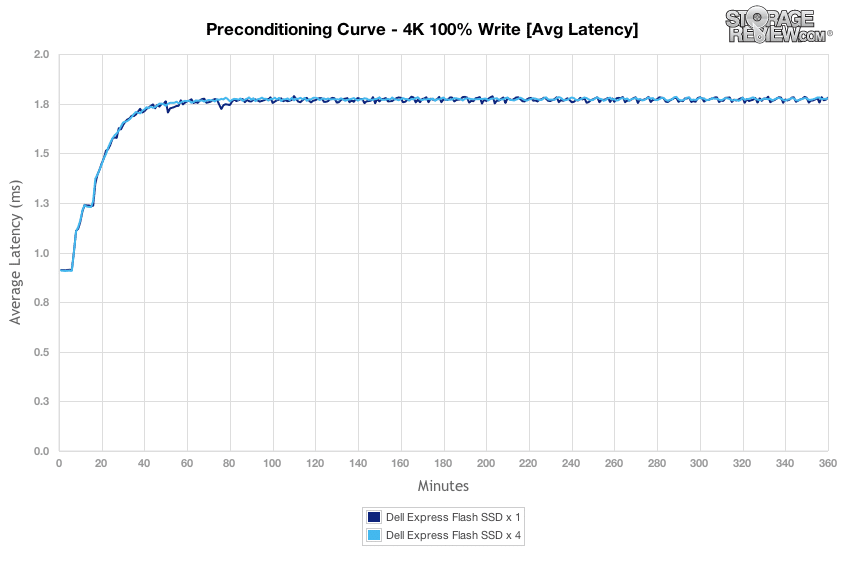
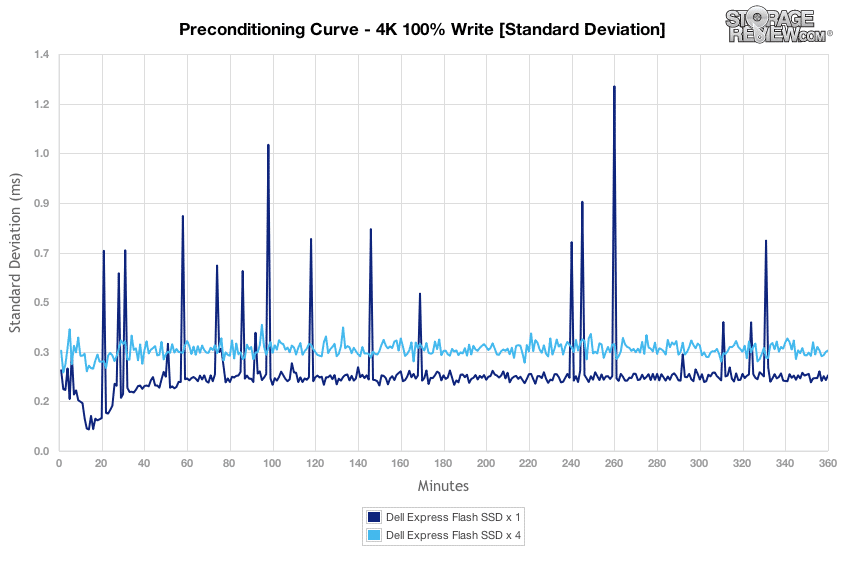
In our preconditioning 4k random write 16T/16Q workload, the Micron P320h ranged from 0.9-1.7ms in burst to 1.8ms in steady-state.
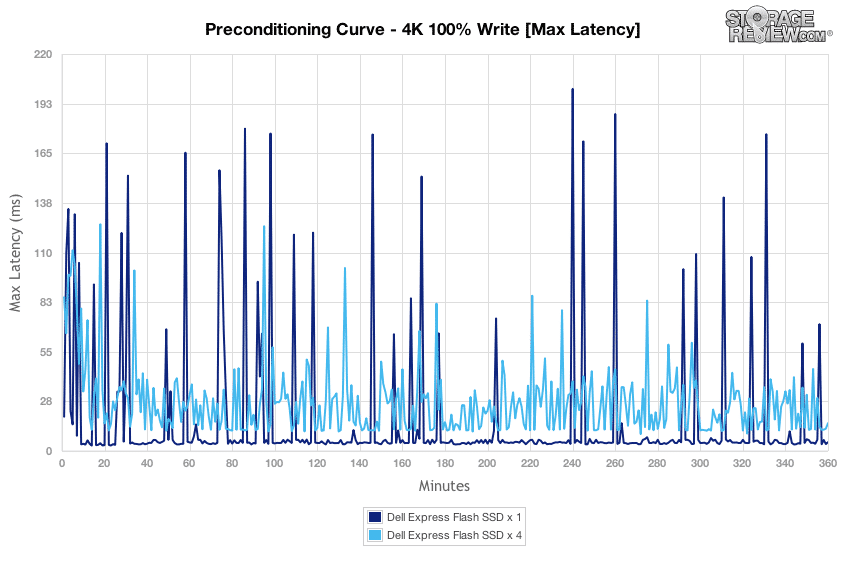
Looking at max latency in our 4k preconditioning workload, the Micron P320h had peak response times starting at 70-175ms in burst which increased to 60-200ms as it neared steady-state.
Comparing latency standard deviation, the Micron P320h x 1 scaled to lower peaks than the Micron P320h x 4, but even the highest peak was only around 1.3ms.
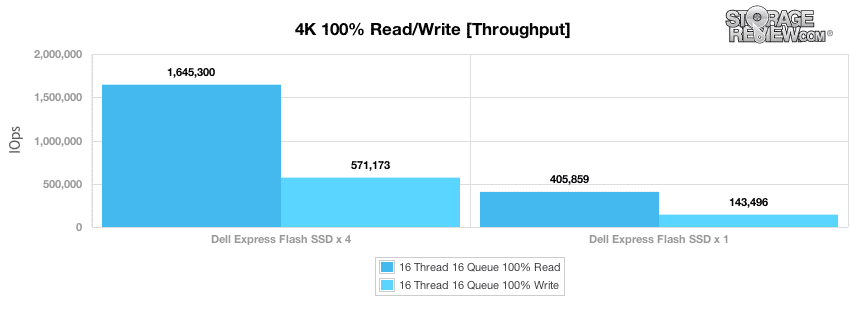
After our 6-hour preconditioning period ended on the Micron P320h x 4, its steady-state random read 4k performance measured a peak of nearly 1.65 million IOPS with a write speed of 571,173 IOPS. The Micron P320h x 1 shows near-identical performance at scale.
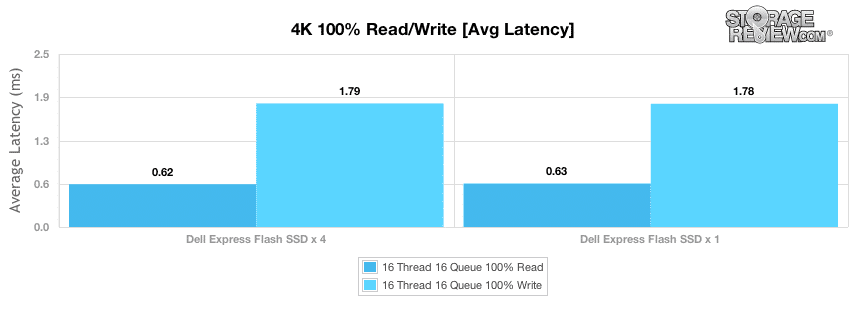
Comparing average latency with a heavy 16T/16Q workload with 100% 4k random read activity, the Micron P320h x 4 measured 0.62ms in read activity and 1.79ms in write activity – almost the same as the Micron P320h x 1.
When comparing max latency in our 4k steady-state test, the Micron P320h x 4 had a peak read latency of 115.9ms and a peak write latency of 27.3ms. The Micron P320h x 1 performed better with a peak read latency of 45.4ms and a peak write latency of 6.2ms.
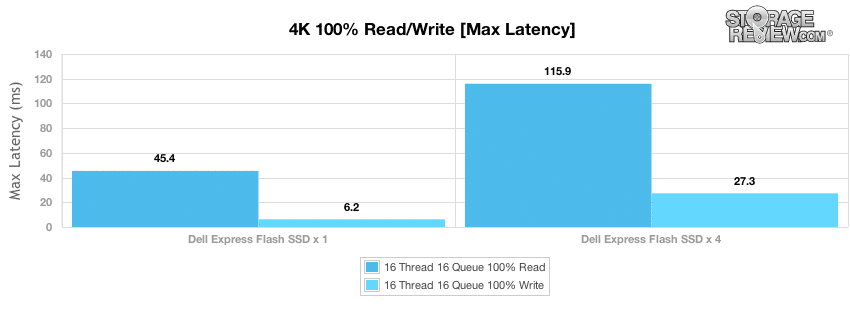
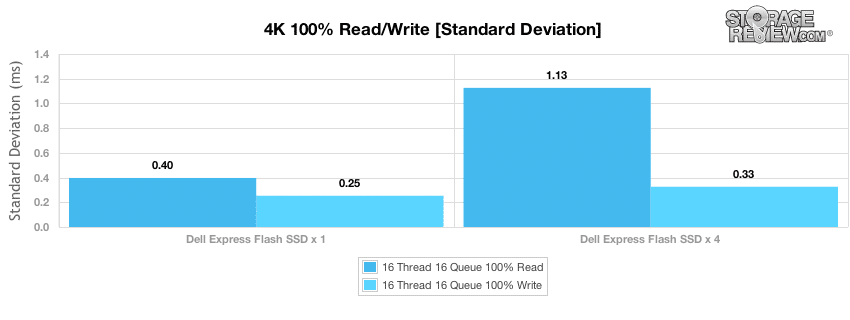
Looking at latency standard deviation the Micron P320h x 1 delivered a bit more latency consistency is both read and write activity.
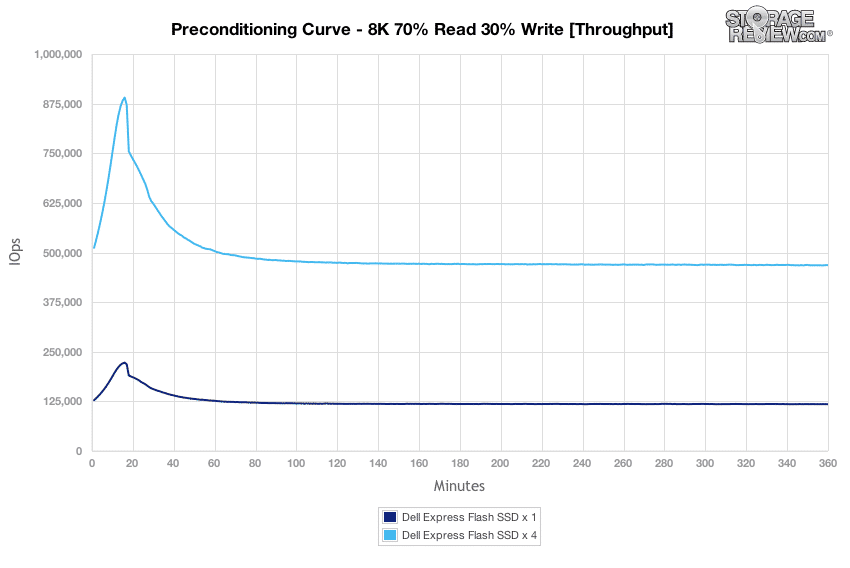
Our next test switches to an 8K 70/30 mixed workload where the Micron P320h x 4 had burst speeds measuring up to 900,000 IOPS before leveling off to around 480,000 IOPS in steady-state. Again, the Micron P320h x 1 matched performance at scale.
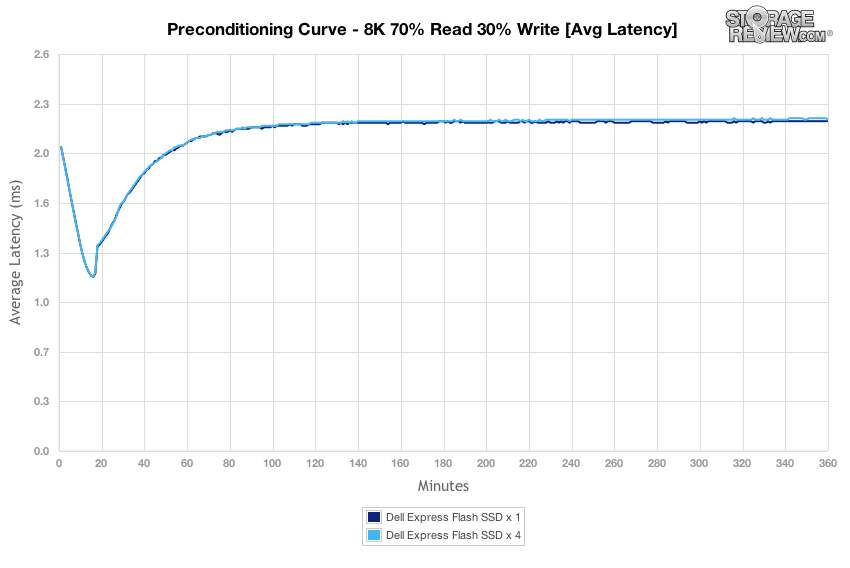
Comparing average latency in our 8k 70/30 preconditioning 16T/16Q workload, the Micron P320h x 1 and x 4 offered burst latency between 2.0-1.2ms which increased to 2.2ms near steady-state.
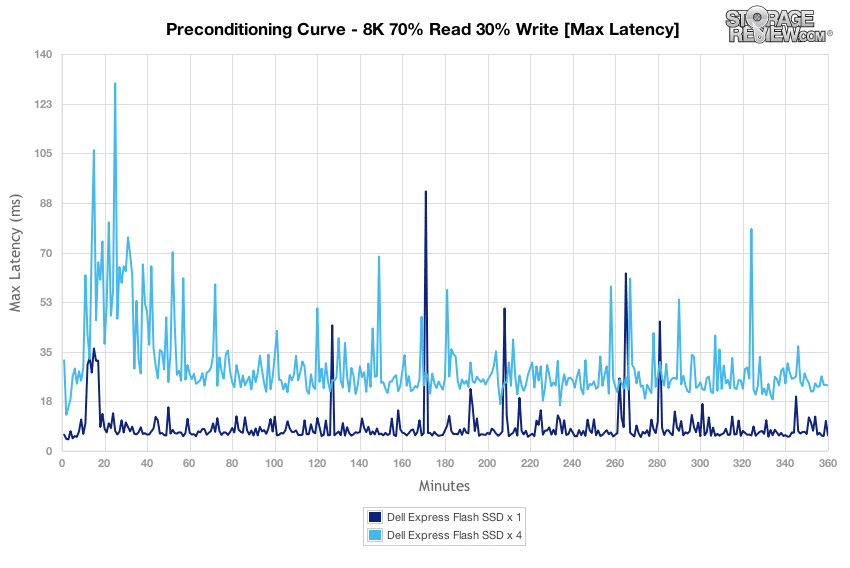
With a 8k 70/30 workload, peak latency from the Micron P320h x 4 ranged from 25-130ms during burst to 40-80ms as it neared steady-state.
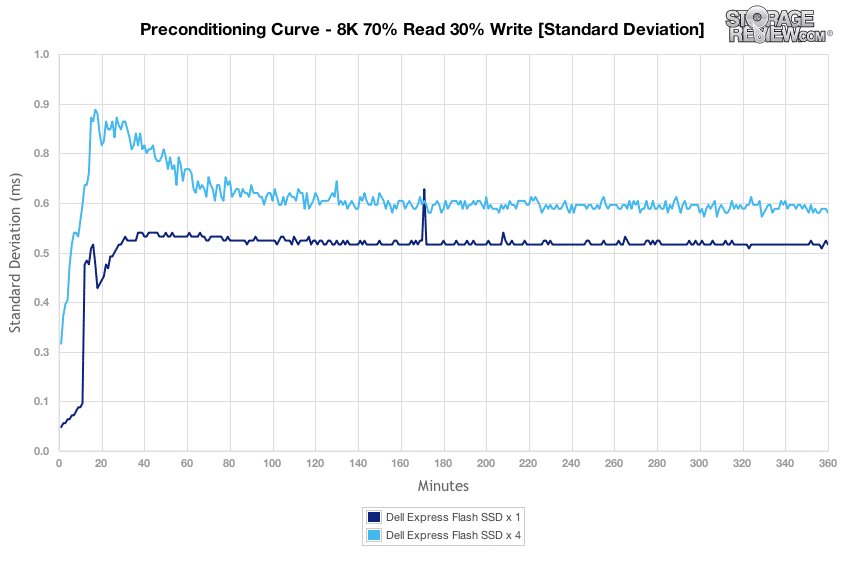
Comparing latency consistency in our 8k 70/30 preconditioning workload, the Micron P320h x 4 had slightly higher standard deviation than the Micron P320h x 1.
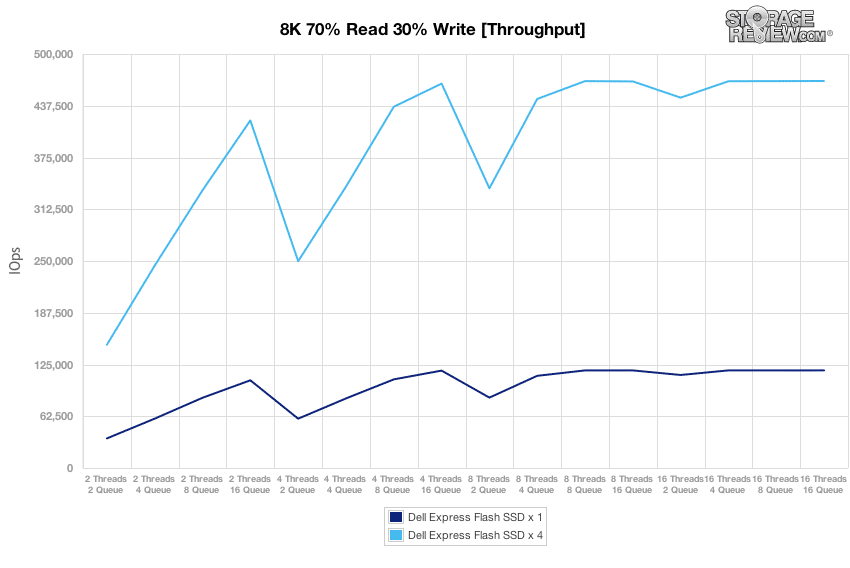
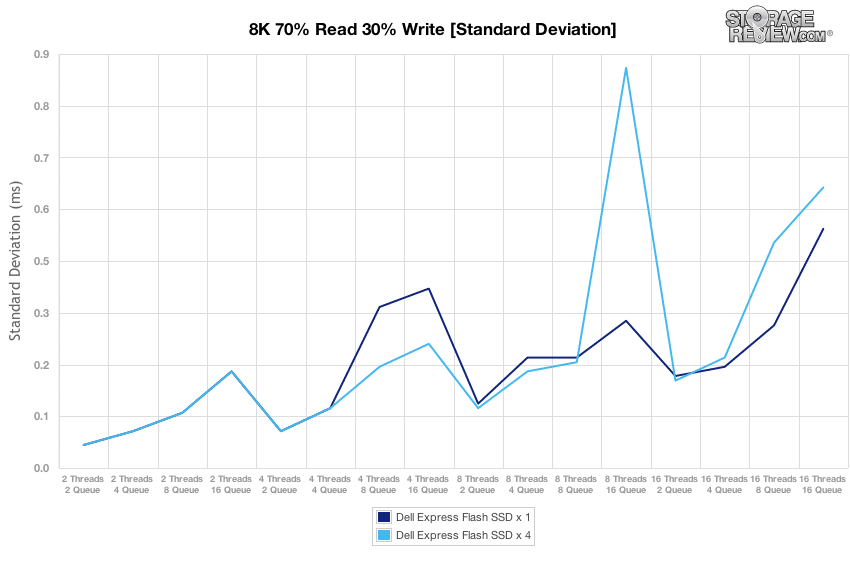
Compared to the fixed 16 thread, 16 queue max workload we performed in the 100% 4K write test, our mixed workload profiles scale the performance across a wide range of thread/queue combinations. In these tests we span our workload intensity from 2 threads and 2 queue up to 16 threads and 16 queue. In our expanded 8K 70/30 test, the Micron P320h x 4 scaled from 150,000-450,000 IOPS with higher IOPS starting at 2T/16Q. The Micron P320h x 1 scaled similarly at scale.
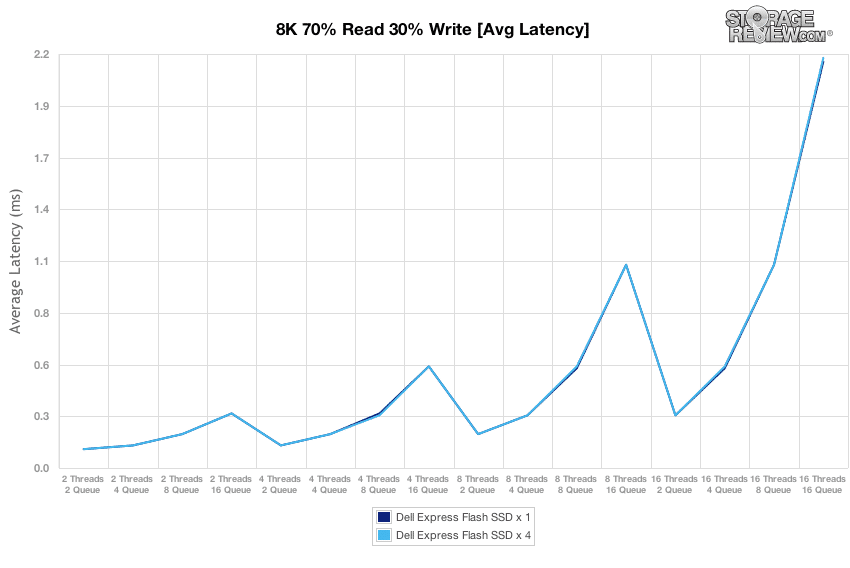
In the scaled average latency segment of our 8k 70/30 test, the Micron P320h scaled from 0.15ms at 2T/2Q and increased to 1.9-2.2ms at 16T/16Q.
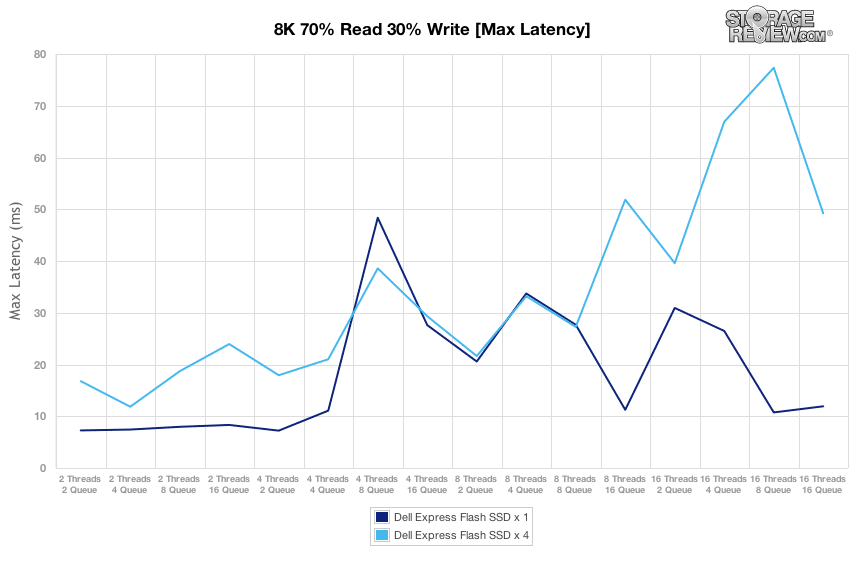
Max latency in our 8k 70/30 main test measured higher on the Micron P320h x 4 beginning at 8T16Q, with an overall range of 12-78ms in peak response times.
Latency consistency of the Micron P320h x 4 and Micron P320h x 1 were similar aside from a spike that reached only up to 0.87ms for the Micron P320h x 4.
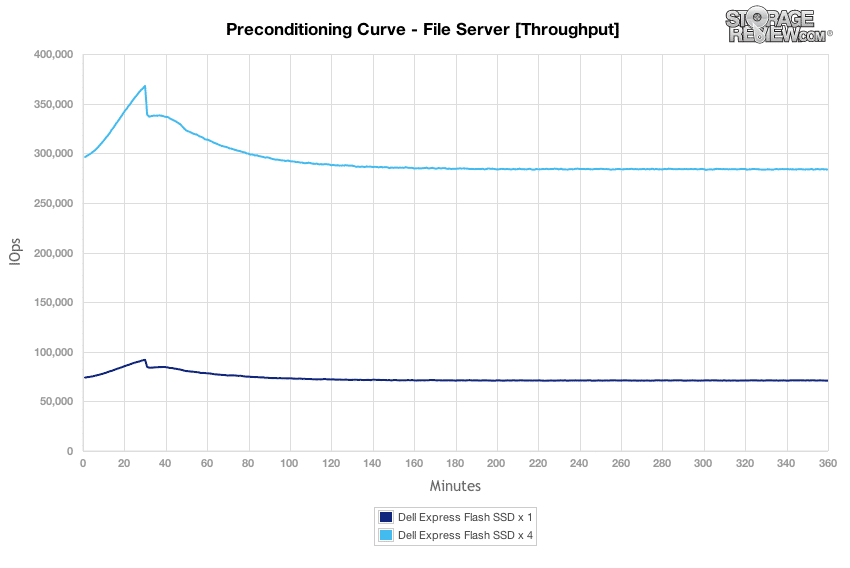
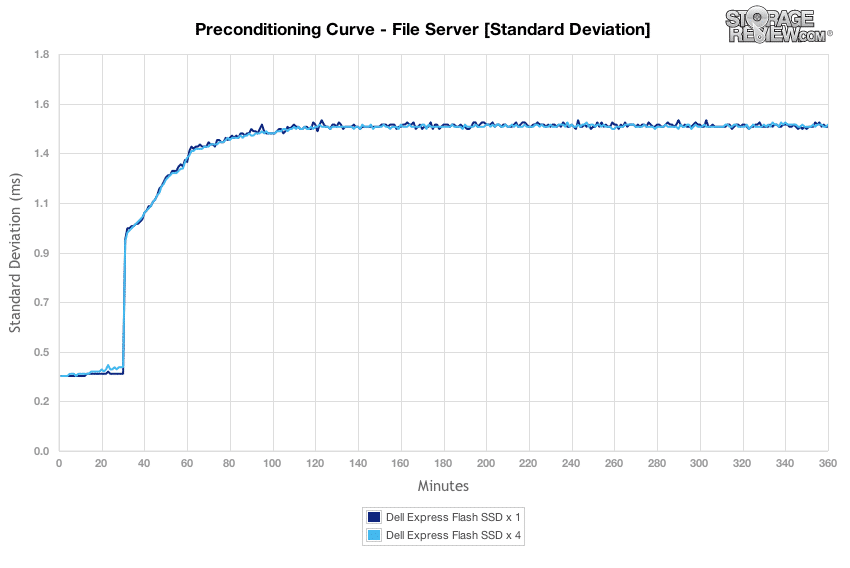
The File Server workload represents a larger transfer-size spectrum hitting each particular device, so instead of settling in for a static 4k or 8k workload, the drive must cope with requests ranging from 512b to 64k. In this workload, the Micron P320h x 4 offered a burst speed of 300-365,000 IOPS, and as it neared steady state it clocked-in at about 280,000 IOPS.
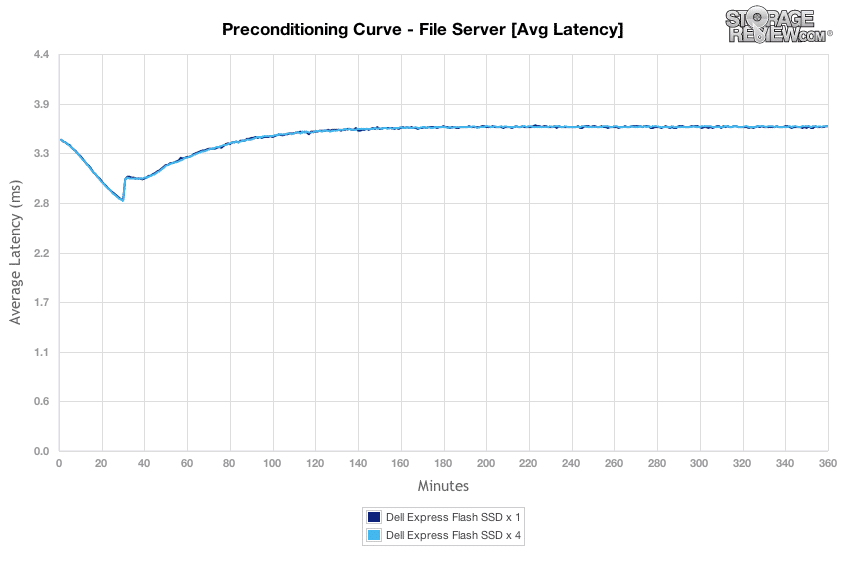
At a low workload in our File Server preconditioning test, average latency measured 2.8-3.3ms which increased slightly over the test to 3.6ms.
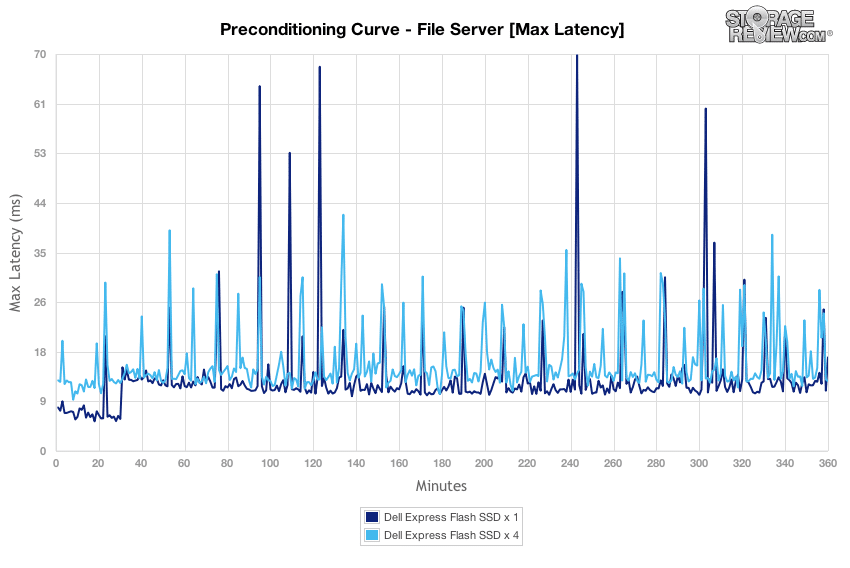
During the preconditioning stage of our File Server test, peak response times from the Micron P320h x 4 ranged from 7-35ms in burst mode and increased to 12-70ms as it neared steady-state.
Evaluating latency consistency, in burst mode the Micron P320h x 4 and Micron P320h x 1 had near-identical latency standard deviation.
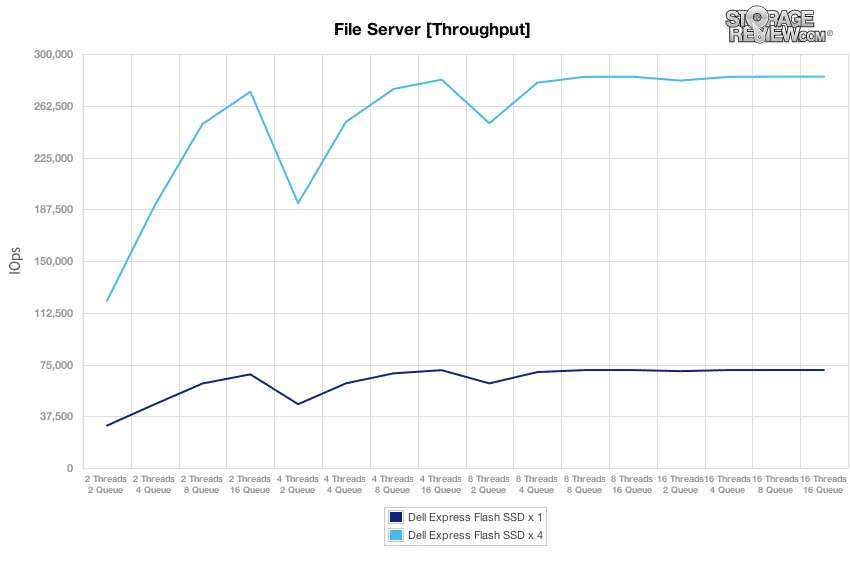
After the File Server preconditioning process had completed with a constant 16T/16Q load, we dropped into our main tests which measure performance at set levels between 2T/2Q and 16T/16Q. In our main File Server workload, the Micron P320h x 4 ranged from around 115,000 IOPS at 2T/2Q to 280,000 IOPS at 16T/16Q. The Micron P320h x 1 had similar marks at scale.
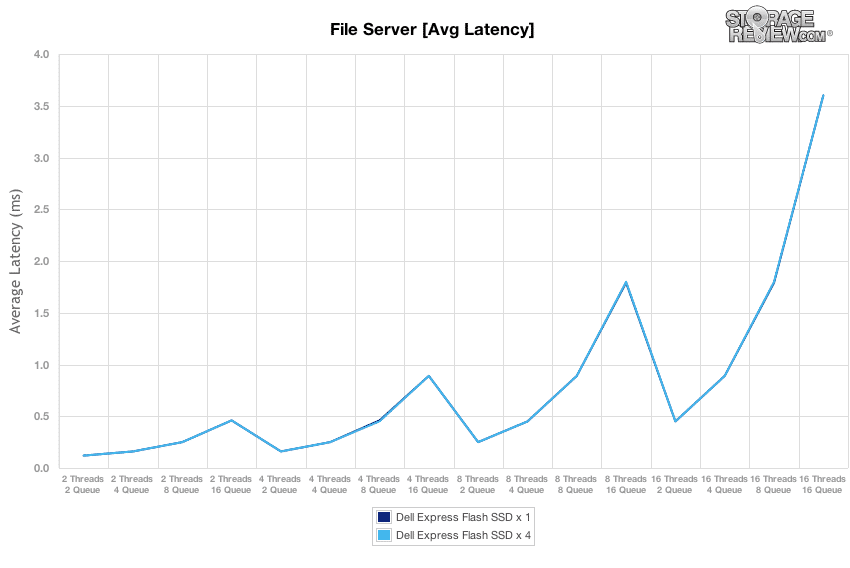
Average latency from the Micron P320h x 4 ranged from 0.52-0.53 at 2T/2Q to 2.75-3.60ms at 16T/16Q.
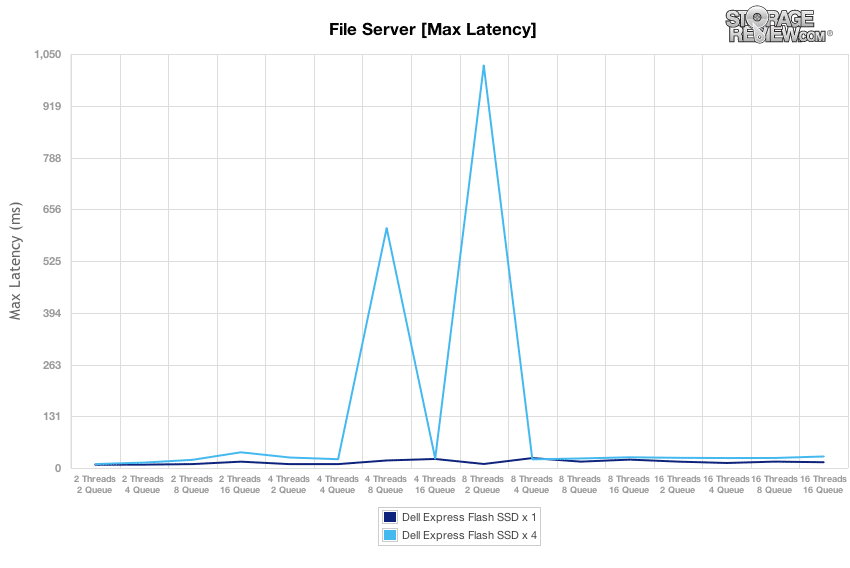
Comparing max latency, the Micron P320h x 4 had a couple of peaks that kept its performance from matching the Micron P320h x 1 with a peak time of 990ms.
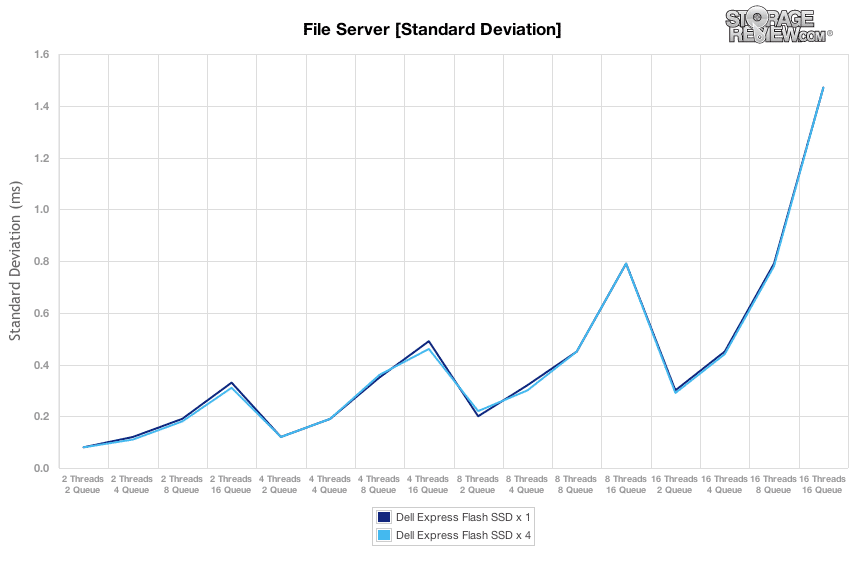
Moving from peak latency to latency standard deviation, the Micron P320h x 4 and the Micron P320h x 1 performed almost identically.
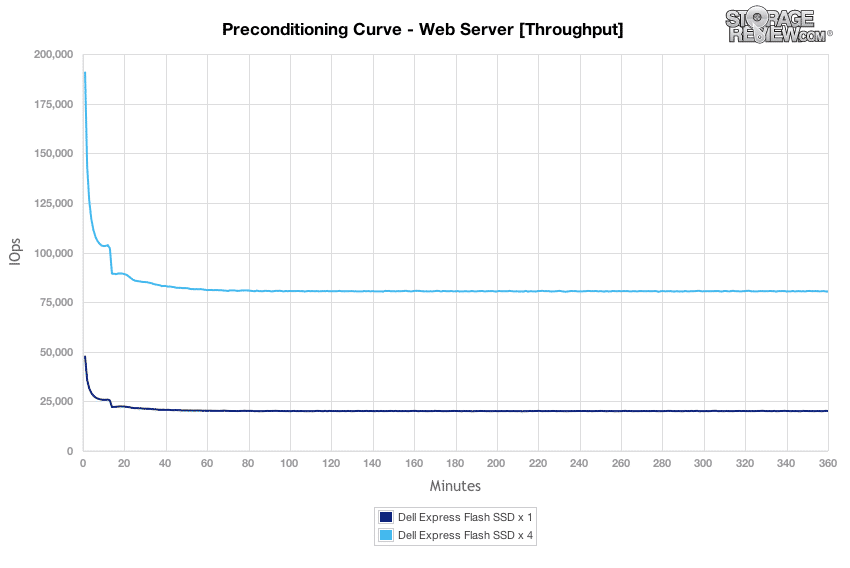
In our last synthetic workload covering a Web Server profile, which is traditionally a 100% read test, we apply 100% write activity to fully precondition each drive before our main tests. Under this stressful preconditioning test, the Micron P320h x 4 had burst speeds measuring between 110,000-190,000 IOPS, although as it neared steady-state performance the figures were around 77,000-80,000 IOPS.
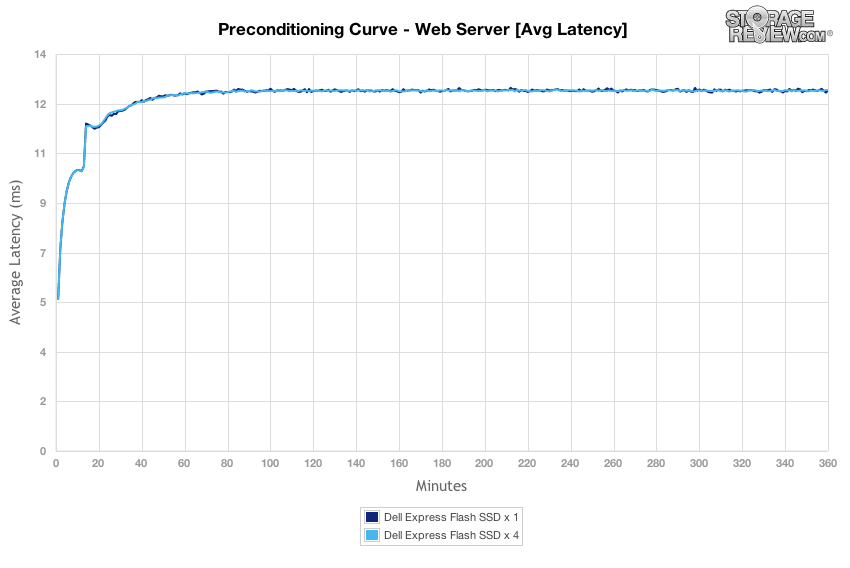
Average latency in our stressful Web Server preconditioning test started at 5-10ms in burst which increased to 12.5ms as the Micron P320h neared steady-state.
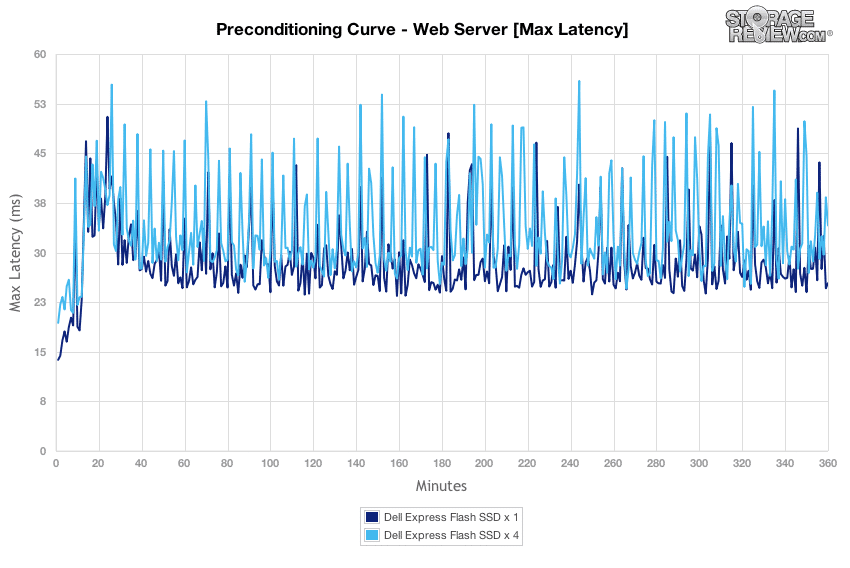
As the Micron P320h x 4 neared steady-state, its peak response times ranged between 40-55ms.
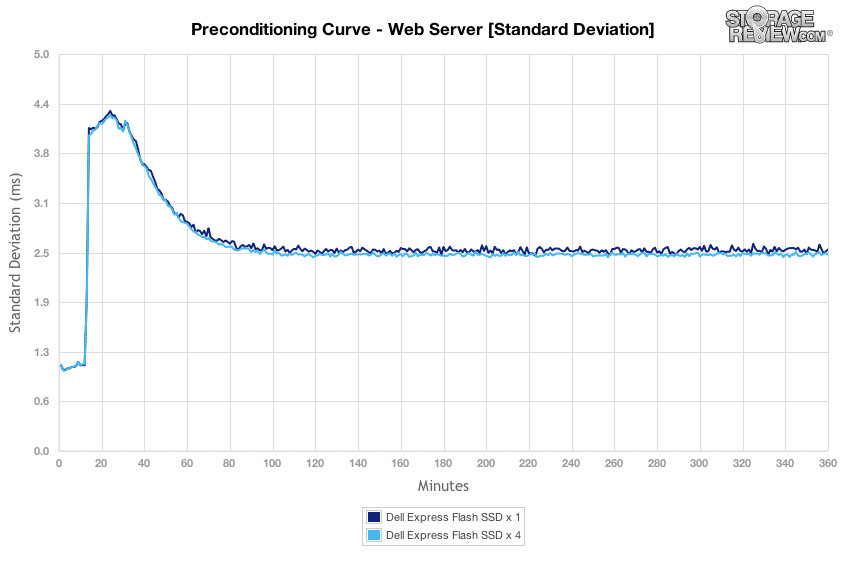
Latency consistency of the Micron P320h scaled lower as the drive neared steady-state conditions by sticking right around 2.5ms.
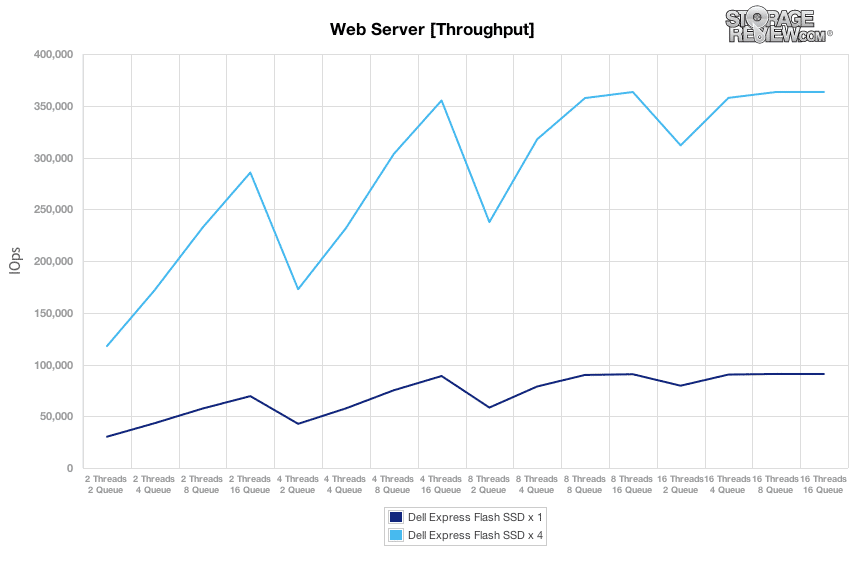
Switching to the main segment of our Web Server test with a 100% read profile, the Micron P320h x 4 had performance scaling from 125,000-365,000 IOPS. Compared to the Micron P320h x 1, these figures matched at scale.
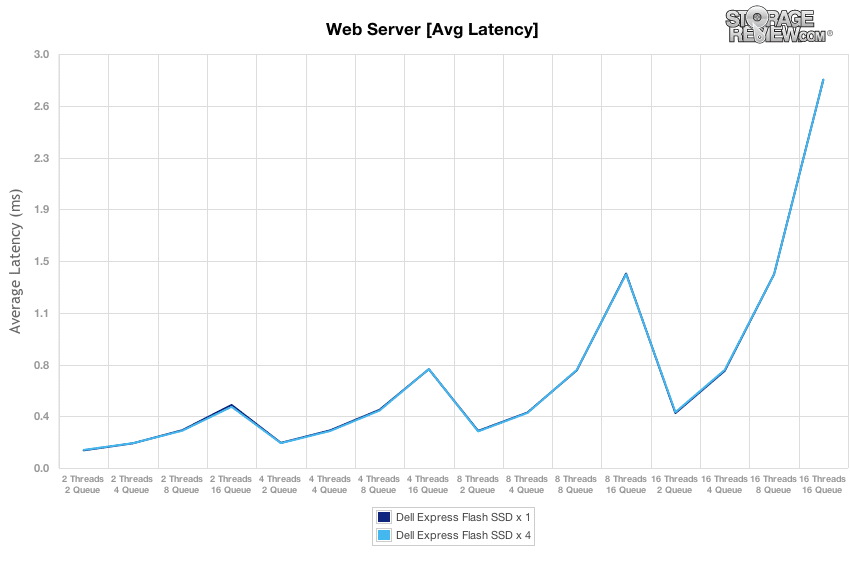
In our read-heavy Web Server main test, the Micron P320h offered an average latency scaling from 0.2ms at 2T/2Q up to 2.2-2.8ms at 16T/16Q.
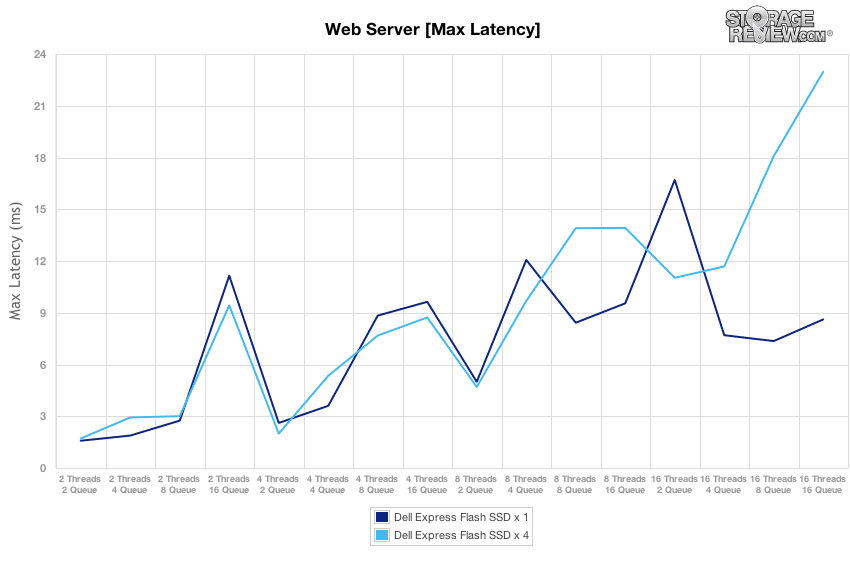
The Micron P320h x 4 scaled higher in peak response times starting at 16T4Q compared to the Micron P320h. Max latency measured between 2-23ms over the course of the workload.
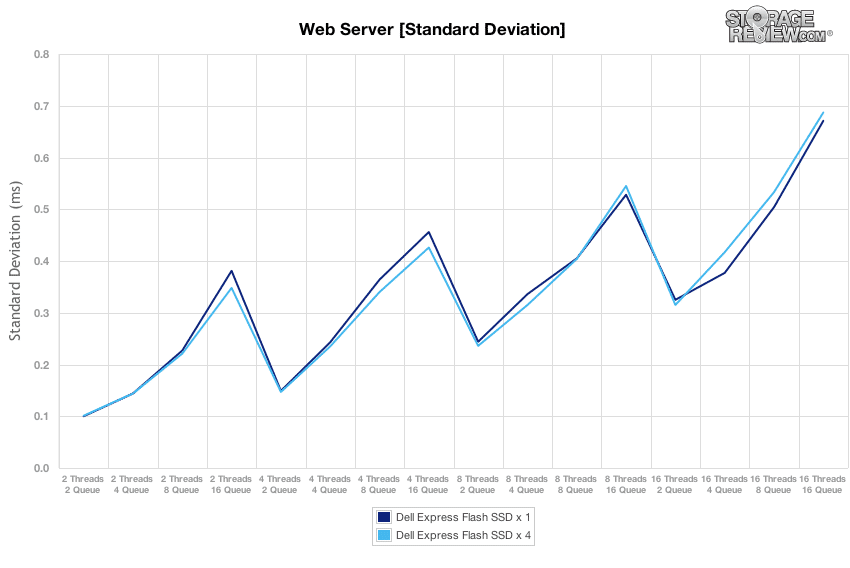
Switching to latency consistency, the Micron P320h offered latency standard deviation ranging from 0.1-0.68ms.
Conclusion
The 2.5" Micron P320h PCIe application accelerator is interesting for a pretty long list of reasons. Top of the list though is taking the performance potential of PCIe flash storage and squeezing them down to a front-mounted easy to service form factor. Micron is the first to push this form factor to market and Dell is first to adopt it, with an innovative server backplane design compatible with many R720 12G servers. While the platform forces users to give up four drive bays, for the market this type of storage is targeted for, that's probably an acceptable trade-off. This certainly isn't and shouldn't be construed as a mass-market play, it's about as niche as it gets for servers. But for those with smaller databases or larger databases that can benefit from Fluid Cache, the novel design fills certain needs perfectly.
The Express Flash configuration of the PowerEdge 720 12G, when equipped with four SSDs, is easily the fastest storage platform we've tested to date, earning the top marks in all of our storage benchmarks. In terms of raw bandwidth, four of the 2.5" Micron P320h SSDs are capable of pushing 6.9GB/s read and 4.7GB/s write with sequential loads. Switch to peak random I/O throughput with 4K transfers and the system has no trouble managing 1.6M IOPS read and 571k IOPS write in steady-state. When looking at our 8k 70/30 workload, the R720 levels off at 480,000 IOPS steady-state, which even by full-size PCIe Application Accelerator standards requires two or more to meet or exceed that from the class-leaders in the space.
It's not often that a particular server or storage product can claim to be the fastest in the industry, but Dell and Micron have worked together to make just that. Our R720 paired with four 2.5" P320h flash drives posts scores that exceed any single PCIe card in the market and had driver support that allowed aggregate performance to scale very well. To best these drives with in-compute storage, it would take at least two standard PCIe cards and depending on the driverset might not offer performance that scales as well. Plus, this platform can be serviced from the front, making non-disruptive configuration changes possible.
Pros
- Best performance possible from 2.5" bay
- Bandwidth and I/O performance in the range of dedicated all-flash arrays
- Easy to service with hot-swap capabilities
Cons
- Must trade 8 traditional 2.5" bays for 4 Express Flash bays
Bottom Line
The combination of Dell servers and the 2.5" Micron P320h offer a truly unique storage solution that provides the fastest possible storage in the 2.5" form factor. For users who want the performance PCIe offers and the serviceability of standard front-mounted drives, this solution has tremendous potential.


 Amazon