

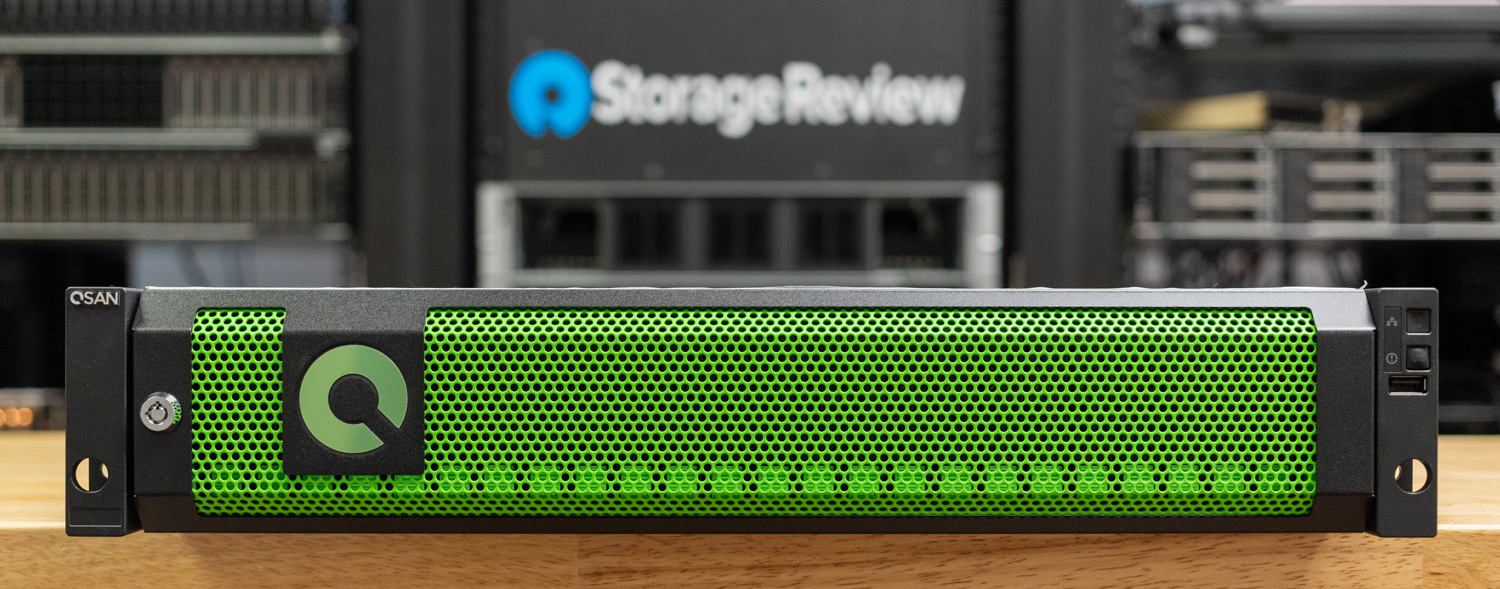
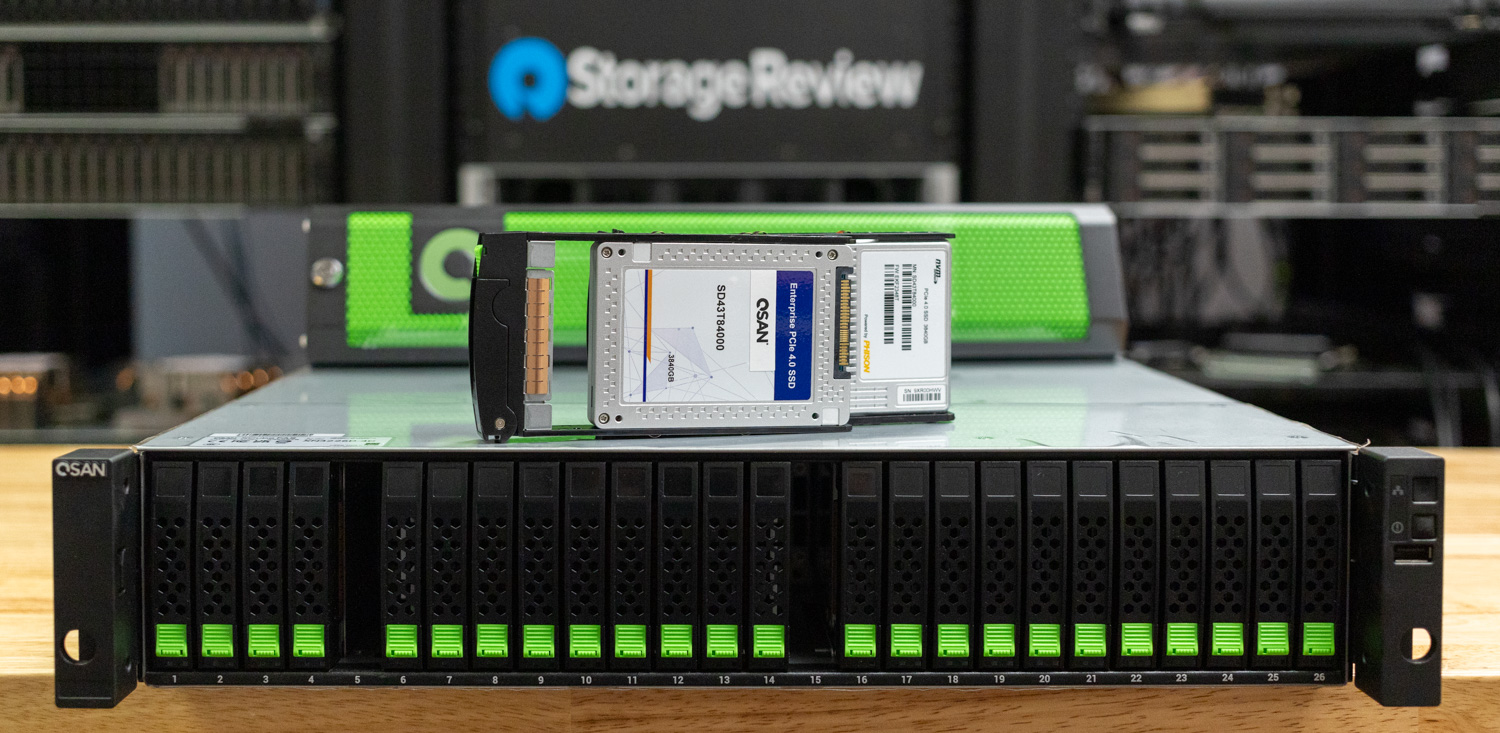
QSAN has been building enterprise storage solutions since 2004, and that experience is evident in the XN4 line. The XN4226D in our lab is a 2U, 26-bay, all-NVMe array with dual active controllers, delivering high availability as unified block and file storage. QSM 4 software adds the expected data services, including snapshots, replication options, data reduction, and a straightforward management experience. The XN4 is designed for teams that seek NVMe speed without compromising multiprotocol flexibility, all at a very approachable price.
Key Takeaways
- Unified block and file with real HA. Dual active controllers and QSM 4 deliver high availability with one platform for block and file.
- NVMe-oF done right. Full protocol spread with NVMe-oF over TCP and RDMA alongside iSCSI, Fibre Channel, NFS, SMB, FTP, and WebDAV.
- Proven throughput. We measured up to 21.21 GB/s on large sequential reads with TCP and 11.14 GB/s large sequential writes with RDMA.
- Built for modern pipelines. 26 all-NVMe bays in 2U, simple management, and I/O options that scale to 100–200GbE for media, surveillance analytics, VDI, databases, and AI inference.
The platform supports NVMe-oF over TCP and RDMA, in addition to iSCSI, Fibre Channel, NFS, SMB, FTP, and WebDAV. We also completed a focused NVMe-oF study comparing the behavior and scaling of TCP and RDMA. In our testing, we pushed the unit to its limit with large sequential reads, achieving an impressive throughput of 21.21 GB/s. Where this system fits matters as much as raw numbers. The XN4226D serves mixed environments that blend VMware or Proxmox for VMs, VDI, and database tiers, as well as creative file services, AI inference nodes that require predictable NVMe paths, media backups, and high-bandwidth ingest for surveillance and sensor workloads. The QSAN XN4226D is well-suited for nearly any workload.
QSAN has noted significant growth in media production, including live broadcasts, replay options, AI video enhancement, and OTT/edge caching, as well as in surveillance video analytics, such as smart city CCTV, anomaly detection, and real-time replay. These workloads are ideally supported with 100–200GbE throughput.
Ultimately, the value is straightforward. You get unified high availability, NVMe throughout the chassis, and I/O choices up to 100GbE or 32Gb Fibre Channel as needs grow. Performance tracks what many tier-1 arrays deliver, while licensing remains more approachable, and protocol coverage remains broad across NVMe-oF, iSCSI, Fibre Channel, SMB, and NFS. For shops eyeing InfiniBand but constrained by budget, QSAN’s Ethernet approach offers near-IB responsiveness on standard gear at 100 to 200GbE scale.
For teams that prioritize real-world application results, QSAN’s longevity, intuitive software, and clean hardware design make the XN4226D a credible all-flash workhorse to build around.
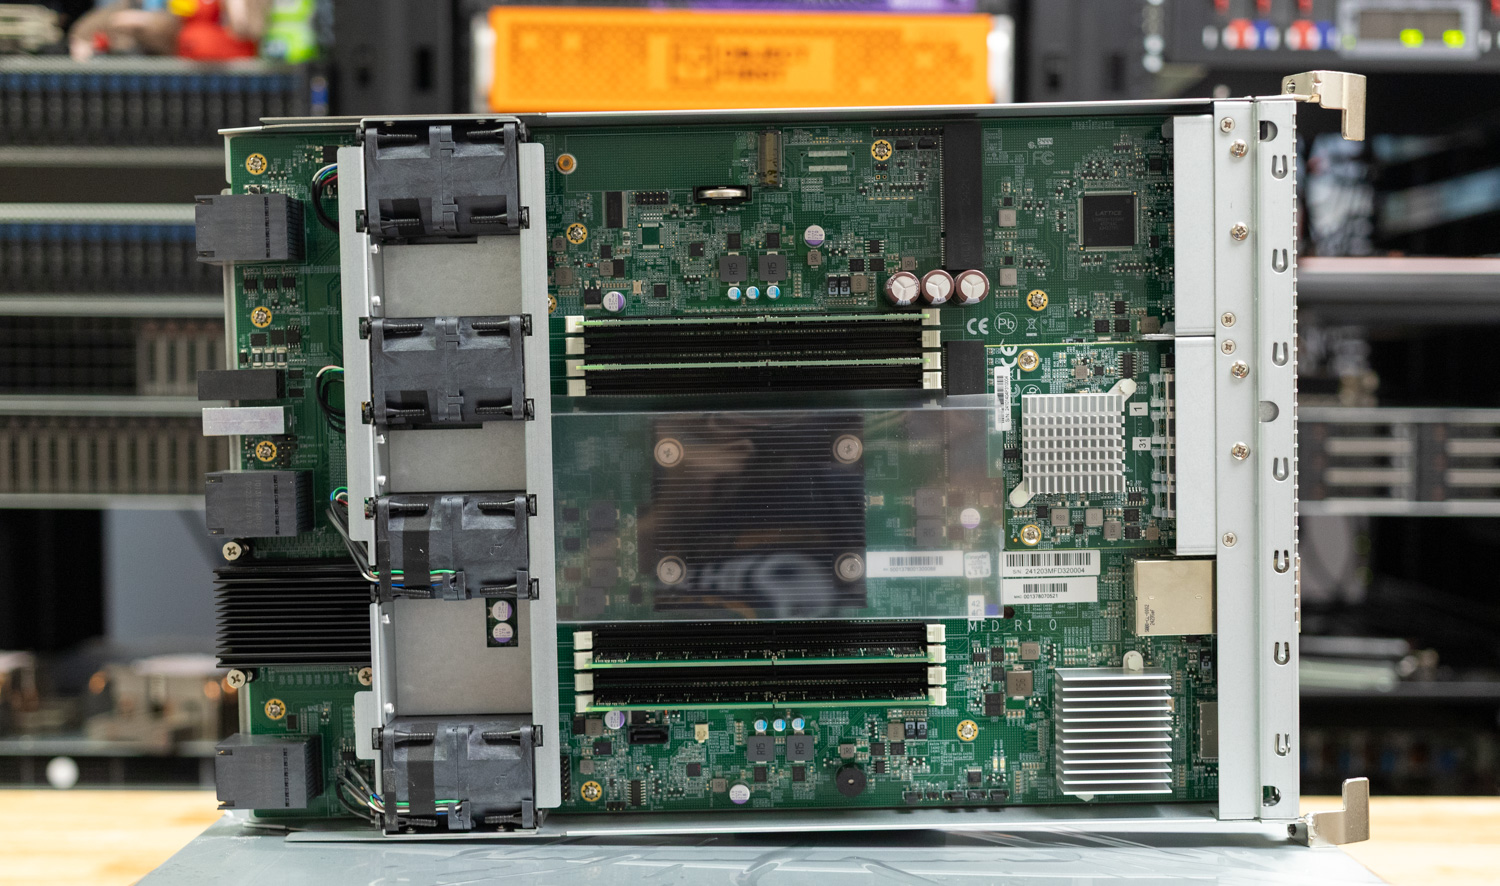
QSAN XN4 Hardware
QSAN XN4 series storage arrays come in a 26-bay, 2U, 19” rack-compatible server chassis, with single or dual-controller options housing 4- or 8-core Intel Xeon CPUs to fit the redundancy and performance needs of the smallest and largest operations. With all 26 bays populated, a single XN4 series chassis can hold up to 798 terabytes of data on 2.5” U.2/U.3 NVMe solid-state drives. Up to 20 SAS-connected expansion units can also be added, increasing the total capacity of an array to a massive 16.773 petabytes.
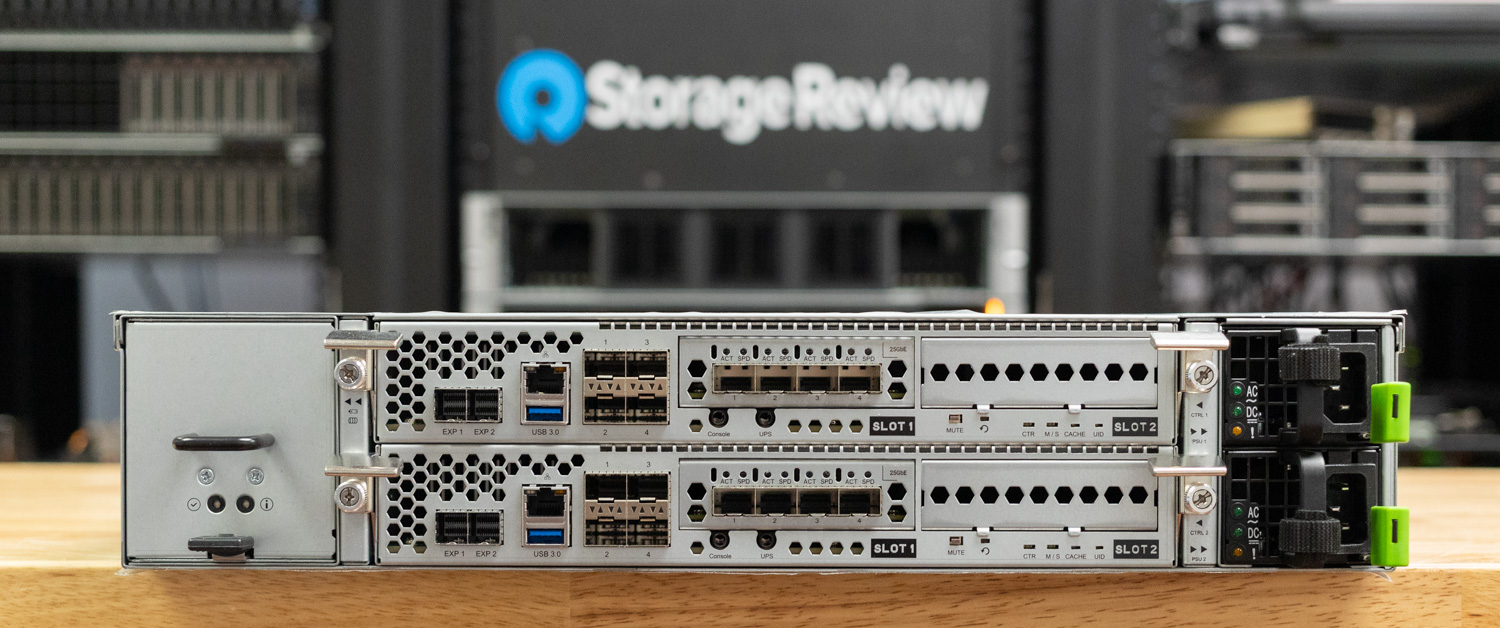
Each controller onboard features a single 2.5 Gbps RJ45 Ethernet port, four 10 Gbps SFP+ ports, and two 12 Gbps SAS wide ports. There are also upgrade options for 10Gbps RJ45, 25Gbps SFP28, and 100Gbps QSFP ports. Fibre Channel support can also be added, with 16Gbps SFP+ and 32Gbps SFP28 adapters.
The table below compares the specifications of the XN4226D-4C and XN4226S-4C storage systems. These are the 4C variants, designed with either dual-active or single-upgradable controllers depending on the model. For deployments that require more processing power, an 8C version of these systems is also available.
| Specification | XN4226D-4C | XN4226S-4C |
|---|---|---|
| Model Name | XN4226D-4C | XN4226S-4C |
| Architecture | Dual-active controller | Single-upgradable controller |
| CPU | Intel® Xeon® 4-core × 2 | Intel® Xeon® 4-core |
| Memory | ||
| Memory Module Pre-installed | 32GB DDR4 RDIMM | 16GB DDR4 RDIMM |
| Total Memory Slots | 16 | 8 |
| Memory Expandable up to | 2,048GB | 1,024GB |
| Storage | ||
| Drive Bays | 2.5″ slot × 26 | 2.5″ slot × 26 |
| Maximum Drive Bays with Expansion Unit | 546 | 546 |
| Compatible Drive Type | 2.5″ dual-port U.2 / U.3 NVMe SSD 2.5″ SAS SSD (for expansion units) 3.5″ SAS HDD (for expansion units) |
2.5″ single-port U.2 / U.3 NVMe SSD 2.5″ SAS SSD (for expansion units) 3.5″ SAS HDD (for expansion units) |
| Drive Interface | U.2 NVMe (PCIe Gen 4) SAS 12 Gb/s (for expansion units) |
U.2 NVMe (PCIe Gen 4) SAS 12 Gb/s (for expansion units) |
| Maximum Internal Raw Capacity | 798TB | 798TB |
| Maximum Raw Capacity with Expansion | 16,773TB | 16,773TB |
| Hot Swappable Drive | Yes | Yes |
| Connectivity Port | ||
| PCIe Expansion | (Gen 4×8 slot) × 4 | (Gen 4×8 slot) × 2 |
| 2.5 GbE RJ45 LAN Port | 2 (onboard) | 1 (onboard) |
| 10 GbE SFP+ LAN Port | 8 (onboard) / 16 (option) | 4 (onboard) / 8 (option) |
| 10 GbE RJ45 LAN Port | 16 (option) | 8 (option) |
| 25 GbE SFP28 LAN Port | 16 (option) | 8 (option) |
| 100 GbE QSFP LAN Port | 8 (option) | 4 (option) |
| 16 Gb SFP+ Fibre Channel | 16 (option) | 8 (option) |
| 32 Gb SFP28 Fibre Channel | 16 (option) | 8 (option) |
| Expansion and External Port | ||
| 12 Gb/s SAS Wide Port | 4 (onboard) | 2 (onboard) |
| USB Port | 1 (front) / 2 (rear) | 1 (front) / 1 (rear) |
| Others | Console Port × 2, Service Port × 2 | Console Port × 1, Service Port × 1 |
| Software Specification | ||
| Storage OS | QSM 4 | QSM 4 |
| RAID Type | 0 / 1 / 5 / 6 / 10 / 50 / 60 / 5EE / 6EE / 50EE / 60EE | |
| Storage Efficiency | Thin provisioning / Compression and Deduplication (option) | |
| Software Acceleration | SSD cache / Auto tiering / RDMA | |
| Data Protection | Snapshot / Asynchronous / Synchronous (option) | |
| Backup Service | Rsync / S3 backup / Cloud backup / XMirror* / Microsoft 365 email backup | |
| Security | SSL / SSH / iSCSI CHAP / ISE & SED / WORM / RBAC / Windows ACL / Antivirus | |
| Support Protocols | CIFS / NFS / FTP / WebDAV / iSCSI / FCP / NVMe-oF | |
| Management | Web UI / Windows AD / LDAP / RESTful API / S.E.S. / LCM | |
| Appearance | ||
| Dimension (H × W × D) | 88 × 438 × 573mm | 88 × 438 × 573mm |
| Net Weight | 19.6kg | 16.5kg |
| Gross Weight | 28.6kg | 25.5kg |
| Others | ||
| Memory Protection | Cache-to-Flash Module (built-in) | |
| System Fan | 8 pcs | 4 pcs |
| Power Supply Unit | 850 W × 2 (80 Plus Platinum) | |
| Power Input | 100 – 240 VAC, 50/60 Hz | |
| Power Consumption | 812 W / 2,770 BTU | |
| Certification | CE / FCC / BSMI | |
| Standard Warranty | System: 5 years | Cache-to-Flash Module: 1 year | |
QSAN XN4 Capabilities
XN4 arrays come standard with the latest connection protocols required to support high-performance compute and data-hungry AI models, including NVMe over Fabrics (NVMe-oF) served over TCP and RDMA. Connections over iSCSI, NFS, FCP, CIFS/SMB, FTP, and WebDAV are also possible, allowing the array to meet the block and file storage needs of data centers with a mix of legacy and bleeding-edge systems.
The Advantages of NVMe-oF
While protocols such as iSCSI, NFS, and FCP are still widely used in enterprise storage applications, NVMe-oF offers significant improvements in latency. NVMe standards were designed from the ground up for solid-state drives connected directly to a system’s PCIe bus. In contrast, older protocols like iSCSI and NFS were developed around the limitations and slower access times of traditional hard disk drives. In almost every case, NVMe-oF technologies outperform older connection protocols, with higher bandwidth and faster access times. NVMe-oF can also leverage network interfaces with Remote Direct Memory Access (RDMA) capabilities, enabling data to be transferred directly to the memory of a target computer without requiring CPU processing.
Data Reduction and Optimization Features
The high-performance hardware stack of the XN4 storage array is further enhanced by numerous software features that are well-known and appreciated by storage administrators. Thin provisioning, compression, and deduplication enable businesses to maximize their SAN capacity, while SSD caching and automatic storage tiering accelerate access times for frequently used files and objects. The appliance’s QSM 4 operating system also makes it easy to test and roll back changes with built-in snapshot tools.
Security and Management Features
QSAN has taken into account the evolving security and management requirements of its customers with the XN4 line. The XN4 is compatible with Instant Secure Erase (ISE) and Self-Encrypting Drives (SED), as well as security protocols such as SSL/TLS, authentication via Role-Based Access Control (RBAC), and support for Active Directory/LDAP servers. The array can be managed using an HTTPS web UI or a RESTful API, enabling automation through a wide variety of tools, such as Ansible or Terraform.
QSM 4 Management
QSM 4, the operating system of the QSAN XN4 series, makes setup and management of the storage array easy for storage administrators of all experience levels. Out-of-box deployment is simple: fast pool creation, intuitive host assignment, and lightweight management via web UI and REST APIs—all designed for smaller IT teams without deep storage expertise.
The Dashboard screen displays system status information and recent events logged by the server.
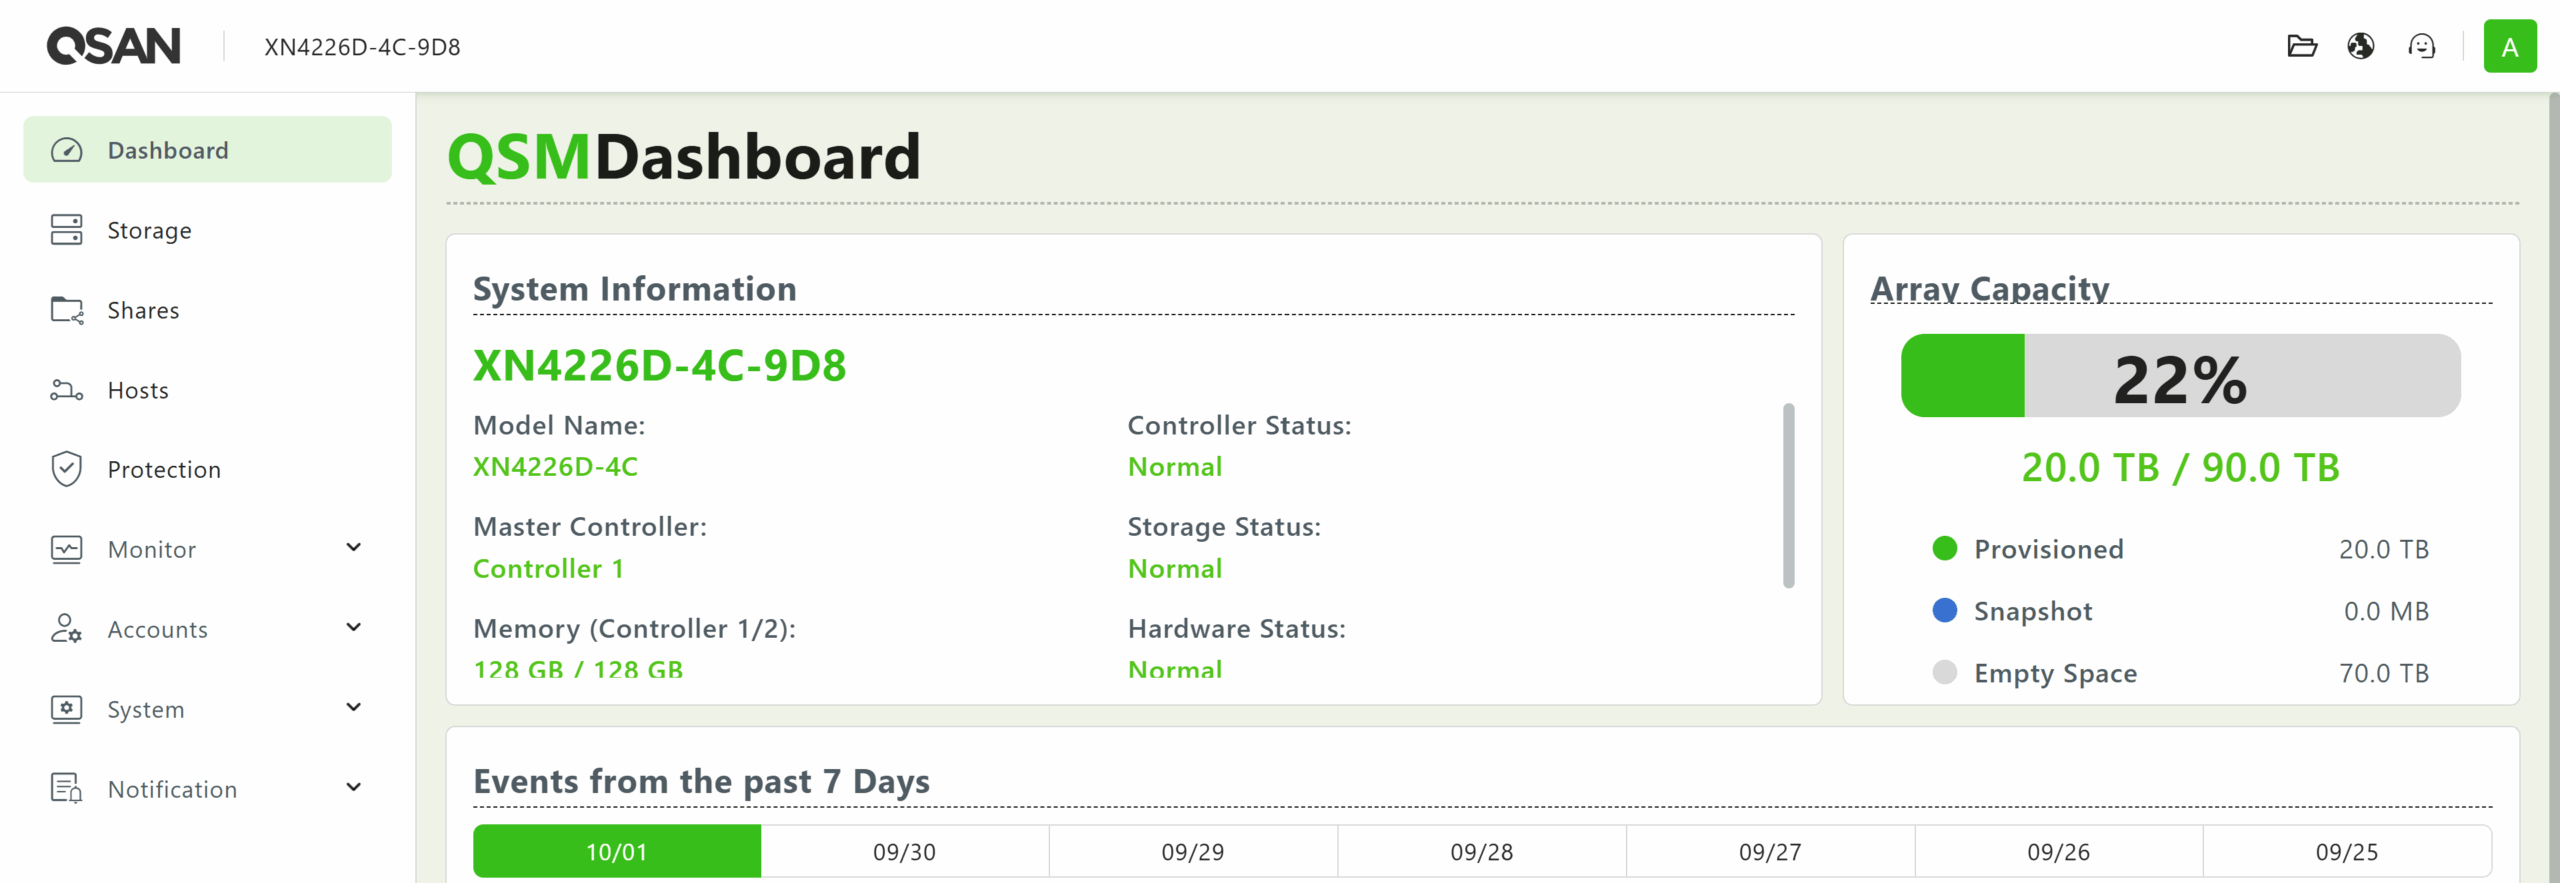
After logging in, the user is presented with the Dashboard screen, which provides a quick overview of the SAN’s health. From here, you can jump into any submenu from the list in the panel to the left.
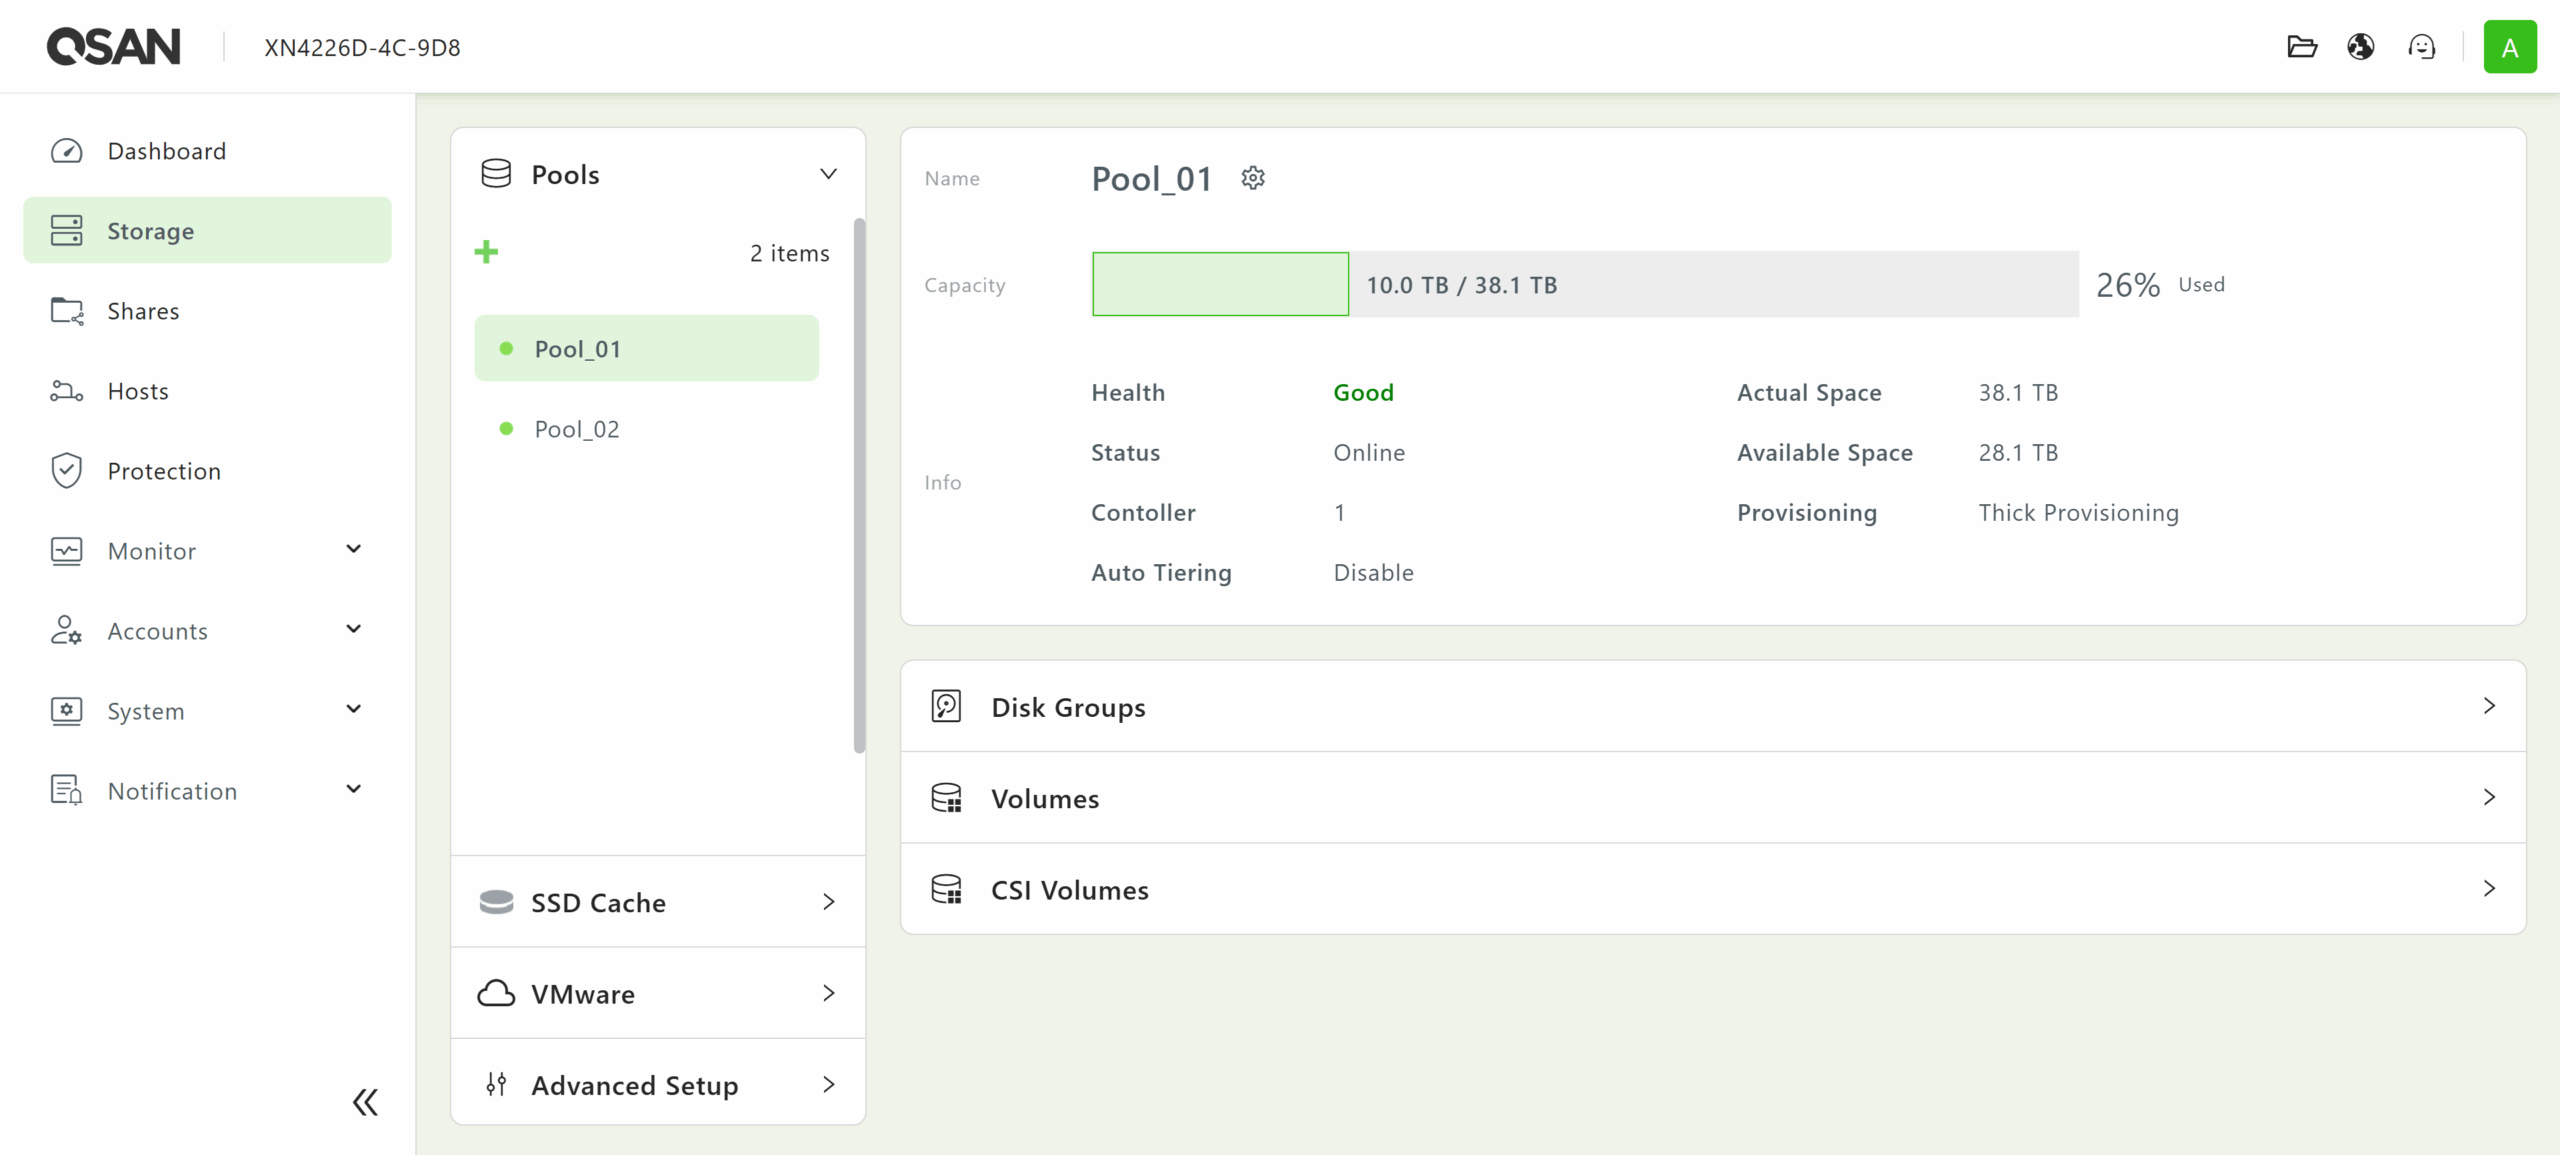
From the Storage menu, administrators can create and manage pools of drives and their associated volumes.
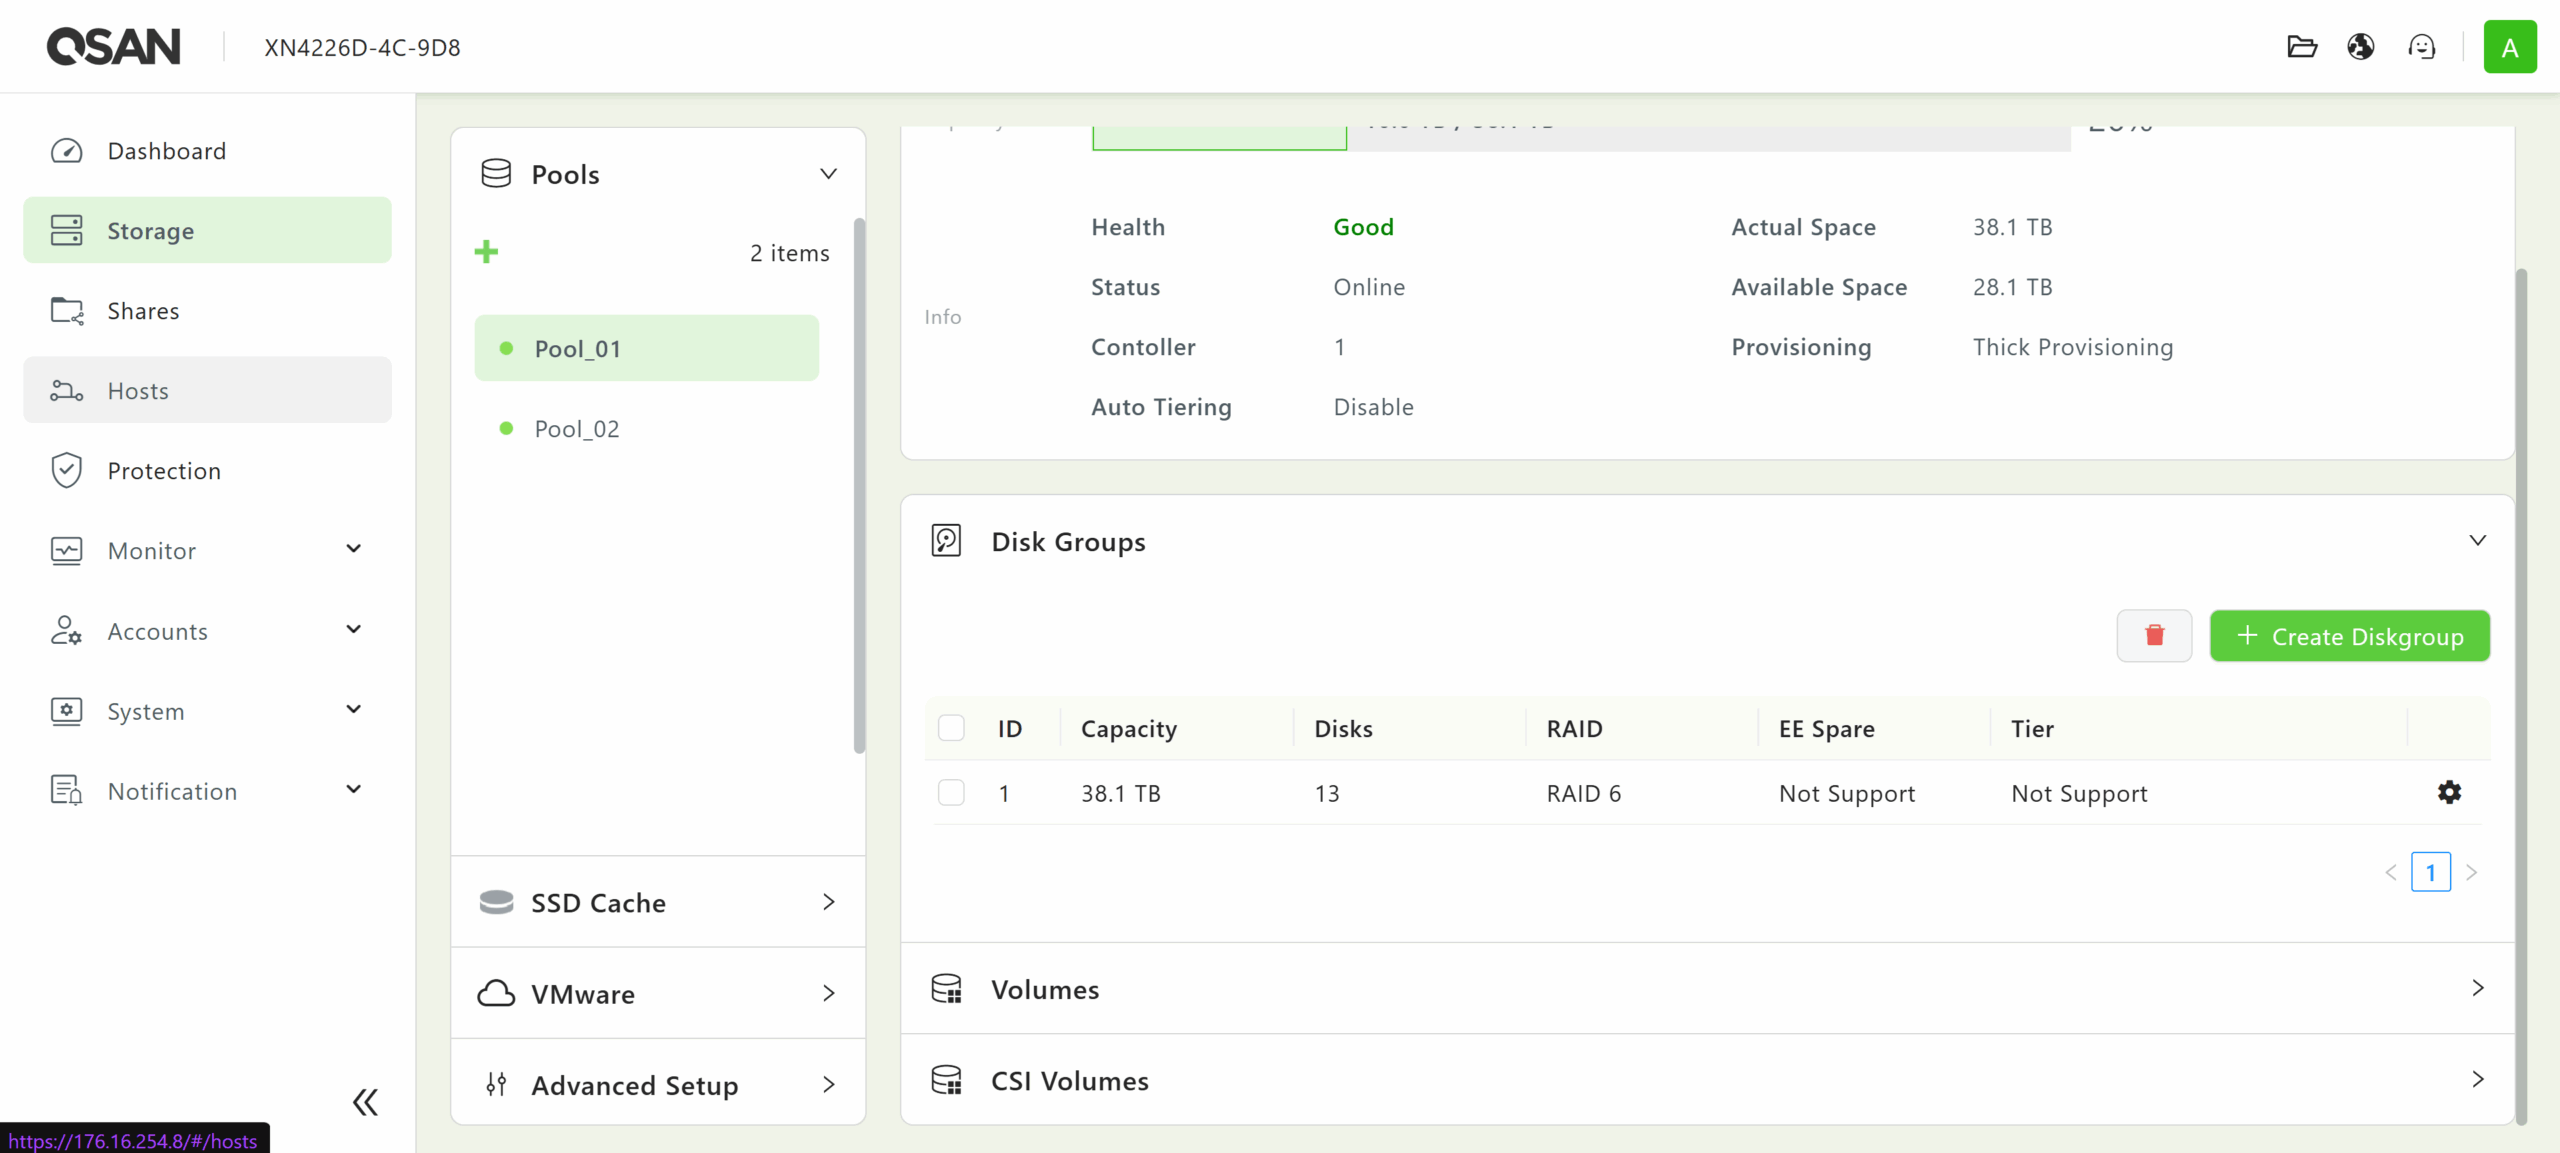
The disk groups that constitute each pool can be managed in the Disk Groups tab. This feature supports various RAID levels, including 0, 1, 5, 6, 10, 50, 60, 5EE, 6EE, 50EE, and 60EE, depending on the number of drives that have already been assigned.
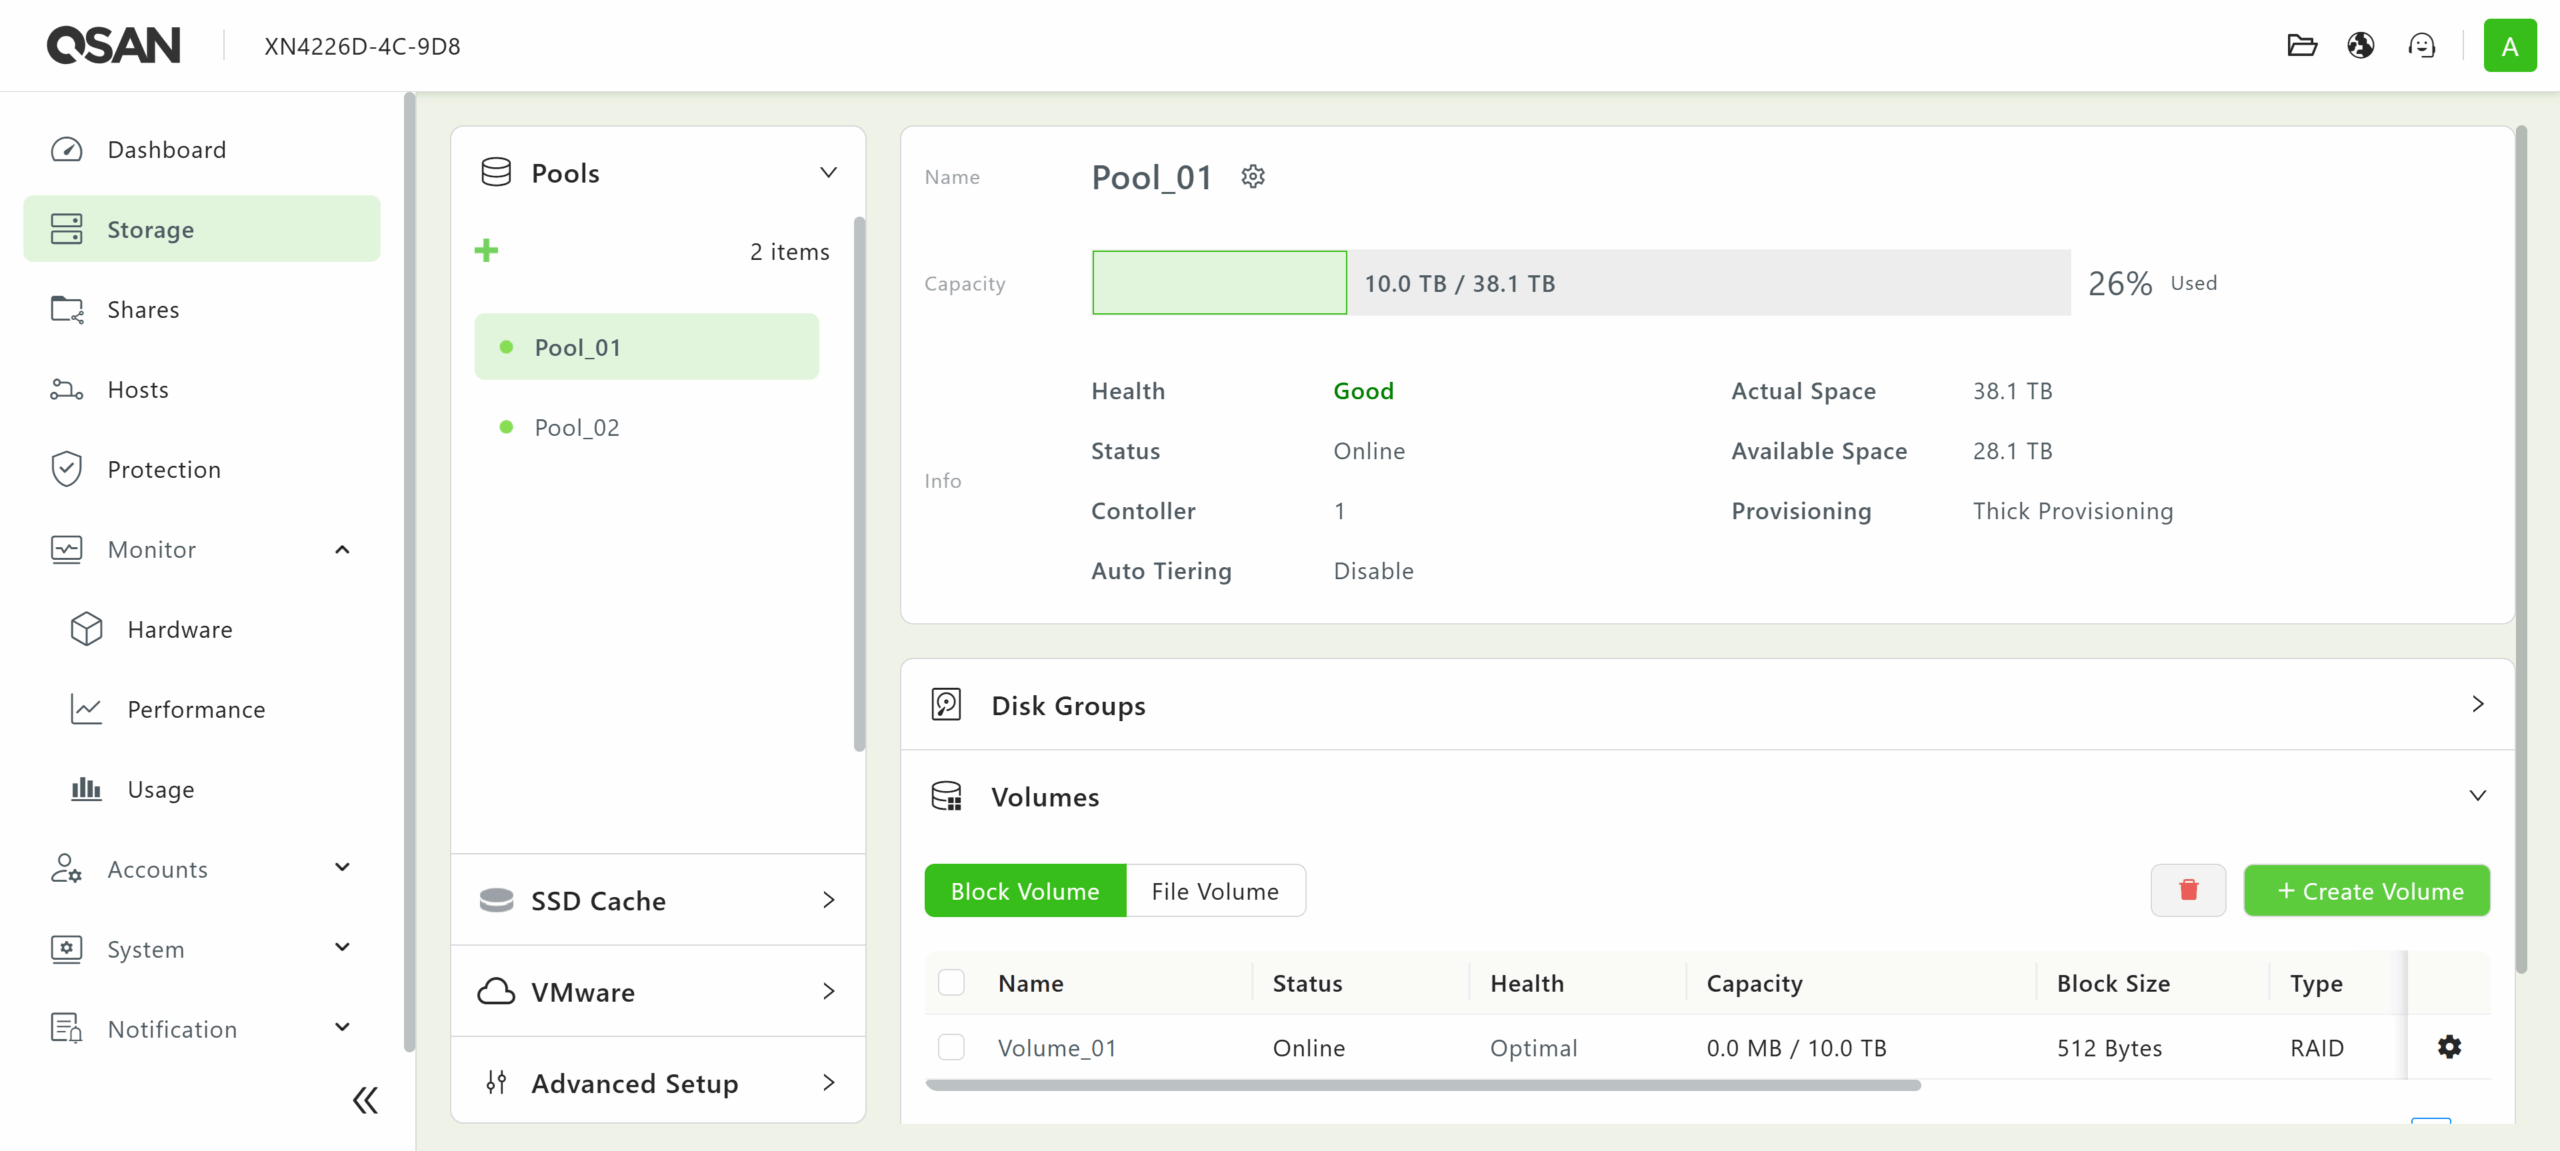
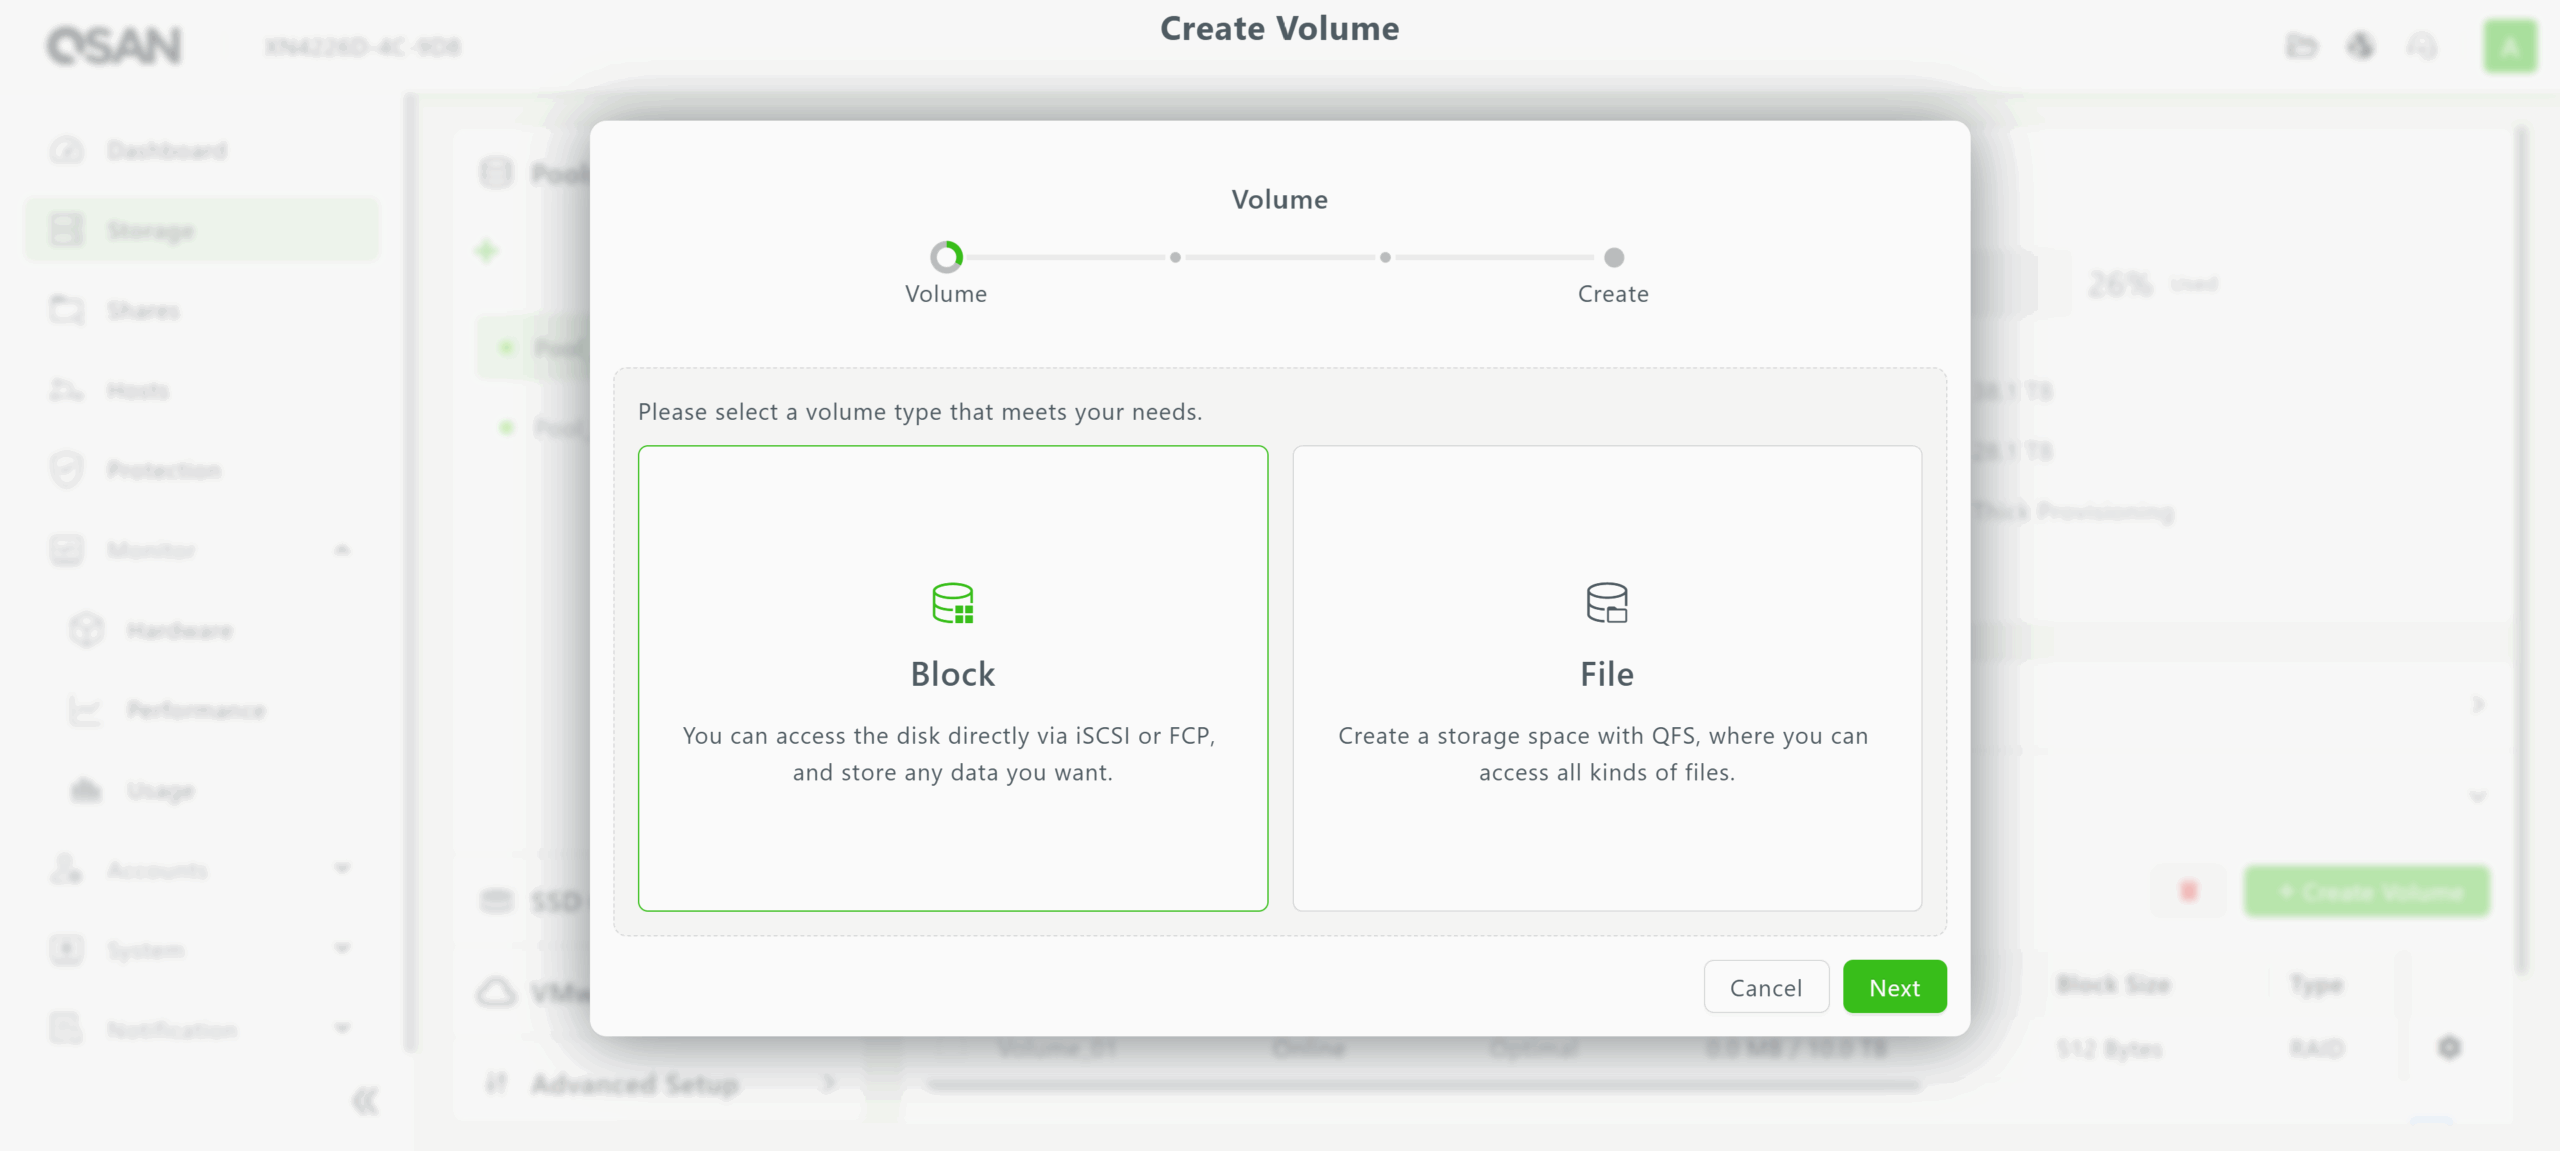
Volumes for block and file storage needs can then be built on top of pools. Using the wizard, the capacity and block sizes of each volume can be set to fit the needs of connected clients.
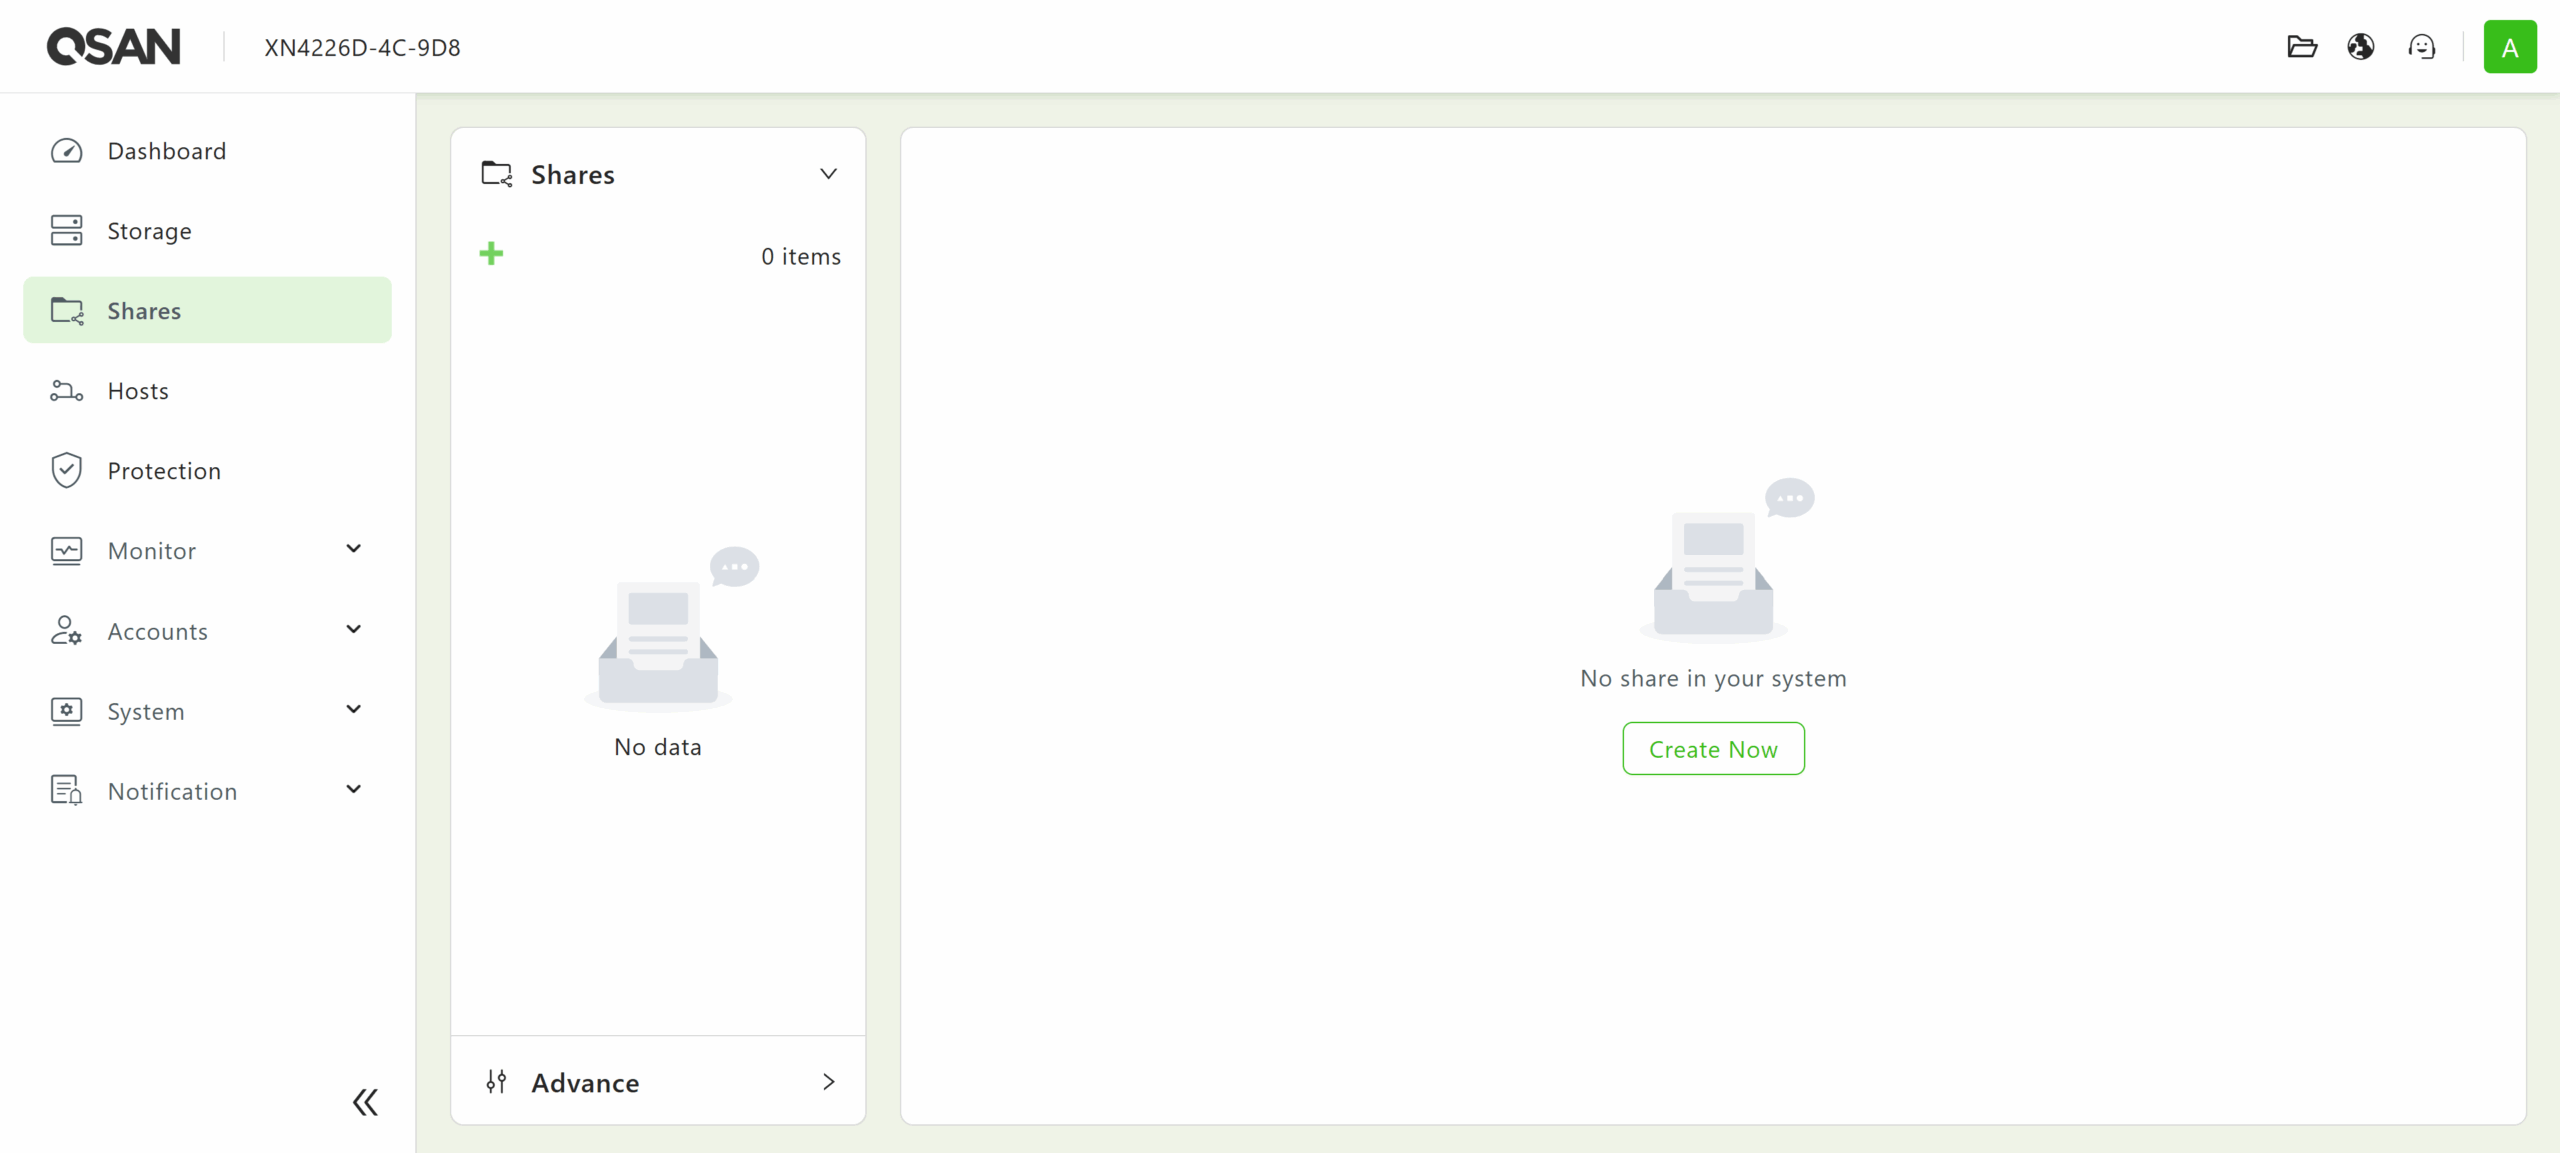
Moving down the list, the Shares menu can be used to create a share object on top of a file volume. Supported sharing protocols include CIFS (SMB), FTP, NFS, and WebDAV.
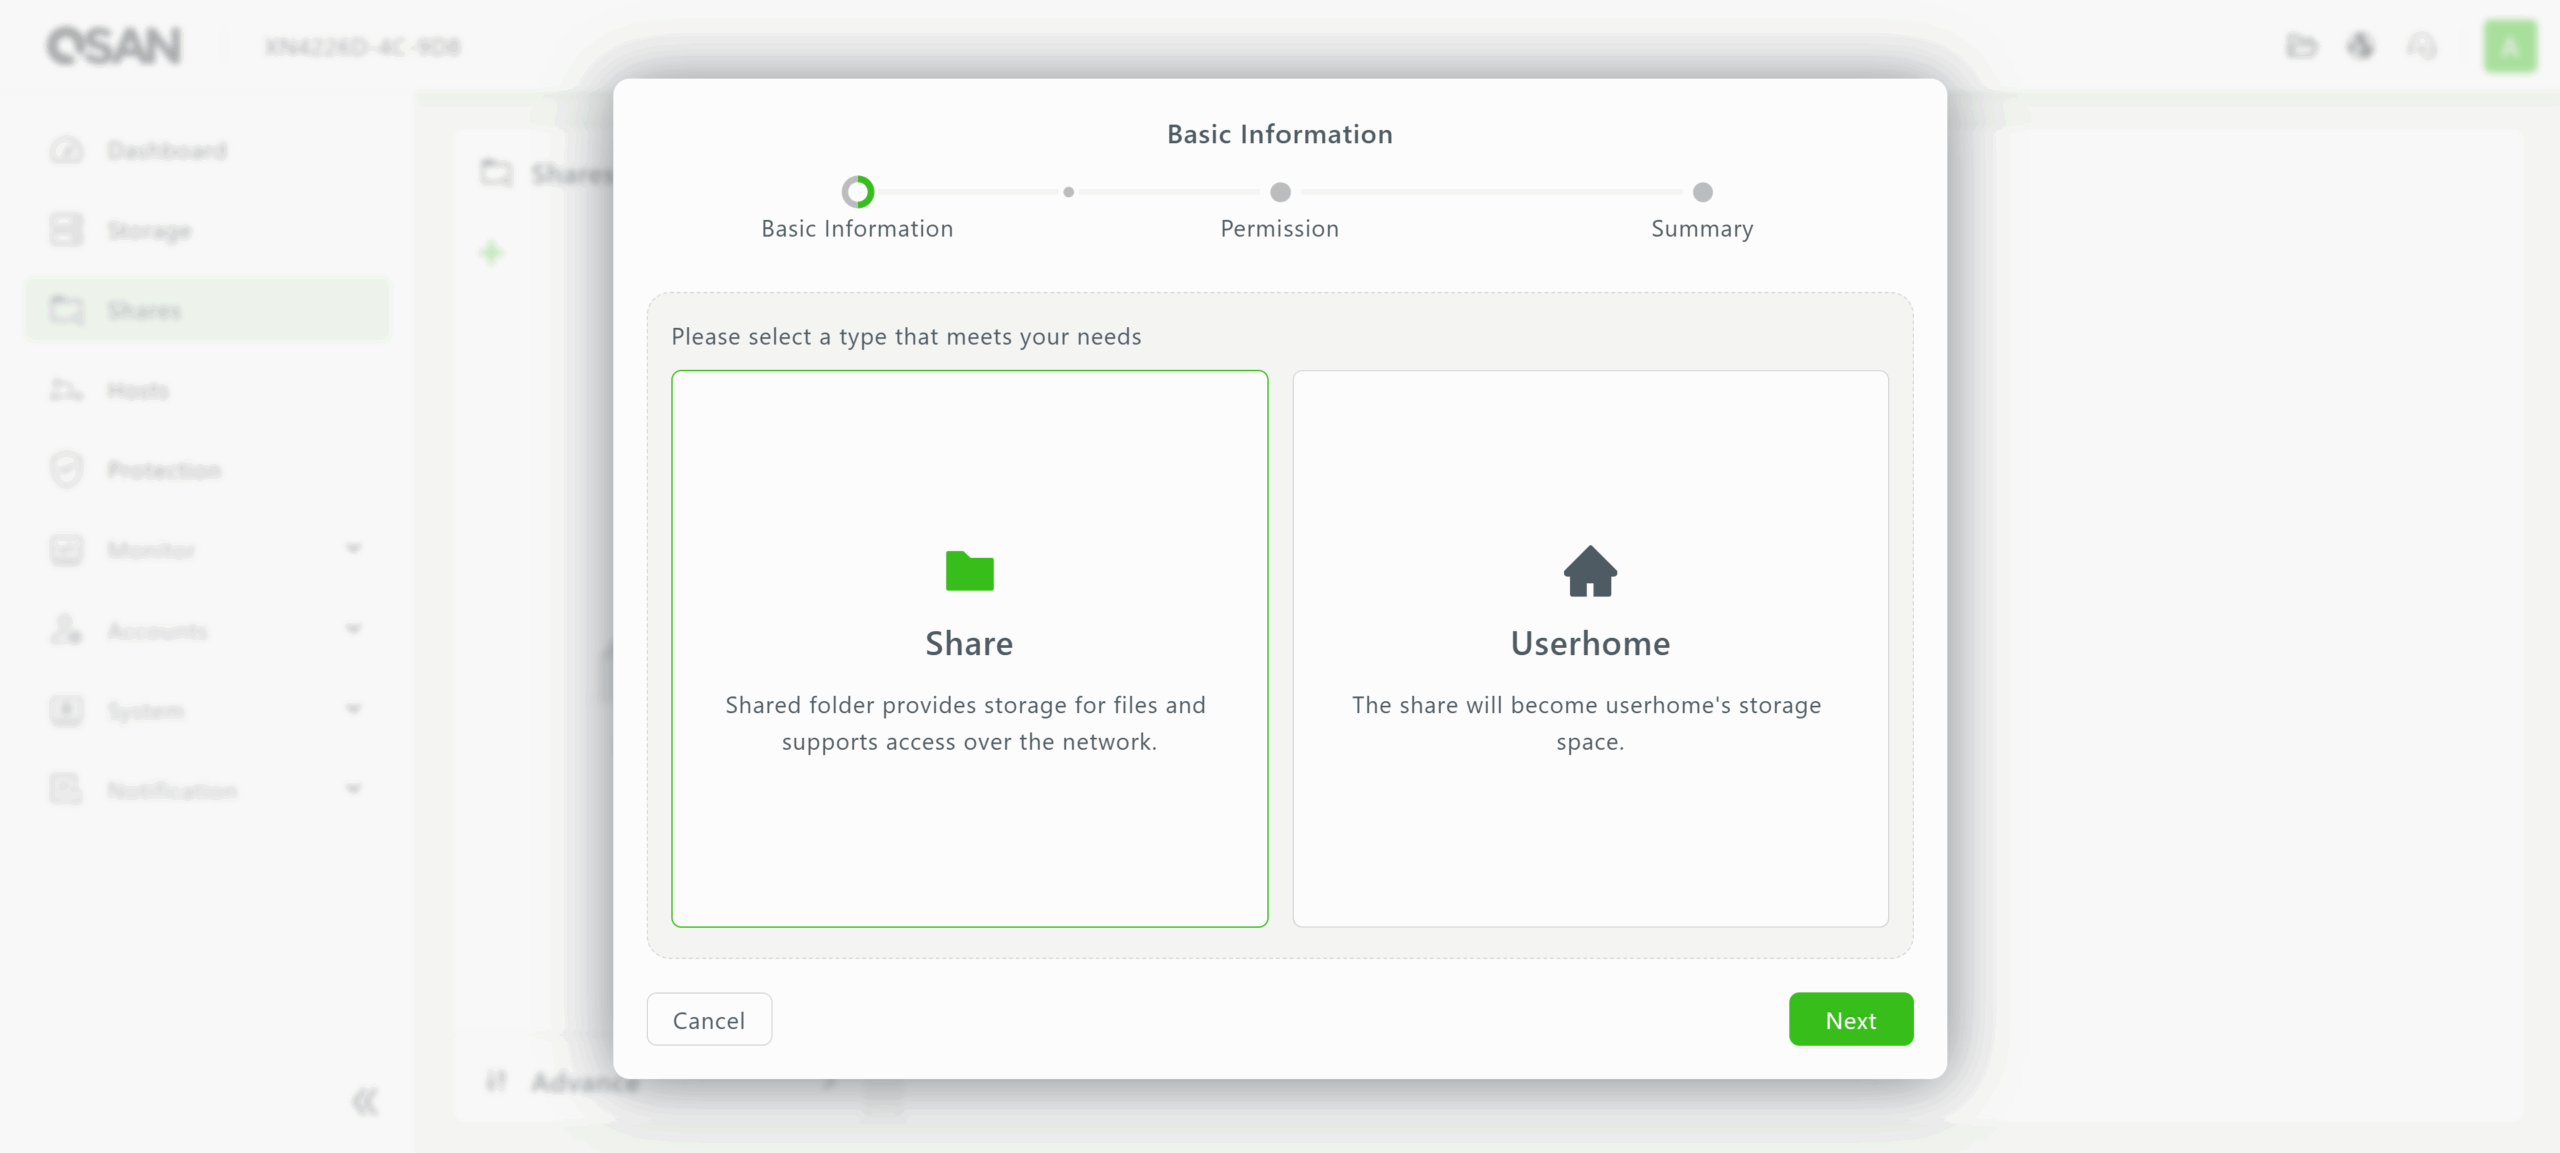
 When creating a new share, QSM 4 provides two options: a standard network share for hosting files that multiple users will access, and a userhome share, which is designed to hold home folders for users that can only be individually accessed.
Once a block volume or file volume and share is created, it must be assigned to an IP address or hostname in the Hosts menu. Hosts are organized by whether they correspond to block or file (share) storage, as shown in the screencaps below.
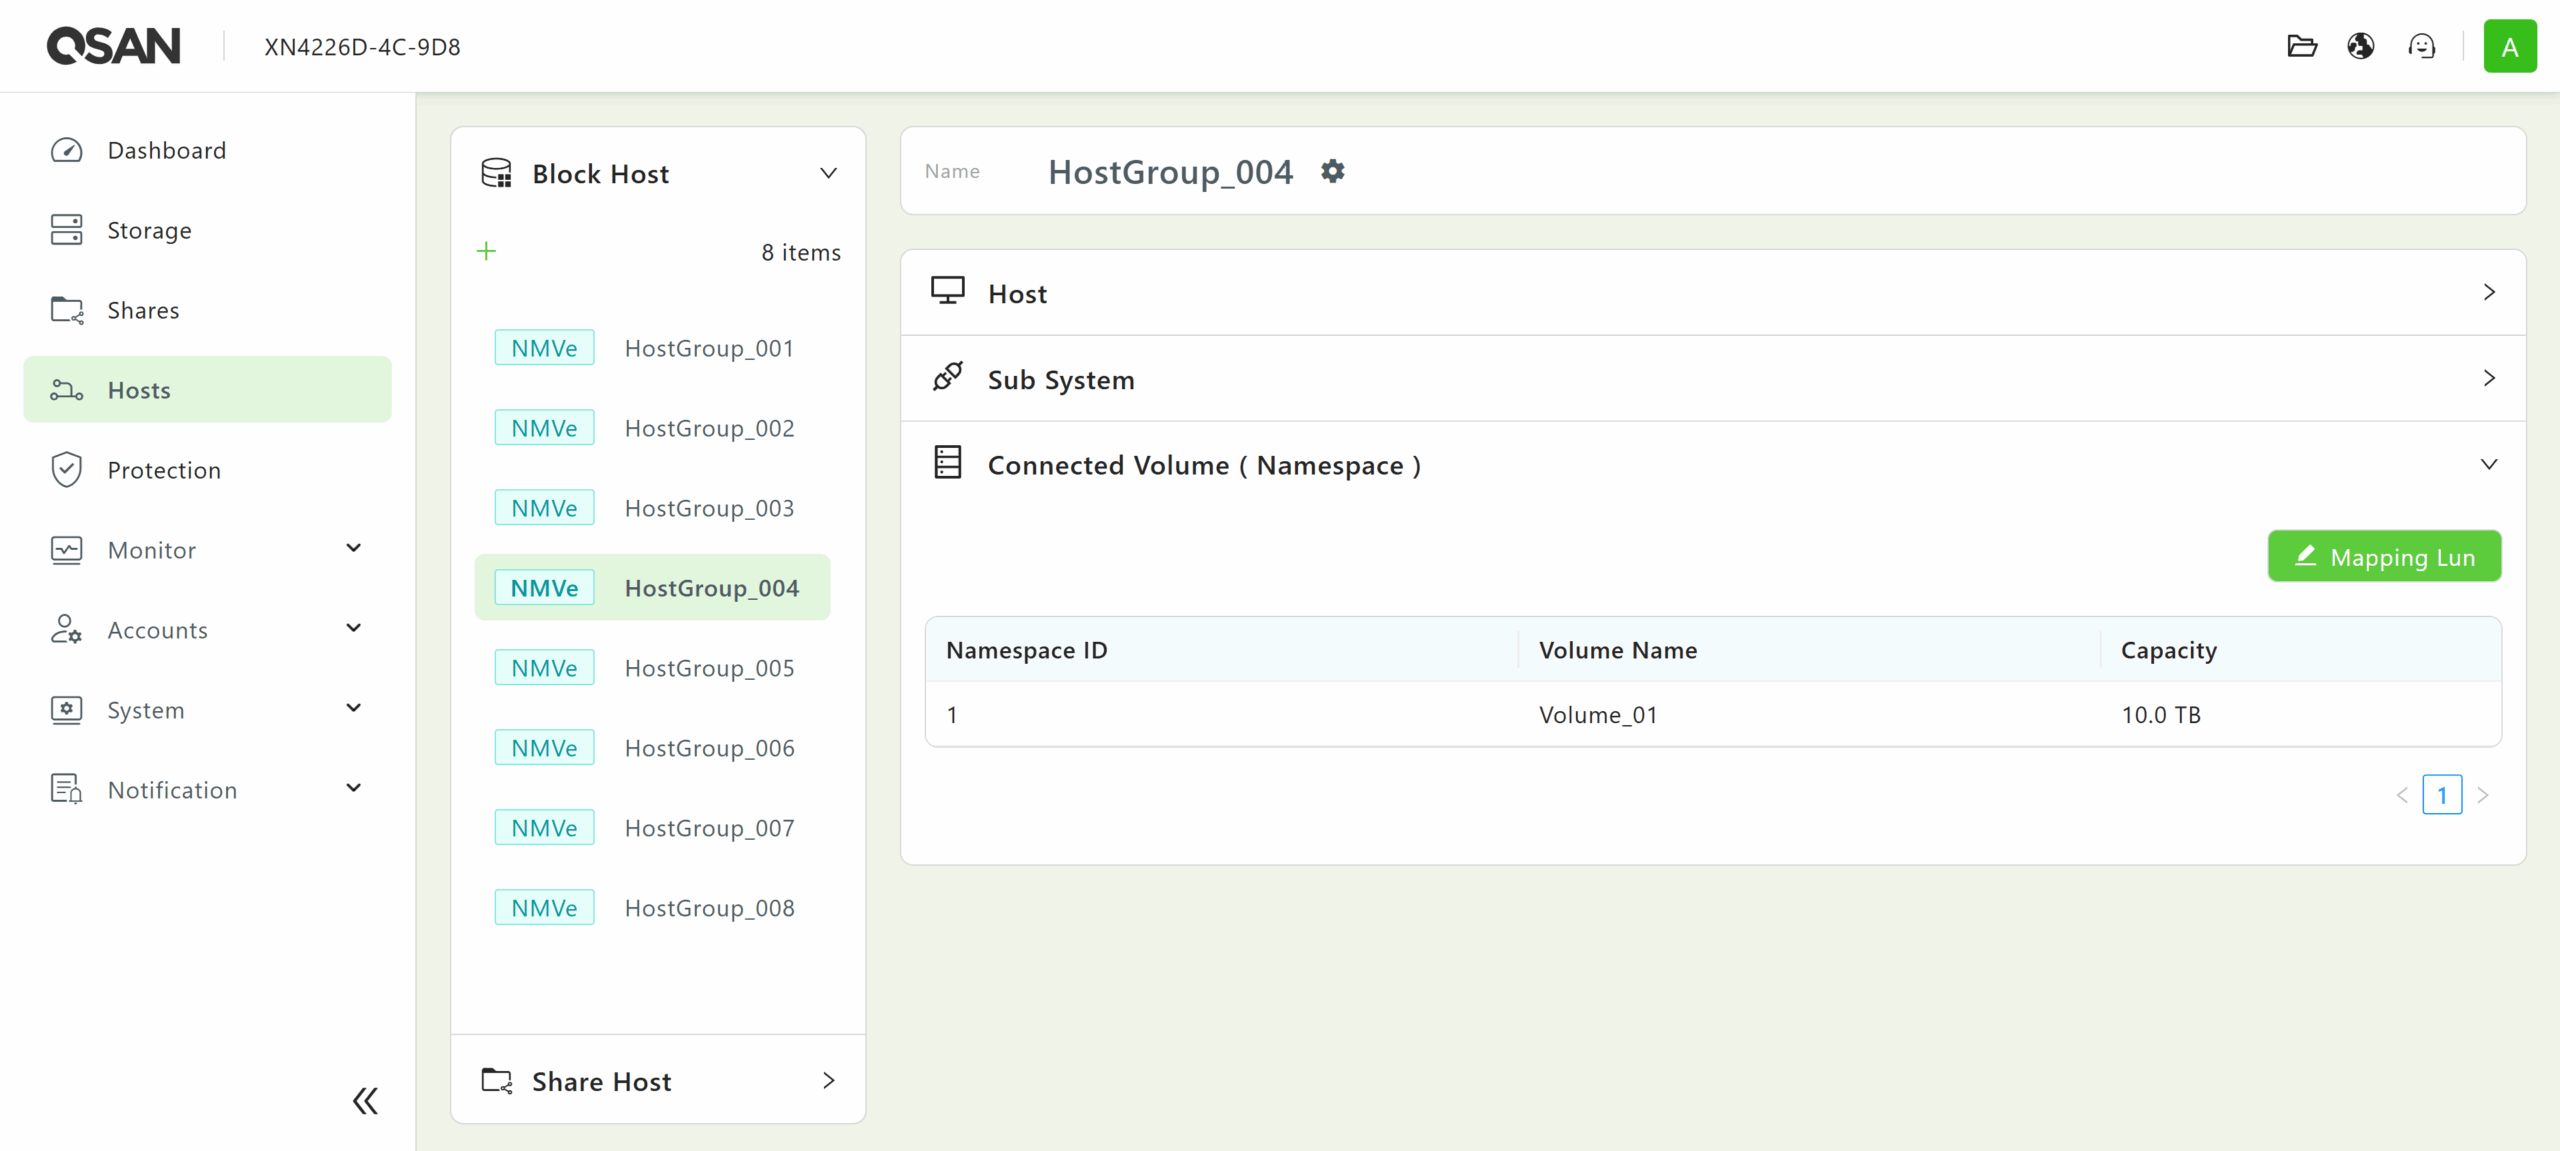
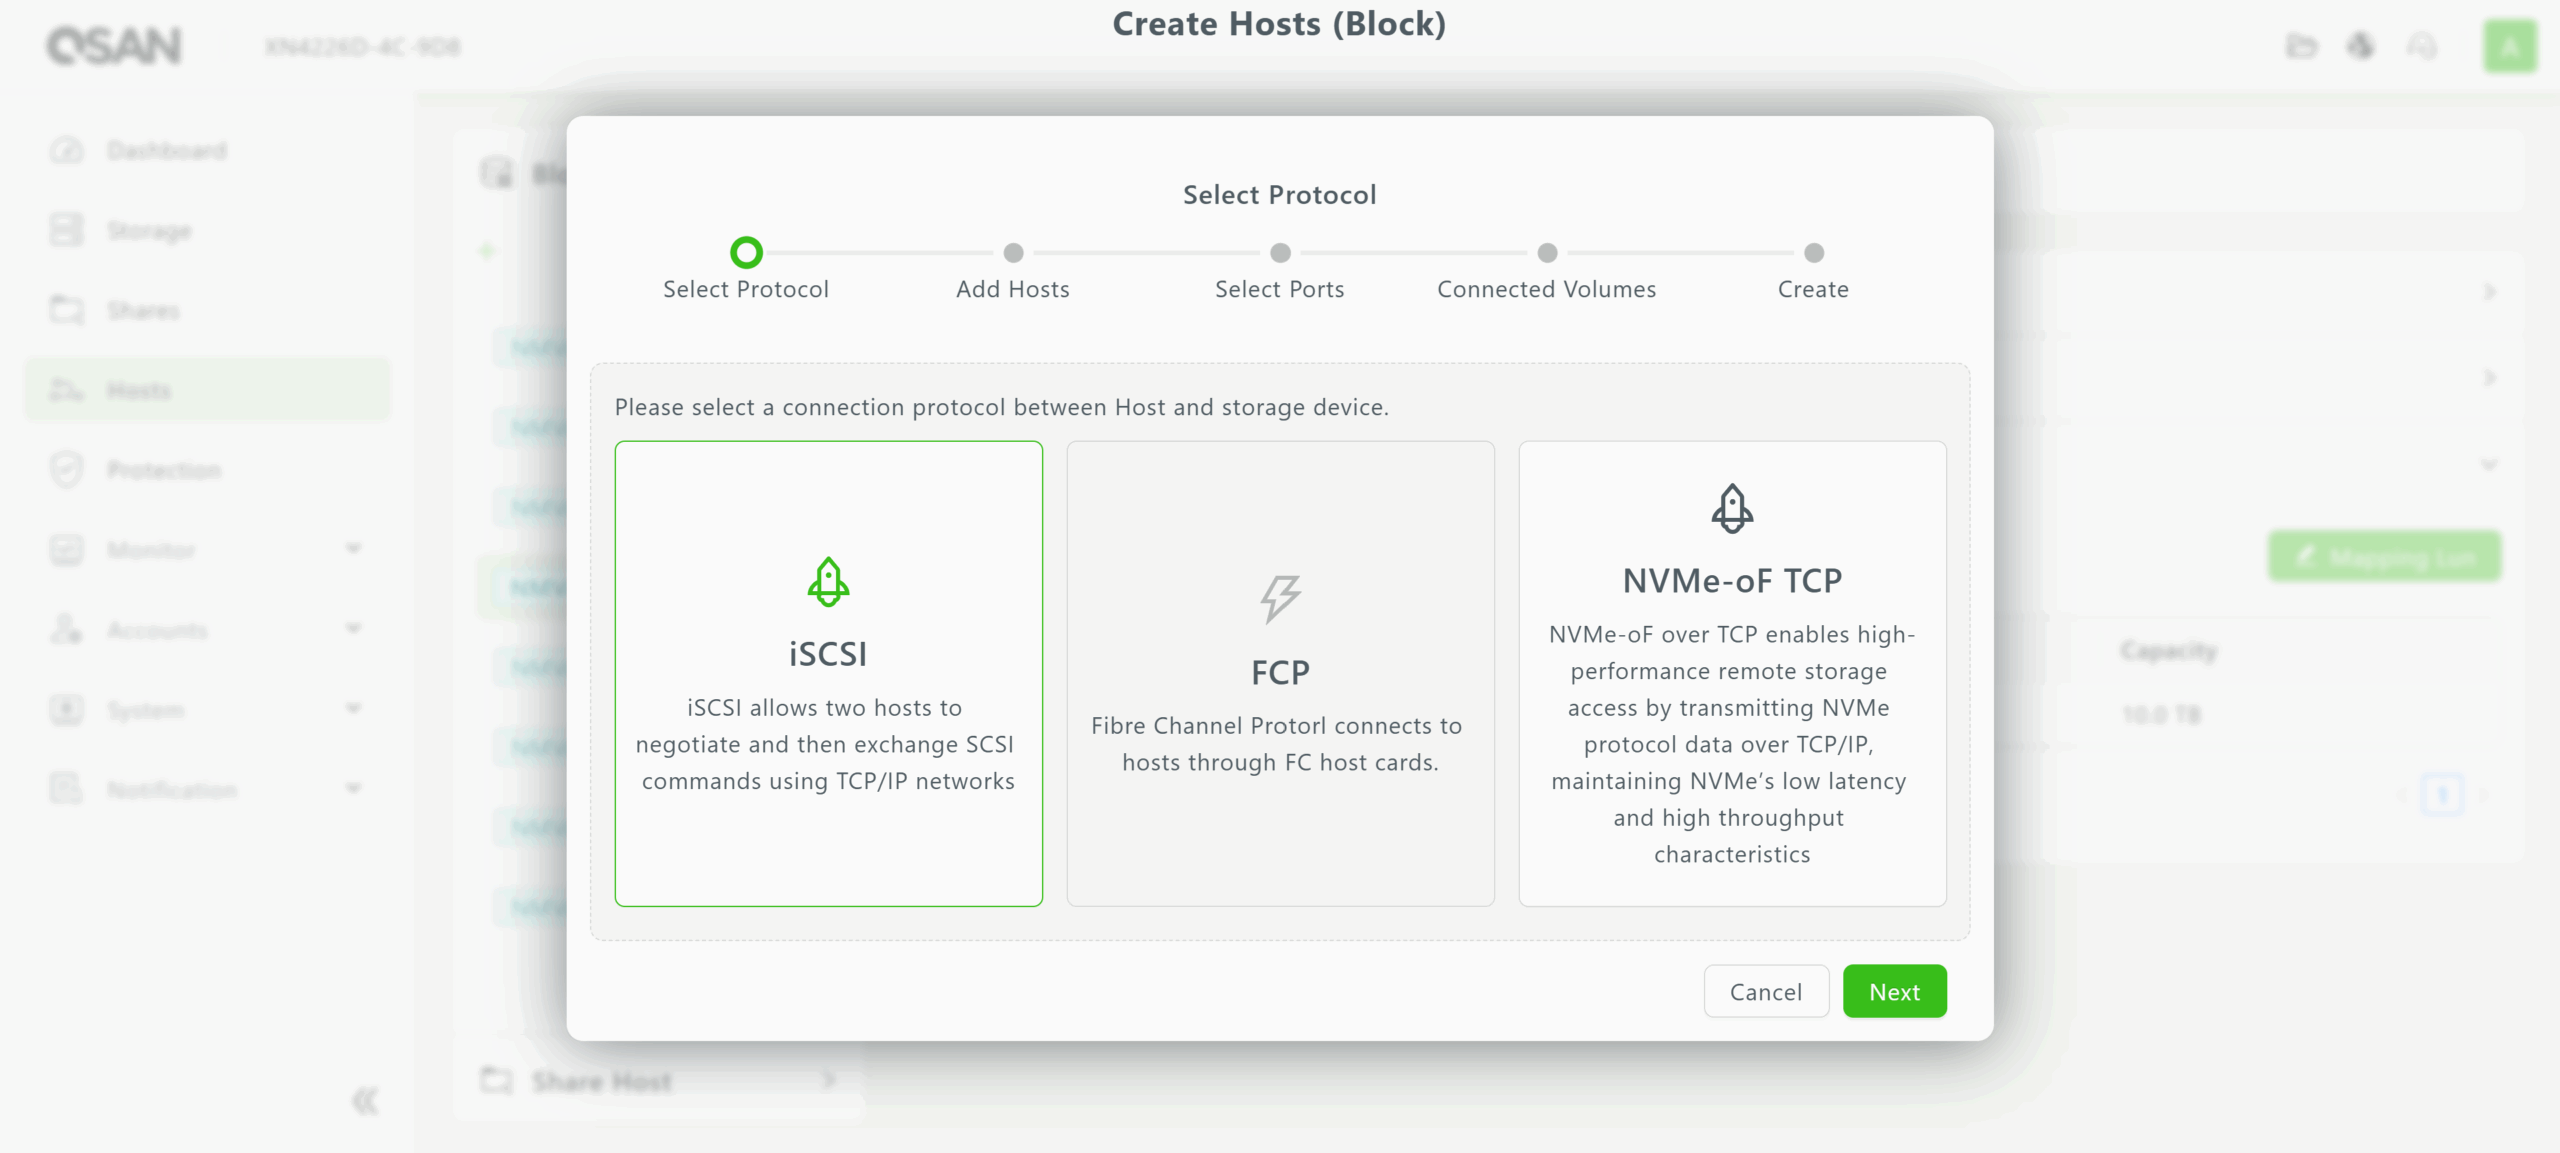
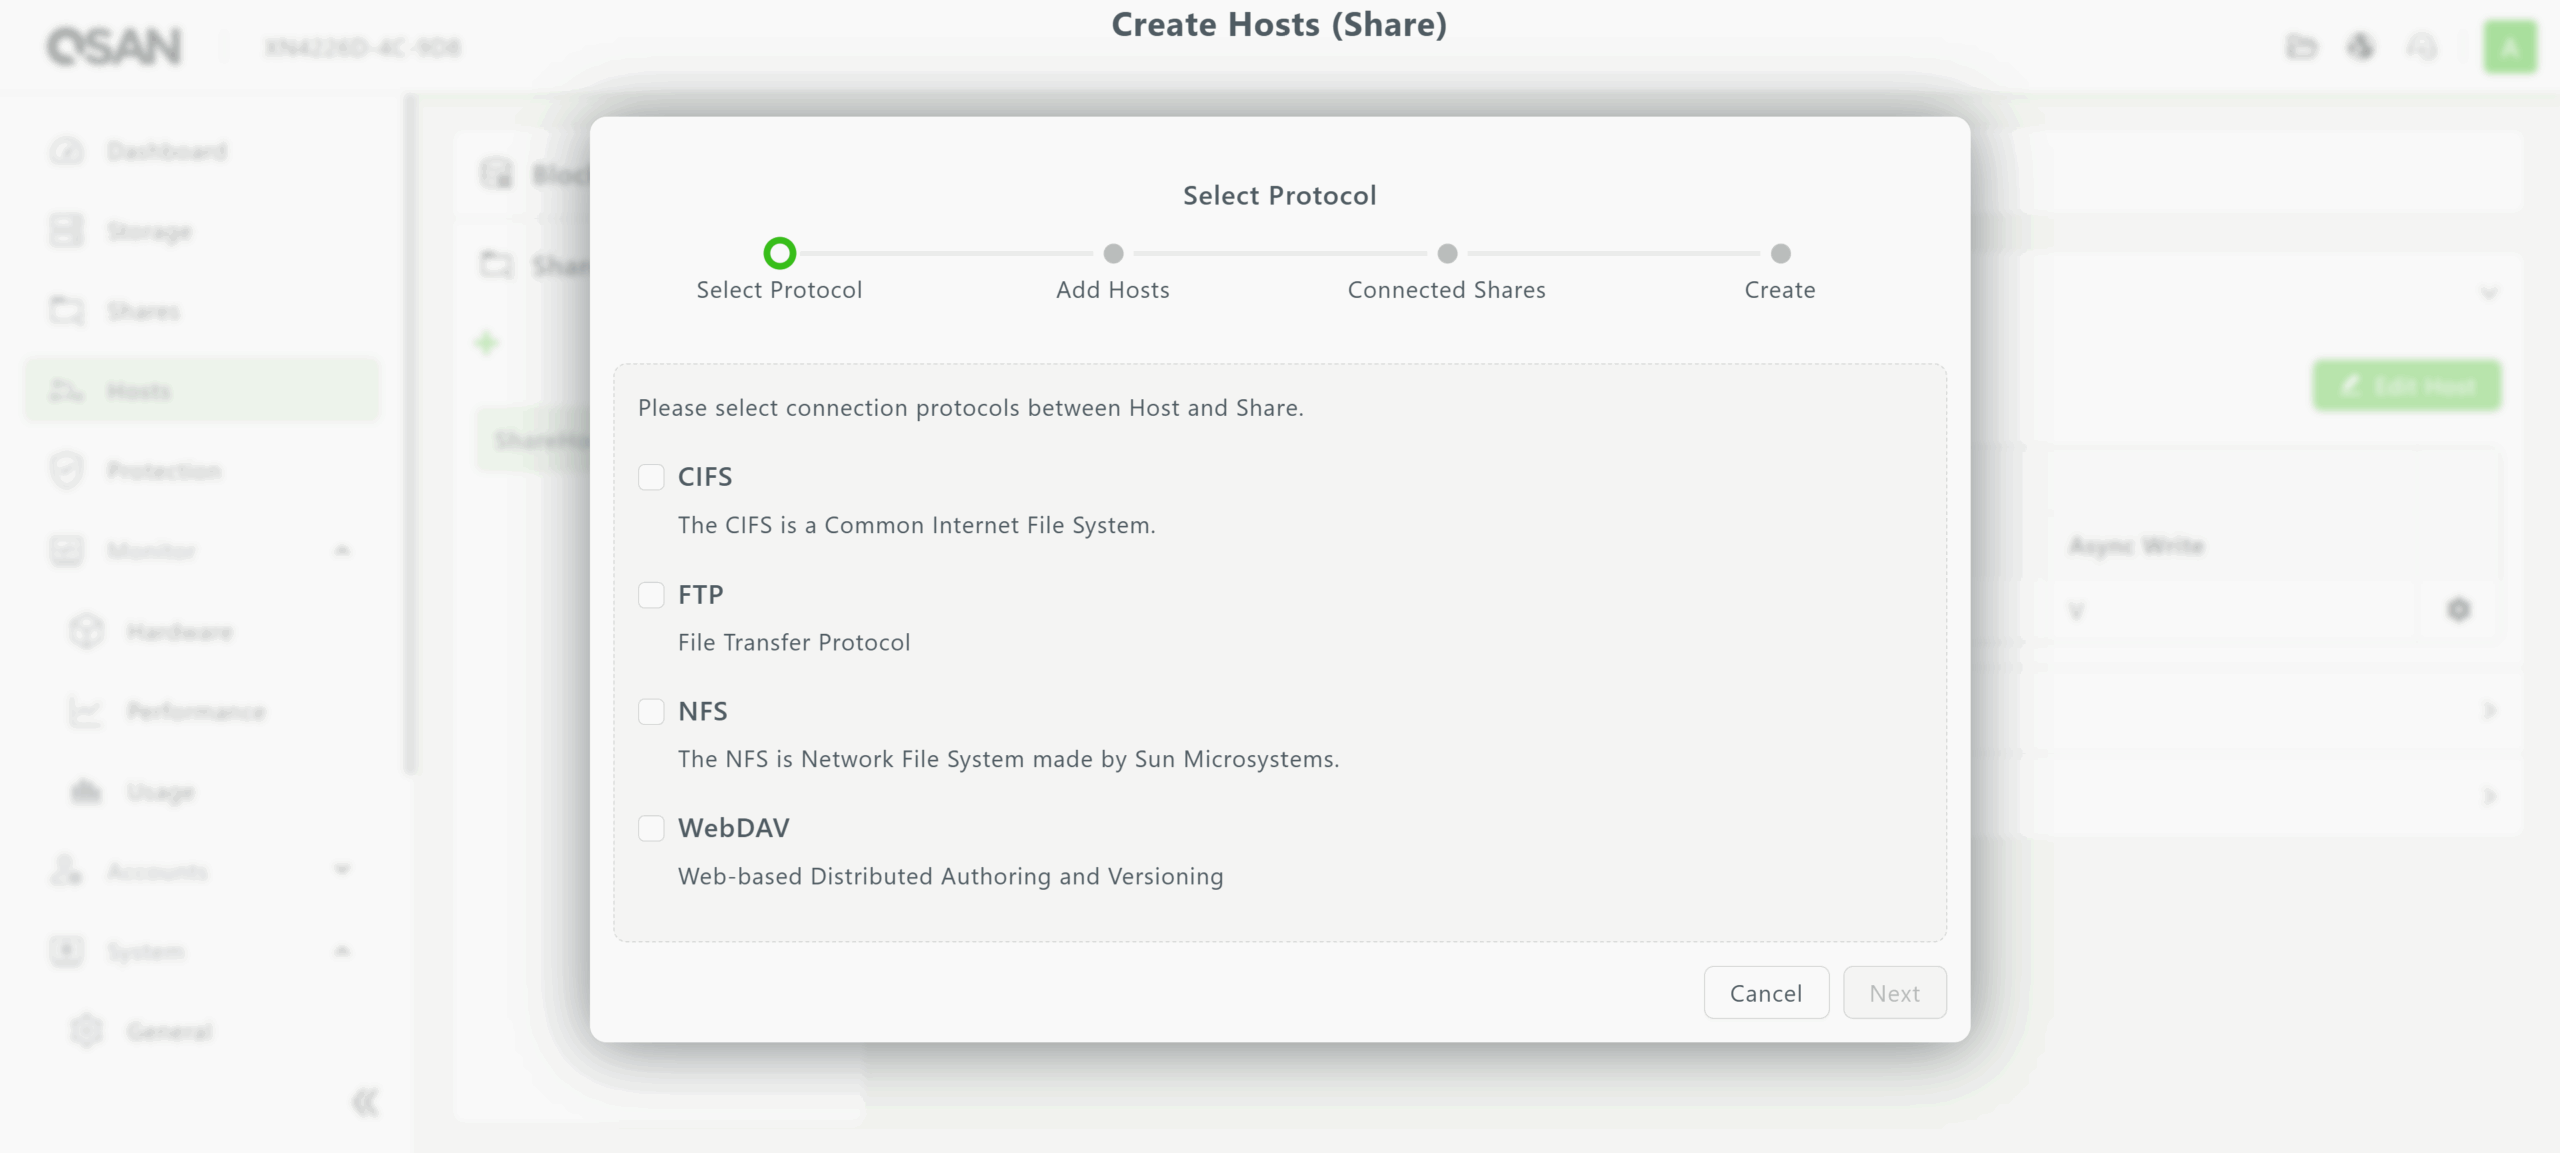
Hosts for block storage can utilize iSCSI, FCP, or NVMe-oF over TCP for a volume. In contrast, hosts for file (share) storage can support multiple protocols simultaneously, offering essential flexibility for data centers with diverse file-sharing requirements.
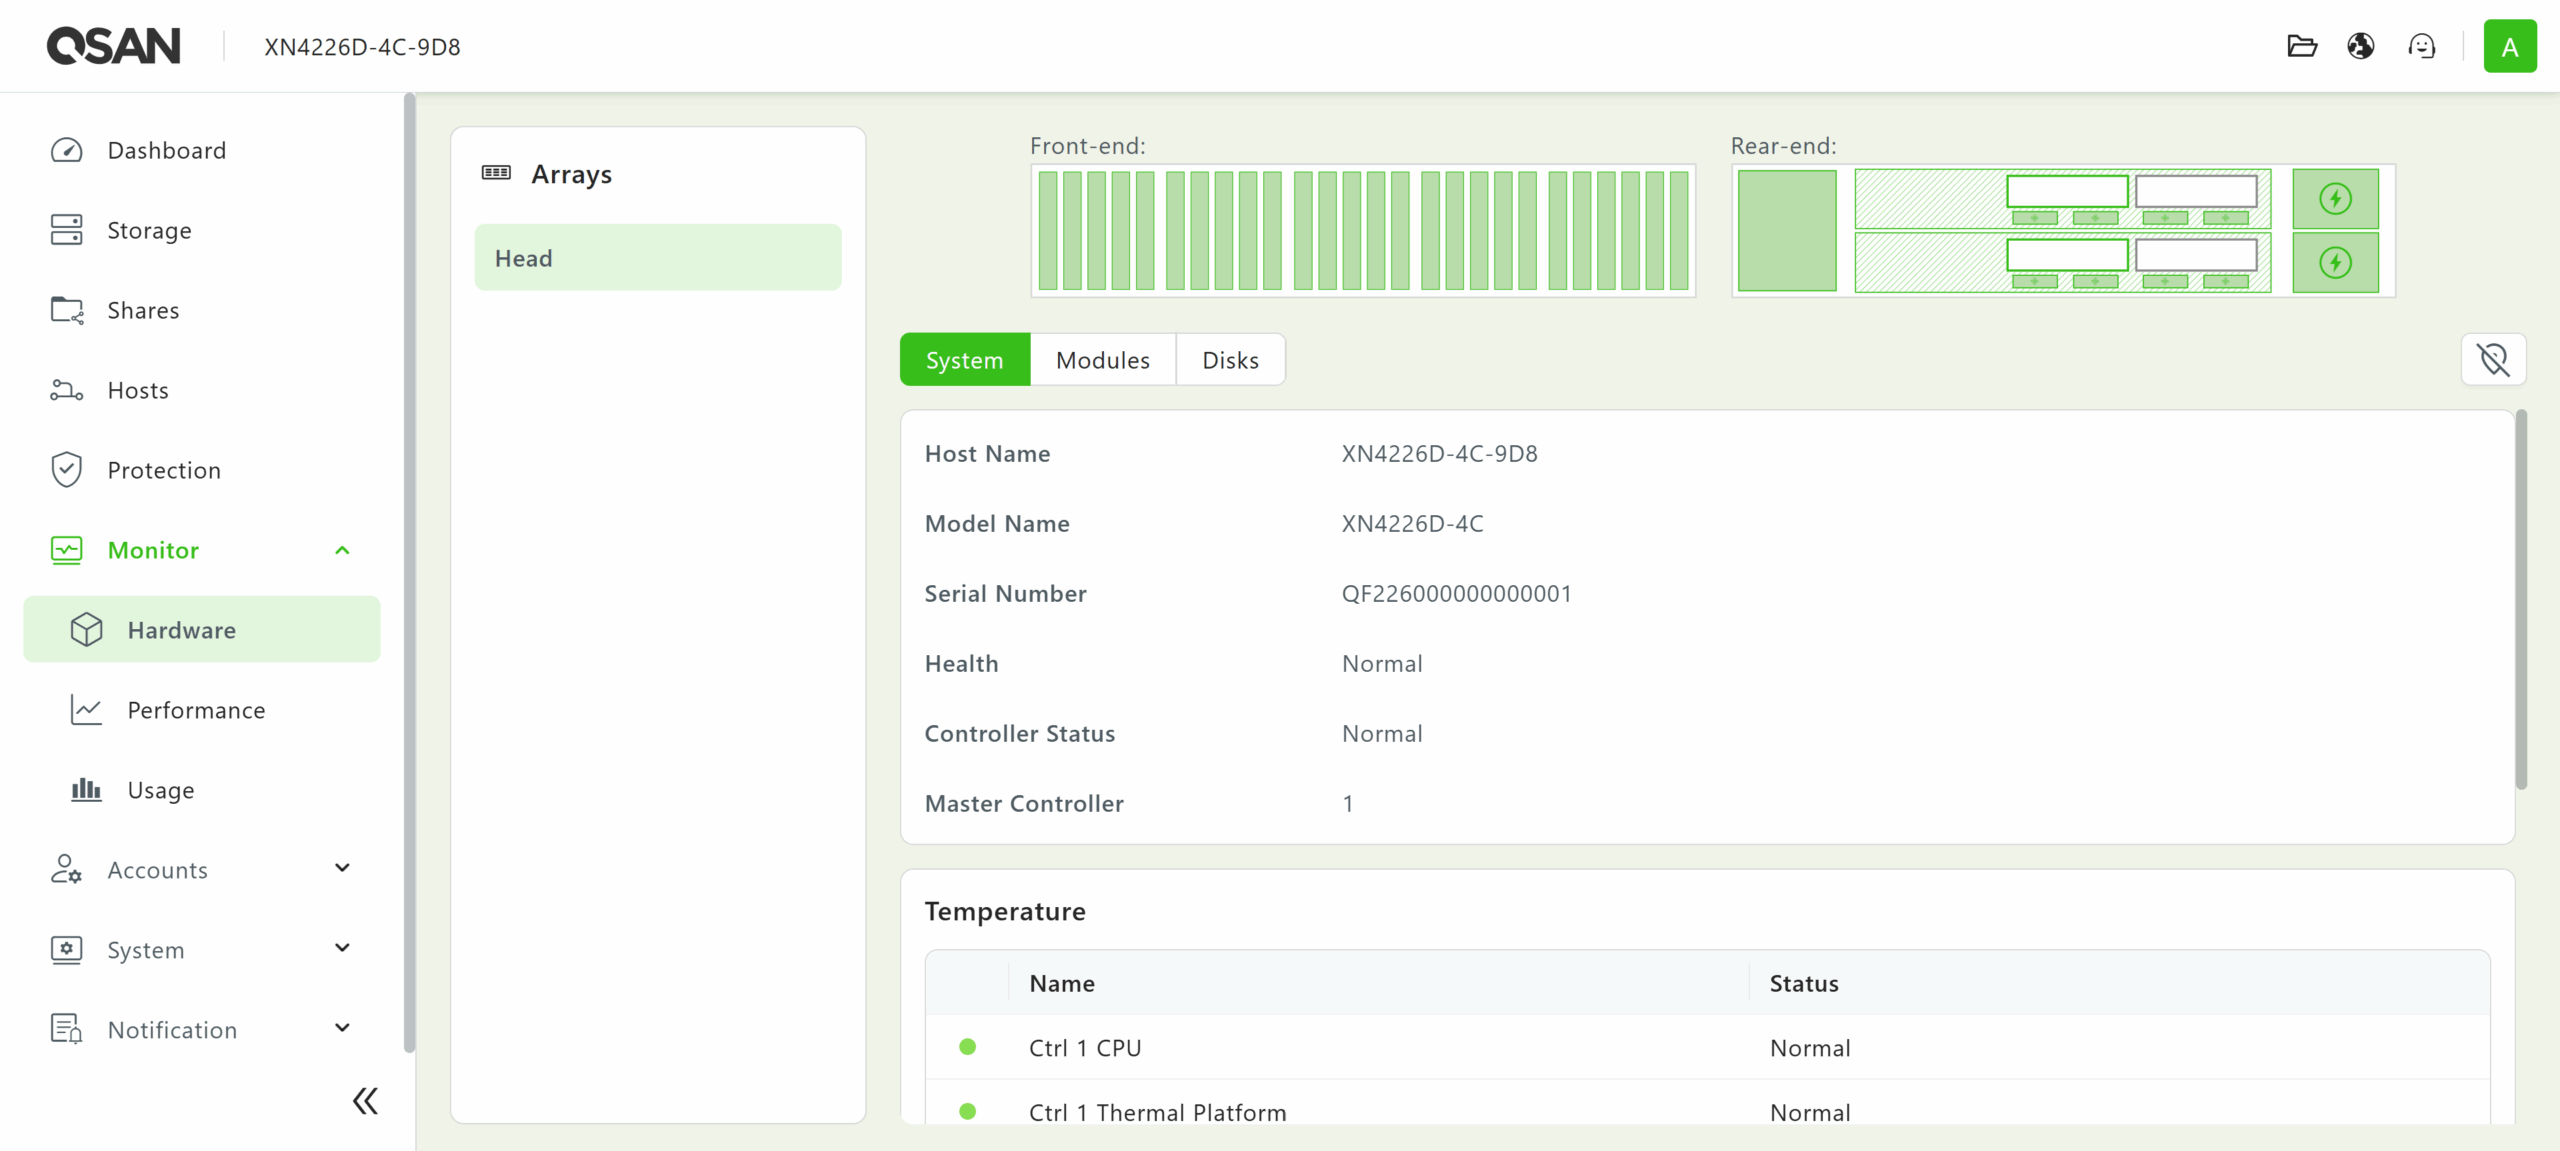
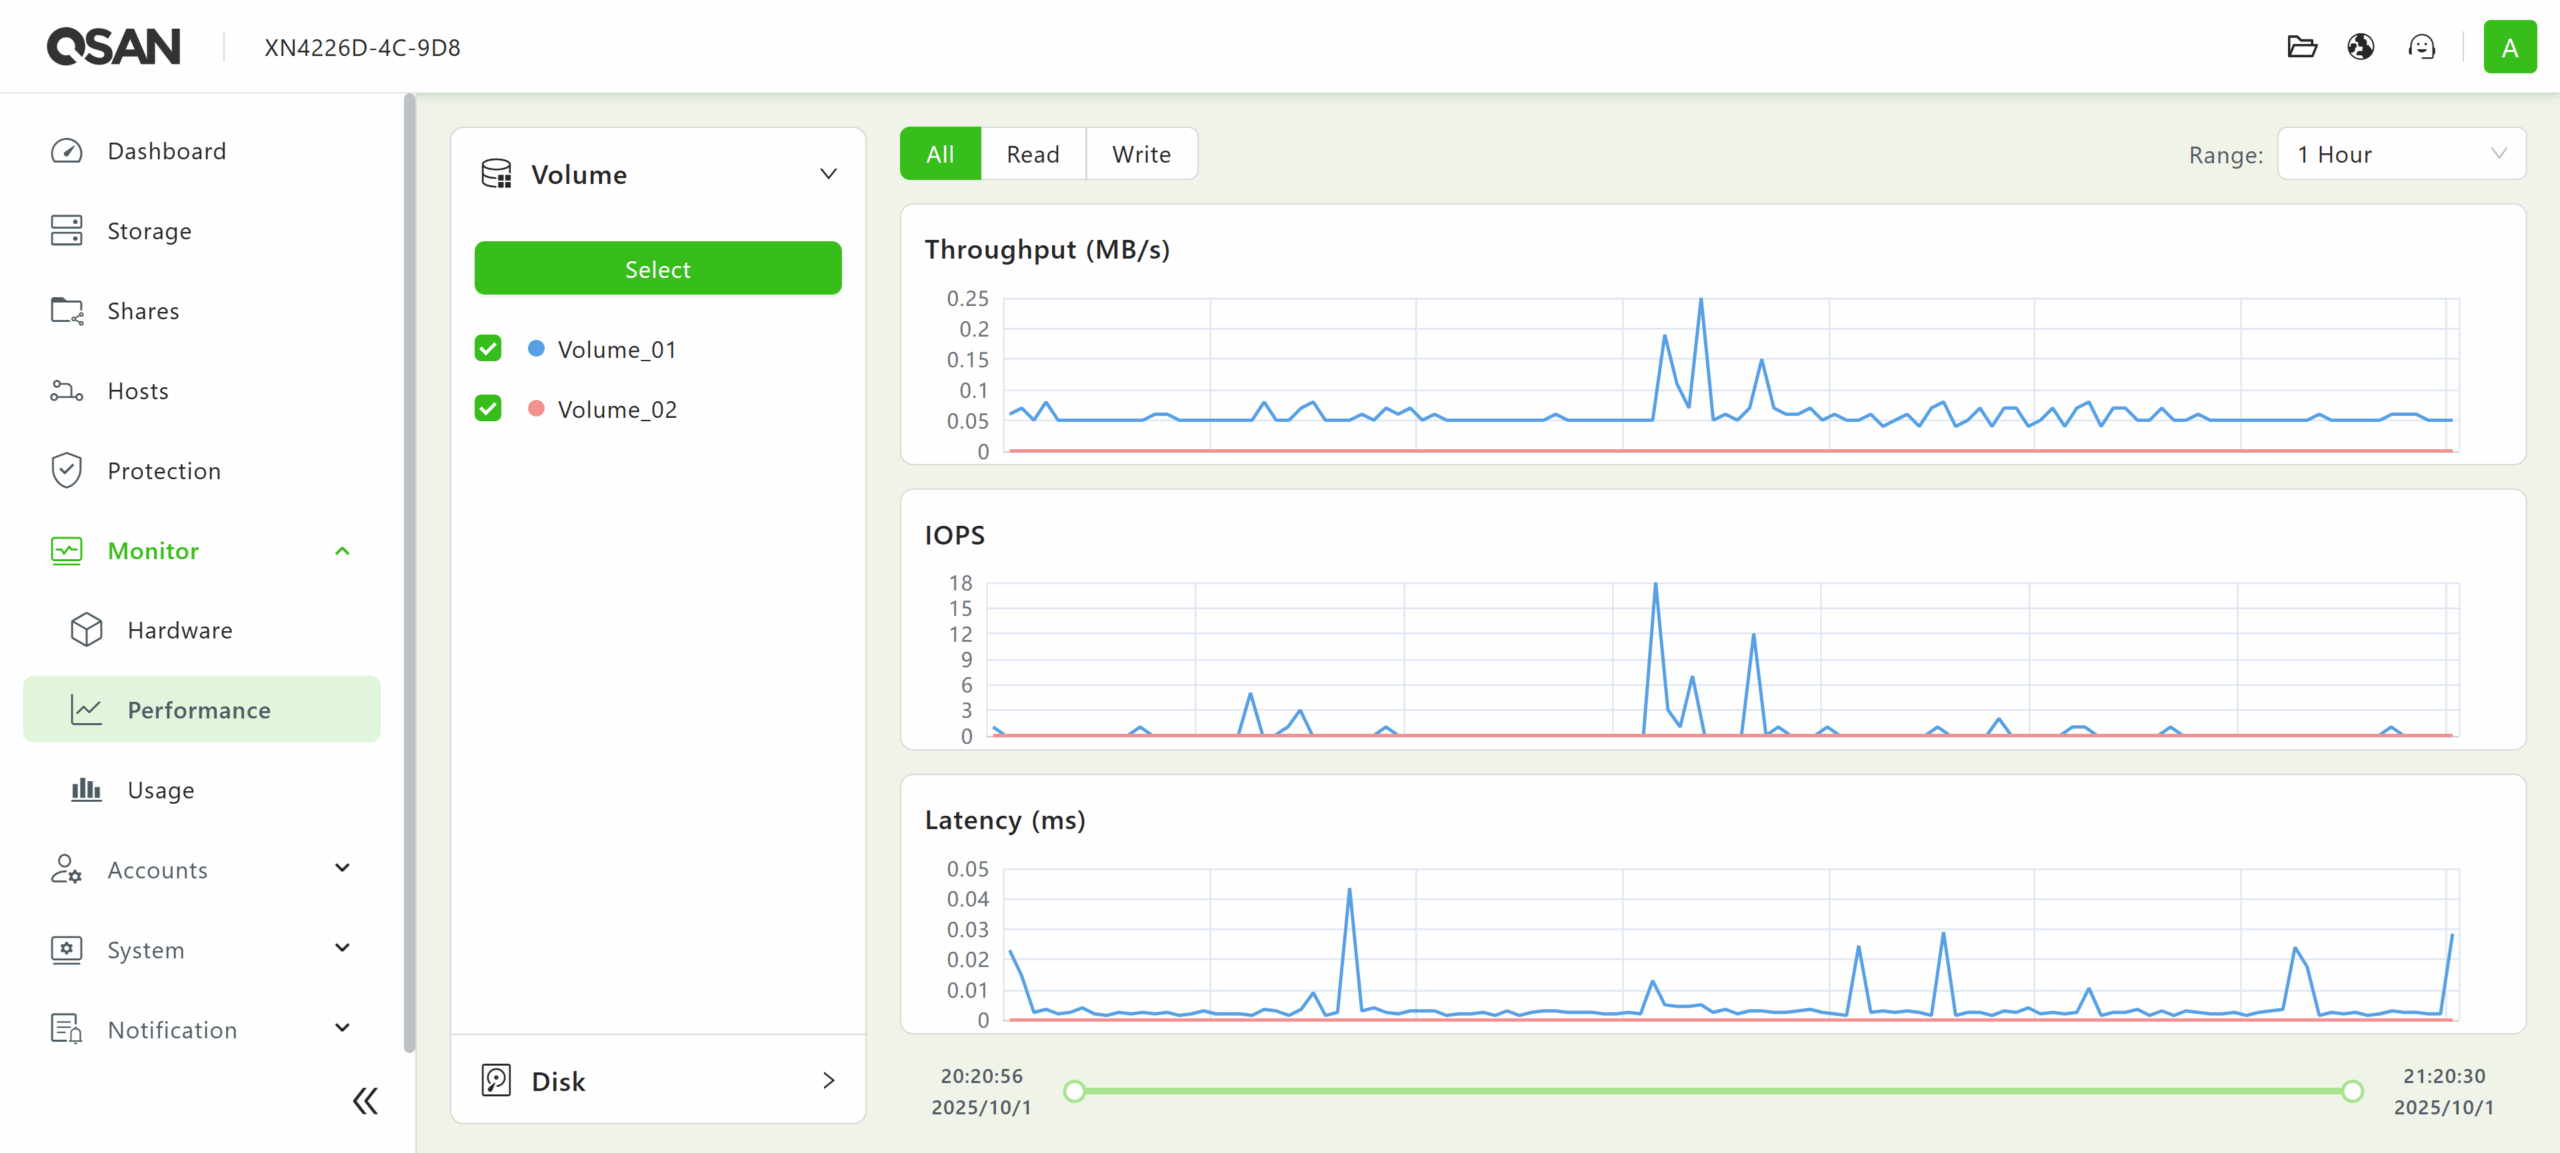
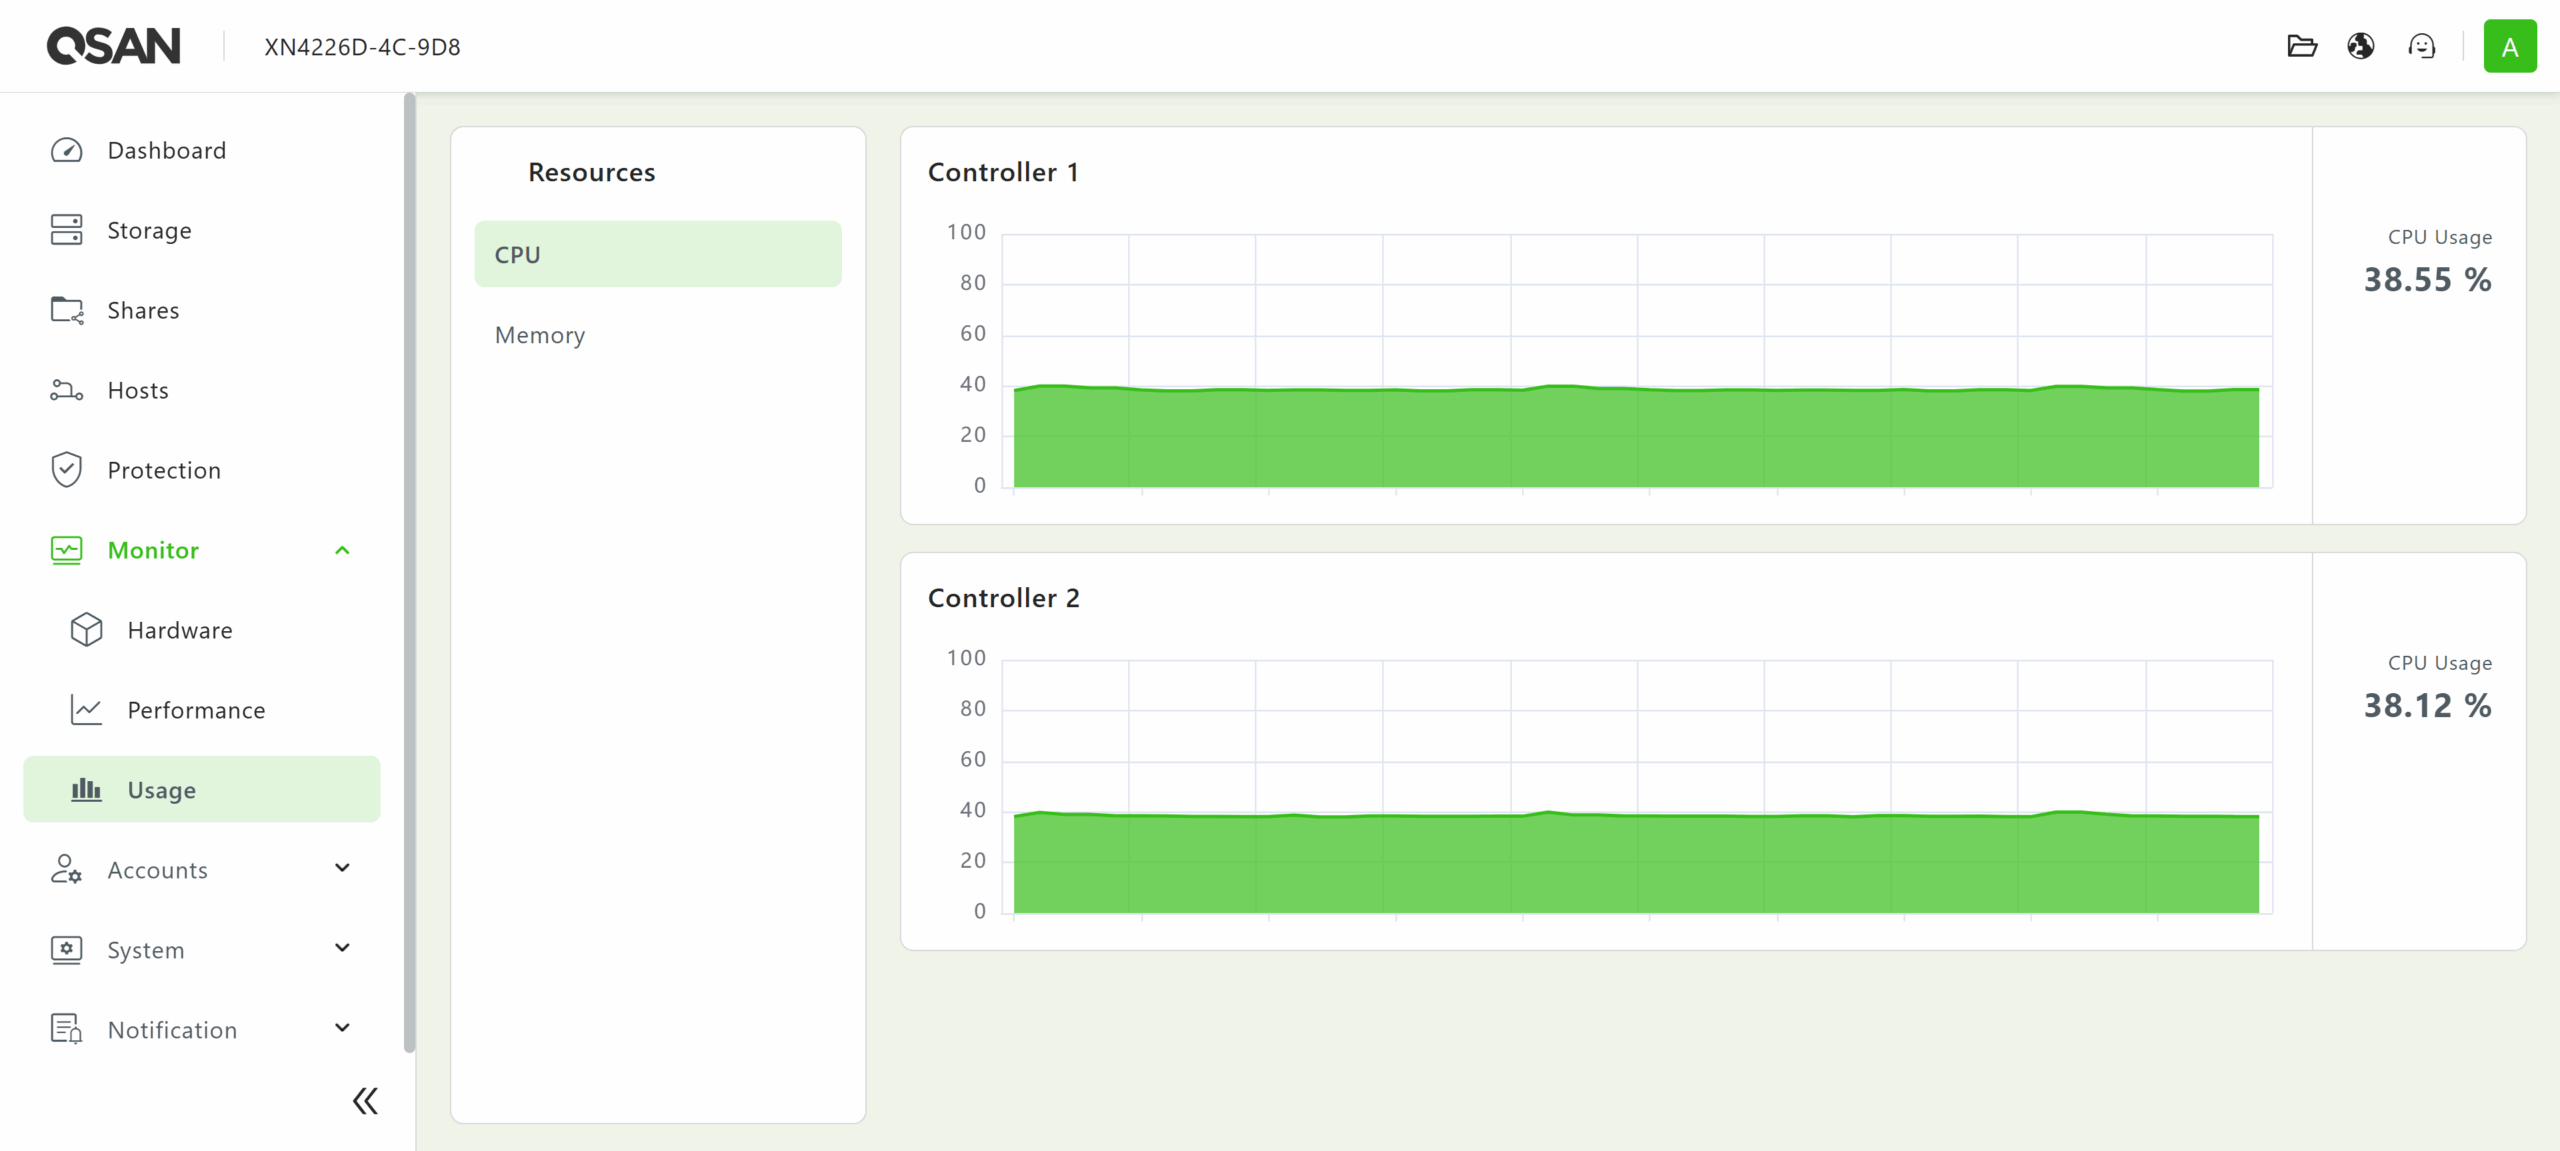
QSM 4 also provides basic monitoring capabilities in the Monitor menu, displaying the statuses of various hardware modules and drives within the array, as well as statistics for drive, storage pool, CPU, and memory usage.
The QSM 4 web UI also features user, group, and domain management under the Accounts menu. There are also various SAN-wide configuration options available in the System menu. Logging and alert functionality are accessible from the Notification menu. Lastly, the QSAN File Manager, Language Support, and Sign-out/Power Management icons can be found in the top right corner of the menu bar.![]()
Simple Proxmox Integration
Proxmox natively supports NVMe over Fabrics (NVMe-oF), allowing for easy integration of high-performance storage arrays into a cluster. The process begins by provisioning NVMe-oF targets on your storage system. Then, use the Proxmox host to discover and connect to those targets. Once connected, you need to configure the system to ensure that these connections persist after reboots.
In our example, discovery is performed using shell commands, which specify the IP address and service port of the array.
nvme discover -t tcp -a 172.16.16.100 -s 4420
nvme discover -t tcp -a 172.13.13.100 -s 4420
Next, connect to the provisioned namespaces by referencing their NQNs.
nvme connect -t tcp -n nqn.2024-11.com.qsan:dev4 -a 172.16.16.100 -s 4420
nvme connect -t tcp -n nqn.2024-11.com.qsan:dev6 -a 172.13.13.100 -s 4420
To ensure the configuration is persistent through reboots, the discovery addresses can be appended to the NVMe discovery configuration file.
echo "discover -t tcp -a 172.16.16.100 -s 4420" | tee -a /etc/nvme/discovery.conf
echo "discover -t tcp -a 172.13.13.100 -s 4420" | tee -a /etc/nvme/discovery.conf
Finally, enable the auto-connect service so that Proxmox re-establishes the NVMe sessions automatically at startup.
systemctl enable nvmf-autoconnect.serviceProxmox can be seamlessly integrated with QSAN storage, delivering the low-latency, high-bandwidth performance of NVMe alongside the flexibility of networked fabrics.
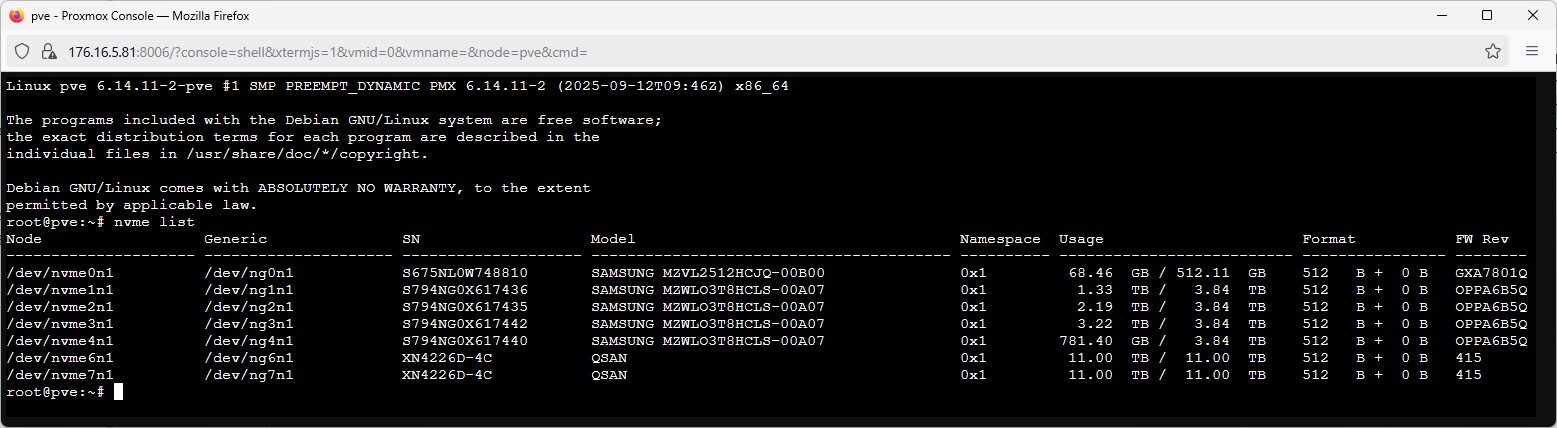
After attaching our QSAN, we can issue the “nvme list” command from the Proxmox shell to display all NVMe devices, where the newly added QSAN volumes appear as /dev/nvme6n1 and /dev/nvme7n1, each with 11TB of storage.
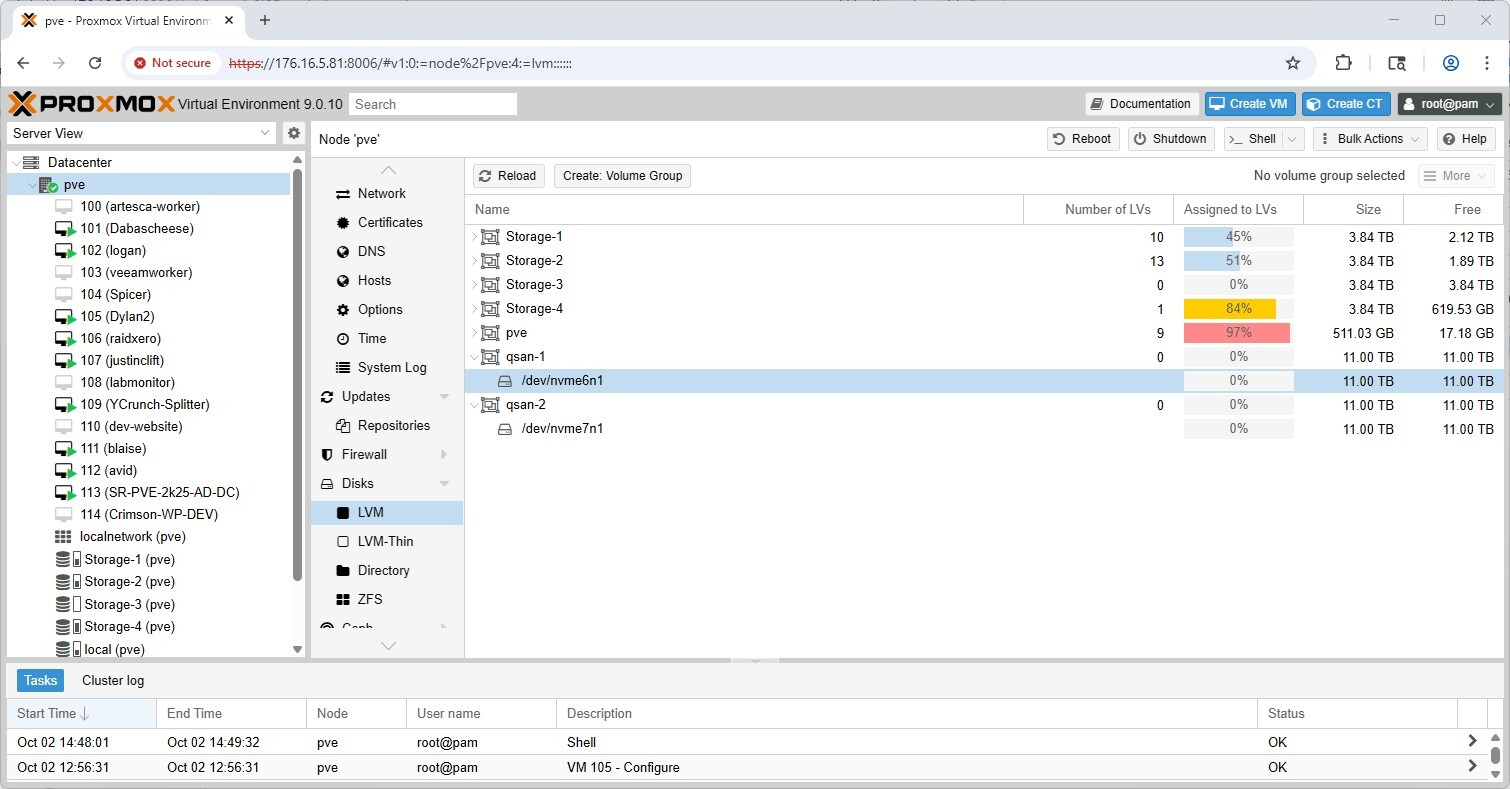
Once the QSAN storage is visible in the Proxmox GUI, we can create a new LVM volume group: pve > Disks > LVM, the two 11TB devices (/dev/nvme6n1 and /dev/nvme7n1) appear and can be initialized as separate volume groups (e.g., qsan-1 and qsan-2) for use with VMs and containers.
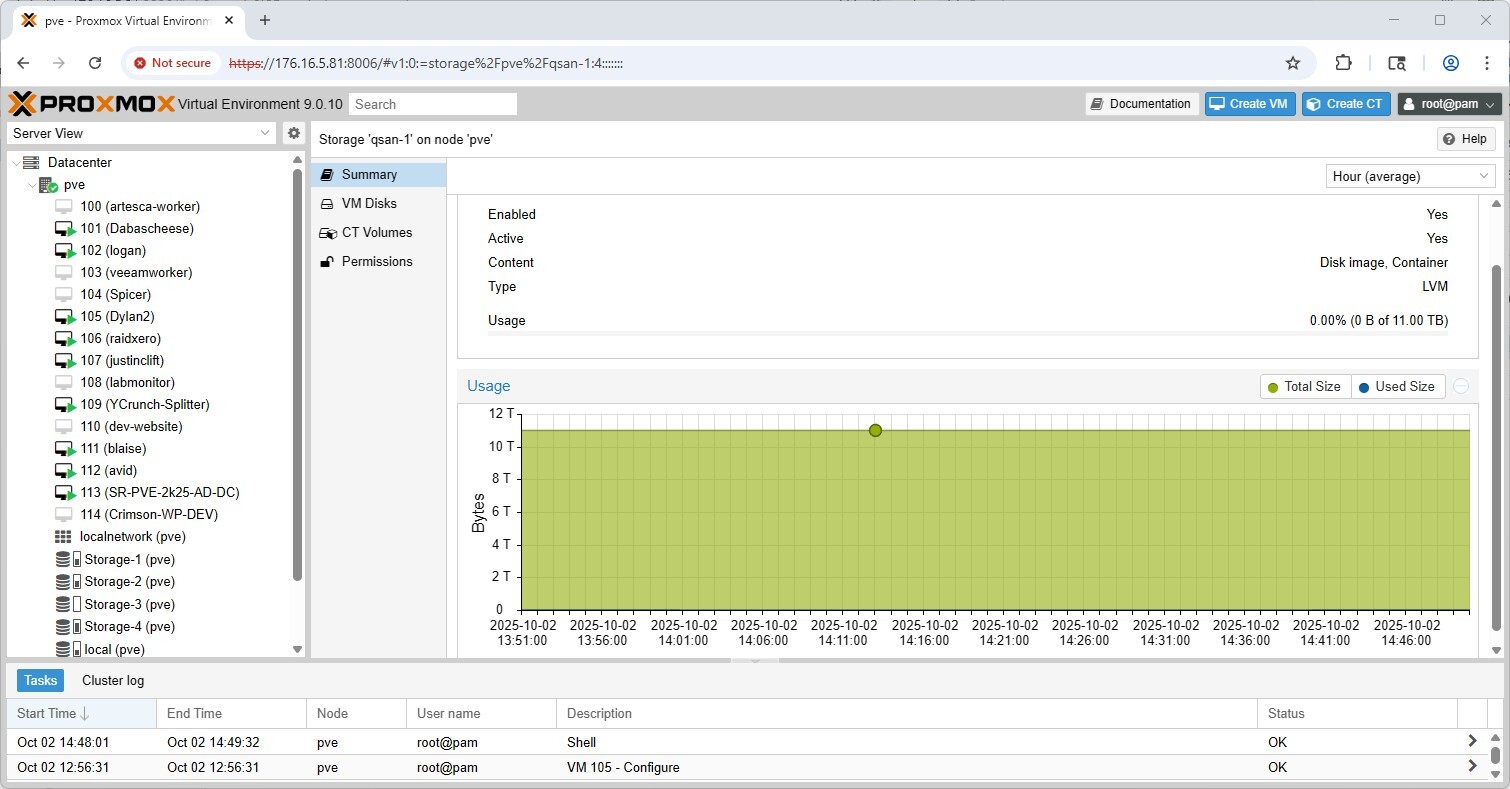
Clicking on one of our new LVM pools (qsan-1) in the storage pane illustrates that it is online, enabled, and available for use, with the full 11TB capacity, and ready for VM and container provisioning.
Performance Testing
We tested the QSAN XN4226D in two environments, leveraging different test platforms. Our first environment was built around a Dell PowerEdge R750, equipped with 4 NVIDIA ConnectX-5 dual-port 25G NICs. We direct-attached the QSAN XN4226D to this server using eight DAC cables. This setup used all available network ports on the QSAN, allowing us to showcase its highest peak performance.
For the FIO test, we utilized two RAID6 storage pools, creating eight block volumes that were evenly distributed across both controllers. Each volume was assigned to a unique target, dedicating a single IP address to each volume. We measured both NVMe-oF RDMA and TCP on this platform.
The second environment for GDSIO leveraged a Dell PowerEdge R7715, equipped with two NVIDIA H100 GPUs, and a quad-port Broadcom 25G NIC. In this environment, we maintained the same QSAN volume layout, although we reduced the number of volumes from eight to four. With a quad-port NIC, we used four 25G connections to direct-attach the server to the storage array.
FIO Performance Benchmark
To measure the storage performance of the QSAN XN4226D, we applied common industry metrics and utilized the FIO tool. Each storage device undergoes the same testing process, which includes a preconditioning step involving two full drive fills with a sequential write workload, followed by measurement of steady-state performance. As each workload type being measured changes, we run another preconditioning fill of that new transfer size.
In this section, we focus on the following FIO benchmarks:
- 1M Sequential
- 64K Random
- 16K Random
- 4K Random
1M Sequential Write Bandwidth
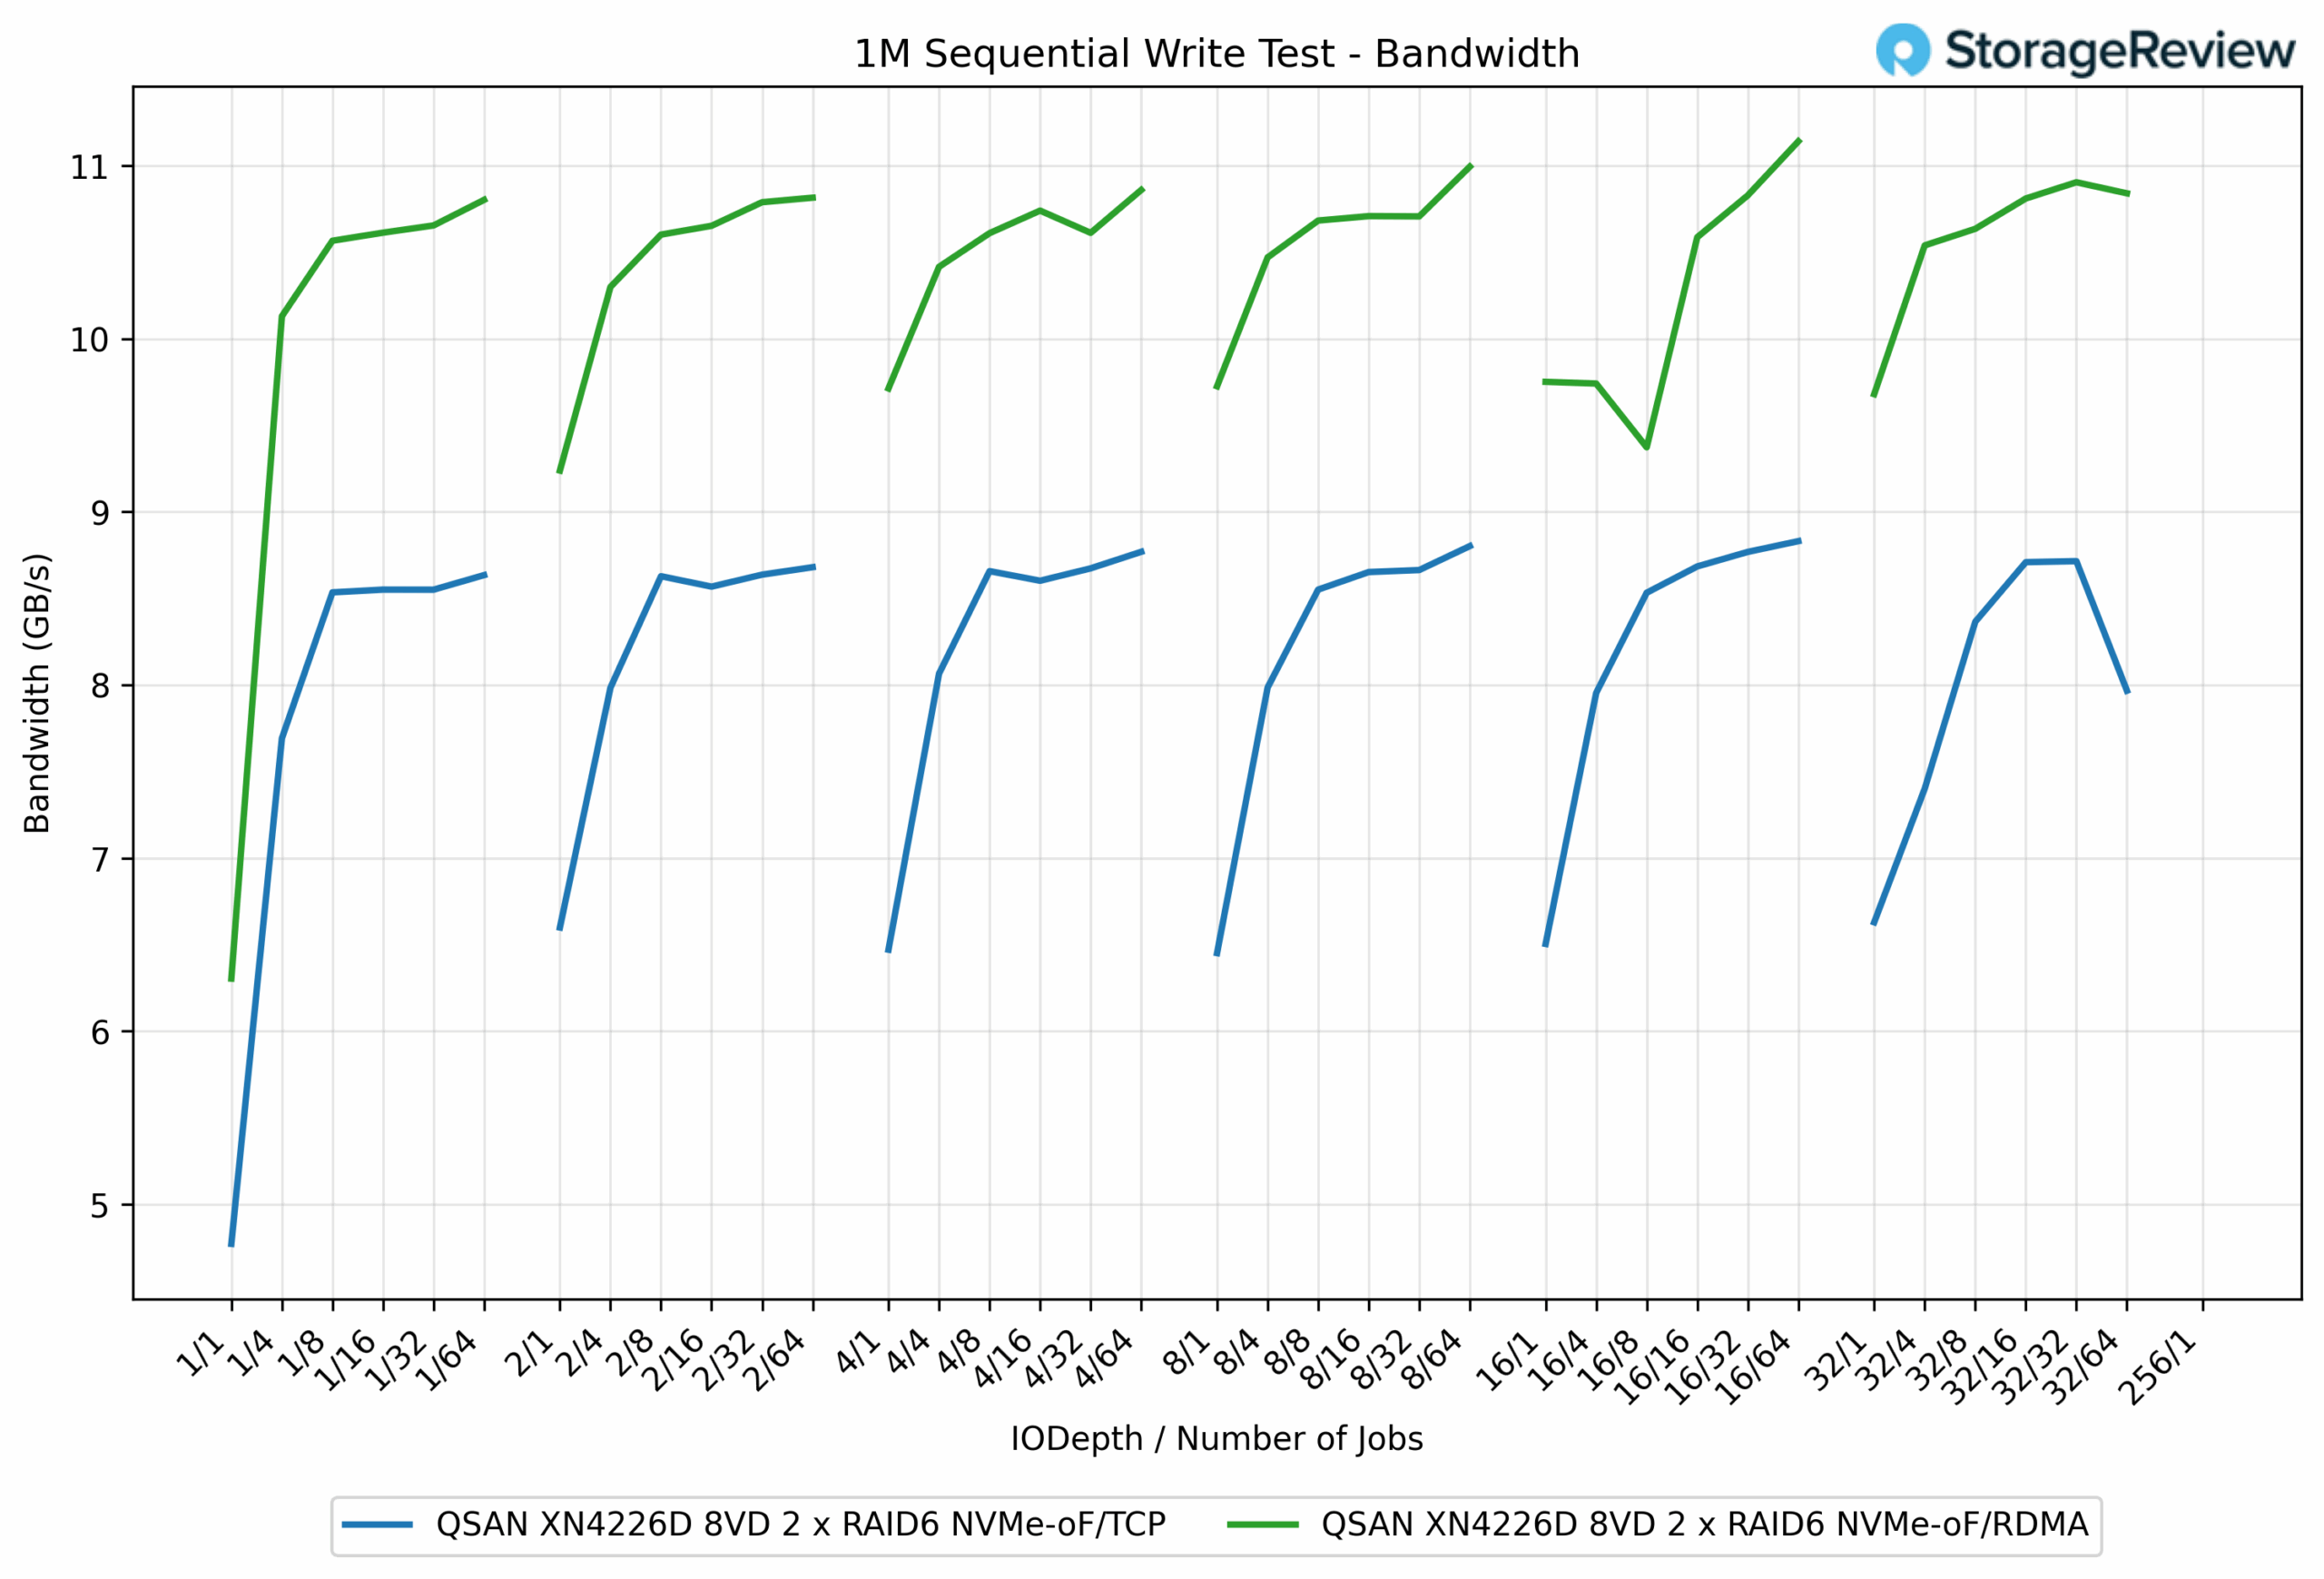
In the 1M Sequential Write test, NVMe over RDMA consistently delivered higher bandwidth across nearly all queue depths and job counts compared to NVMe over TCP. At peak, RDMA achieved 11.14GB/s, while TCP topped out at 8.83GB/s, a difference of roughly 26% in favor of RDMA. Even at lower queue depths, RDMA maintained its edge. For example, at the QD1/1 job, it posted 6.30GB/s, outpacing TCP’s 4.77GB/s by approximately 32%.
The performance gap between the two protocols narrowed somewhat as workloads scaled, but RDMA still demonstrated a clear advantage throughout. TCP consistently hovered in the 8.5 to 8.8GB/s range across multiple test points, while RDMA frequently pushed past the 10.5GB/s mark, peaking just over 11GB/s.
1M Sequential Write Latency
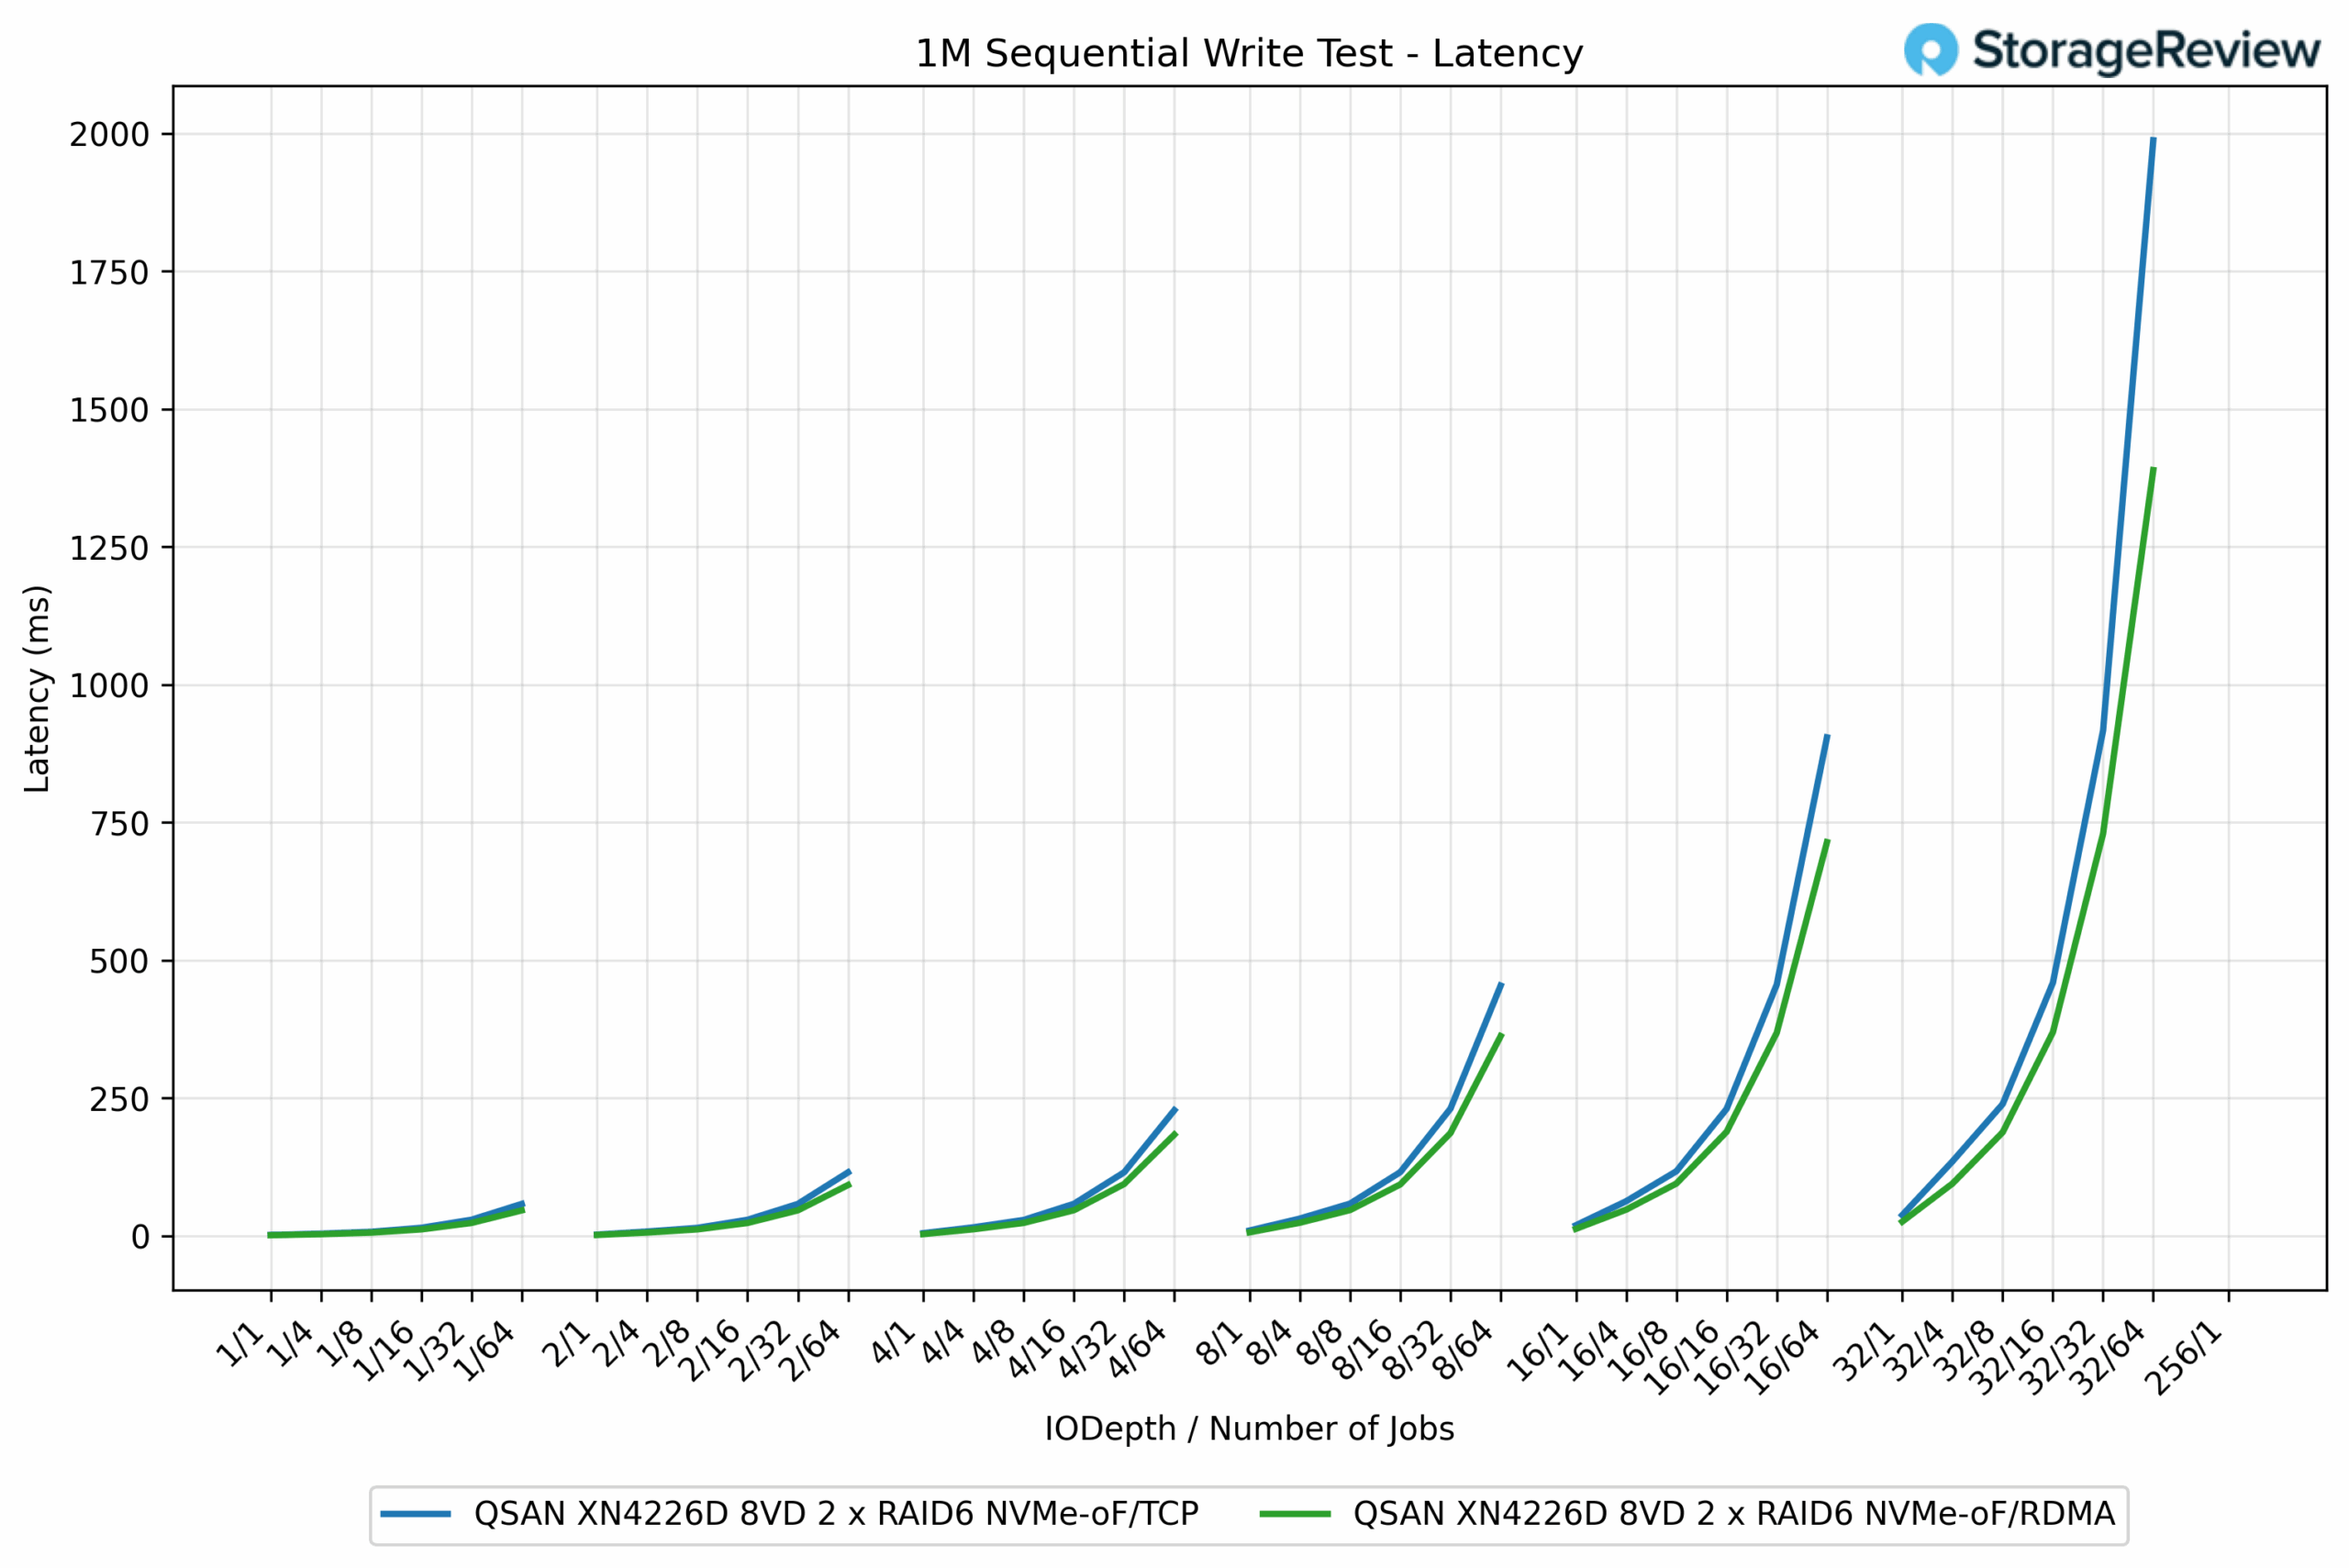
In the 1M Sequential Write latency test, RDMA again maintained a clear efficiency advantage over TCP across most queue depths and job counts. At lighter workloads, the two protocols tracked closely together, both showing sub-5ms latencies. However, as concurrency increased, the differences became more apparent. For example, at QD16/16 jobs, RDMA measured 368.48ms, while TCP posted 455.95ms, a 19% improvement for RDMA.
The divergence grew even more significant at extreme scales. At the QD256/1 job, RDMA completed at 1,389.16ms, while TCP climbed to 1,987.39ms, reflecting a 43% latency reduction in favor of RDMA. This trend highlights RDMA’s ability to sustain higher throughput while keeping latency in check, particularly in heavily loaded scenarios.
1M Sequential Read Bandwidth
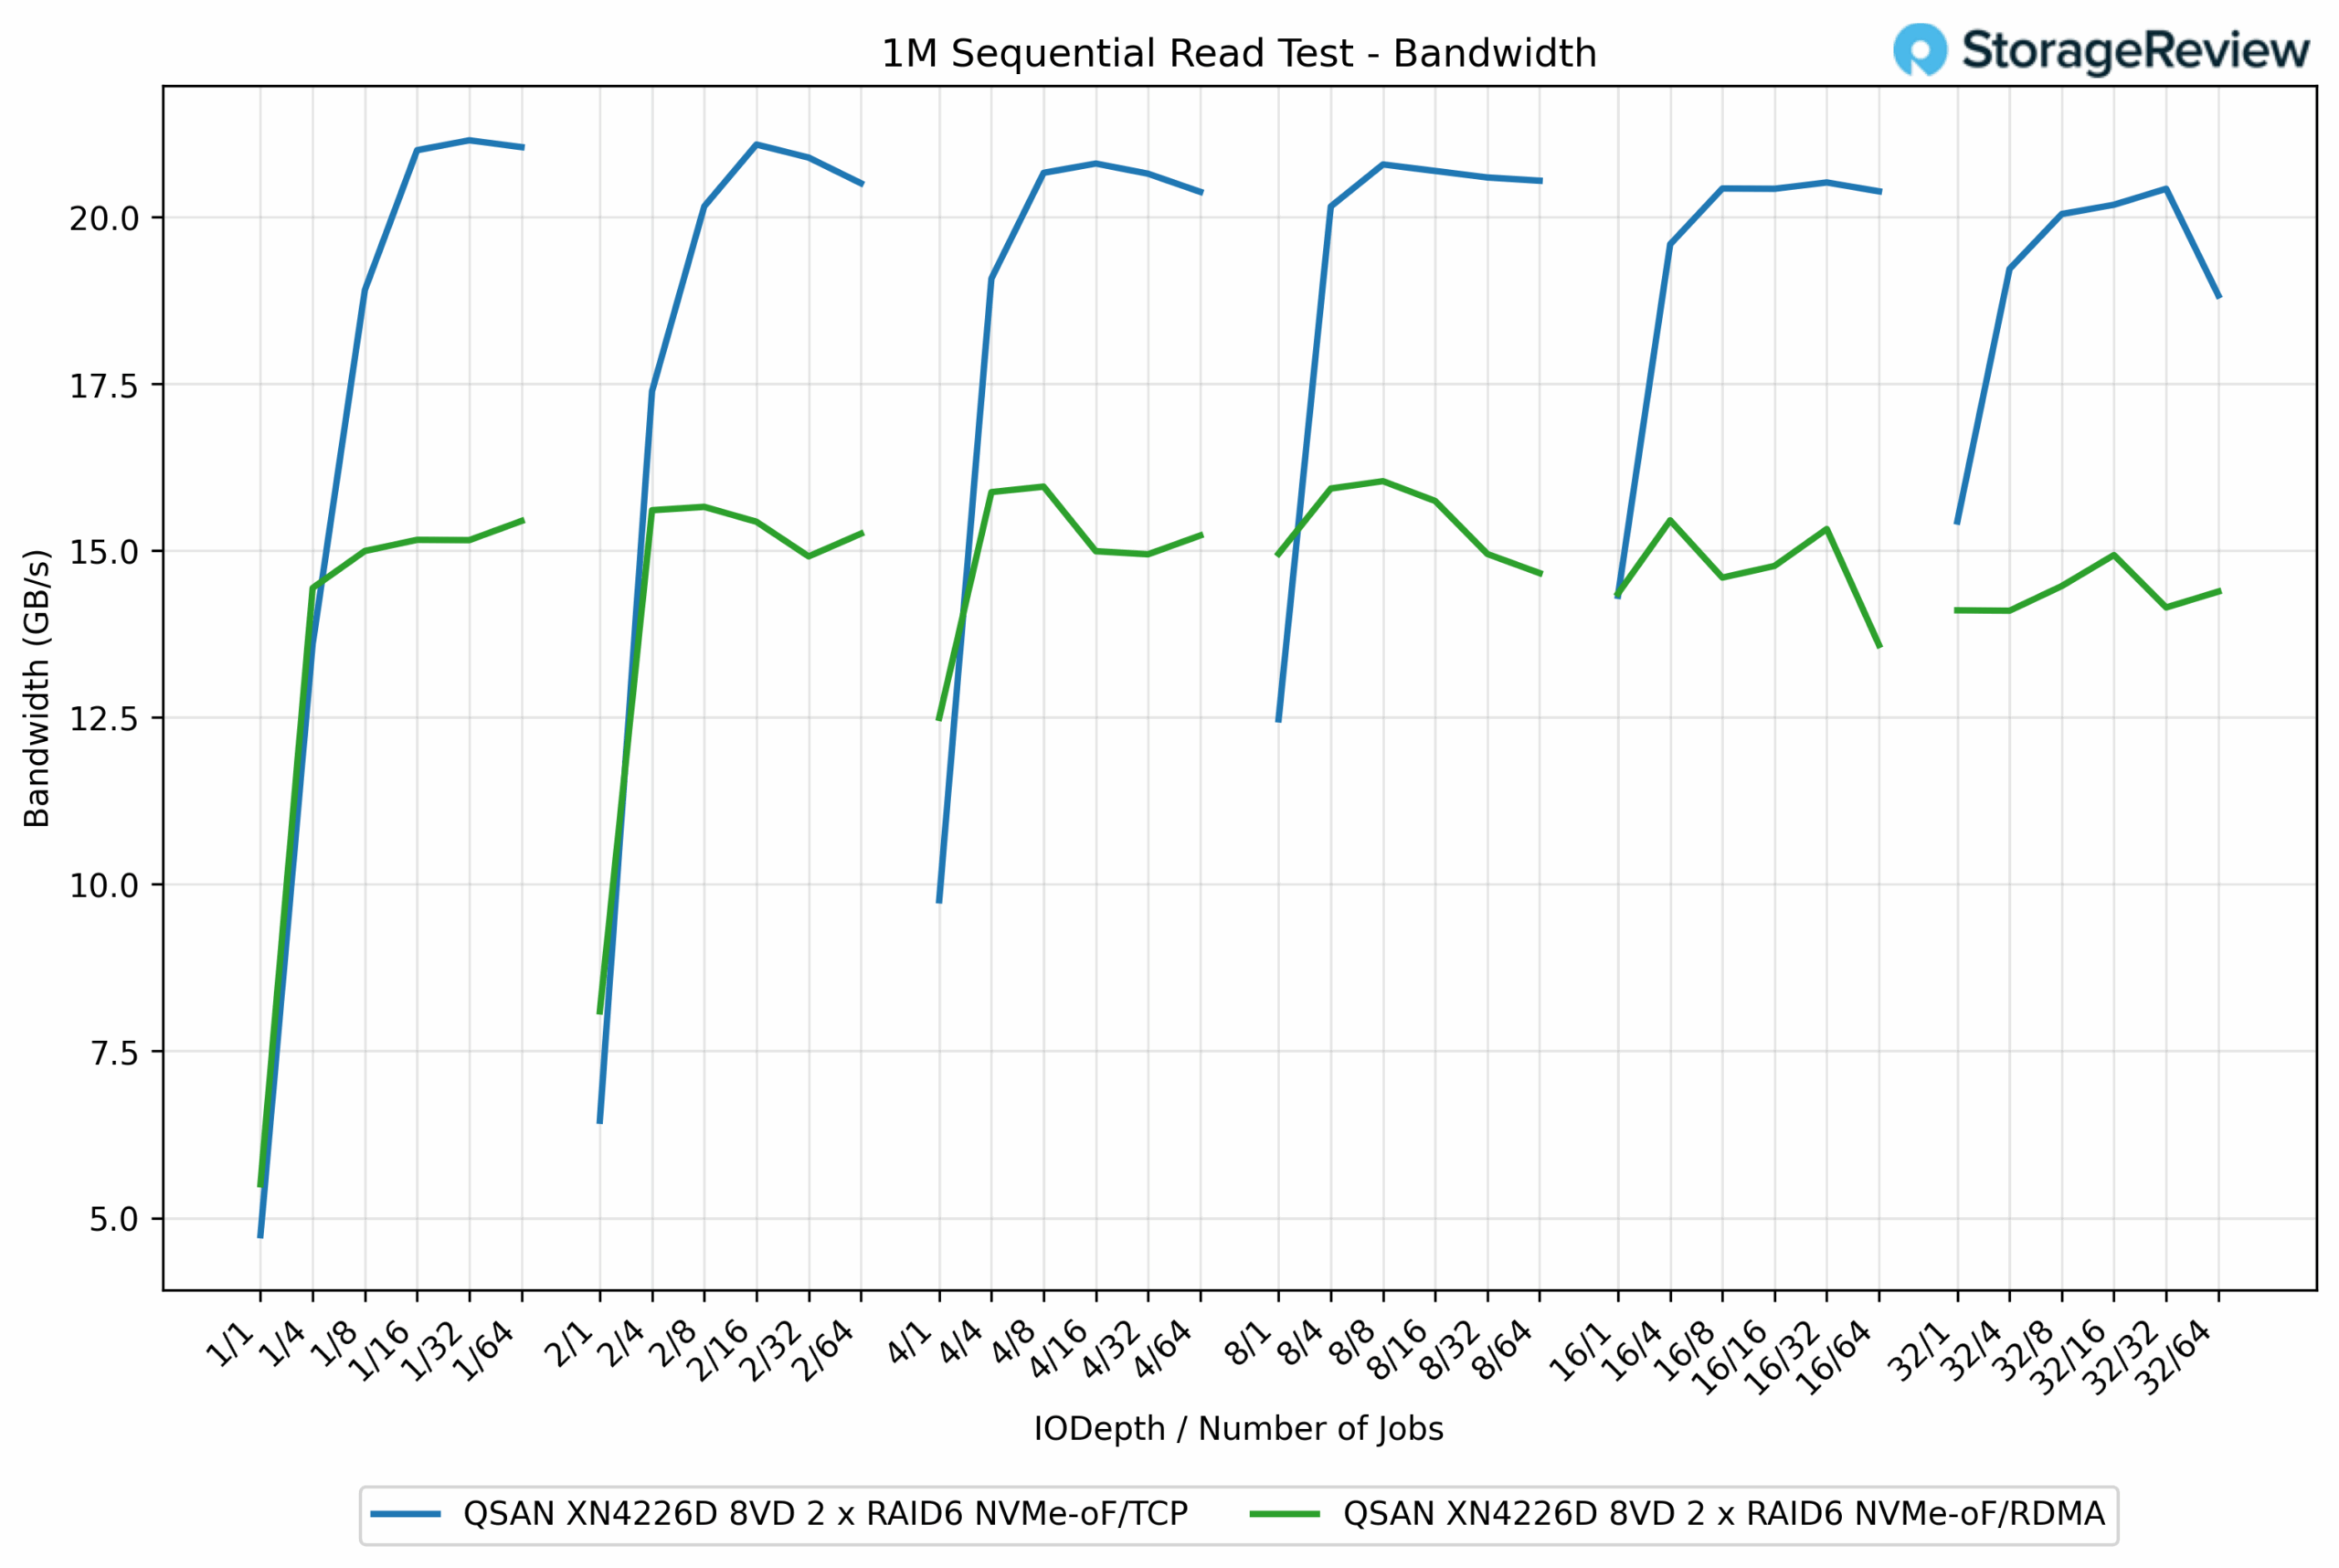
In the 1M Sequential Read test, the performance dynamic shifted, with TCP clearly outperforming RDMA across the board. TCP reached a peak of 21.21GB/s, while RDMA topped out at 15.96GB/s, a difference of roughly 33% in favor of TCP. Even at lower queue depths, TCP surged ahead quickly. For example, at QD1/4 jobs, TCP delivered 18.91GB/s, compared to RDMA’s 15.05GB/s, a gap of more than 25%.
The advantage of TCP was consistent across nearly every workload scale. Once saturation occurred, TCP maintained results in the 20-21GB/s range, while RDMA flattened closer to 15GB/s. This indicates that while RDMA excels in write-heavy and latency-sensitive operations, TCP demonstrates stronger sequential read bandwidth efficiency with the tested RAID6 NVMe configuration.
1M Sequential Read Latency
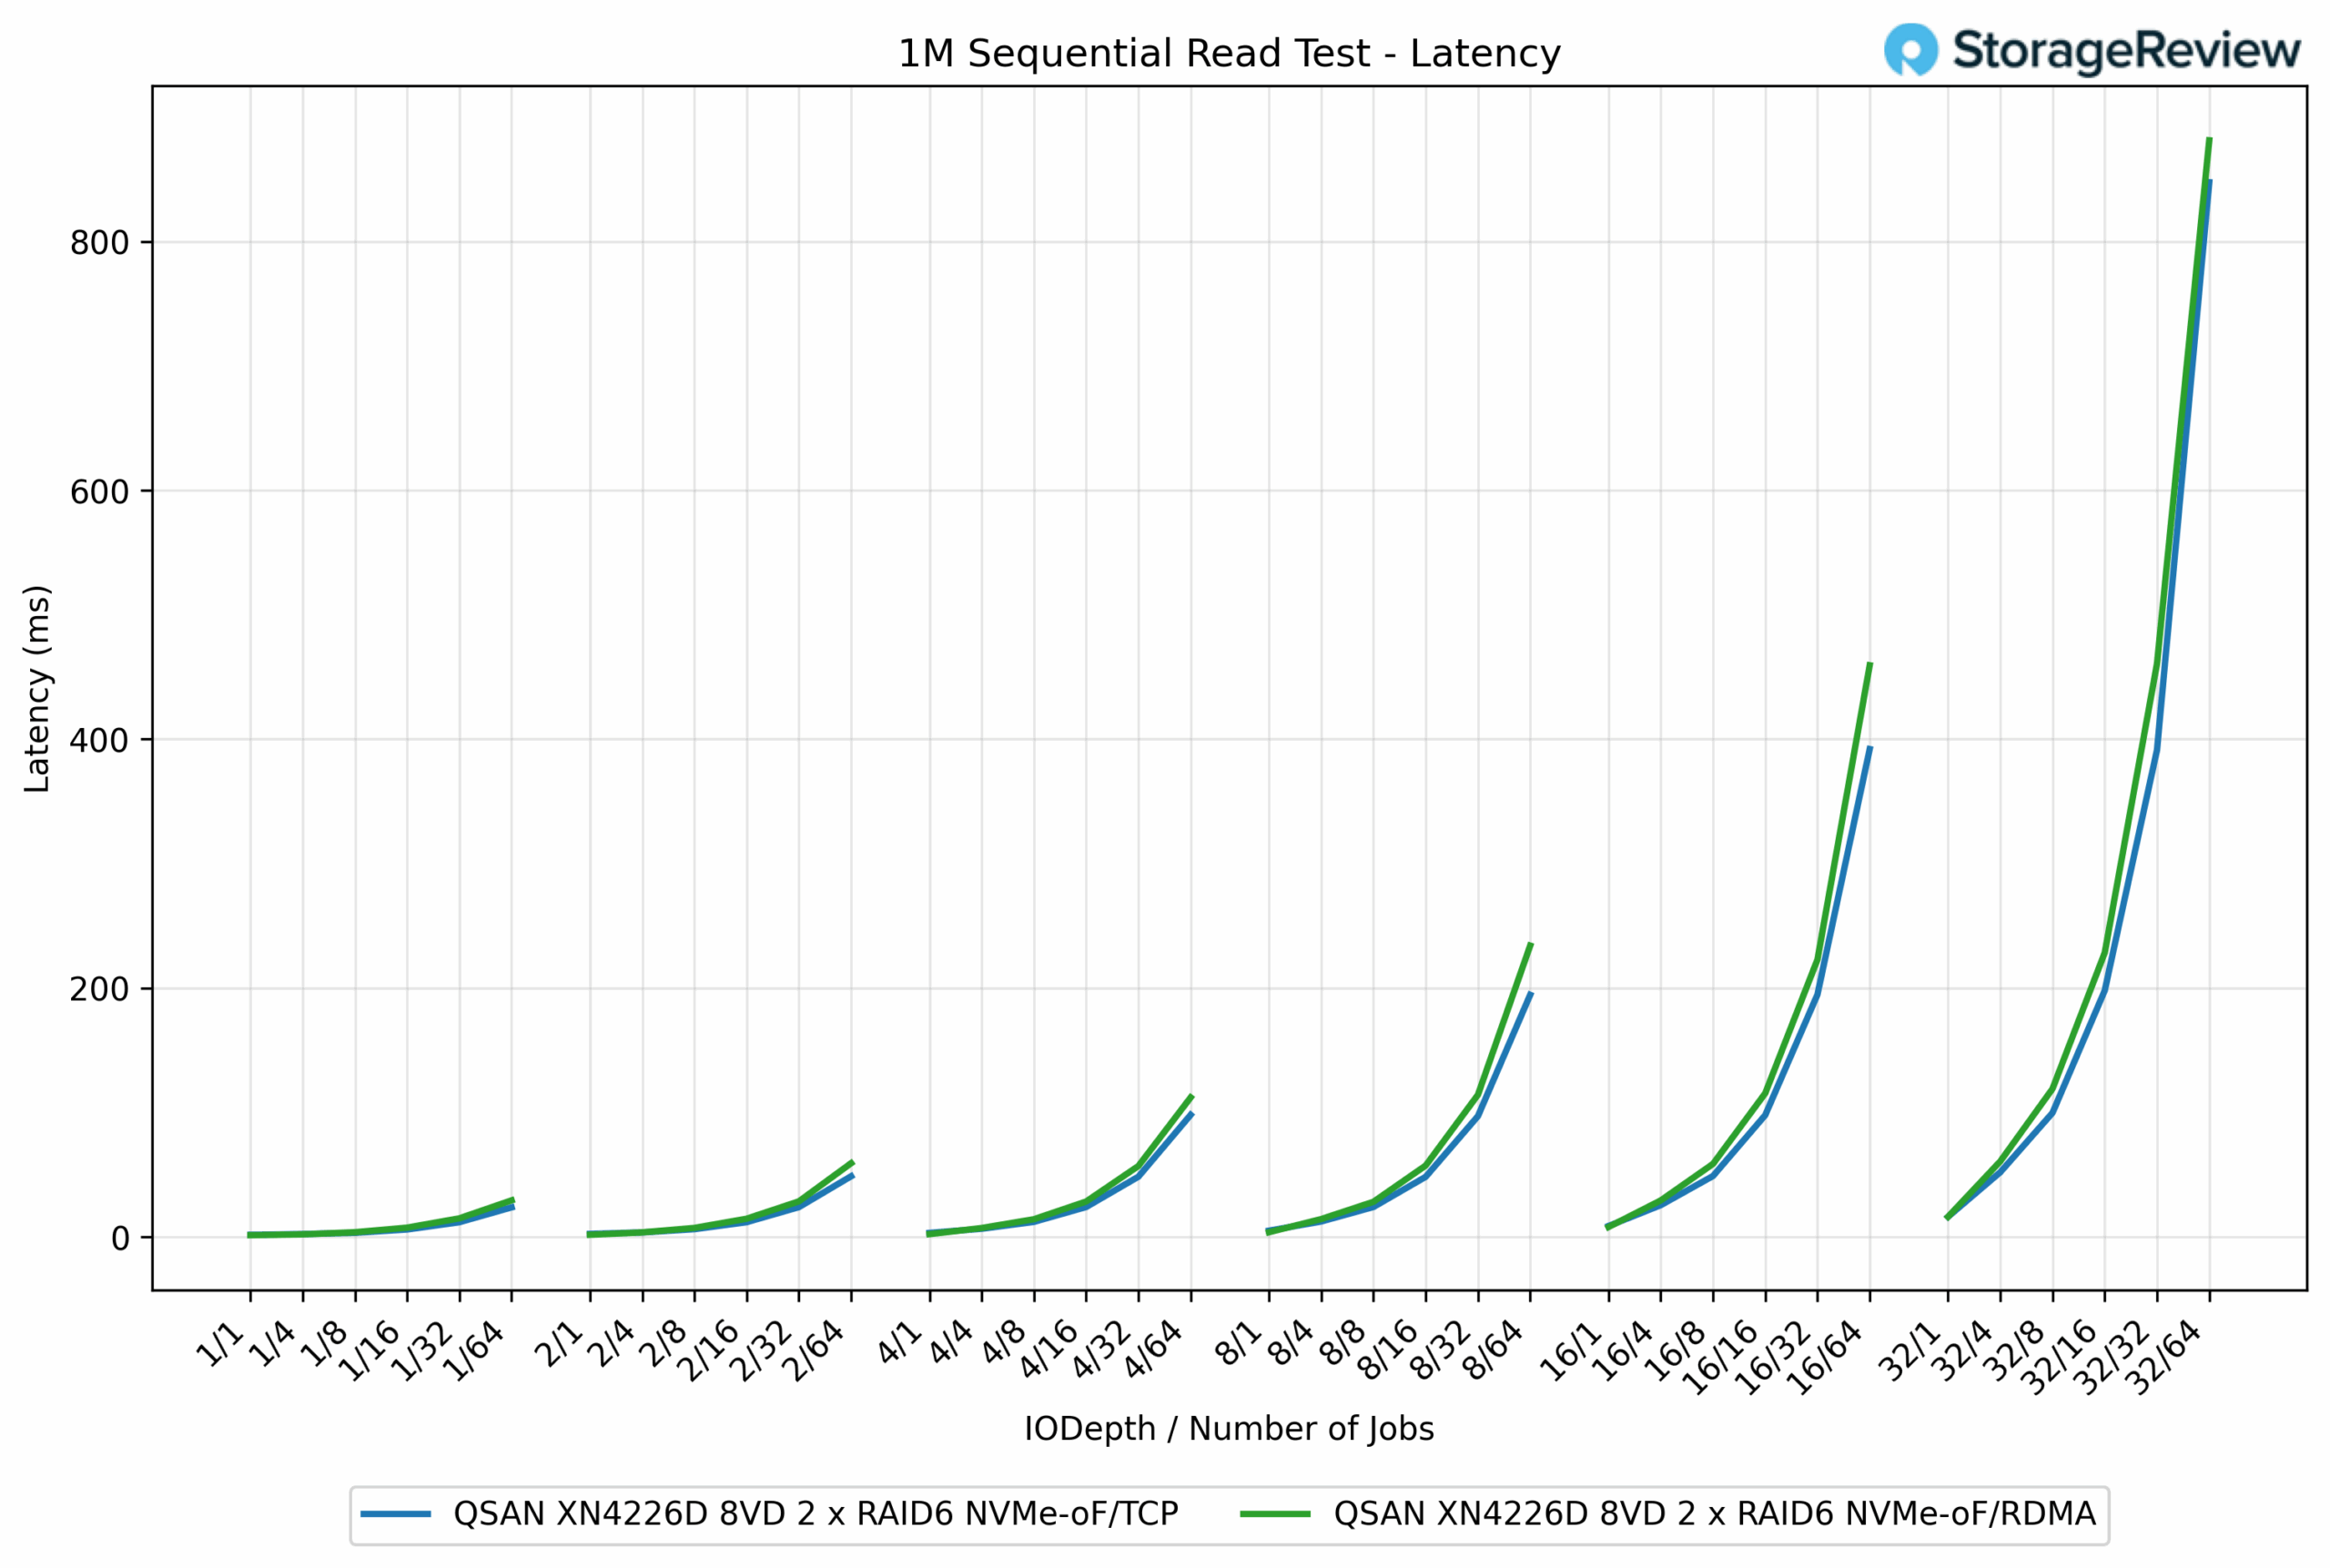
In the 1M Sequential Read latency test, the results were closer between the two protocols, although RDMA generally held a slight advantage at higher queue depths. At lighter workloads, the latency profiles were almost identical, both staying below 5ms until concurrency began to increase. For instance, at QD8/64 jobs, TCP registered 234.09ms, while RDMA came in lower at 194.54ms, reflecting a 17% reduction.
This trend continued at heavier loads. At QD32/64 jobs, RDMA measured 847.59ms, compared to TCP’s 881.31ms, a minor 3.8% improvement but still consistent with RDMA’s lower stack overhead. That said, both protocols scaled in a similar pattern, with latency climbing predictably as the workload intensified.
64k random Write IOPS
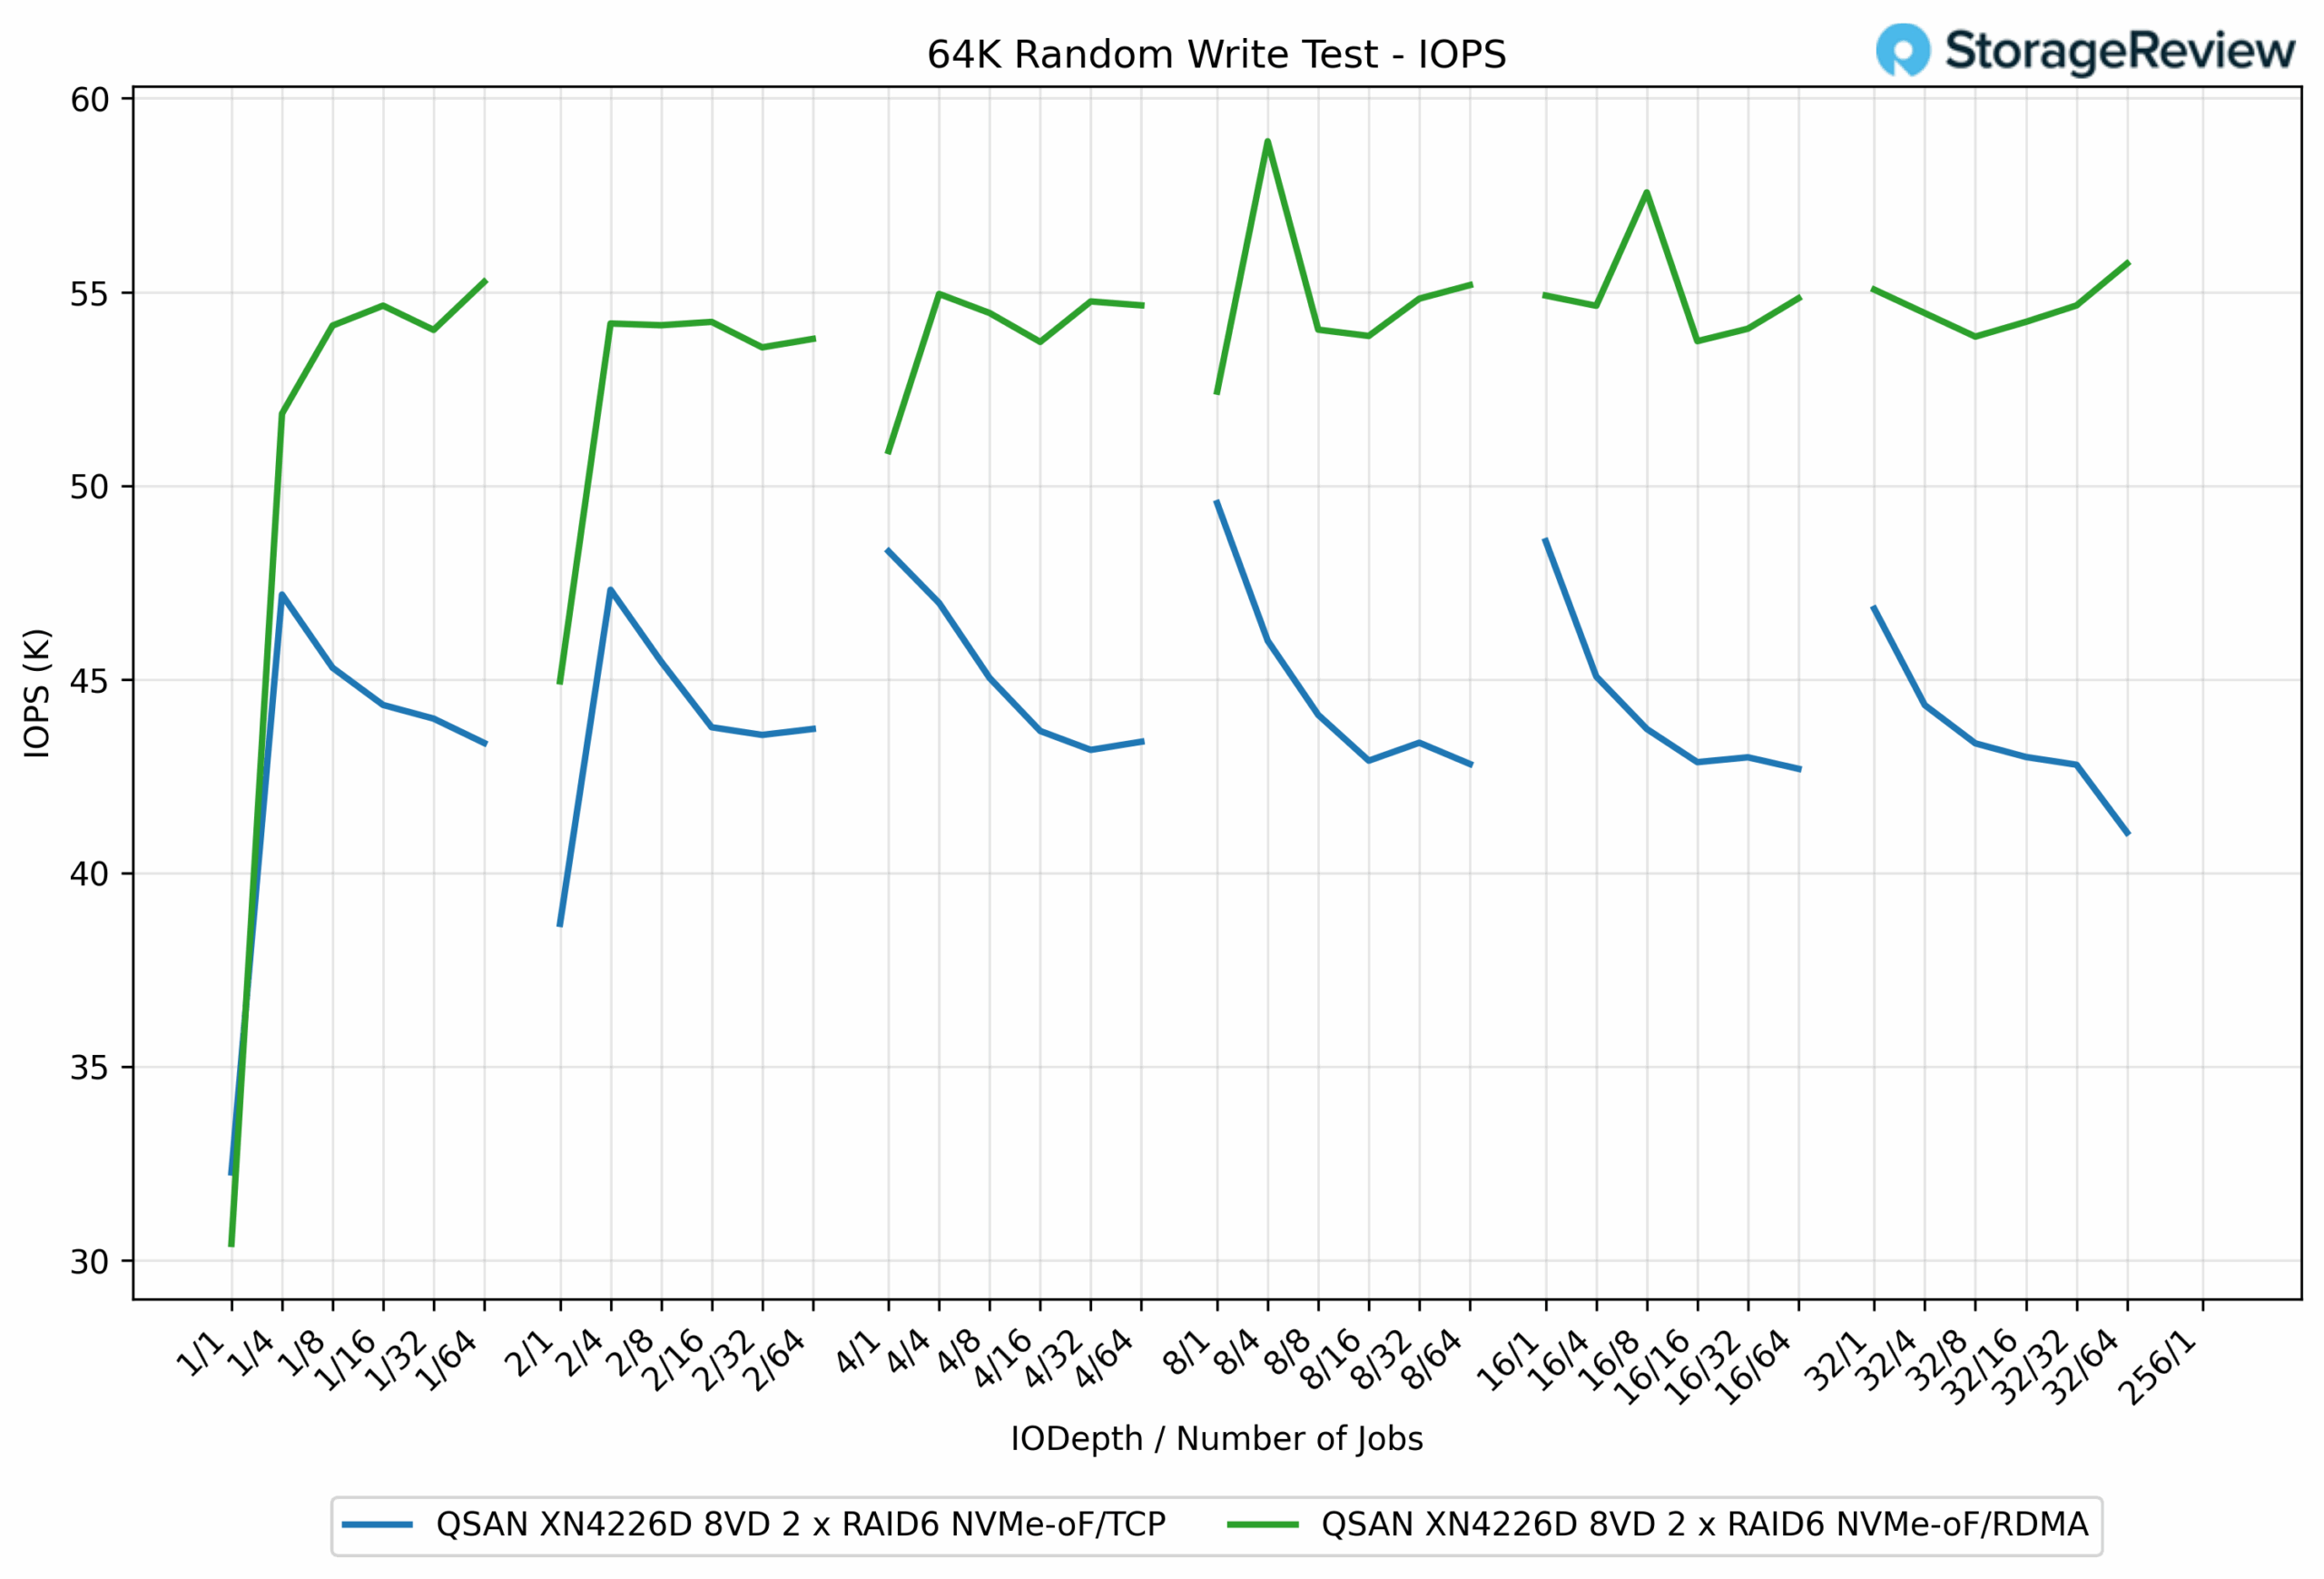
In the 64K Random Write test, RDMA consistently delivered higher IOPS than TCP, highlighting its efficiency in handling parallelized random operations. At peak, RDMA reached 58.89K IOPS, while TCP trailed at 48.57K IOPS, marking a 21% performance advantage.
The gap between the two protocols was present throughout the test. For example, at QD1/16 jobs, RDMA posted 54.13K IOPS, compared to TCP’s 45.30K IOPS, a difference of nearly 16%. As the workload scaled further, RDMA maintained results in the 53K to 55K IOPS range, while TCP maintained a range of 42K to 46K IOPS.
64K Random Write Latency
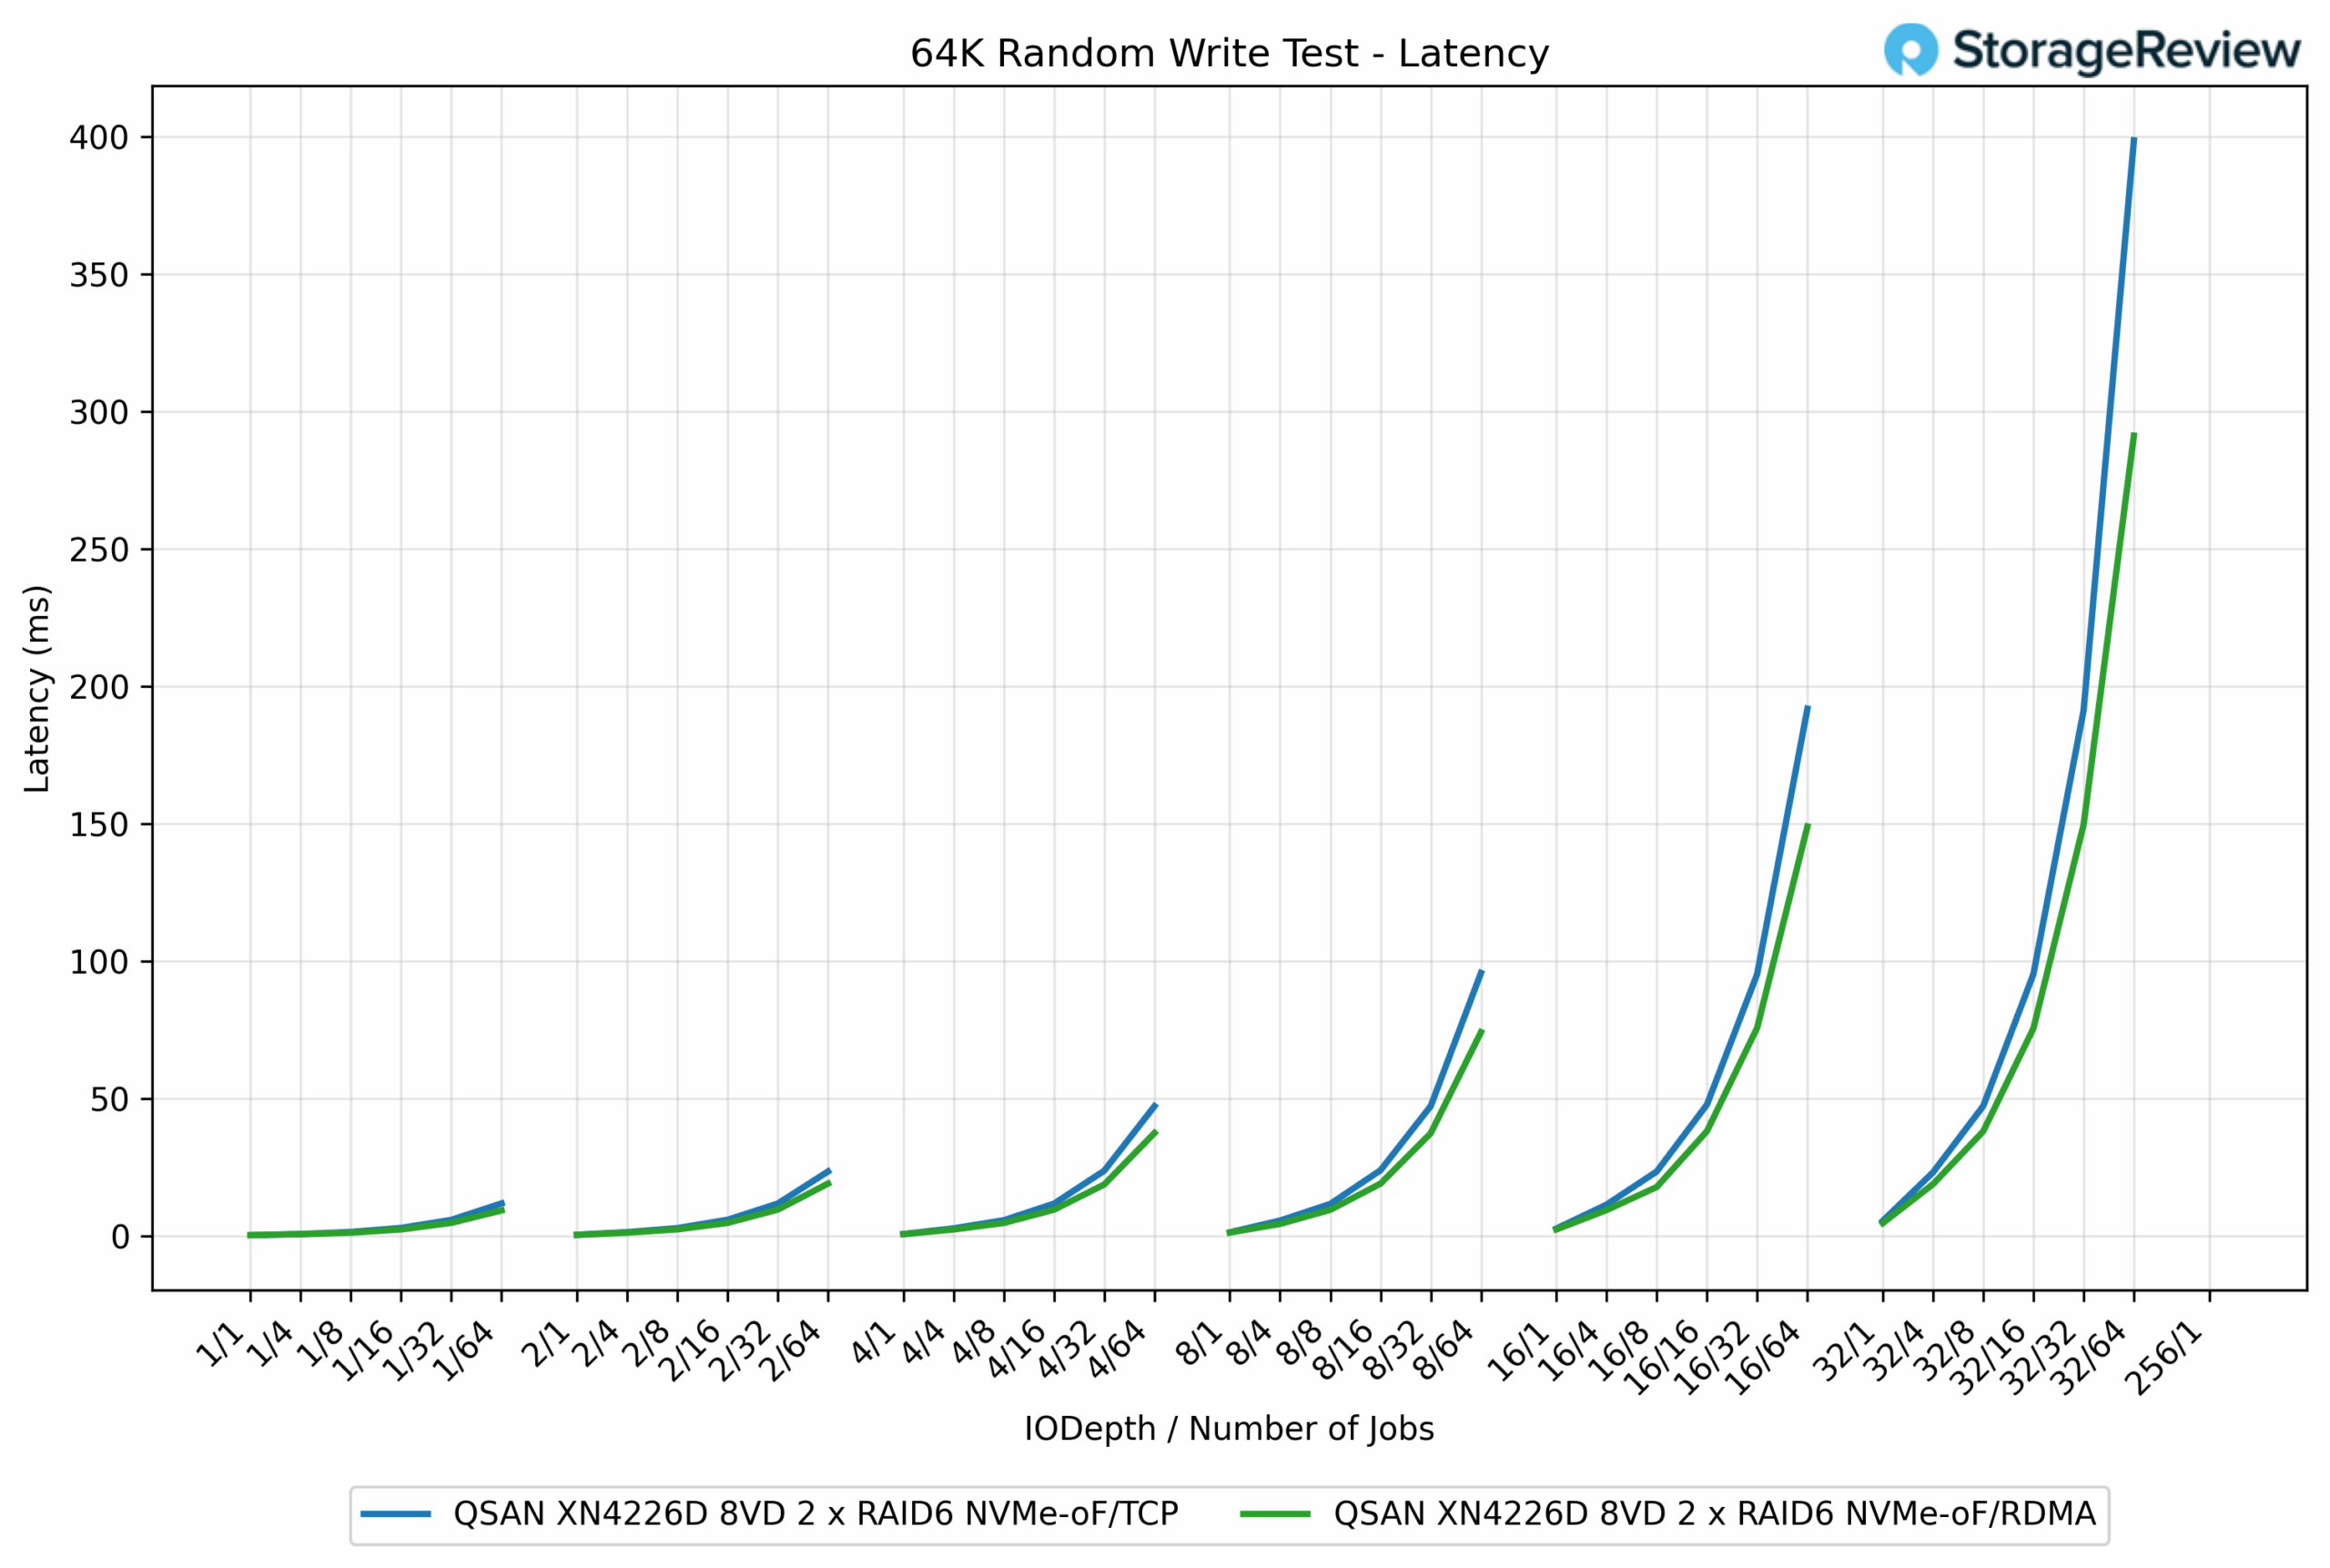
In the 64K Random Write latency test, RDMA once again demonstrated lower response times compared to TCP, notably as queue depths and job counts increased. At lower loads, both protocols performed almost identically, staying under 1ms. For example, at the QD1/1 job, TCP measured 0.26ms, while RDMA was essentially the same at 0.25ms.
As the workload scaled, however, RDMA maintained its efficiency advantage. At QD16/64 jobs, RDMA recorded 74.09ms, compared to TCP’s 95.64ms, a difference of roughly 23%. The gap widened further under maximum stress at the QD256/1 job, where RDMA posted 291.13ms, while TCP surged to 398.56ms, nearly 37% higher.
64K Random Read IOPS
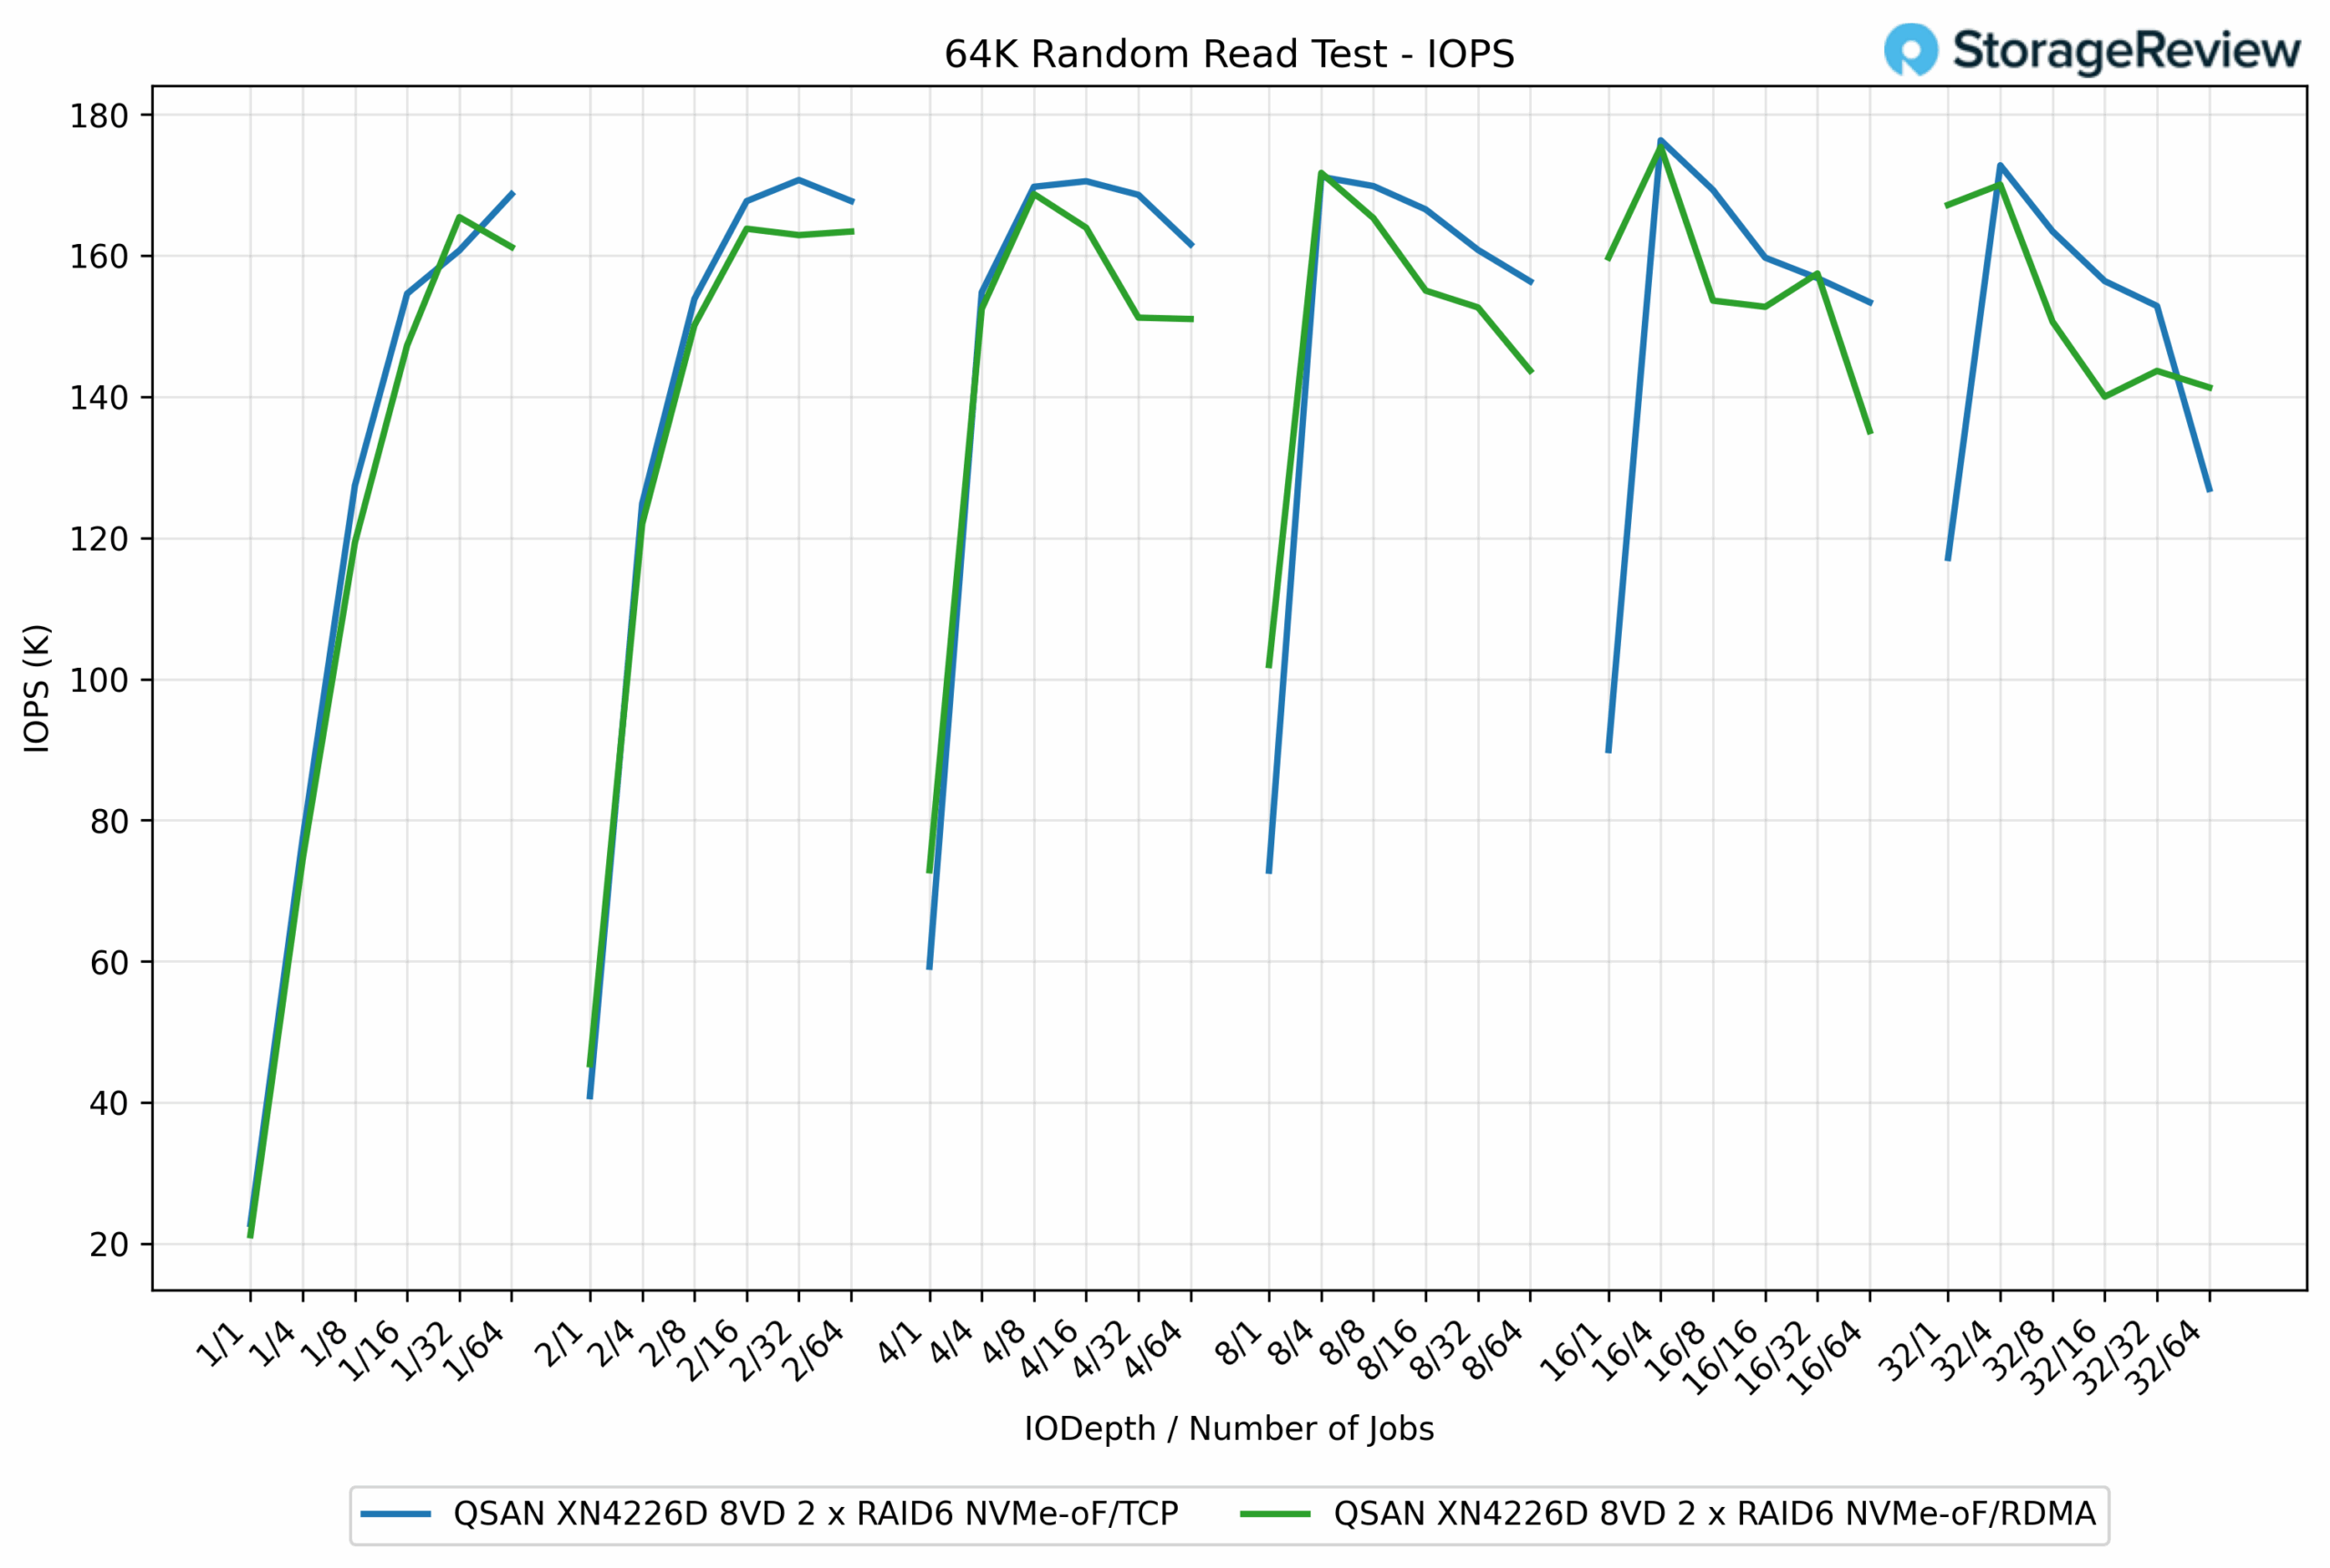
In the 64K Random Read test, TCP and RDMA delivered very similar performance overall, with the lead shifting slightly between the two protocols depending on the workload. TCP achieved a peak of 176.33K IOPS, while RDMA was close behind at 175.40K IOPS, showing only a 0.5% difference.
At moderate depths, the results remained tightly grouped. For example, at QD4/16 jobs, TCP posted 168.60K IOPS, while RDMA followed at 163.94K IOPS, a gap of less than 2.8%. In other points, RDMA edged slightly higher, such as QD8/1 jobs, where it reached 171.71K IOPS compared to TCP’s 171.15K IOPS, essentially a tie.
64K Random Read Latency
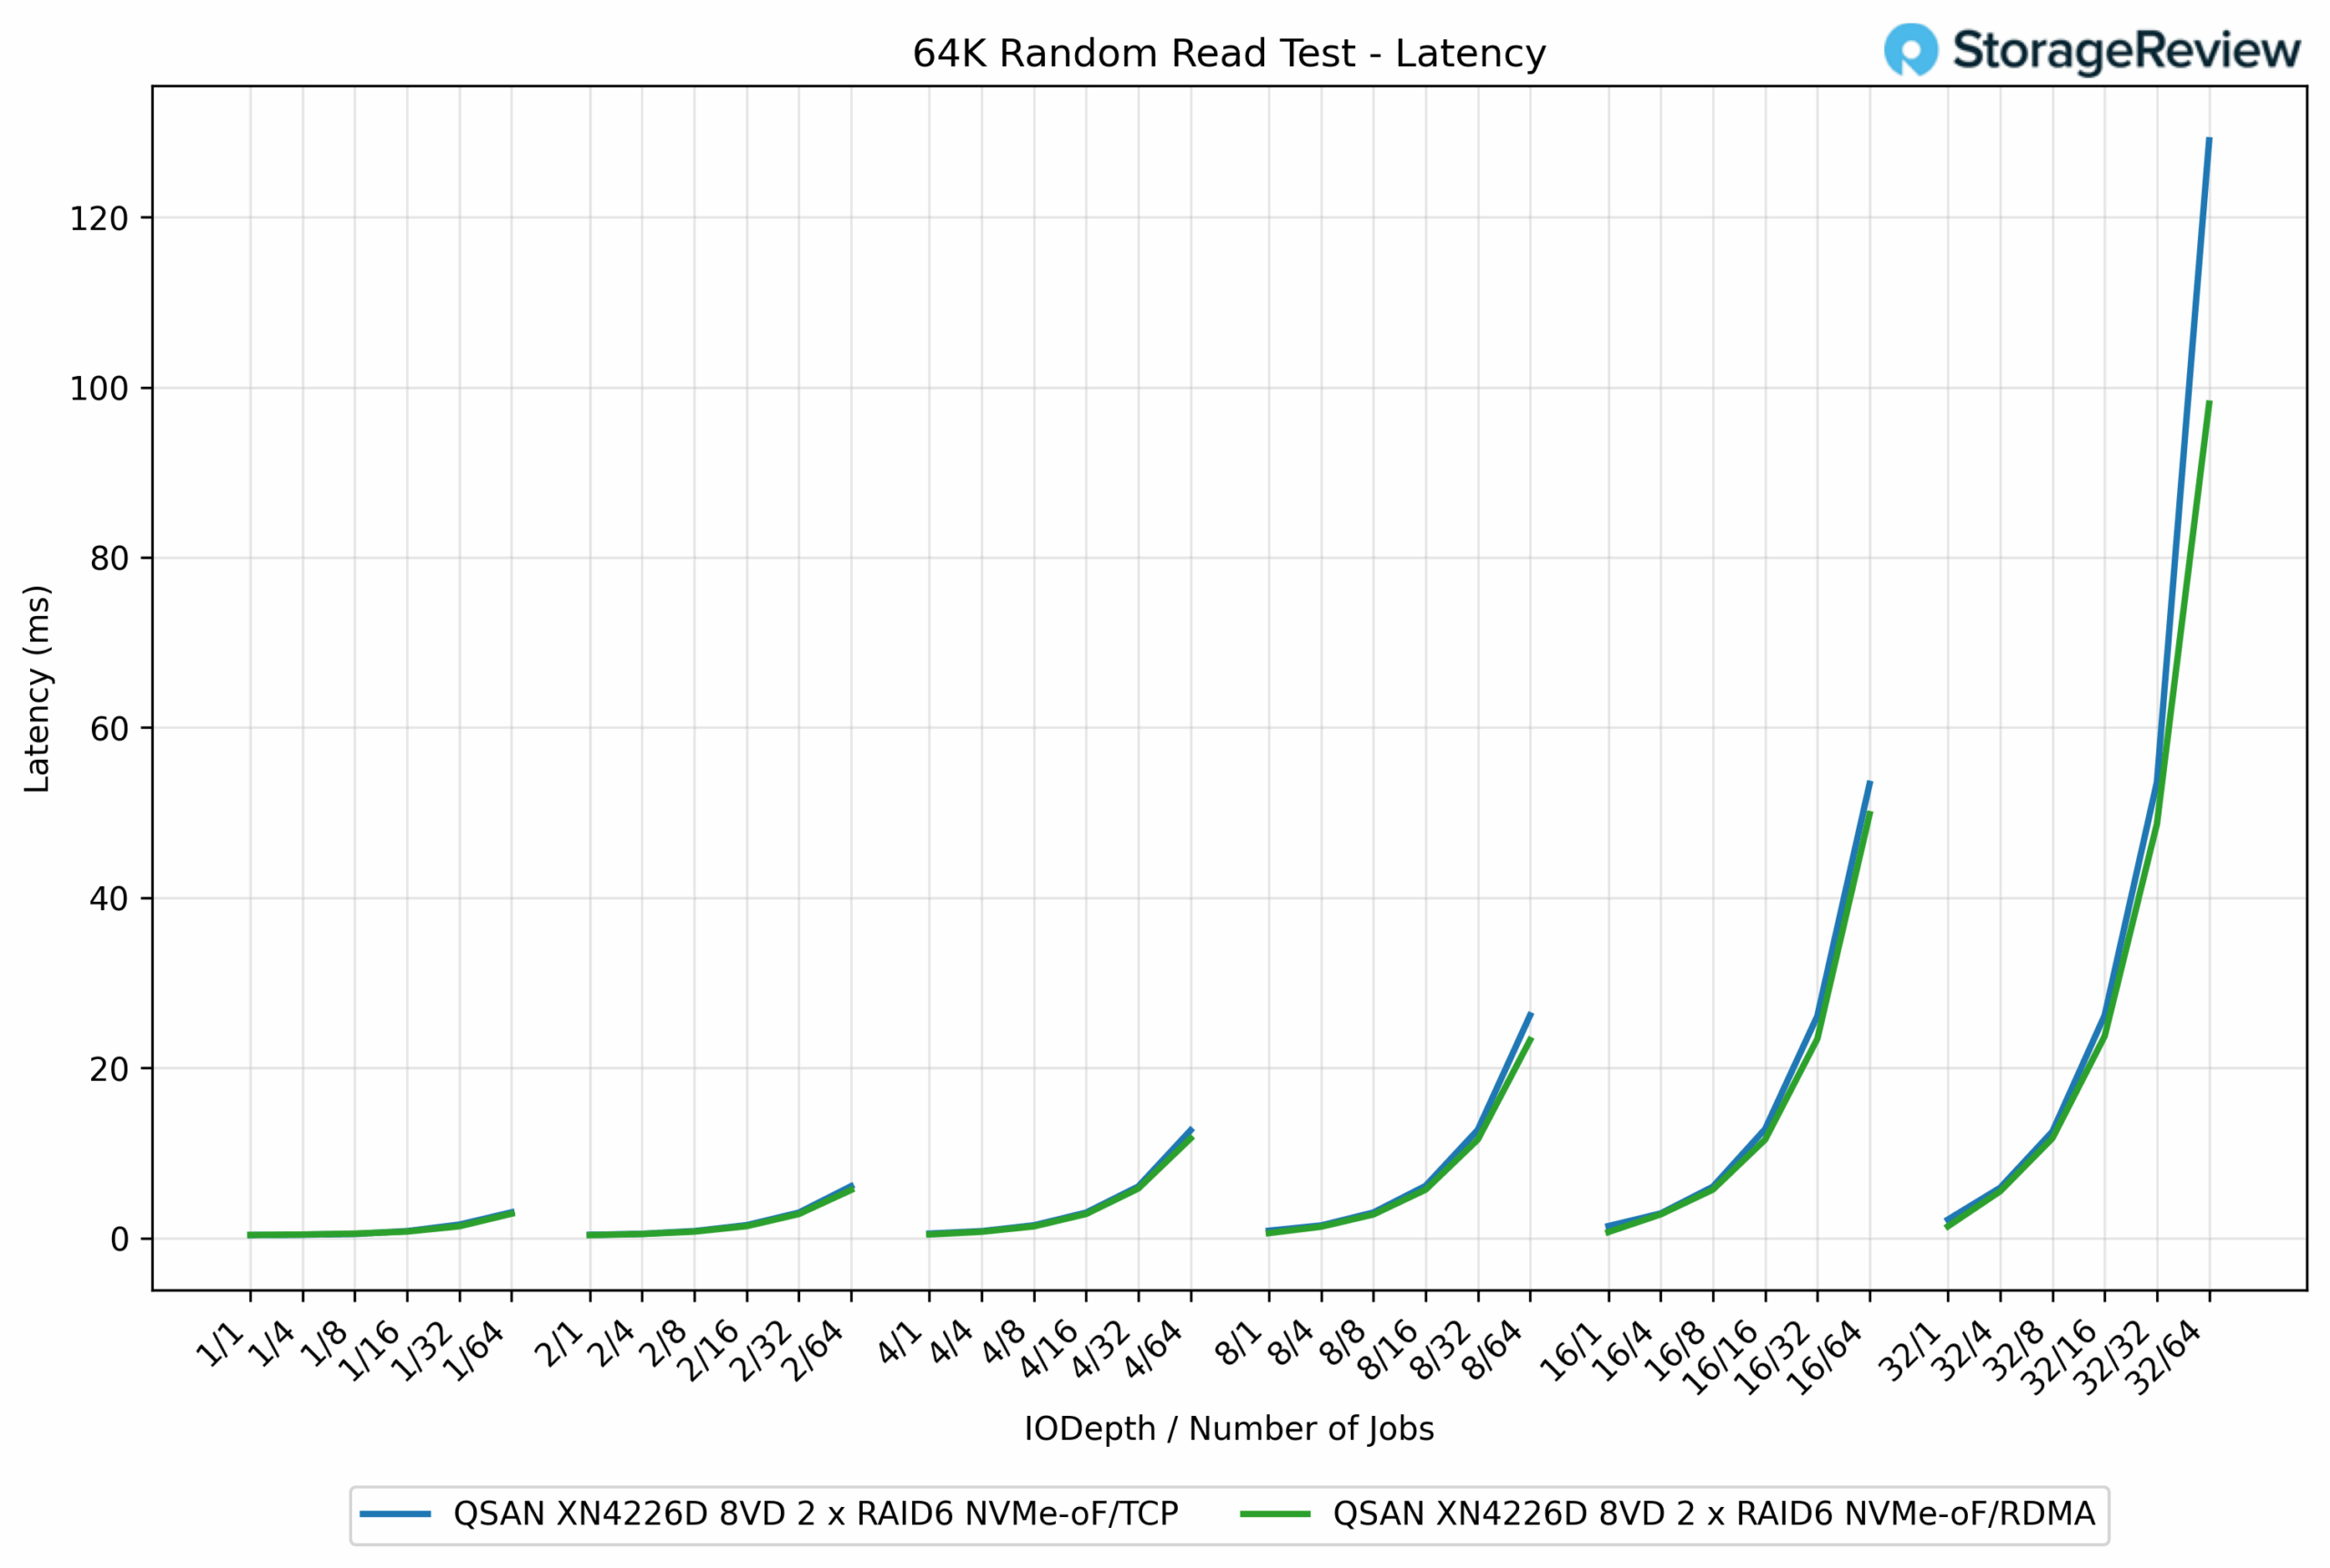
In the 64K Random Read latency test, the two protocols tracked very closely, though RDMA showed a modest edge under higher load. At light workloads, both TCP and RDMA delivered latencies under 1ms, essentially indistinguishable. For example, at the QD1/1 job, TCP measured 0.43ms compared to RDMA’s 0.38ms.
As concurrency increased, the difference became more noticeable. At QD16/64 jobs, RDMA posted 23.28ms, while TCP registered 26.19ms, a 12% improvement. The spread grew wider under maximum stress, where RDMA came in at 98.08ms versus TCP’s 129.02ms, a 24% reduction.
16K Random Write IOPS
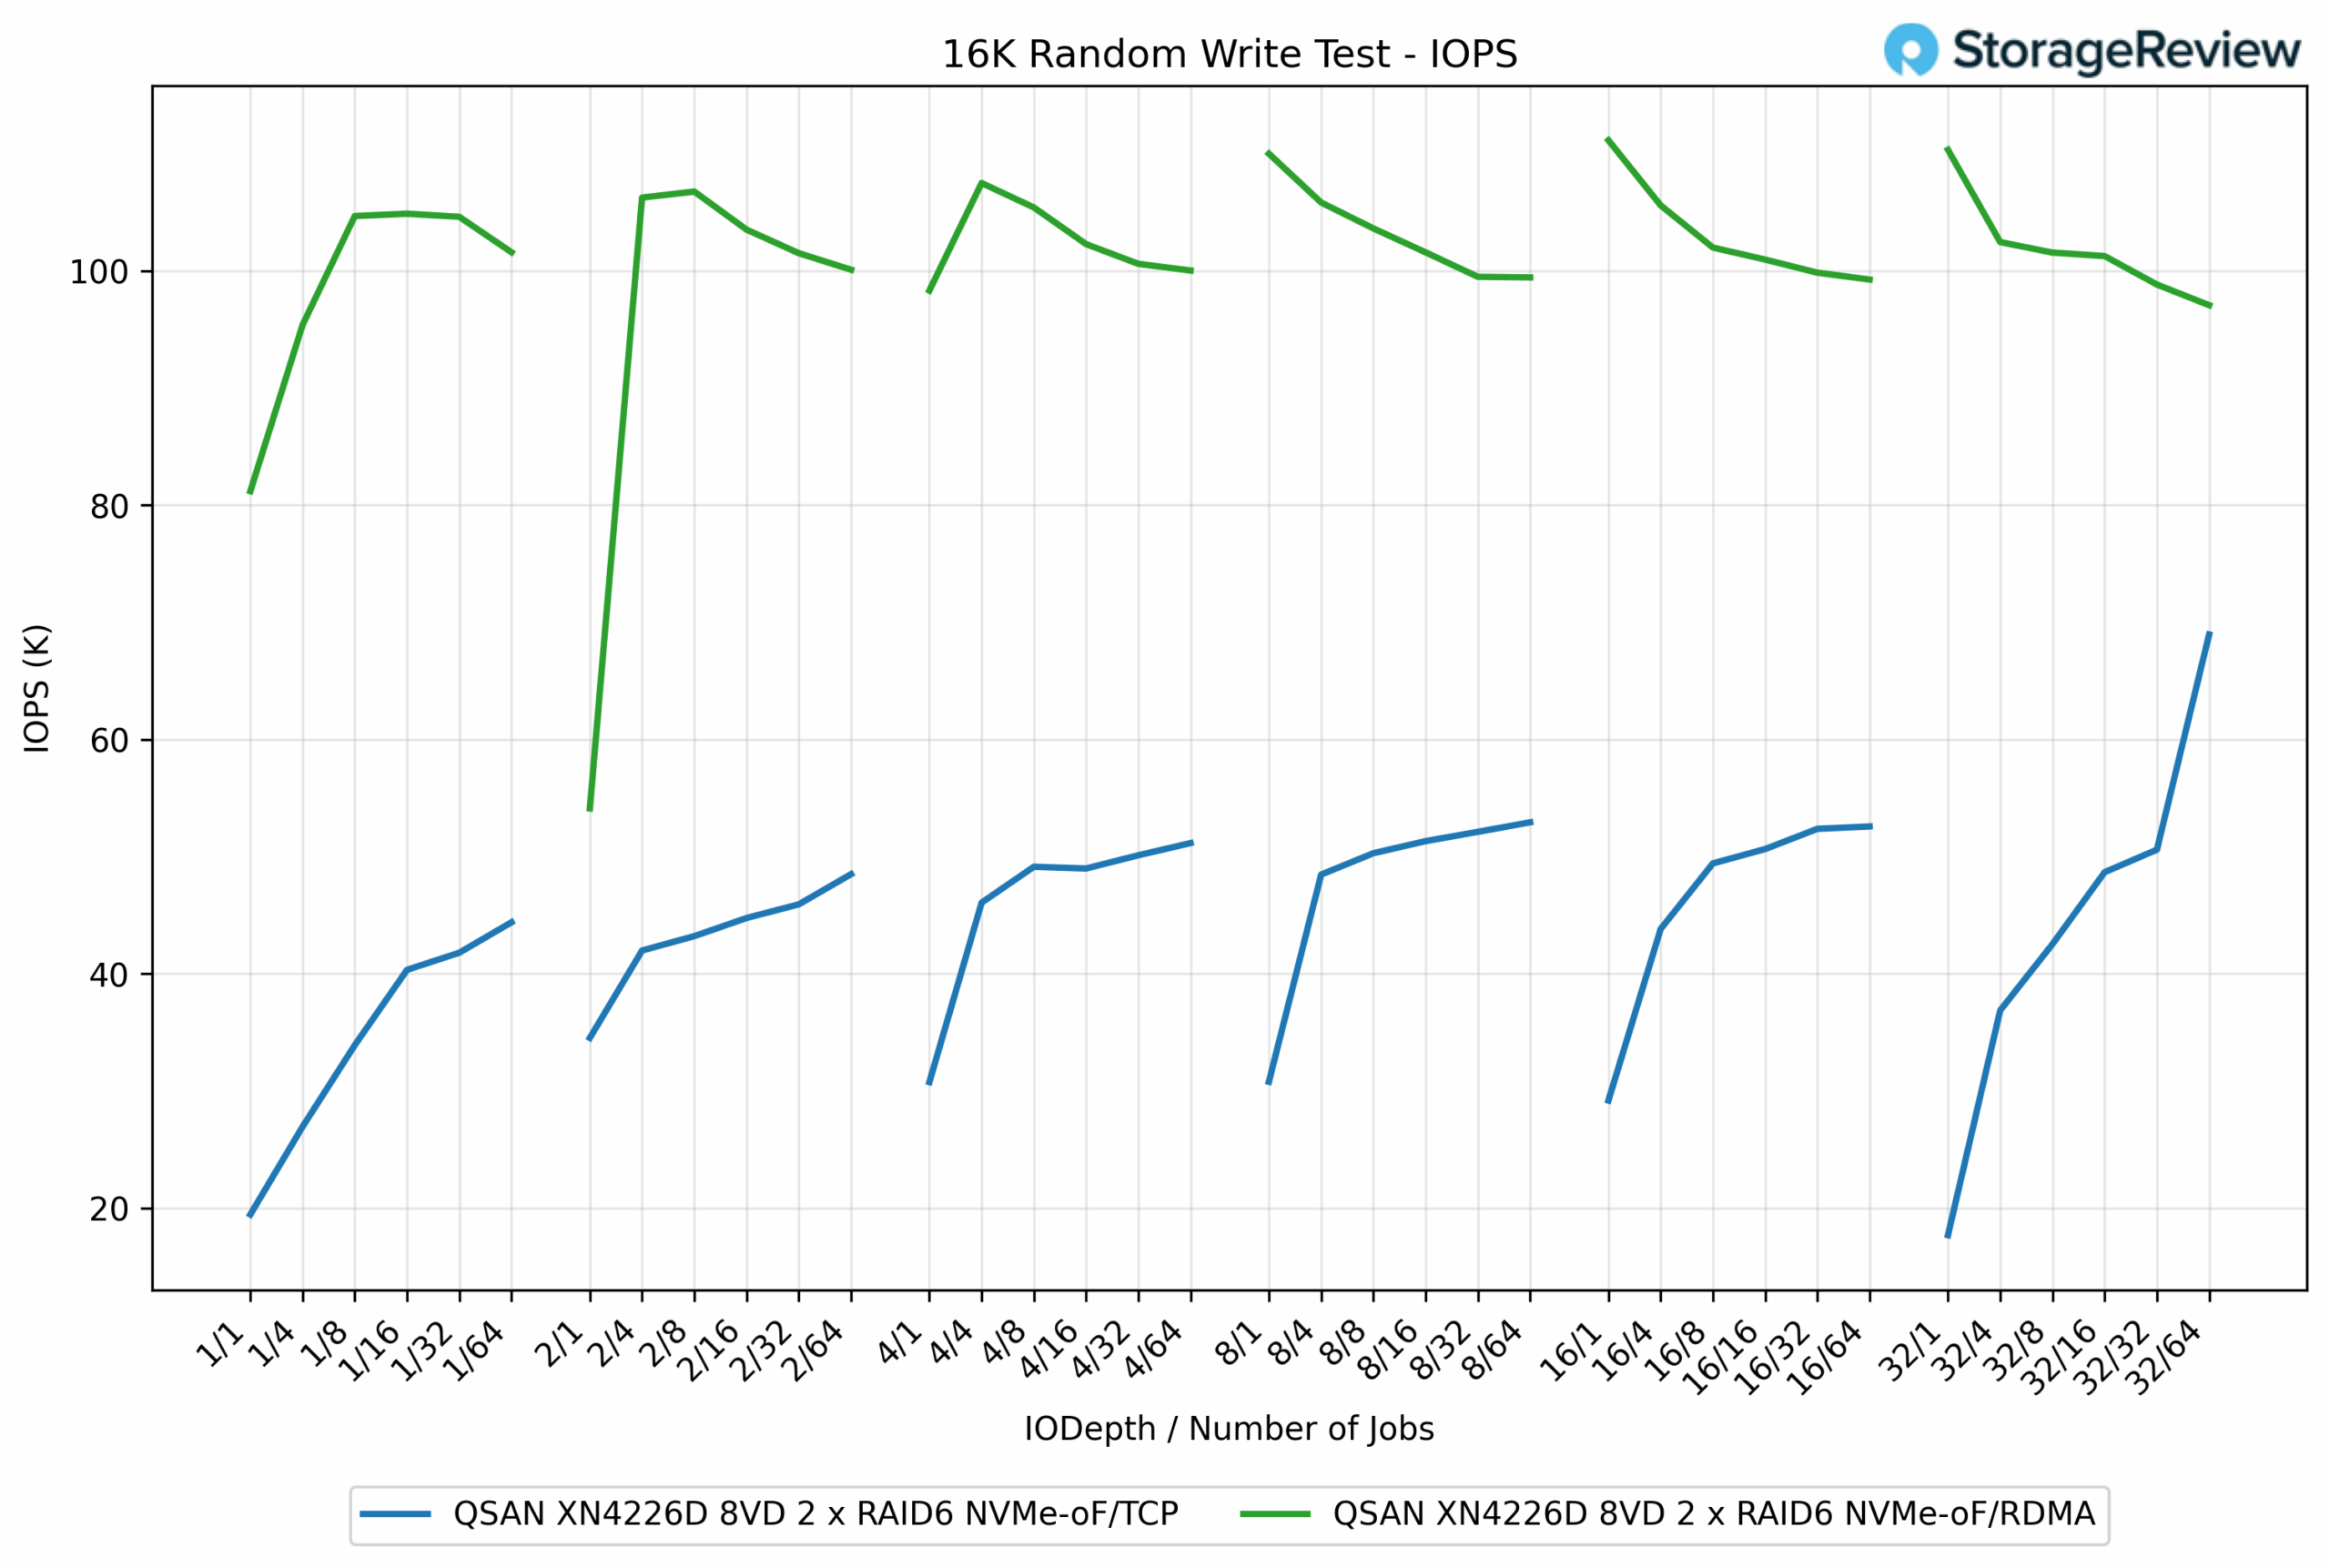
In the 16K Random Write test, the performance gap between the two protocols was substantial, with RDMA delivering more than double the IOPS of TCP in most cases. RDMA peaked at 111.13K IOPS, while TCP topped out at 68.95K IOPS, reflecting a 61% advantage for RDMA.
At lower queue depths, the difference was evident. For example, at QD1/16 jobs, RDMA measured 104.86K IOPS, compared to TCP’s 41.78K IOPS, which translates to a 151% increase in favor of RDMA. Across the workload range, RDMA consistently maintained results in the 100K to 111K IOPS range, while TCP generally remained in the 40K to 50K IOPS range, except for a late surge at maximum depth.
16K Random Write Latency
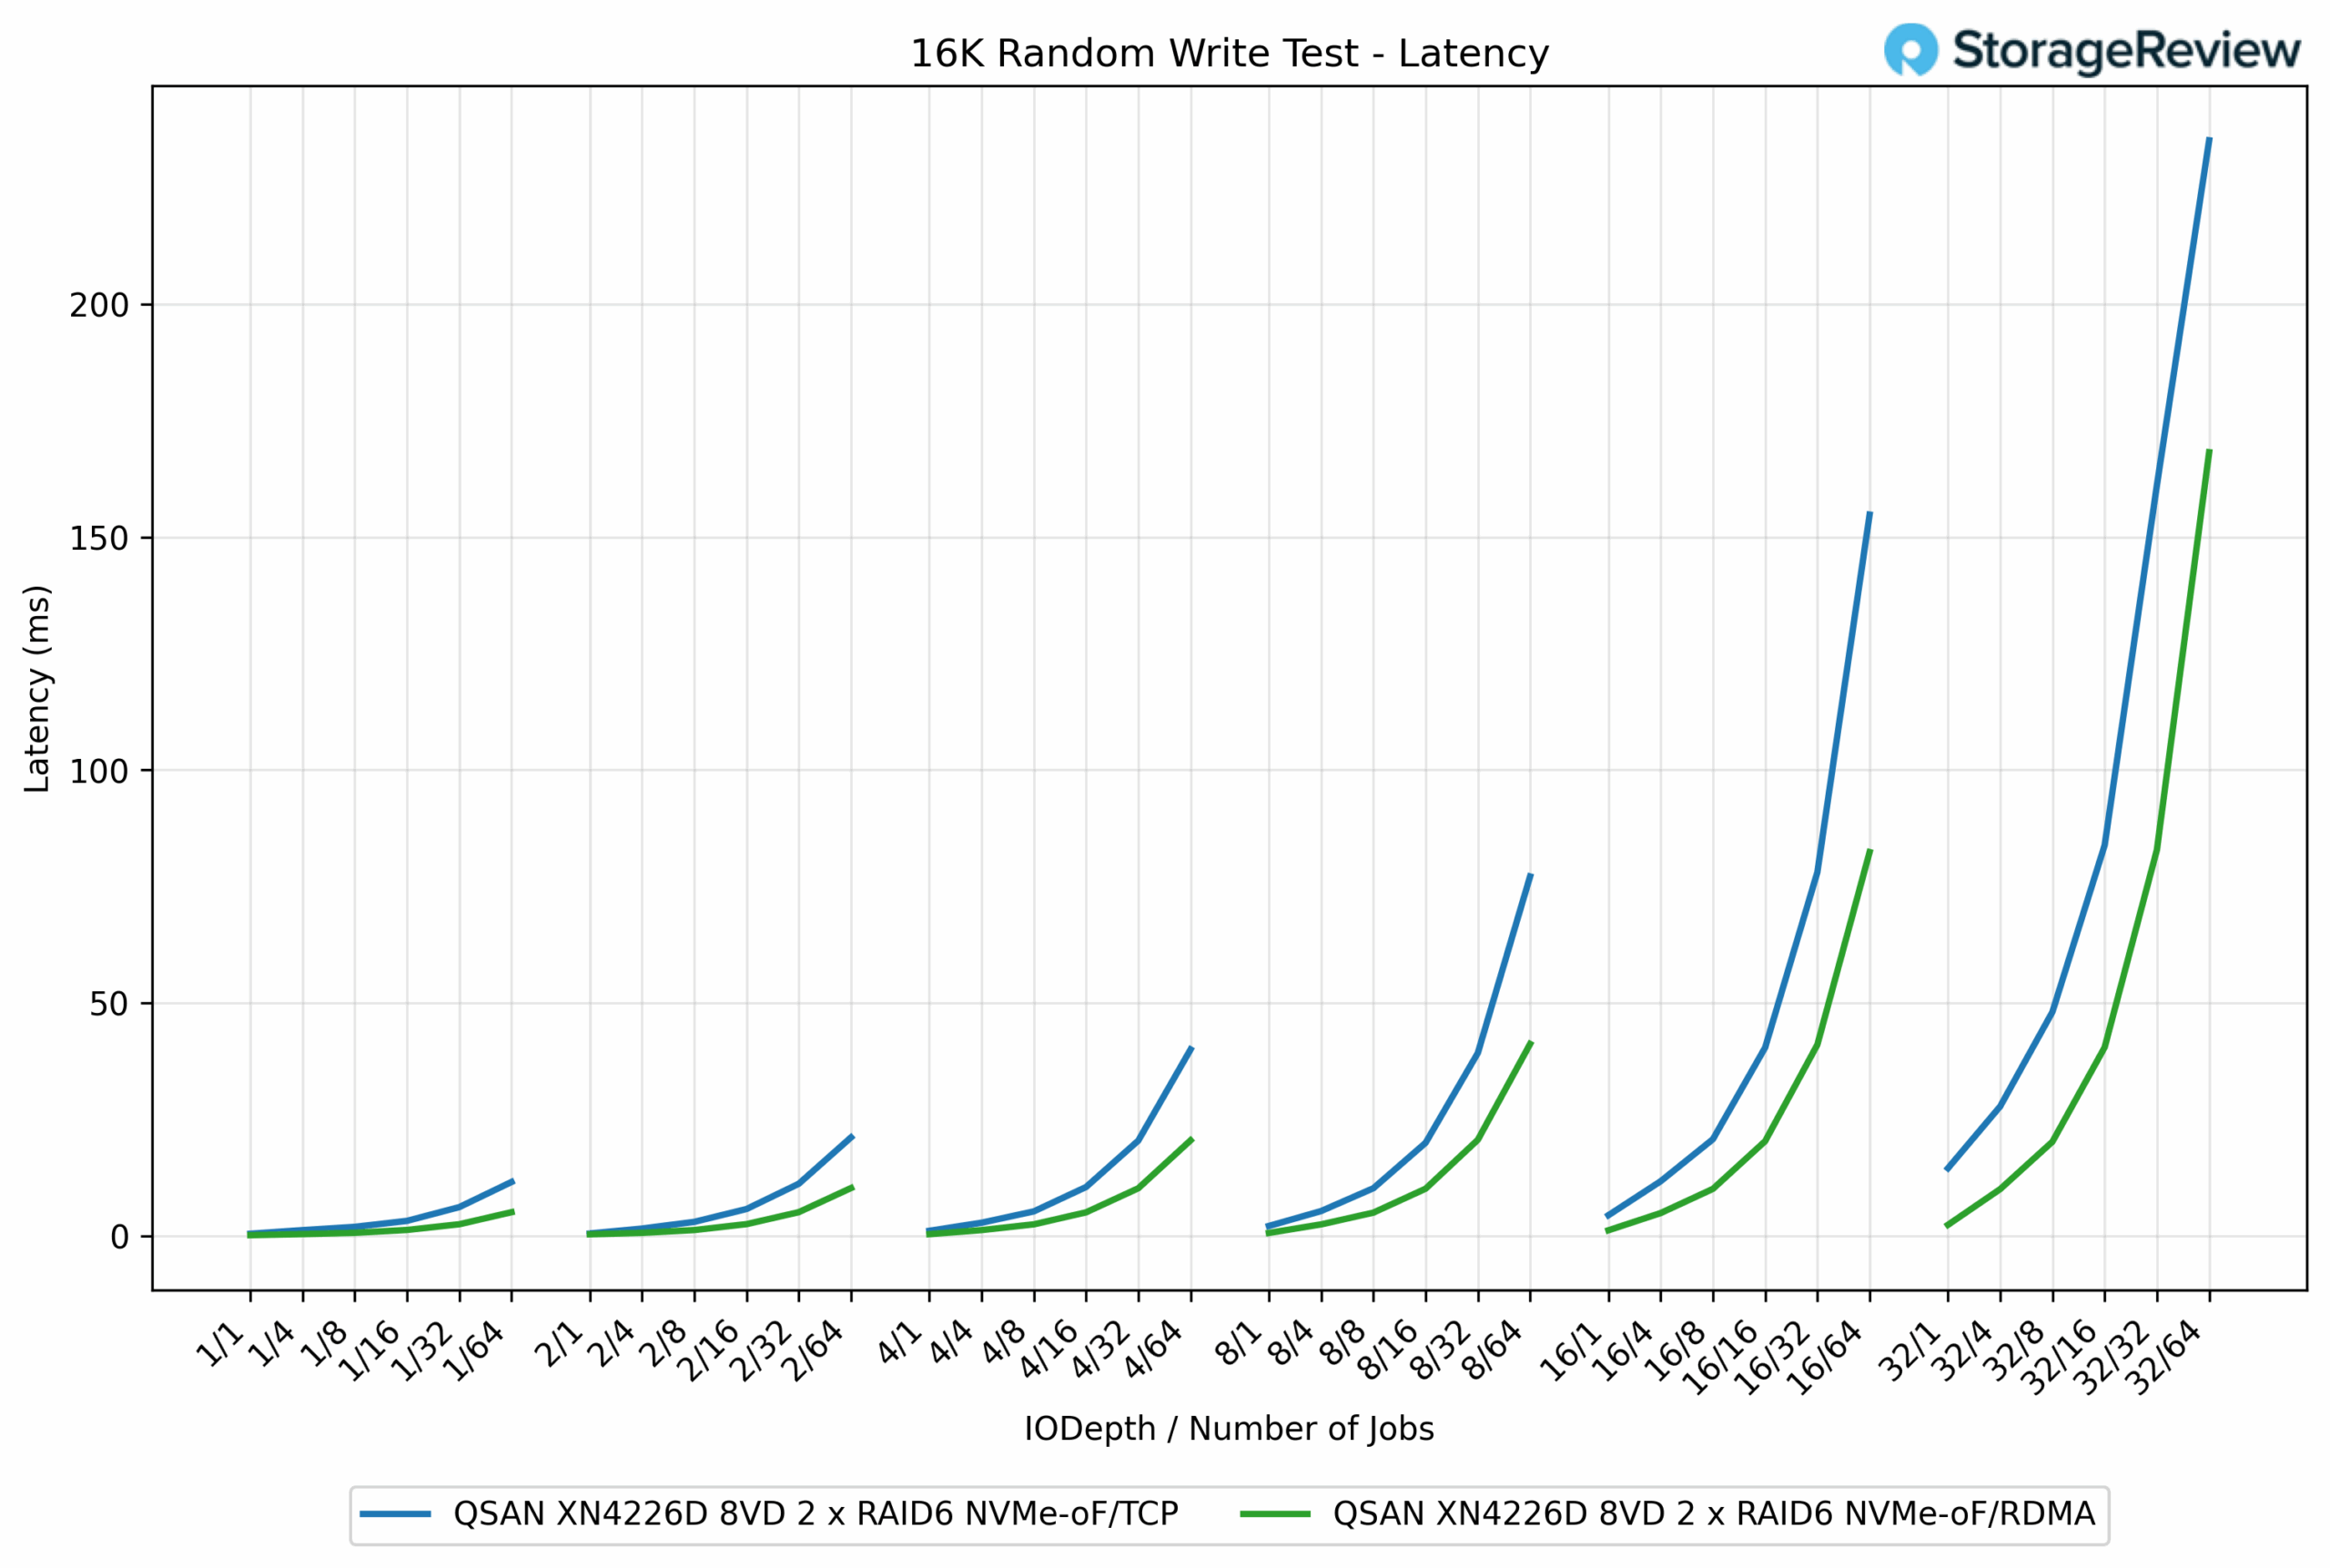
In the 16K Random Write latency test, RDMA once again maintained a clear advantage over TCP as workloads scaled. At lighter loads, both protocols were nearly identical, with response times staying below 2ms. For example, at the QD1/1 job, TCP measured 0.40ms compared to RDMA’s 0.41ms.
As concurrency increased, RDMA began to separate. At QD16/64 jobs, RDMA recorded 21.15ms, while TCP came in at 77.12ms, a dramatic 72% reduction. This advantage persisted at the highest depths. At QD32/64 jobs, RDMA completed at 161.13ms, compared to TCP’s 235.17ms, representing a 31% improvement.
16K Random Read IOPS
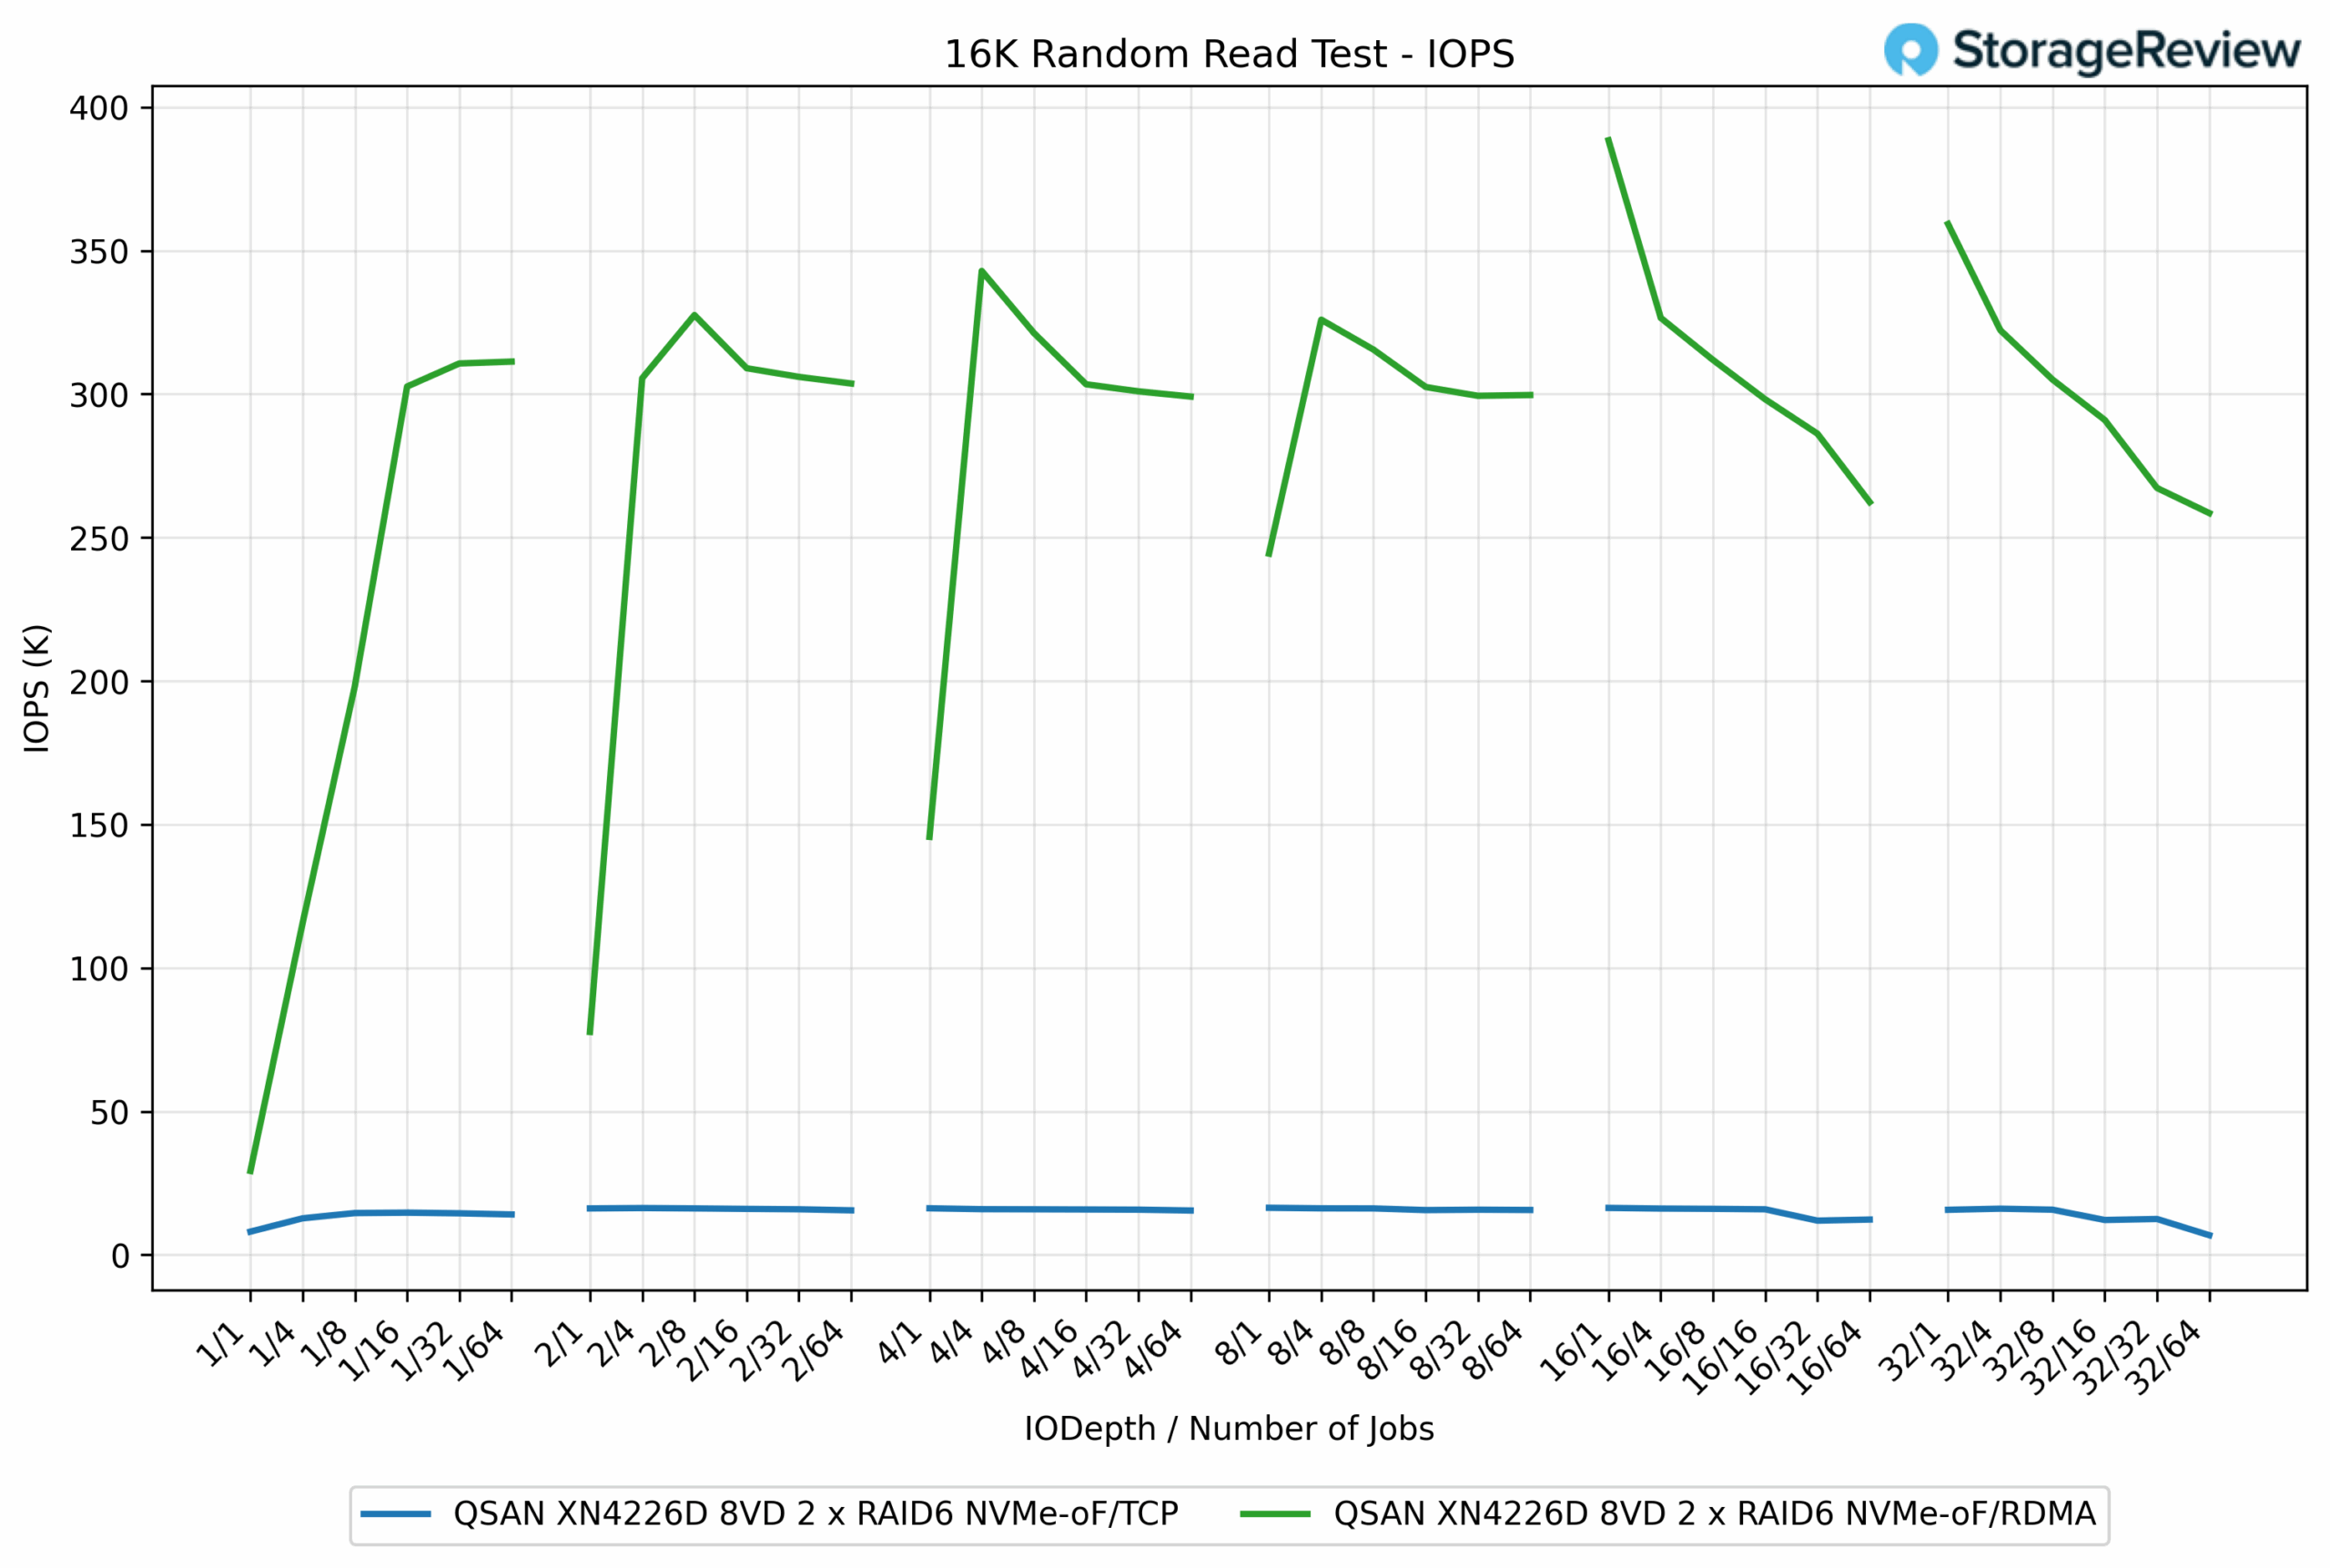
In the 16K Random Read test, RDMA completely outpaced TCP across the entire range of workloads. RDMA achieved a peak of 388.44K IOPS, while TCP topped out at just 16.42K IOPS, demonstrating a more than 23x advantage for RDMA.
The disparity was visible from the very beginning. At the QD1/1 job, RDMA delivered 29.27K IOPS, while TCP managed only 8.10K IOPS. As concurrency increased, RDMA quickly scaled into the 300K to 380K IOPS range, whereas TCP plateaued around 15K to 16K IOPS, even at higher queue depths.
16K Random read Latency
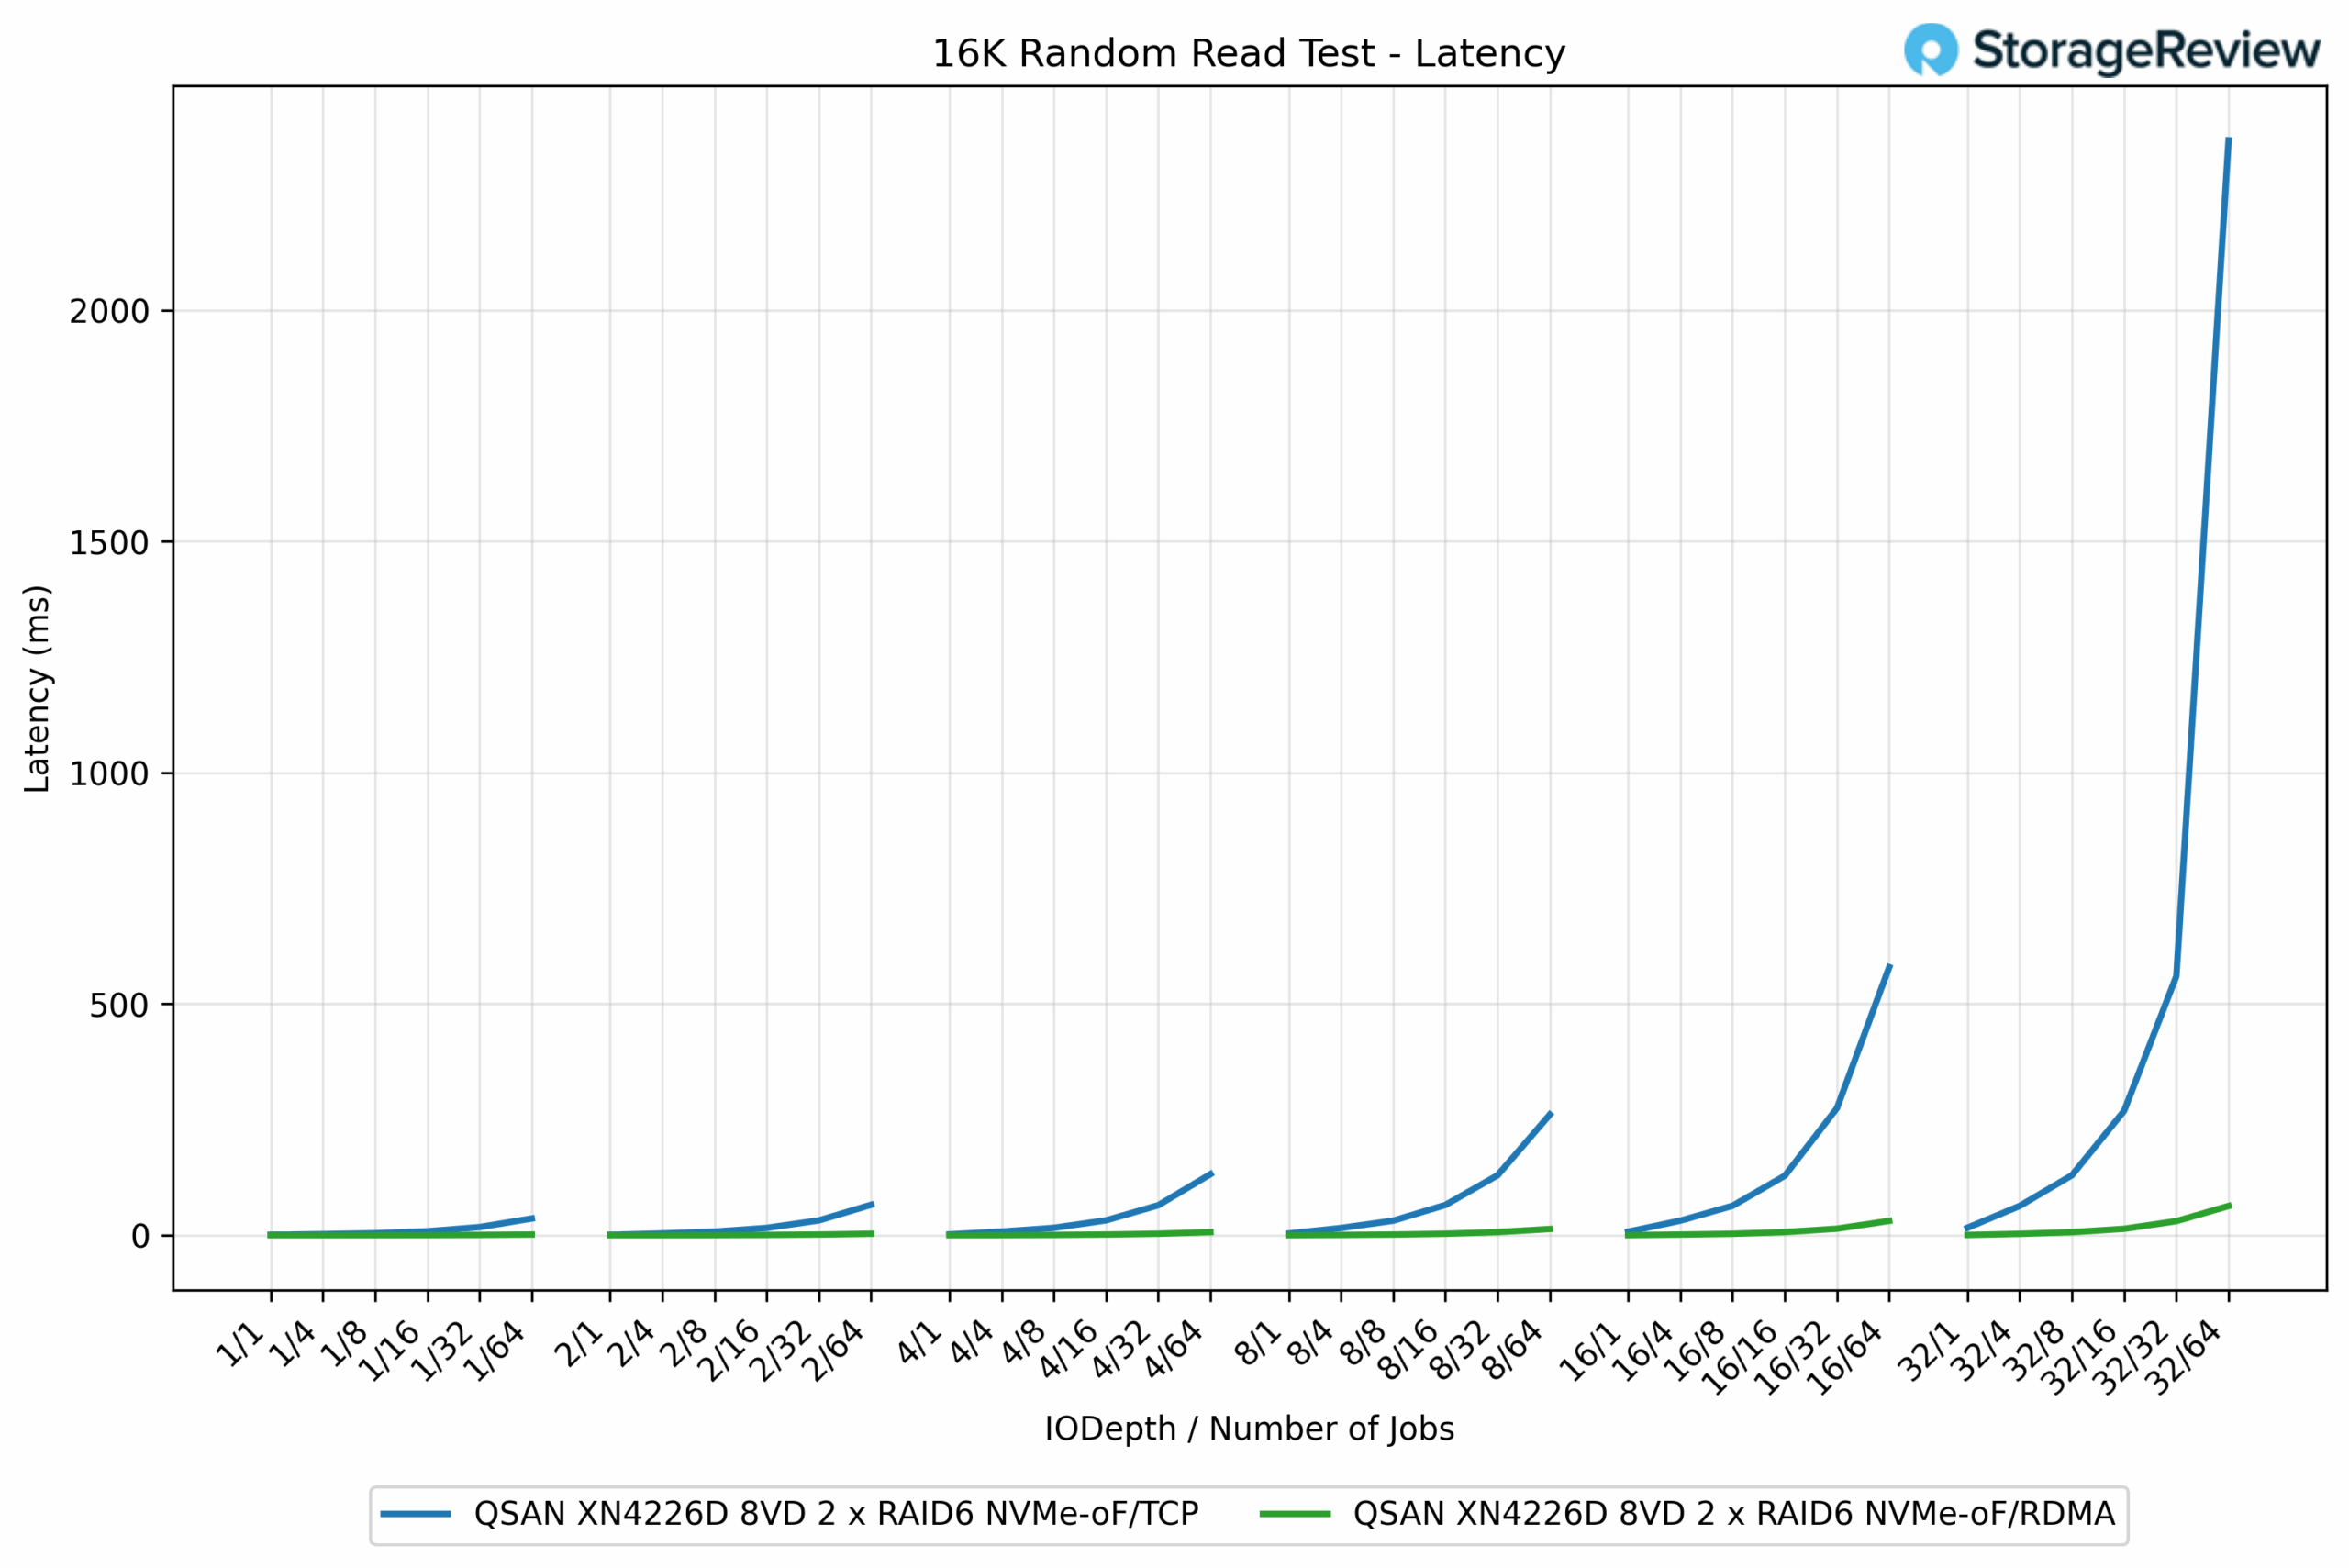
In the 16K Random Read latency test, the difference between RDMA and TCP was dramatic, mirroring the IOPS results. At light workloads, the two protocols were nearly identical, with latencies ranging from 1 to 10ms.
As workloads scaled, RDMA held latency well in check, while TCP degraded significantly. At Q8/64 jobs, RDMA measured 13.65ms, compared to TCP’s 260.90ms, a nearly 19x improvement. Ultimately, QD32/64 jobs completed RDMA in 63.28ms, whereas TCP took 2,366.99ms, almost 37 times longer.
4K Random Write IOPS
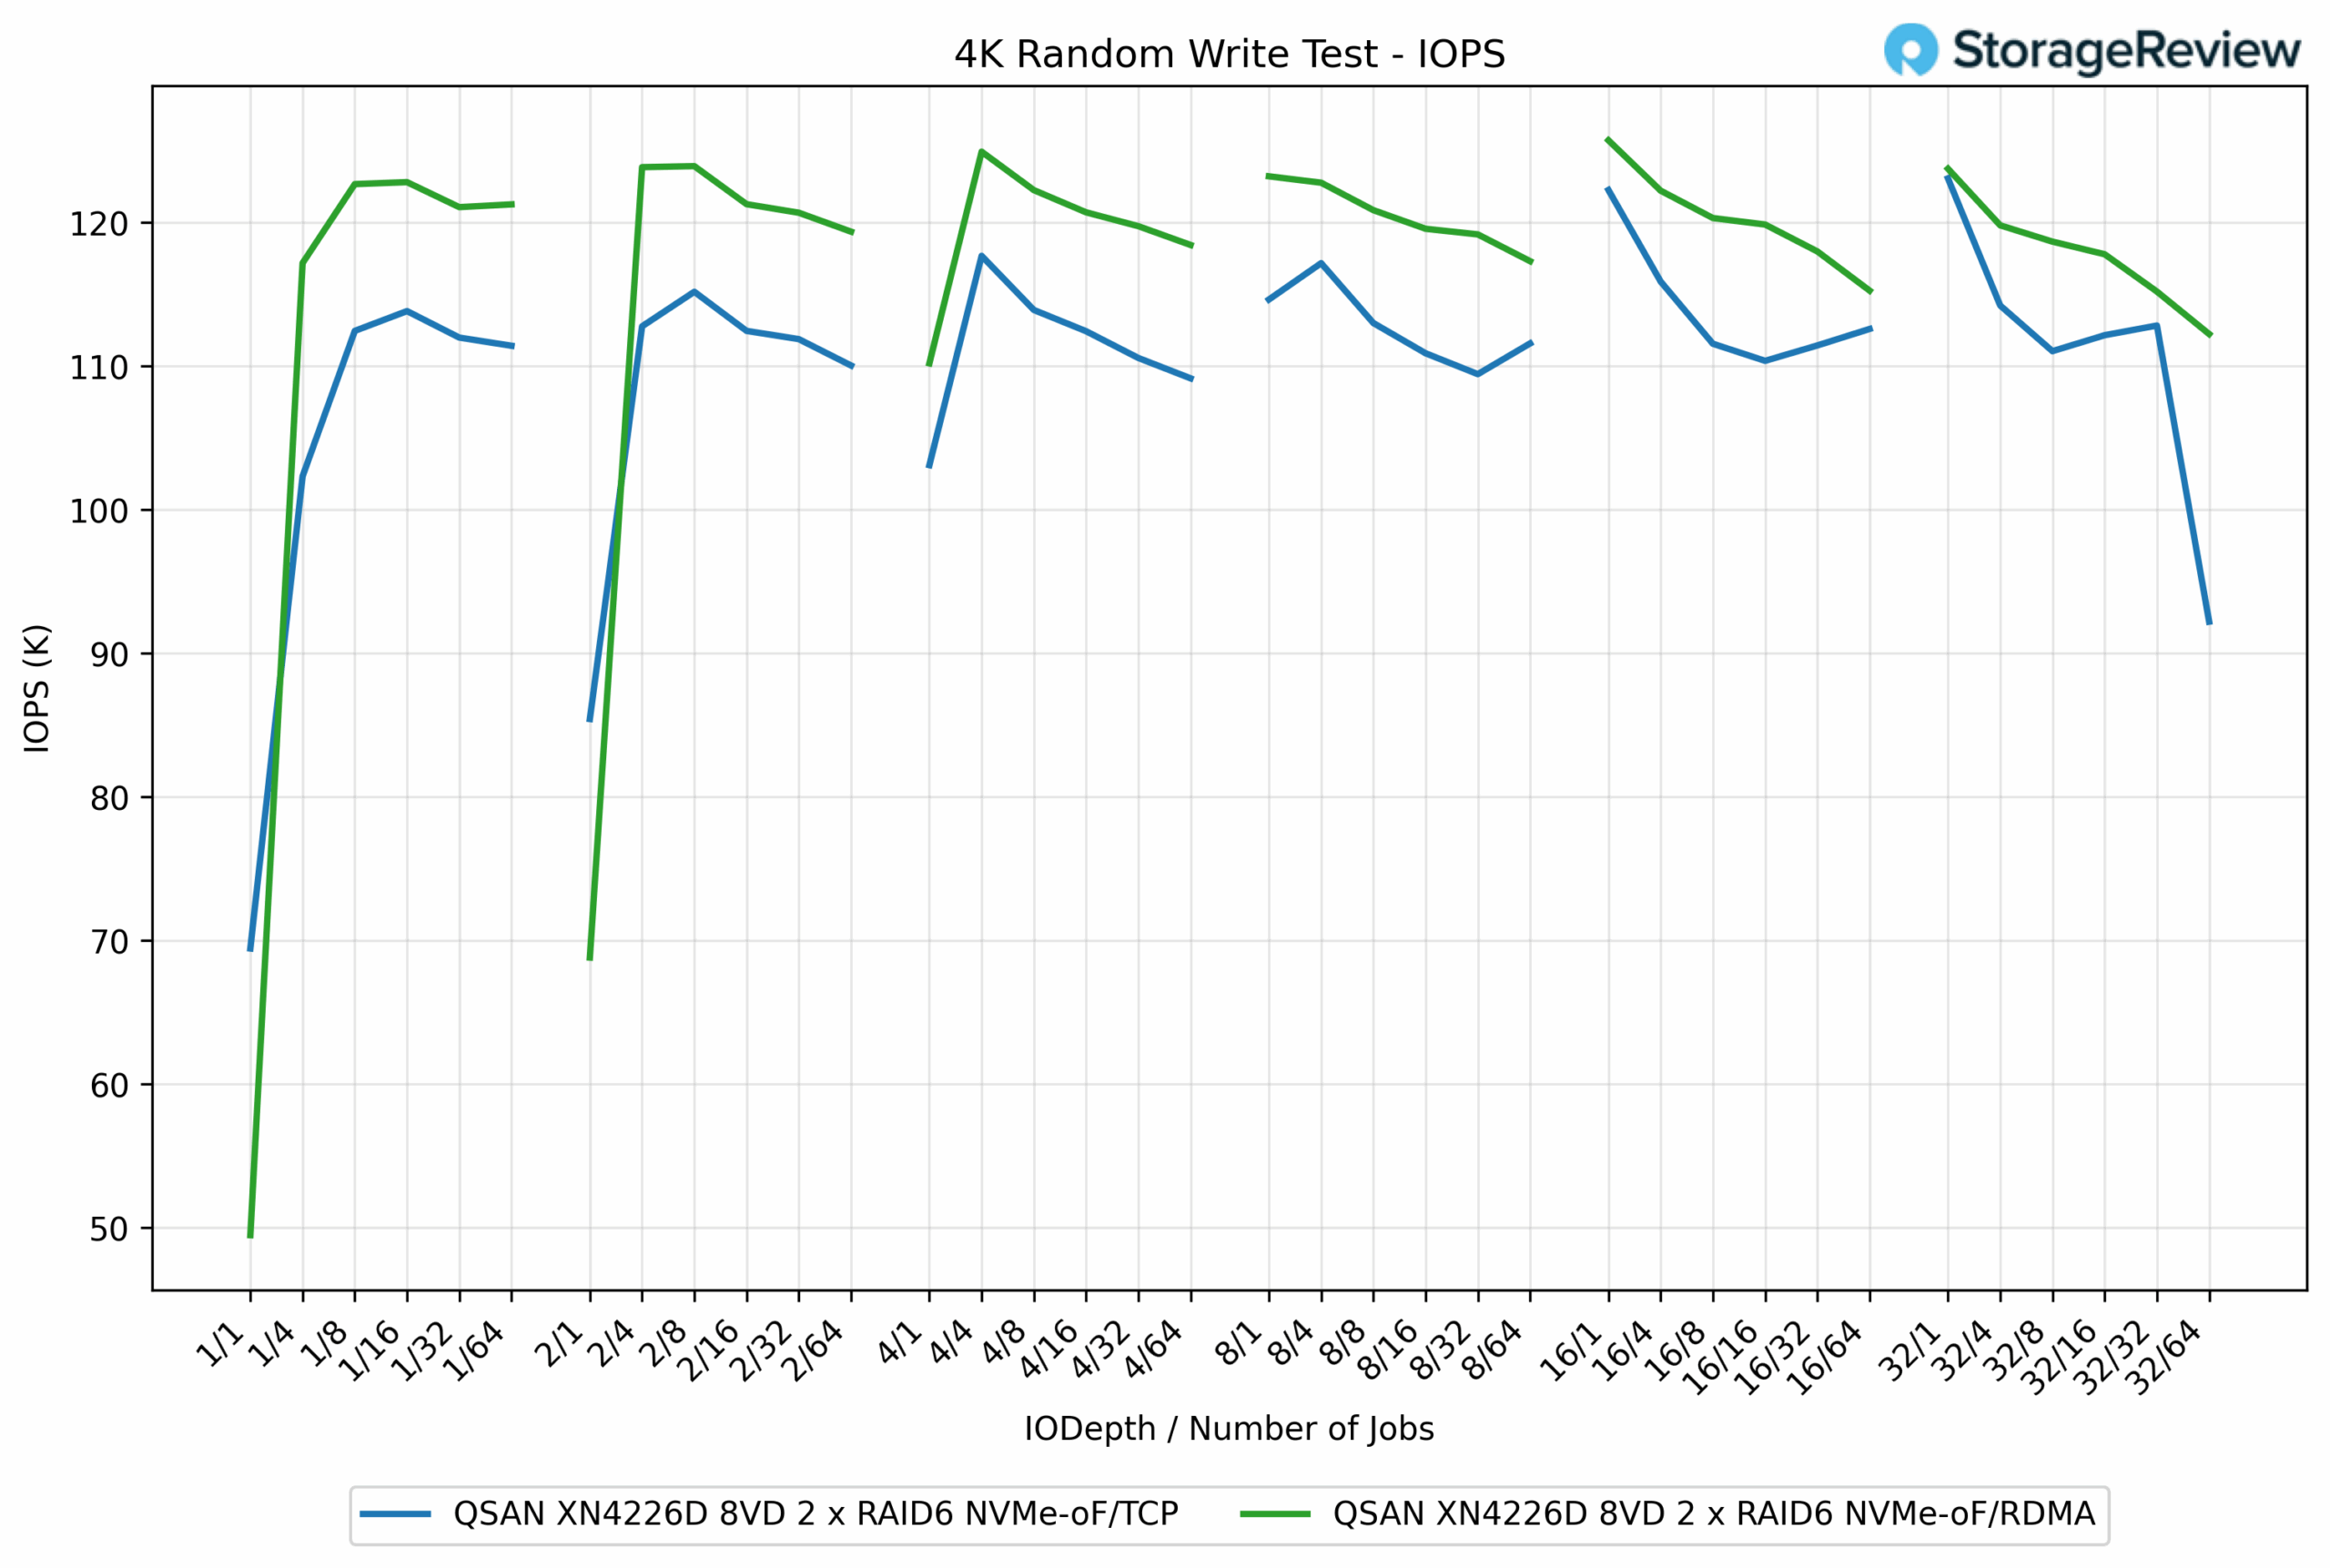
In the 4K Random Write test, RDMA consistently outperformed TCP, though the margin was smaller compared to the larger block size workloads. RDMA achieved a peak of 125.73K IOPS, while TCP reached 115.89K IOPS, resulting in an approximately 8.5% advantage for RDMA.
At lower queue depths, TCP trailed slightly behind RDMA but still delivered competitive performance. For example, at QD1/16 jobs, RDMA achieved 122.82K IOPS, compared to TCP’s 111.91K IOPS, an improvement of nearly 10%. Across most test points, RDMA hovered in the 120K to 125K IOPS range, while TCP maintained results between 110K and 116K IOPS, with a late drop at QD32/64 jobs to 92.21K IOPS.
4K Random Write Latency
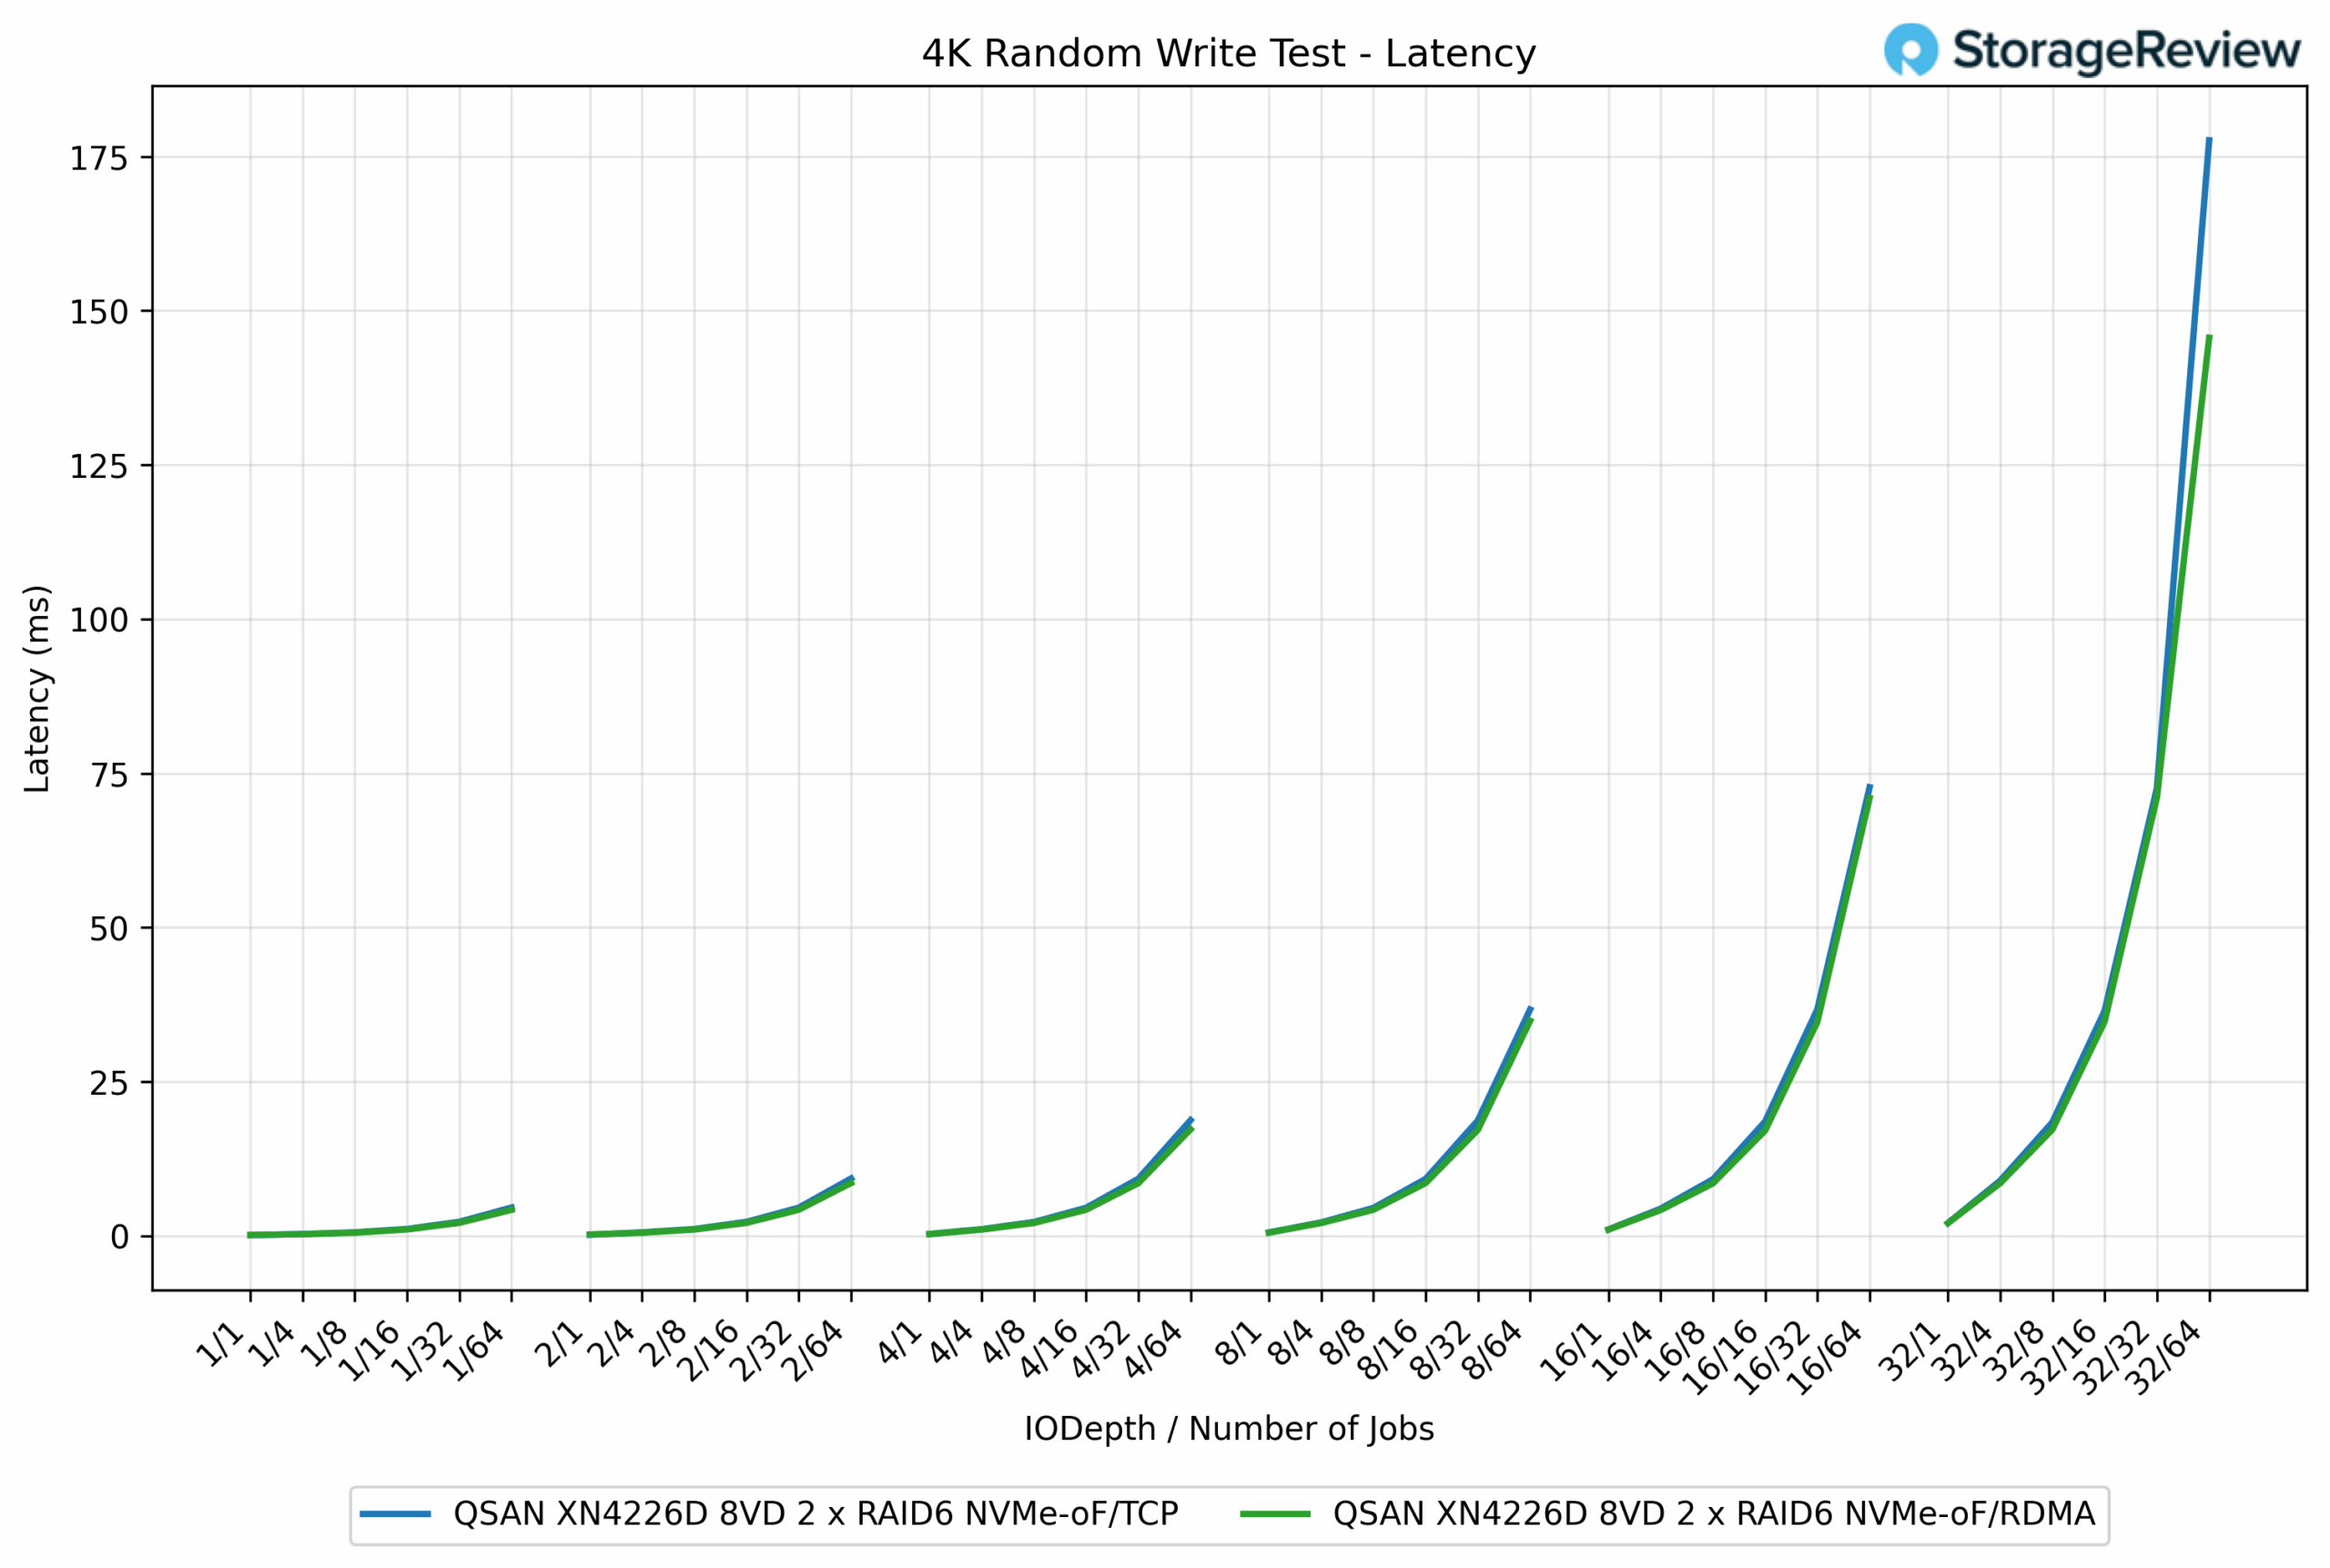
In the 4K Random Write latency test, RDMA consistently showed lower response times than TCP, though the margins were narrower compared to the larger block workloads. At lighter loads, both protocols were nearly identical, each staying below 1ms. For example, at QD1/1, TCP measured 0.16ms, while RDMA came in at 0.21ms.
As concurrency increased, the differences became more evident. At QD16/64 jobs, RDMA registered 19.36ms, compared to TCP’s 36.20ms, giving RDMA a 46% reduction in latency. At maximum depth, RDMA completed at 145.61ms, while TCP rose to 177.62ms, a 22% improvement for RDMA.
4K Random Read IOPS
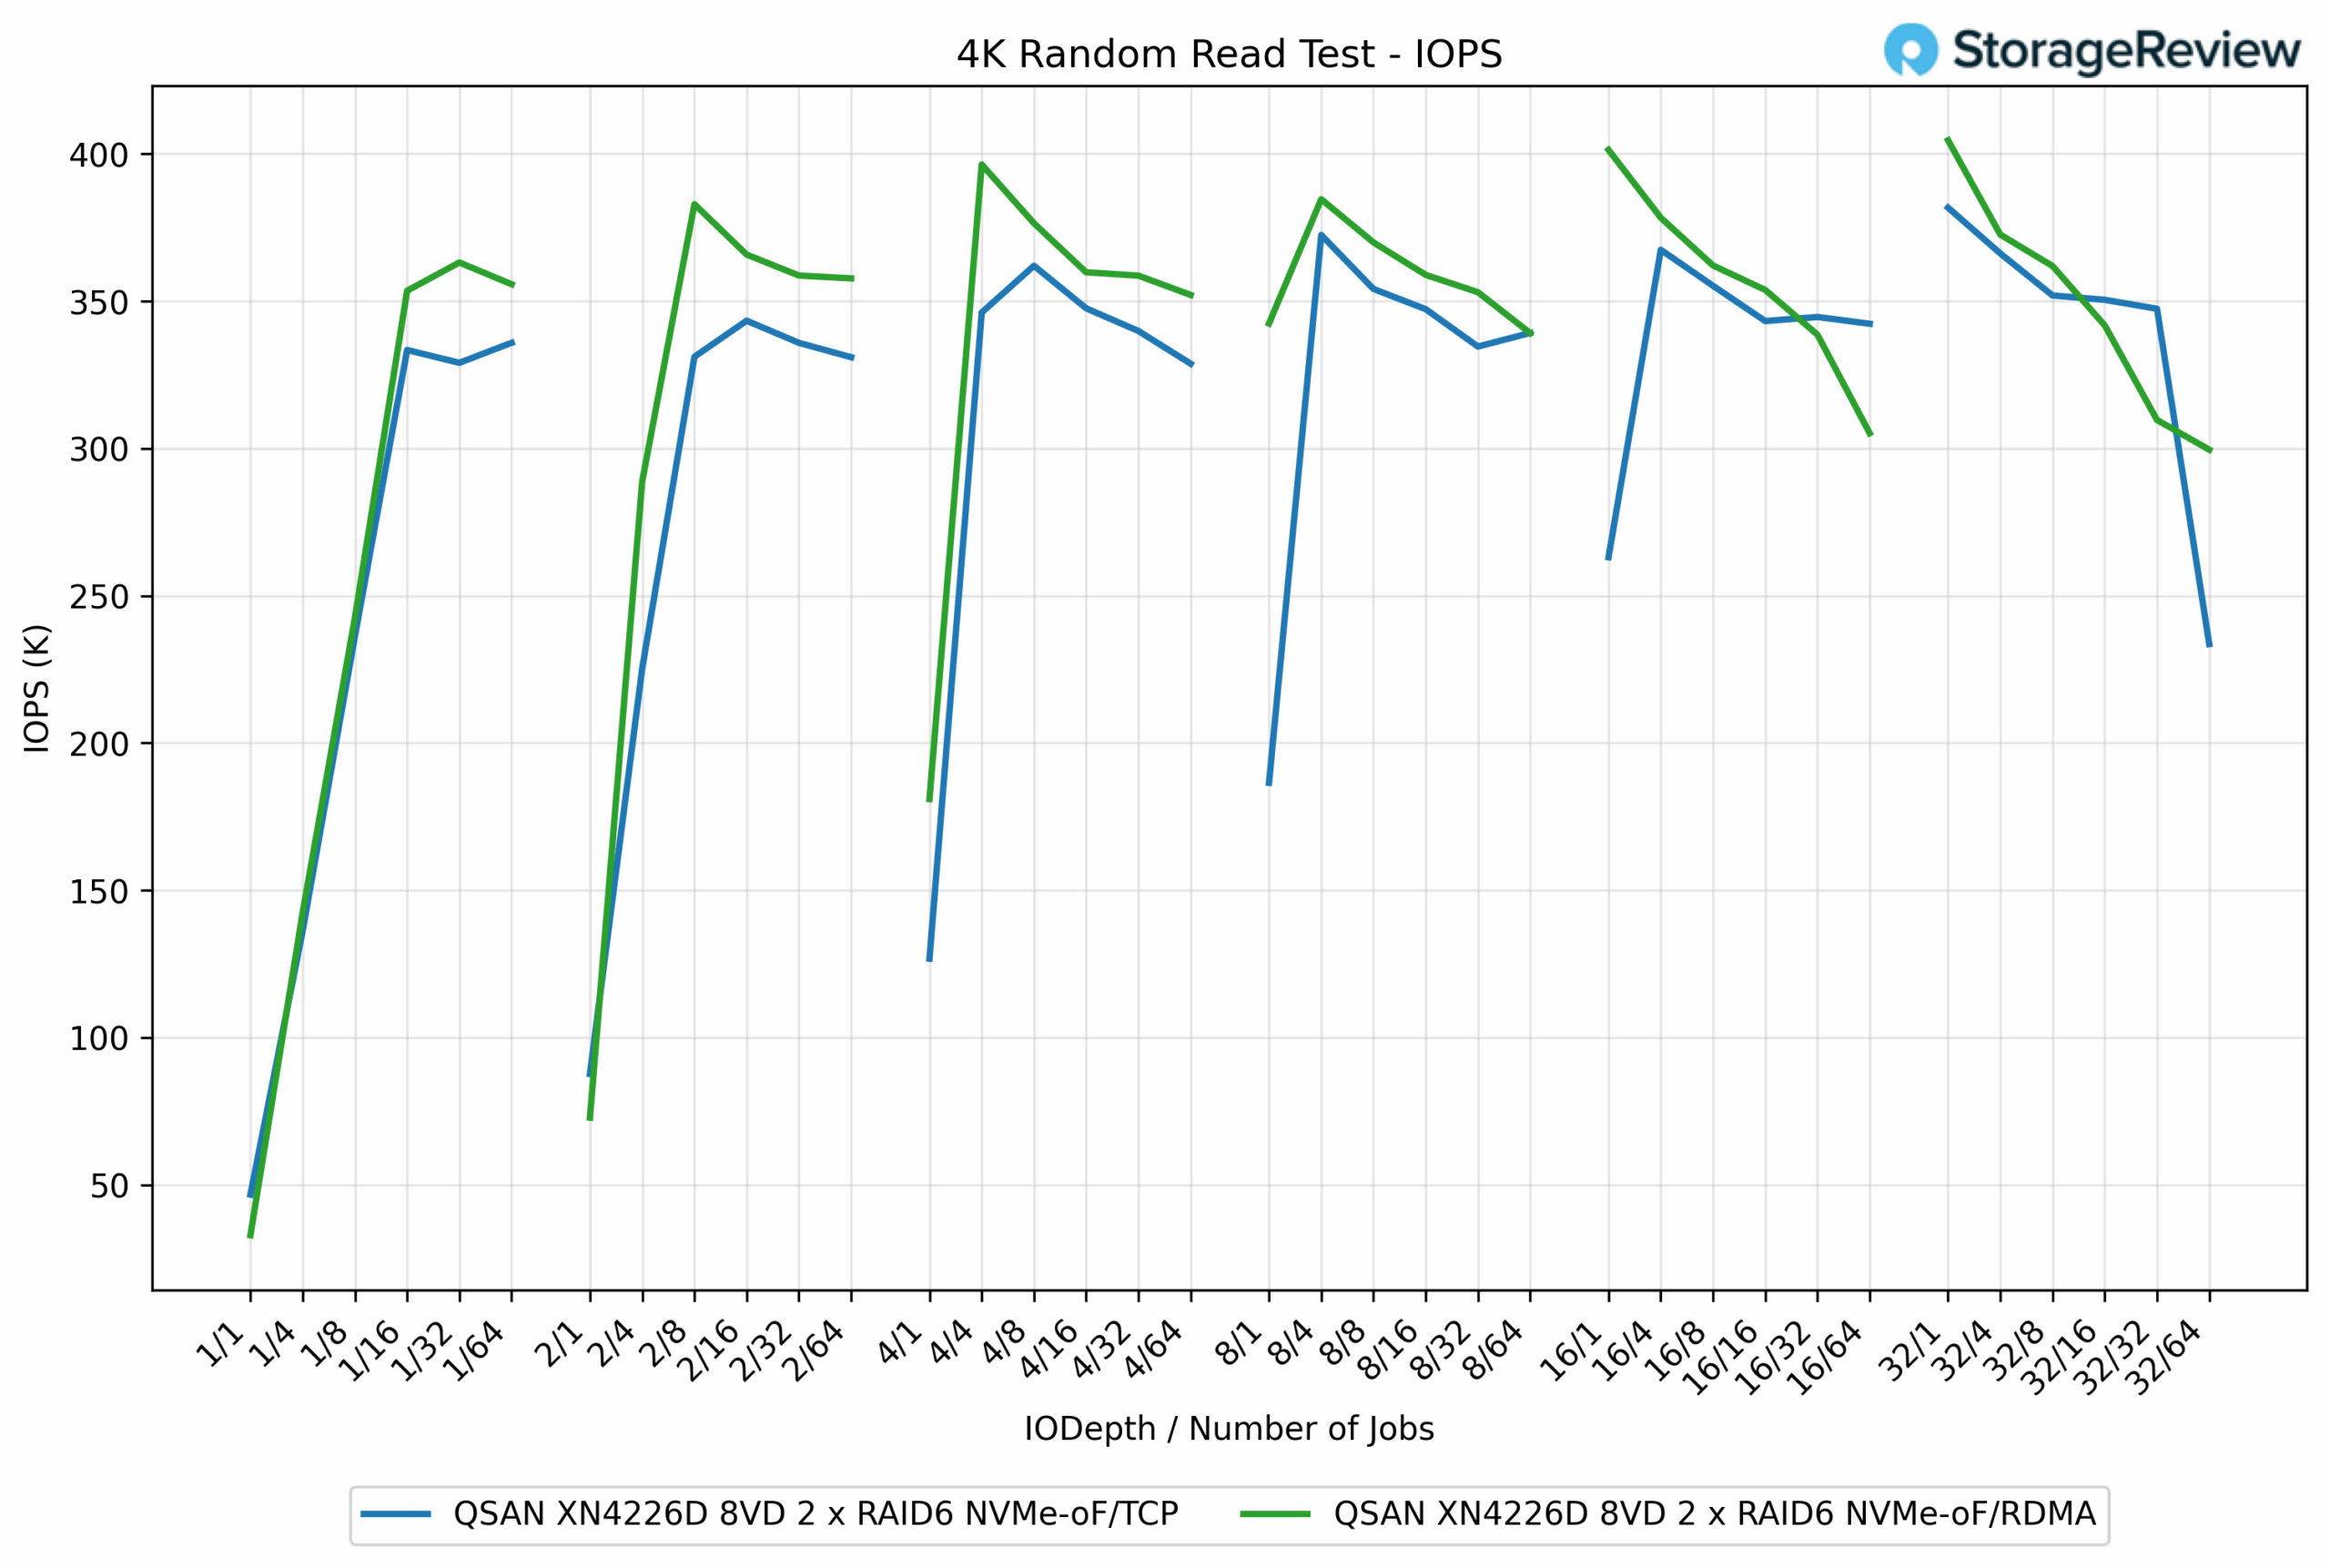
In the 4K Random Read test, both protocols delivered strong performance, though RDMA consistently held a slight edge over TCP. RDMA reached a peak of 404.64K IOPS, while TCP topped out at 382.96K IOPS, giving RDMA a 5.7% advantage.
At lower depths, the results were already in favor of RDMA. For example, at QD1/16 jobs, RDMA achieved 353.57K IOPS, compared to TCP’s 329.10K IOPS, a difference of about 7.5%. As workloads scaled, RDMA maintained its lead, typically operating in the 360K to 400K IOPS range, while TCP stayed closer to 330K to 380K IOPS.
4K Random Read Latency
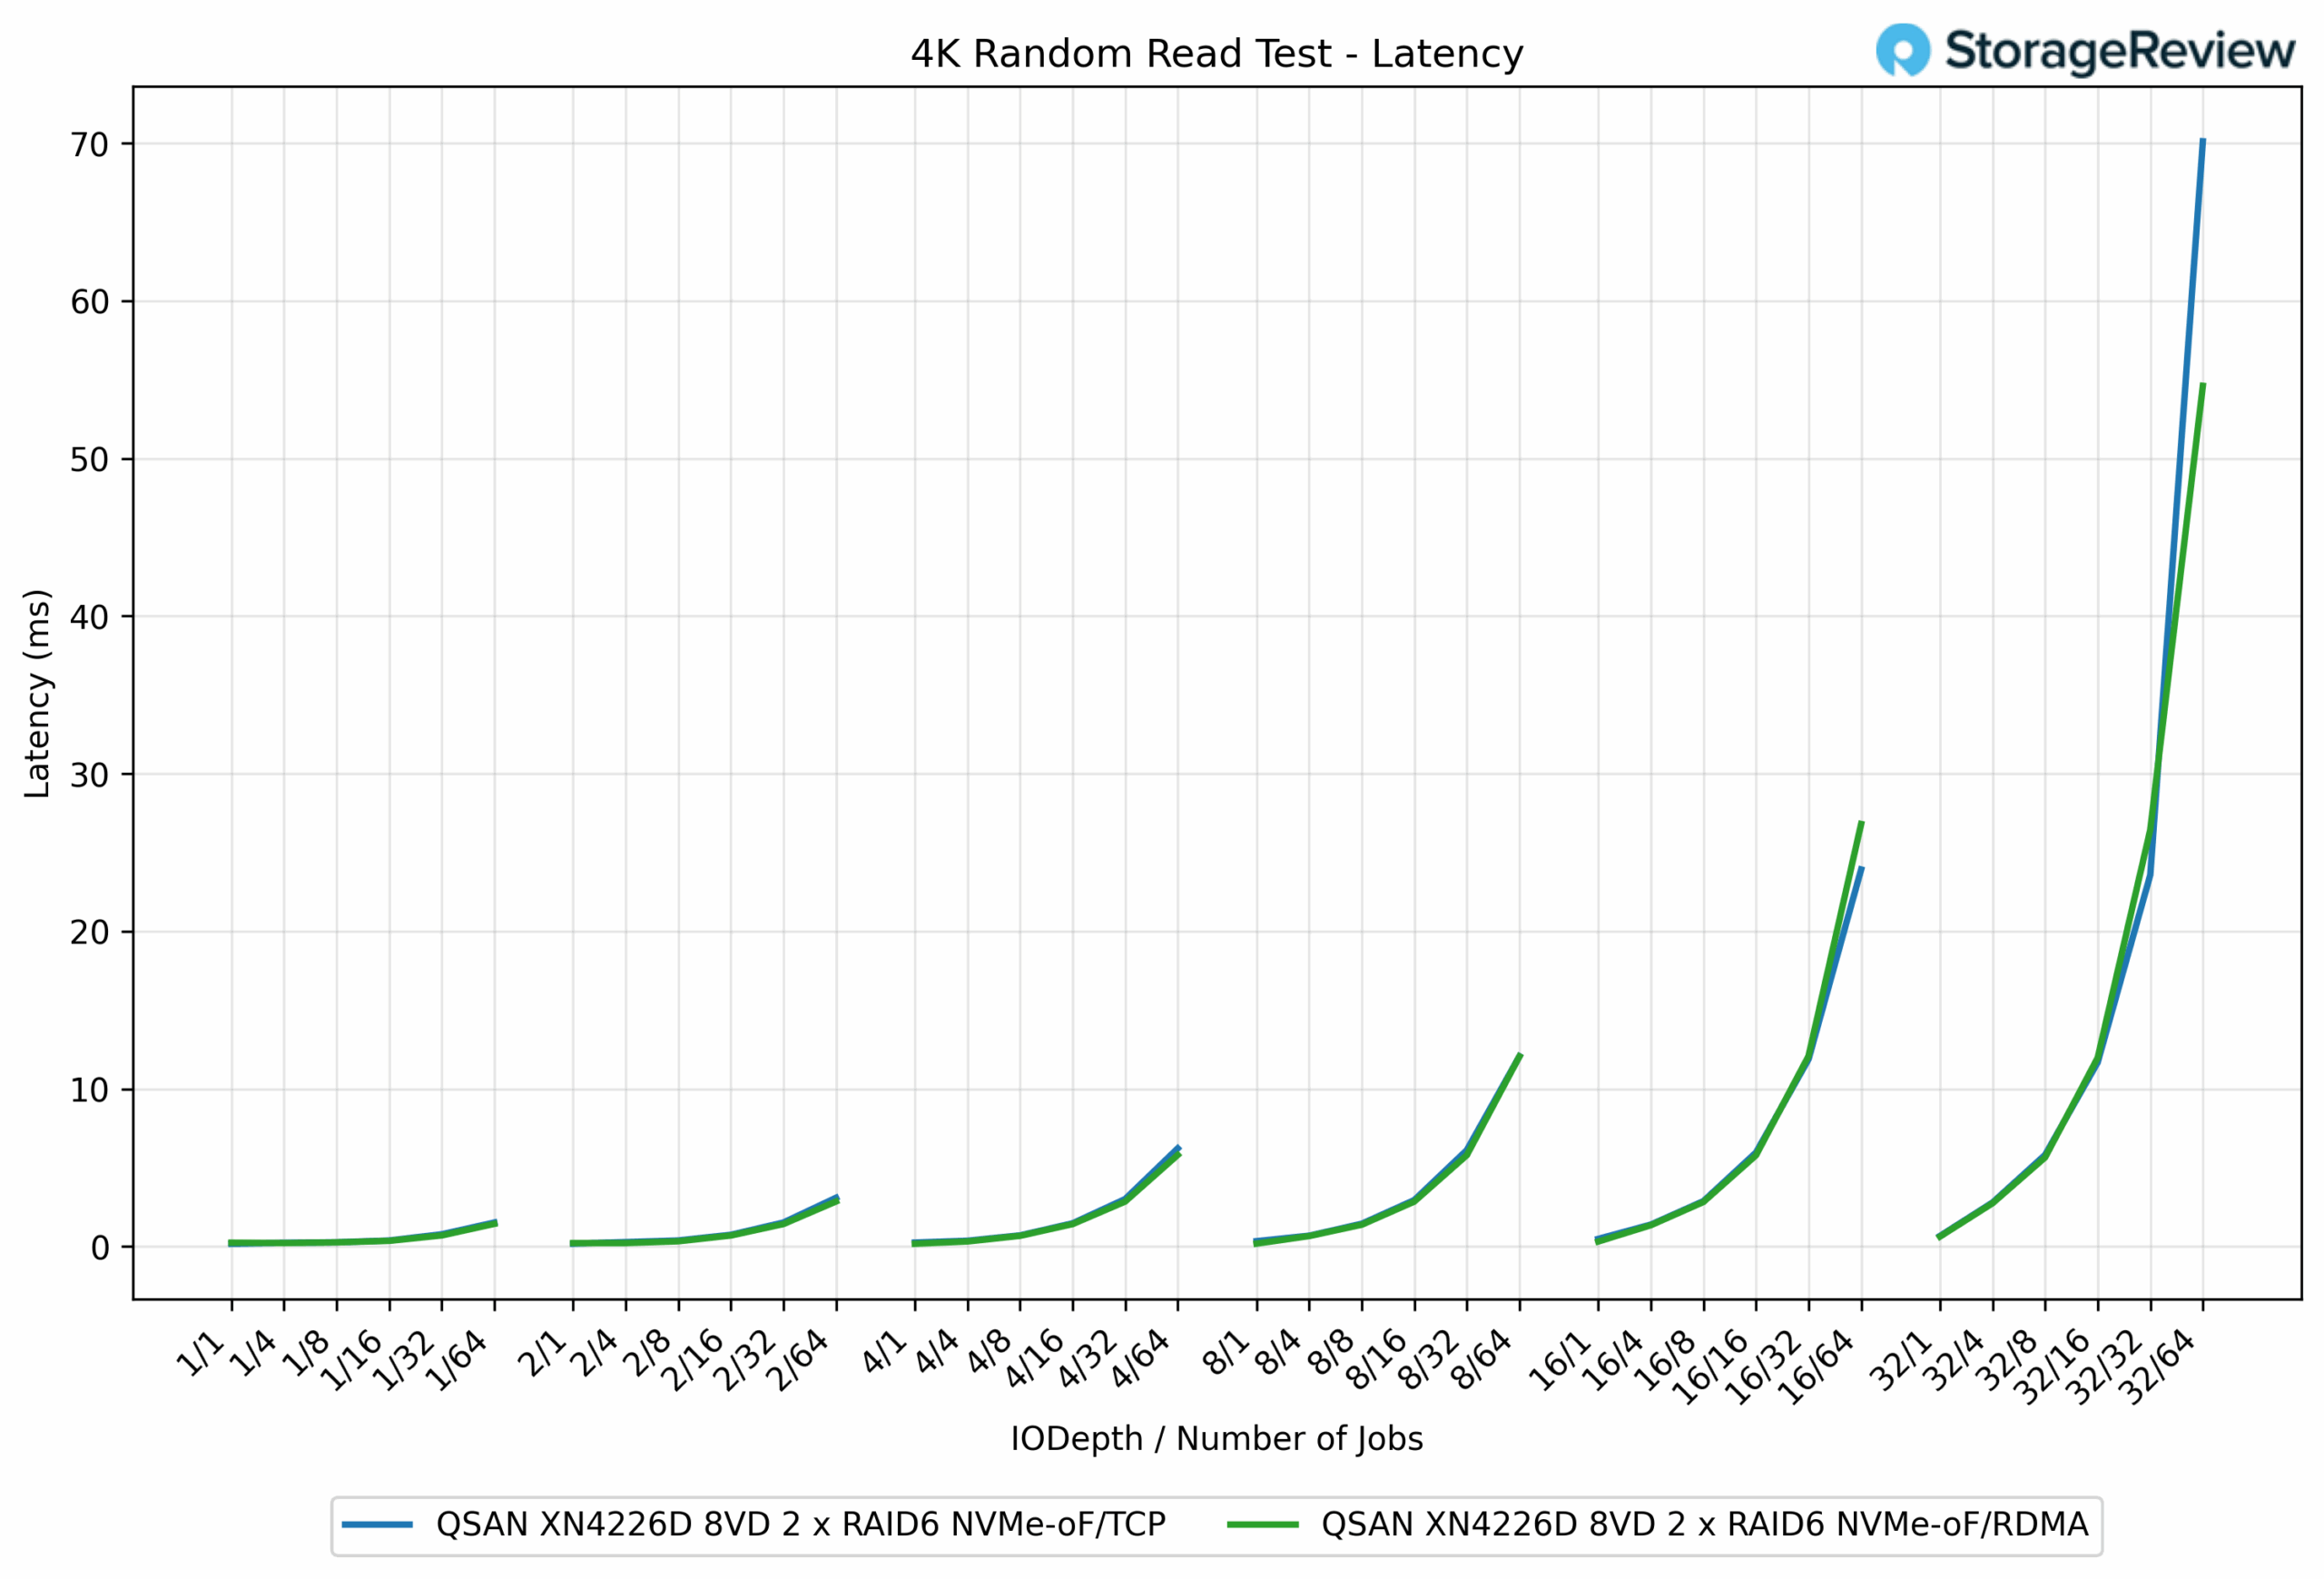
In the 4K Random Read latency test, RDMA demonstrated a clear efficiency advantage over TCP, notably as workloads increased in scale. At light queue depths, the two protocols were nearly identical. For example, at the QD1/1 job, TCP recorded 0.24ms, while RDMA was just behind at 0.27ms.
As concurrency increased, RDMA pulled ahead. At QD16/64 jobs, RDMA measured 23.92ms, while TCP came in at 26.81ms, a 10.8% improvement. At the highest load of QD32/64 jobs, RDMA completed at 54.61ms, while TCP ballooned to 70.12ms, a 22% reduction in latency for RDMA.
GPUDirect Storage Performance
One of the tests we conducted on this testbench was the Magnum IO GPUDirect Storage (GDS) test. GDS is a feature developed by NVIDIA that allows GPUs to bypass the CPU when accessing data stored on NVMe drives or other high-speed storage devices. Instead of routing data through the CPU and system memory, GDS enables direct communication between the GPU and the storage device, significantly reducing latency and improving data throughput.
How GPUDirect Storage Works
Traditionally, when a GPU processes data stored on an NVMe drive, the data must first travel through the CPU and system memory before reaching the GPU. This process introduces bottlenecks, as the CPU becomes a middleman, adding latency and consuming valuable system resources. GPUDirect Storage eliminates this inefficiency by enabling the GPU to access data directly from the storage device via the PCIe bus. This direct path reduces the overhead associated with data movement, allowing faster and more efficient data transfers.
AI workloads, especially those involving deep learning, are highly data-intensive. Training large neural networks requires processing terabytes of data, and any delay in data transfer can lead to underutilized GPUs and longer training times. GPUDirect Storage addresses this challenge by ensuring that data is delivered to the GPU as quickly as possible, minimizing idle time and maximizing computational efficiency.
In addition, GDS is particularly beneficial for workloads that involve streaming large datasets, such as video processing, natural language processing, or real-time inference. By reducing the reliance on the CPU, GDS accelerates data movement and frees up CPU resources for other tasks, further enhancing overall system performance.
Beyond raw bandwidth, GPUDirect with NVMe-oF (TCP/RDMA) also delivers ultra-low-latency I/O. This ensures GPUs are never starved for data, making the system ideal for real-time AI inferencing, analytics pipelines, and video replay.
For many practical deployments, this translates into 100–200 GbE usable throughput, aligning perfectly with workloads such as AI inferencing (2–4 GPUs), media production (broadcast replay, OTT edge caching), surveillance video analytics, and HPC checkpointing.
Read Throughput
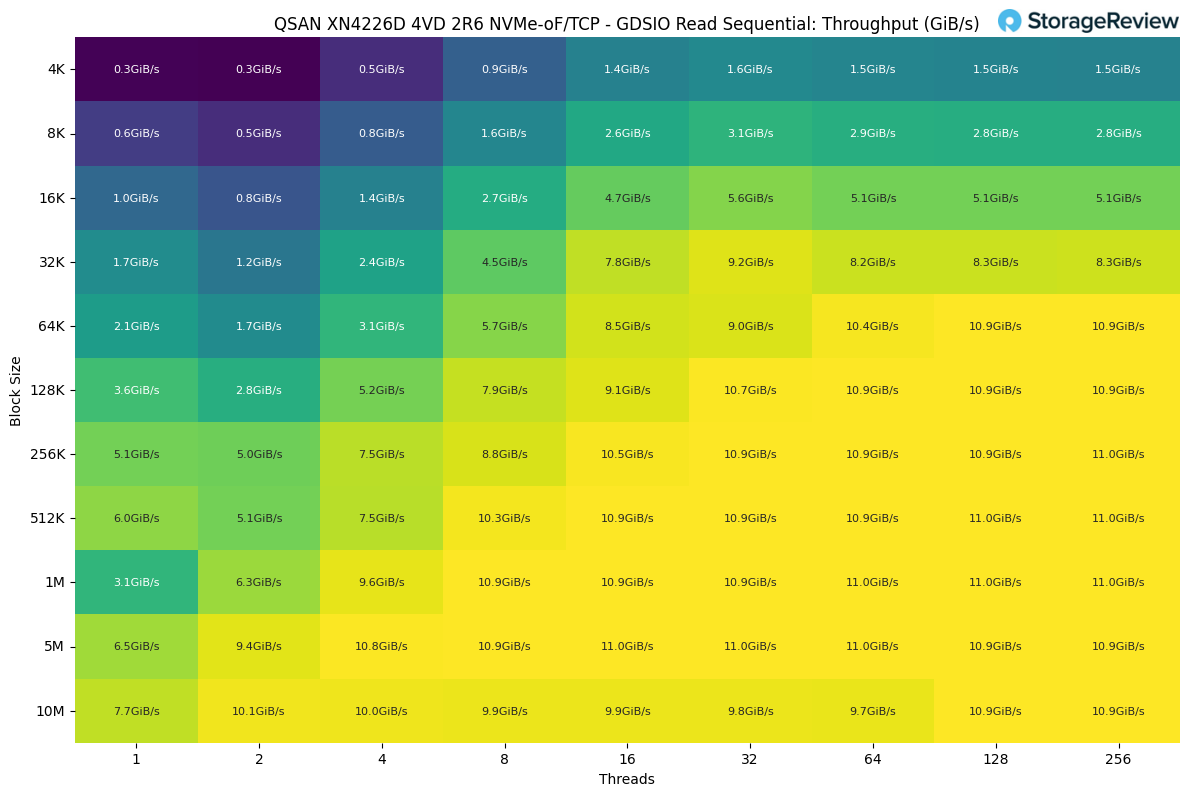
In the GDSIO Sequential Read workload, throughput scaled steadily with both block size and thread count, reaching a maximum of 11.0GiB/s across multiple test points. The highest results were sustained once block sizes reached 512K and above, where throughput consistently stabilized between 10.9 and 11.0GiB/s, regardless of thread count.
At smaller block sizes, performance started much lower. For example, with 4K blocks, throughput began at just 0.3GiB/s with a single thread and leveled out at 1.5GiB/s even at 256 threads. By comparison, increasing the block size to 64K enabled the system to scale up to 10.9GiB/s, nearly saturating throughput with higher thread counts.
The sweet spot appeared to be around 128K to 256K blocks, where throughput exceeded 10GiB/s with 32 or more threads and remained consistent across the largest block sizes tested. This demonstrates how the platform achieves full bandwidth saturation once block sizes become sufficiently large, with only incremental gains beyond 256K.
Read Latency
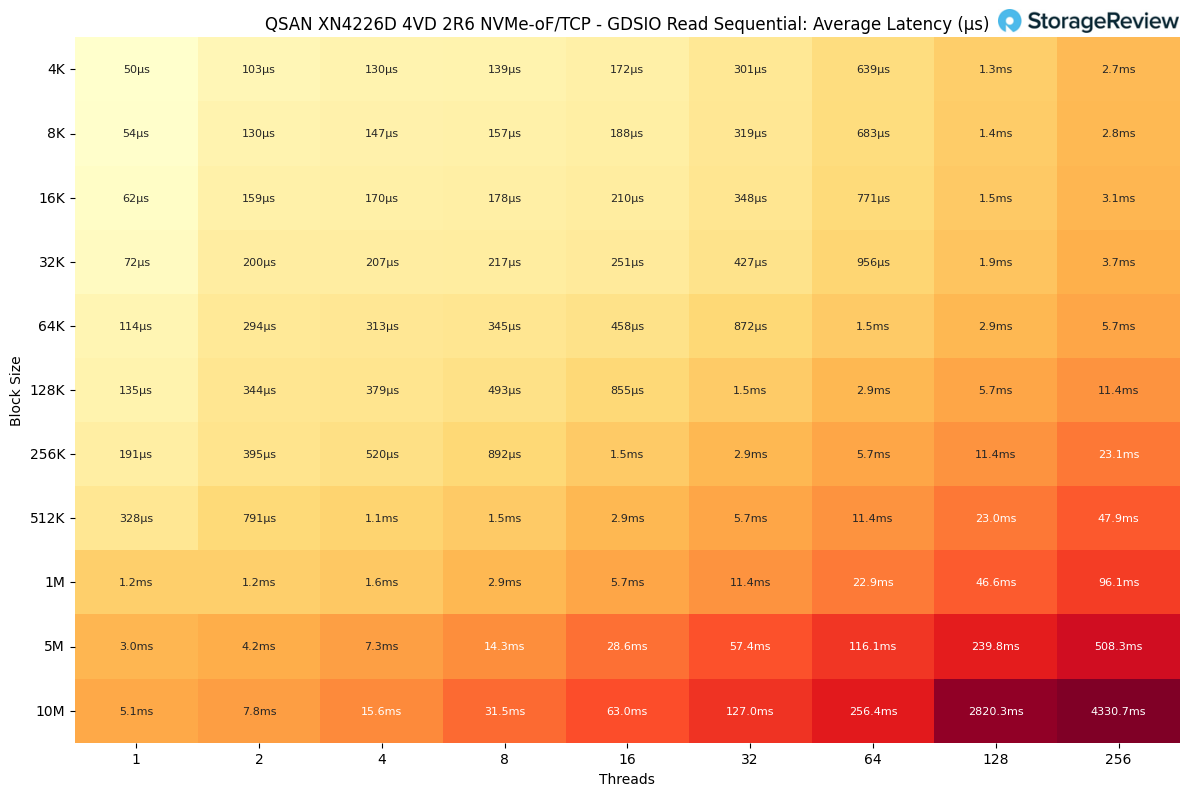
In the GDSIO Sequential Read latency results, response times scaled predictably with both block size and thread count. At the smallest workloads, latency remained extremely low. For example, with 4K blocks at a single thread, latency measured just 50µs, staying under 200µs up to 32K block sizes with minimal concurrency.
As thread counts increased, latency began to rise more noticeably. At 64K blocks and 64 threads, latency reached 1.5ms, doubling to 2.9ms at 128 threads, and climbing to 5.7ms at 256 threads. By contrast, smaller block sizes, such as 4K and 8K, only pushed into the 2.7–2.8ms range, even at the maximum 256 threads, showing tighter control at finer granularities.
Larger block sizes created more dramatic jumps. At 1M blocks and 256 threads, latency reached 96.1ms, while 10M blocks at 256 threads spiked to 4.3s, clearly showing the system’s scaling limits under extreme conditions.
Write Throughput
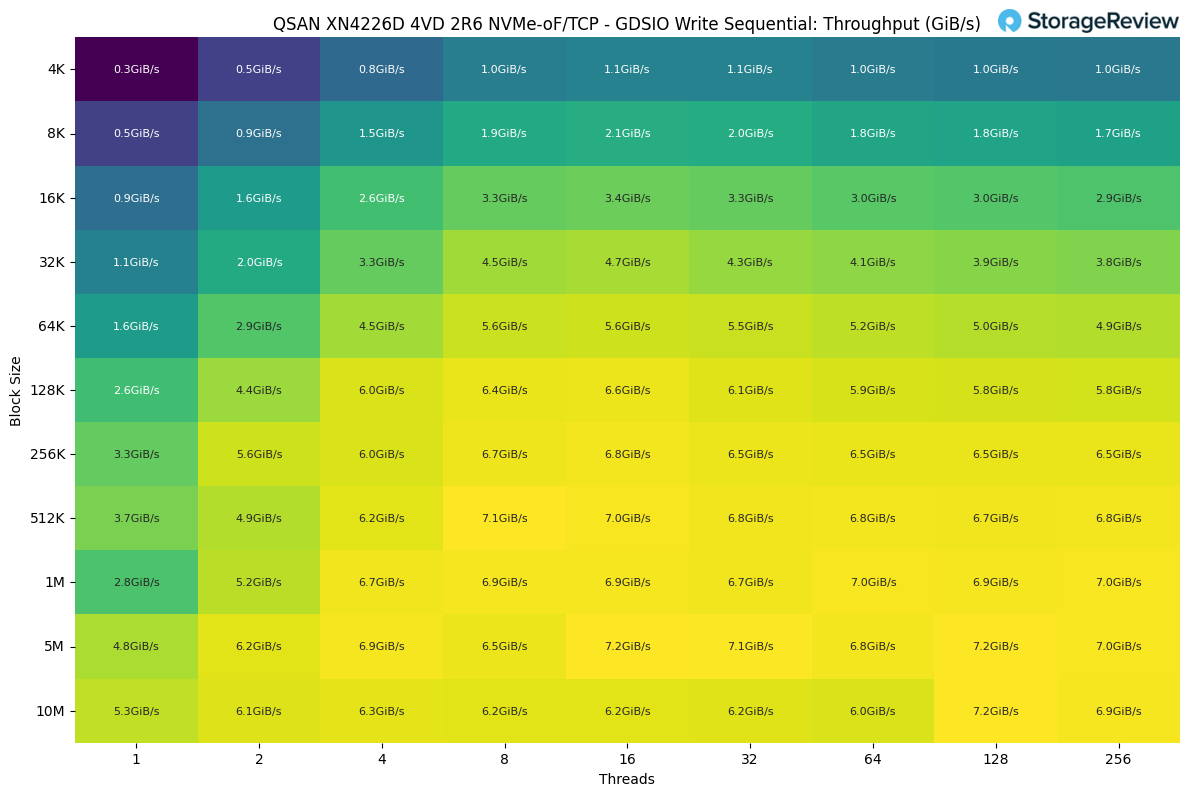
In the GDSIO Sequential Write workload, throughput scaled with both block size and thread count but plateaued well below the read performance ceiling. The system achieved a peak of 7.2 GiB/s, utilizing larger block sizes, such as 5M and 10M, at 128 threads.
At the smallest block sizes, throughput was modest. With 4K blocks, performance started at 0.3GiB/s with a single thread and scaled to 1.0 GiB/s with 32 threads, then leveled off. Increasing the block size to 64K unlocked more bandwidth, reaching 5.6GiB/s with eight threads before tapering slightly at higher concurrency.
The best balance occurred around 512K to 1M blocks, where throughput ranged from 6.7 to 7.1GiB/s across different thread counts, indicating that the system reached saturation in this range. Beyond that point, additional threads did not yield meaningful gains, and in some cases, performance actually dipped slightly due to increased overhead.
Write Latency
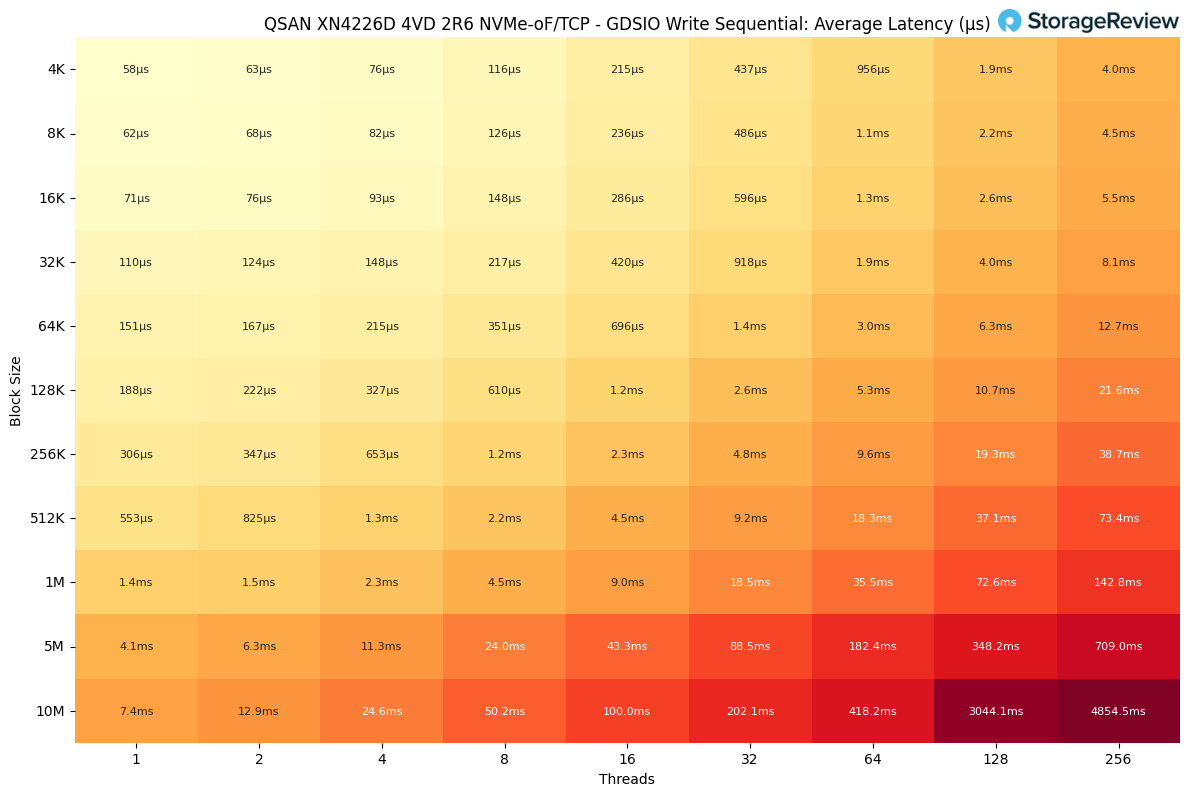
In the GDSIO Sequential Write latency results, response times scaled smoothly at lower block sizes but escalated sharply once both block size and thread count increased.
At the smallest workloads, latency was minimal. With 4K blocks and a single thread, average latency measured just 58µs, and remained under 200µs through 16K blocks at up to four threads. Even with 32K blocks and moderate concurrency, latency stayed under 1ms.
As the system transitioned to larger block sizes, delays became more pronounced. At 128K blocks and 64 threads, latency reached 5.3ms, doubling again to 10.7ms at 128 threads. With 512K blocks, results stretched further, climbing to 73.4ms at 256 threads.
The heaviest cases, 5M and 10M blocks at 256 threads, experienced a dramatic spike in latency to 709ms and 4.8 seconds, respectively, revealing the upper limits of sequential write scaling.
Final Thoughts
QSAN’s XN4226D lands exactly where many IT teams need it to be. It is a unified, dual-controller NVMe platform that supports both modern and legacy protocols without requiring architectural changes. In our testing, TCP led large sequential reads at 21.21 GB/s, while RDMA produced the strongest large sequential writes at 11.14 GB/s and held latency lower as concurrency scaled. At smaller block sizes, RDMA consistently improved random write efficiency and kept tail behavior in check. The takeaway is simple. Use NVMe-oF TCP for broad compatibility and high-read bandwidth, and reach for RDMA when write latency and consistency matter most.
The hardware footprint is practical. You get 26 front bays for U.2 or U.3 NVMe drives in a 2U chassis, with active high availability and straightforward expansion to SAS shelves when capacity takes priority over raw NVMe speed. QSM 4 delivers the expected data services and a clean UI, along with a REST API that facilitates seamless integration with existing automation. Small IT teams should find QSM 4 to be easy to configure and manage. To validate this, we easily integrated our Proxmox cluster, providing those VMs with access to high-speed storage. For more advanced workloads, the QSAN is well-poised to deliver on SMB AI needs.
For organizations that value predictable performance, clean management, and multiprotocol reach, the XN4226D is easy to recommend. It delivers real NVMe throughput, strong write latency with RDMA, and a software experience that will not slow you down. Add the reasonable price point, and this QSAN platform can anchor mixed environments without drama.


 Amazon