

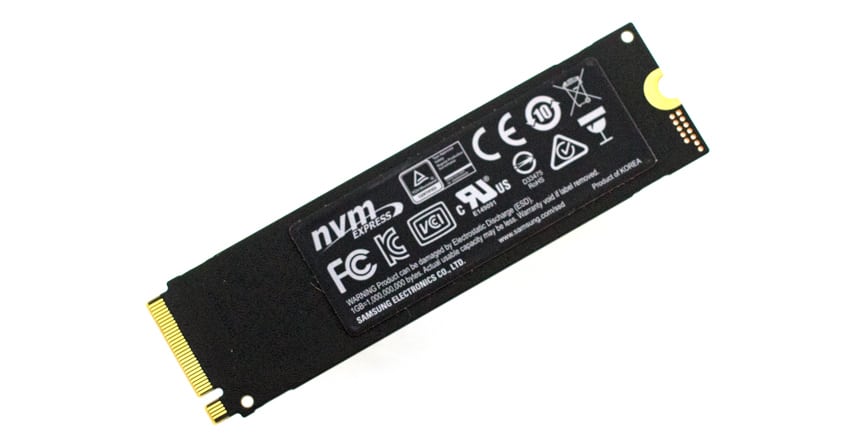
Released earlier this year, the Samsung 970 EVO Plus line is the latest NVMe SSD portfolio from the company. The 970 EVO Plus line comes in M.2 2280 form factor and is aimed at IT professionals, pro gamers, creative professionals, and general tech enthusiasts. Not part of the initial release, Samsung has now rolled out a 2TB capacity of the drive. The new version doubles the initial 1TB capacity and brings a few performance bumps with reported speeds of 3.5GB/s read 3.3GB/s write sequentially, and random (QD32) of 620K IOPS read and 560K IOPS write, with random (QD1) of 19K IOPS read and 62K IOPS write.
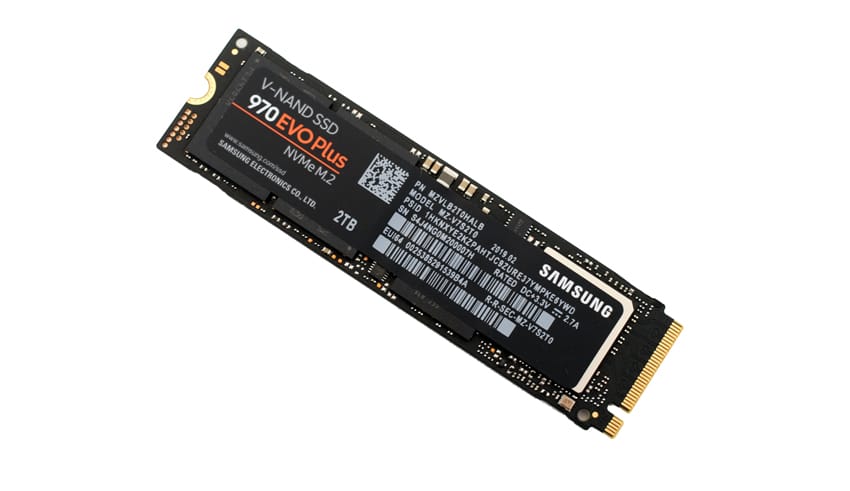
The 2TB Samsung 970 EVO Plus comes with a 5-year or 1,200TB warranty and can be picked up today for about $500.
Samsung 970 EVO Plus 2TB Specifications
| Form Factor | M.2 (2280) | ||
| Interface | PCIe Gen 3.0 x4, NVMe 1.3 | ||
| Capacity | 2TB | ||
| Controller | Samsung Phoenix Controller | ||
| NAND | Samsung V-NAND 3bit MLC | ||
| DRAM Cache Memory | 1GB LPDDR4 | ||
| Performance | |||
| Sequential Read | 3500 MB/s | ||
| Sequential Write | 3300 MB/s | ||
| Random Read (QD 32 Thread 4) | 620K IOPS | ||
| Random Write (QD 32 Thread 4) | 560K IOPS | ||
| Power Consumption | |||
| Idle (ASPT on) | 30 mW | ||
| Active (Avg.) Read | 5.5W | ||
| Active (Avg.) Write | 6.0W | ||
| L1.2 mode | 5 mW | ||
| Temperature | |||
| Operating | 0oC to 70oC | ||
| Non-Operating | -45oC to 85oC | ||
| Humidity | 5% to 95% non-condensing | ||
| Shock (Non-Operating) | 1,500G(Gravity), duration: 0.5ms, 3 axis | ||
| Vibration (Non-Operating) | 20~2,000Hz, 20G | ||
| Dimension | Max 80.15 x Max 22.15 x Max 2.38 (mm) | ||
| MTBF | 1.5 million hours | ||
| Warranty | 5 years, limited | ||
Samsung 970 EVO Plus 2TB Performance
Testbed
The test platform leveraged in these tests is a Dell PowerEdge R740xd server. We measure SATA performance through a Dell H730P RAID card inside this server, although we set the card in HBA mode only to disable the impact of RAID card cache. NVMe is tested natively through an M.2 to PCIe adapter card. The methodology used better reflects end-user workflow with the consistency, scalability and flexibility testing within virtualized server offers. A large focus is put on drive latency across the entire load range of the drive, not just at the smallest QD1 (Queue-Depth 1) levels. We do this because many of the common consumer benchmarks don’t adequately capture end-user workload profiles.
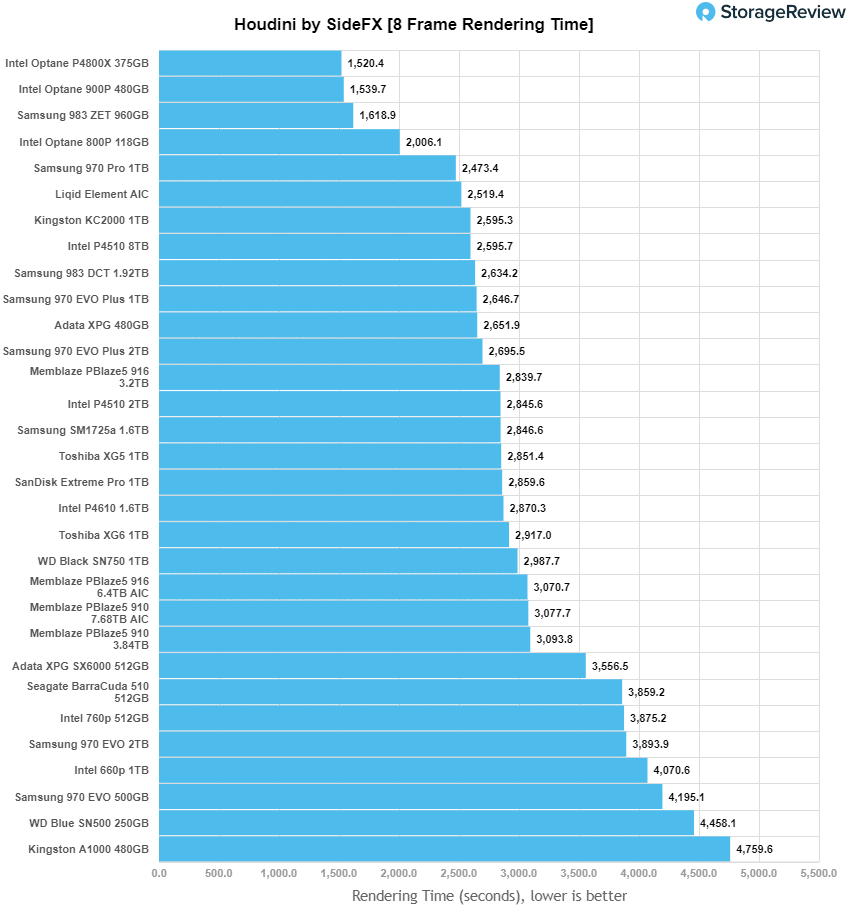
Houdini by SideFX
The Houdini test is specifically designed to evaluate storage performance as it relates to CGI rendering. The test bed for this application is a variant of the core Dell PowerEdge R740xd server type we use in the lab with dual Intel 6130 CPUs and 64GB DRAM. In this case we installed Ubuntu Desktop (ubuntu-16.04.3-desktop-amd64) running bare metal. Output of the benchmark is measured in seconds to complete, with fewer being better.
The Maelstrom demo represents a section of the rendering pipeline that highlights the performance capabilities of storage by demonstrating its ability to effectively use the swap file as a form of extended memory. The test does not write out the result data or process the points in order to isolate the wall-time effect of the latency impact to the underlying storage component. The test itself is composed of five phases, three of which we run as part of the benchmark, which are as follows:
- Loads packed points from disk. This is the time to read from disk. This is single threaded, which may limit overall throughput.
- Unpacks the points into a single flat array in order to allow them to be processed. If the points do not have dependency on other points, the working set could be adjusted to stay in-core. This step is multi-threaded.
- (Not Run) Process the points.
- Repacks them into bucketed blocks suitable for storing back to disk. This step is multi-threaded.
- (Not Run) Write the bucketed blocks back out to disk.
Looking at the performance of rendering time (where less is better), the 970 EVO Plus 2TB found itself in the upper-half of the scoreboard with 2,695.5 seconds, falling a few places behind the Samsung 970 EVO Plus 1TB, which placed at the top of the non-Optane drives.
SQL Server Performance
We use a lightweight virtualized SQL Server instance to appropriately represent what an application developer would use on a local workstation. The test is similar to what we run on storage arrays and enterprise drives, just scaled back to be a better approximation for behaviors employed by the end user. The workload employs the current draft of the Transaction Processing Performance Council’s Benchmark C (TPC-C), an online transaction processing benchmark that simulates the activities found in complex application environments.
The lightweight SQL Server VM is configured with three vDisks: 100GB volume for boot, a 350GB volume for the database and log files, and a 150GB volume used for the database backup we recover after each run. From a system resource perspective, we configure each VM with 16 vCPUs, 32GB of DRAM and leverage the LSI Logic SAS SCSI controller. This test uses SQL Server 2014 running on Windows Server 2012 R2 guest VMs and is stressed by Dell’s Benchmark Factory for Databases.
SQL Server Testing Configuration (per VM)
- Windows Server 2012 R2
- Storage Footprint: 600GB allocated, 500GB used
- SQL Server 2014
- Database Size: 1,500 scale
- Virtual Client Load: 15,000
- RAM Buffer: 24GB
- Test Length: 3 hours
- 2.5 hours preconditioning
- 30 minutes sample period
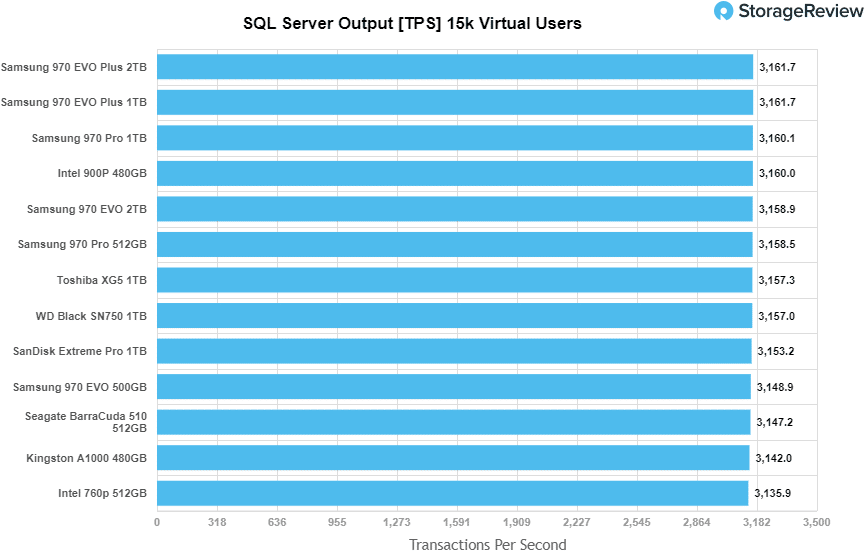
When looking at SQL Server Output, the Samsung 970 Plus 2TB tied the 1TB as the top performing drive with 3,161.7 TPS.
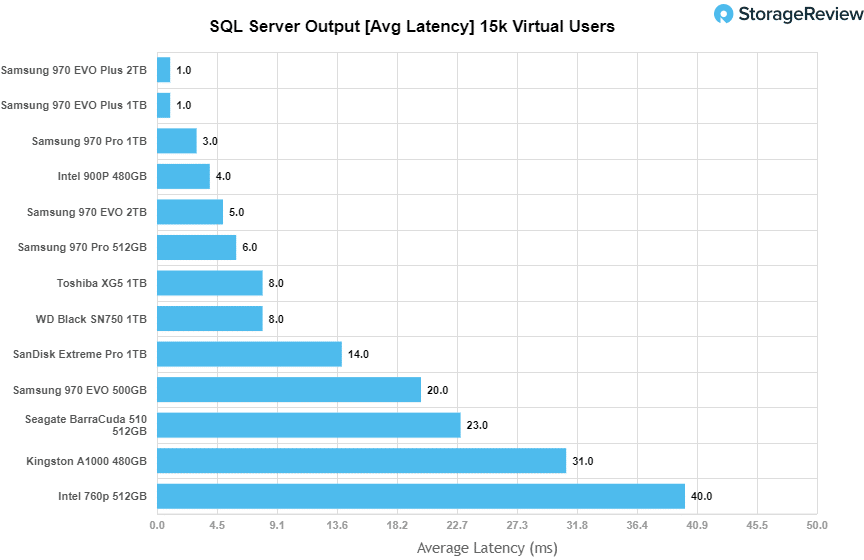
Looking at average latency in the same test, the 2TB again tied the 1TB for the top spot at only 1ms.
VDBench Workload Analysis
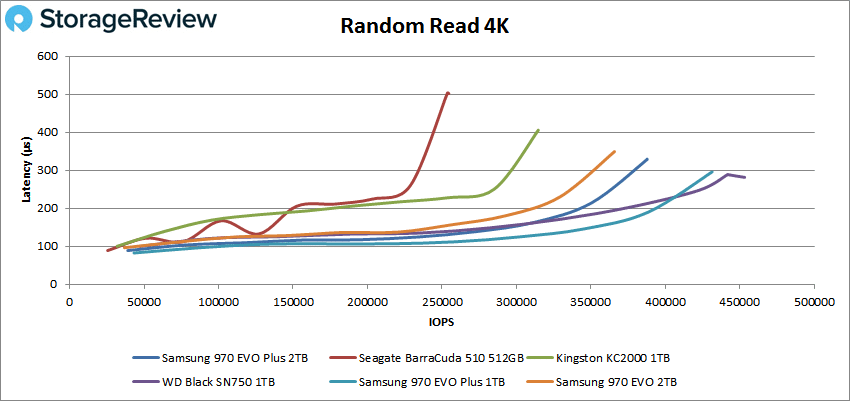
In our first VDBench Workload Analysis, we looked at random 4K read performance. Here, the 970 EVO Plus started below 100ms and went on to peak at 387,943 IOPS with a latency of 328.9ms placing third overall.
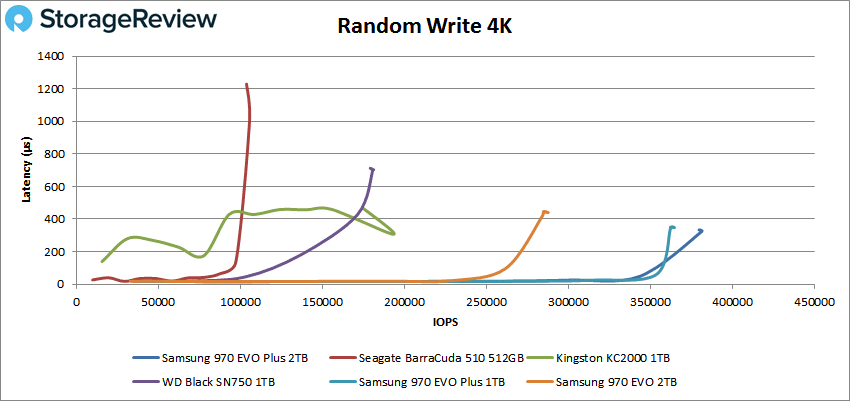
Next up is our random 4K write where we saw the 970 EVO Plus 2TB come out as the top performer. Here the drive stayed below 100ms until it was over 350K IOPS and peaked at 381,604 IOPS with a latency of 325.1ms.
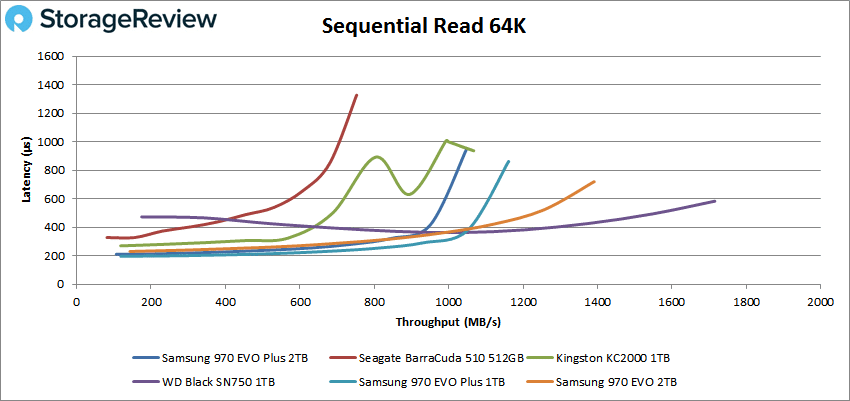
Switching over to sequential benchmarks, in the 64K read the 970 EVO Plus 2TB fell to fourth place with peak performance of 16,764 IOPS or 1.05GB/s at a latency of 953.7ms.
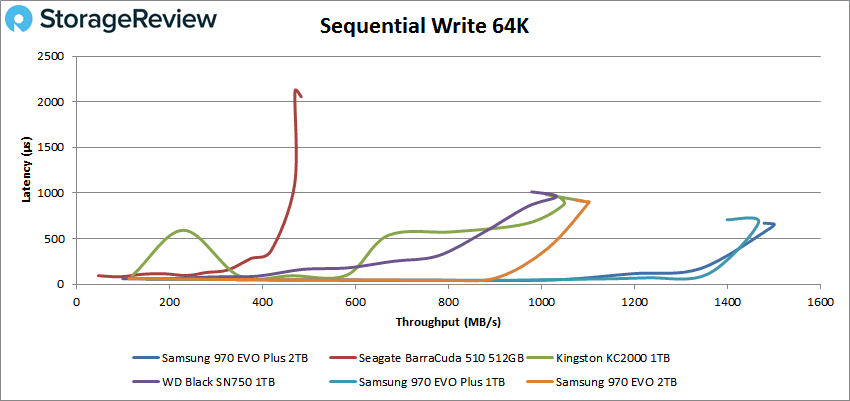
With 64K writes we again see the drive do well taking top spot with peak performance of 23,911 IOPS or 1.5GB/s at a latency of 659.4ms.
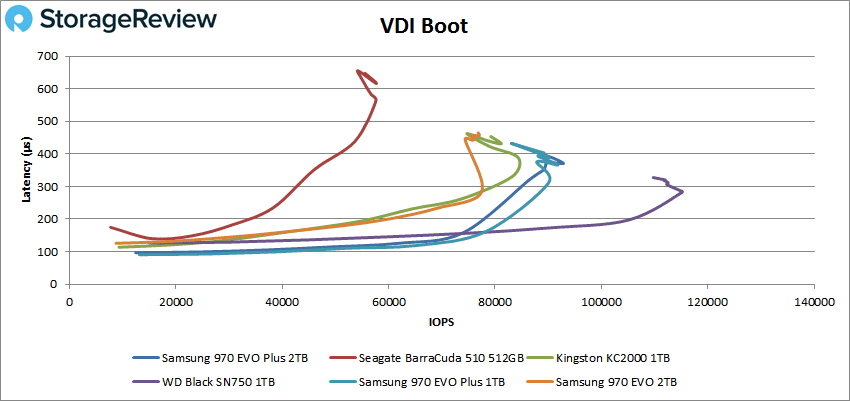
Next, we looked at our VDI benchmarks, which are designed to tax the drives even further. These tests include Boot, Initial Login, and Monday Login. Looking at the Boot test, the Samsung 970 EVO Plus 2TB had the second highest peak performance at 92,849 IOPS at a latency of 371.3ms.
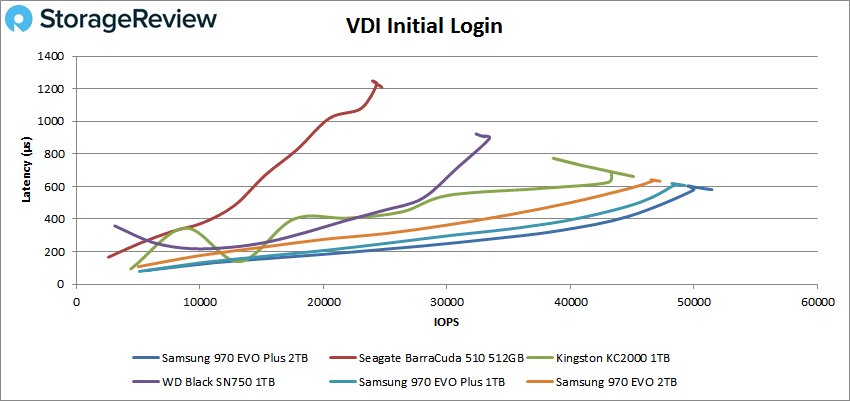
With VDI Initial Login, the 970 EVO Plus 2TB took the top spot with peak performance of 51,445 IOPS and a latency of 581ms.
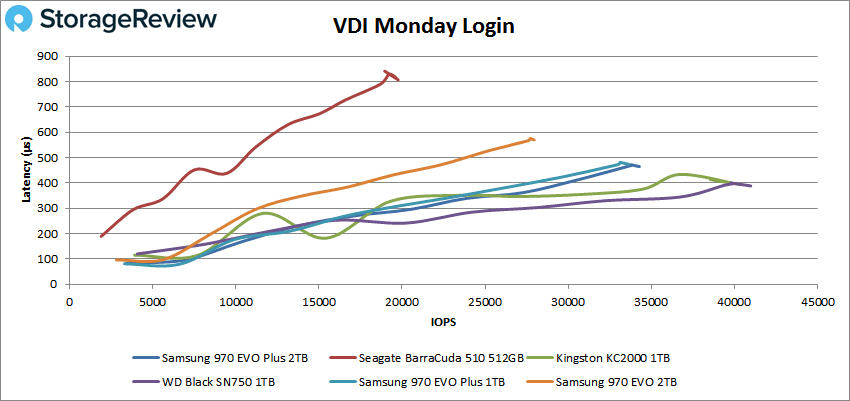
Finally, with VDI Monday Login the 970 EVO Plus 2TB fell to third with a peak performance of 34,279 IOPS and a latency of 464.5ms
Conclusion
Samsung has doubled the capacity of its latest M.2 NVMe SSDs with the introduction of the 970 EVO Plus 2TB. The drive comes with all of the same benefits as its smaller brethren as well as a modest bump in random performance. The company quotes sequential speeds at 3.5GB/s read and 3.3GB/s write and random performance at 620K IOPS read and 560K IOPS write. Like the rest of the line, the 2TB version is aimed at power users and gamers that need both performance and storage.
Looking at Application Workload Analysis performance, the Samsung 970 EVO Plus 2TB tied the fastest results in SQL for the consumer segment with the 1TB version, showing 3,161.7 TPS and an average latency of 1.0ms. The 970 EVO Plus’s placement in Houdini was 2,695.5 seconds putting it in the top segment of non-Optane drives but slightly slower than its 1TB version.
In 4K reads and writes, the drive showed impressive results with 388K IOPS and 381K IOPS, respectively. Switching over to 64K reads and writes, the 970 EVO Plus showed performance of 1.05GB/s and 1.5GB/s, respectively. The 2TB version had a stronger showing in reads than the 1TB version. Our VDI benchmarks had the 970 EVO Plus have average to fair performance with 93K IOPS for Boot, 51K IOPS for Initial Login, and 34K IOPS for Monday Login, a mild bump over the 1TB version.
To no surprise, the larger capacity 970 EVO Plus is also a great performing SSD. When choosing the 2TB over a smaller capacity, it boils down to capacity and write speed needs.


 Amazon