

The Samsung PM853T is the latest entrant into the enterprise SSD space for the company. Like its sister SSD the 845DC EVO (they differ mostly in distribution channel), the PM853T leverages Samsung's TLC NAND and SATA interface. The result is a drive that's a capable alternative for entry-enterprise workloads that tend to be more read centric. The biggest draw however is not so much performance, though the drive excels there, it's drive cost that is the highlight. The PM853T gives the enterprise a solution that is cost effective enough with a performance profile and cost of ownership number that helps spell the end for high-speed 2.5" hard drives.
Samsung claims that their Data Center Series PM853T SSDs offer enterprises consistent level of performance (99.9% of reads at 200 μs) during its lifespan, all the while maintaining the same price category as leading consumer-based MLC SSDs that often get tagged for read intensive enterprise applications. The Samsung PM853T is specifically designed for sustained random read and write workloads of 87,000 and 15,000 IOPS respectively. It's also built with tantalum capacitors to protect data in write cache in the event of an unexpected power failure, a vital security feature for enterprises to protect their important data against file corruption and something most consumer SSDs don't offer.
The Samsung PM853T SSD is available in densities of 240GB, 480GB, and 960GB. This review includes 4 x 960GB drives.
Specifications
- Form: Factor 2.5”
- Capacity (GB): 240/480/960
- Host Interface: SATA Gen 3.0 – 6Gb/s
- Physical Dimensions: 100 x 70 x 7mm
- Weight: (up to) 63g
- MTBF 1,500,000 hours
- Uncorrectable Bit Error Rate (UBER): 1 in 1016
- Power Consumption (Active/Idle): 3.4/1.1 W
- Read Latency (99.9% QoS):* 200 μs
- Write Latency (99.9% QoS): 400 μs
- 4K Random Reads: 87,000 IOPS
- 4K Random Writes: 15,000 IOPS
- 64K Sequential Reads: 530 MB/s
- 64K Sequential Writes: 410 MB/s
- 4K Random WPD: 0.3 WPD
- 64K Sequential WPD: 1.6 WPD
Design and build
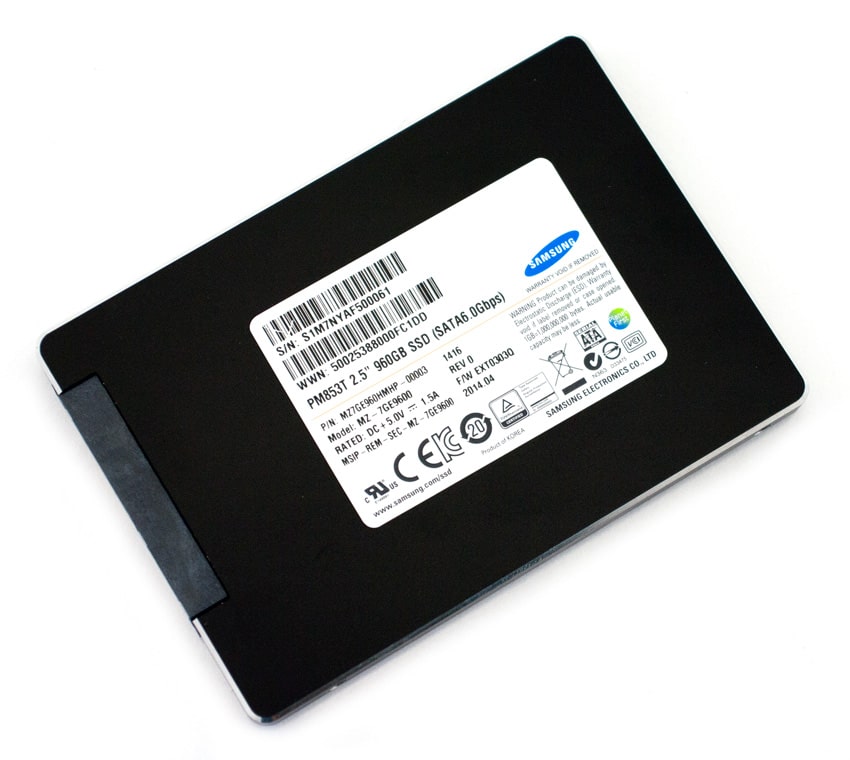
The Samsung PM853T looks virtually identical to others in the family, with its sleek and minimalistic charcoal design. Its form factor consists of a 2.5-inch, 7mm enclosure design in a solid metal construction for a solid feel and composition. The Samsung logo and “Solid State Drive” text in white font are located on the front side of the device.
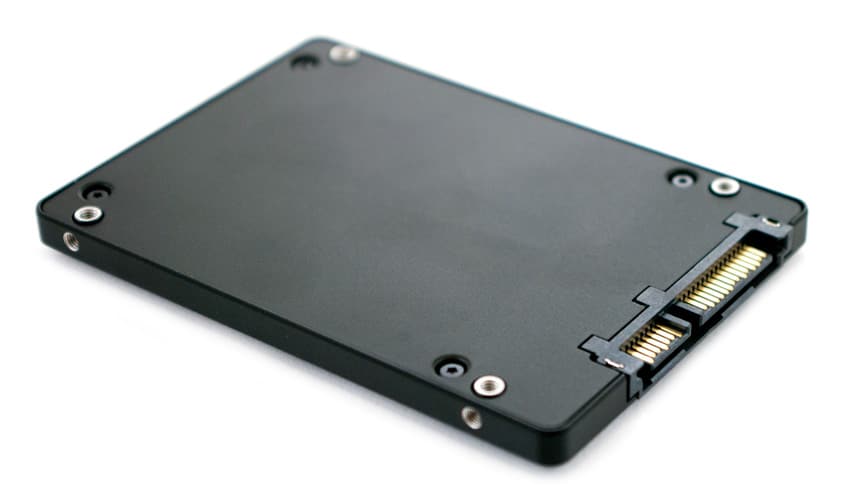
The PM853T’s slim build allows it to support a wide range of applications including ultra-high density enterprise applications and enterprise client applications including notebooks and desktops. The back-side displays a variety of information, such as the product information, capacity, and model number. Mounting the PM853T is seamless using its four screw holes located on the side profiles.
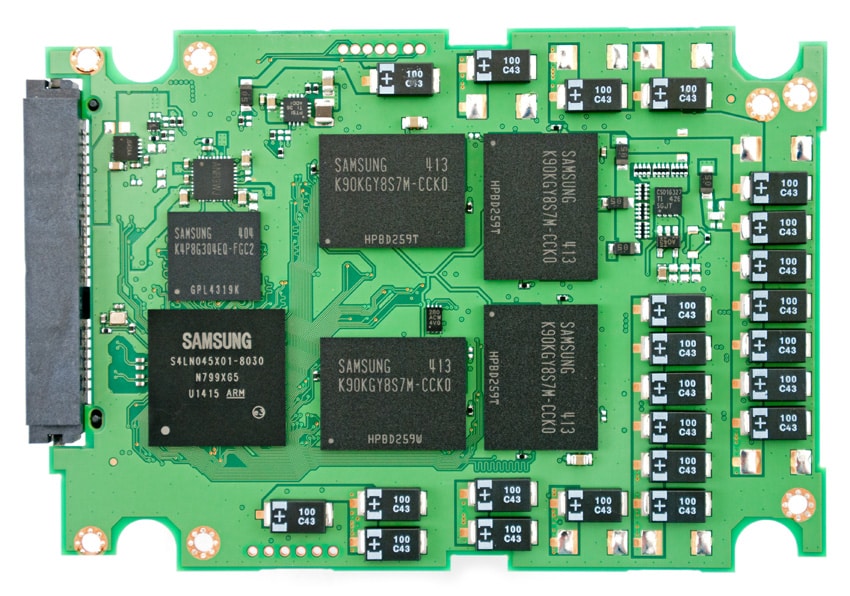
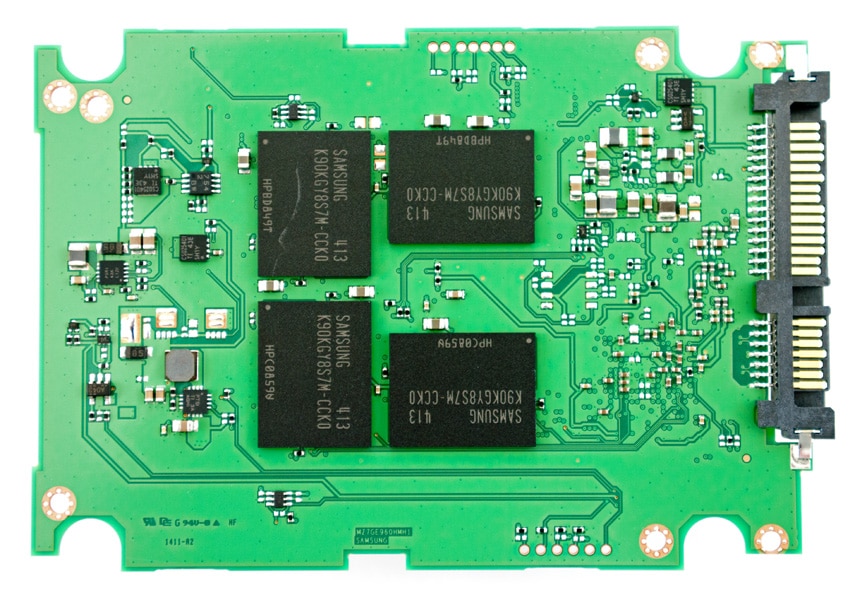
The Samsung PM853T’s SSD is equipped with TLC NAND Flash as well as tantalum capacitors, the latter which protects all data in the write cache in the case of an unexpected power failure.
Testing Background and Comparables
Comparables for this review:
- Micron P400m (400GB, Marvell 9187 controller, Micron 25nm MLC NAND, 6.0Gb/s SATA)
- Intel SSD DC S3700 (200GB, Intel PC29AS21CA0 controller, Intel 25nm MLC NAND, 6.0Gb/s SATA)
- Micron M500 (480GB, Marvell controller, Micron 20nm MLC NAND, 6.0Gb/s SATA)
- Samsung 845DC EVO (480GB, MEX controller, Samsung 19nm Toggle 3bit NAND, 6.0Gb/s SATA)
- Samsung SM843 (240GB, Samsung MDX S4LN021X01-8030 Controller, 20nm Samsung MLC NAND, 6.0Gb/s SATA)
- Samsung SM843T (480GB, Samsung MDX S4LN021X01-8030 controller, Samsung 20nm eMLC NAND, 6.0Gb/s SATA)
- Intel SSD DC S3500 (480GB, Intel PC29AS21CA0 controller, Intel 20nm MLC NAND, 6.0Gb/s SATA)
- Smart CloudSpeed 1000E (400GB, Marvell 88SS9187-BLD2 controller, Toshiba TH58TEG8DDJBA8C 19nm MLC NAND, 6.0Gb/s SATA)
All SAS/SATA enterprise SSDs are benchmarked on our second-generation enterprise testing platform based on a Lenovo ThinkServer RD630. This Linux and Windows-based testing platform includes the LSI 9207-8i HBA as well as I/O scheduling optimizations geared towards best-case flash performance. For synthetic benchmarks, we utilize FIO version 2.0.10 for Linux and version 2.0.12.2 for Windows. Application benchmarks use a variety of testing platform configurations and are detailed below.
- 2 x Intel Xeon E5-2620 (2.0GHz, 15MB Cache, 6-cores)
- Intel C602 Chipset
- Memory – 16GB (2 x 8GB) 1333Mhz DDR3 Registered RDIMMs
- Windows Server 2008 R2 SP1 64-bit and CentOS 6.3 64-Bit
- 100GB Micron RealSSD P400e Boot SSD
- LSI 9211-4i SAS/SATA 6.0Gb/s HBA (For boot SSDs)
- LSI 9207-8i SAS/SATA 6.0Gb/s HBA (For benchmarking SSDs or HDDs)
- Mellanox ConnectX-3 10GbE PCIe 3.0 Adapter
- Mellanox ConnectX-3 InfiniBand PCIe 3.0 Adapter
Application Workload Analysis
In order to understand the performance characteristics of enterprise storage devices, it is essential to model the infrastructure and the application workloads found in live production environments. Our first three benchmarks of the Samsung drive are therefore the MarkLogic NoSQL Database Storage Benchmark, MySQL OLTP performance via SysBench and Microsoft SQL Server OLTP performance with a simulated TCP-C workload.
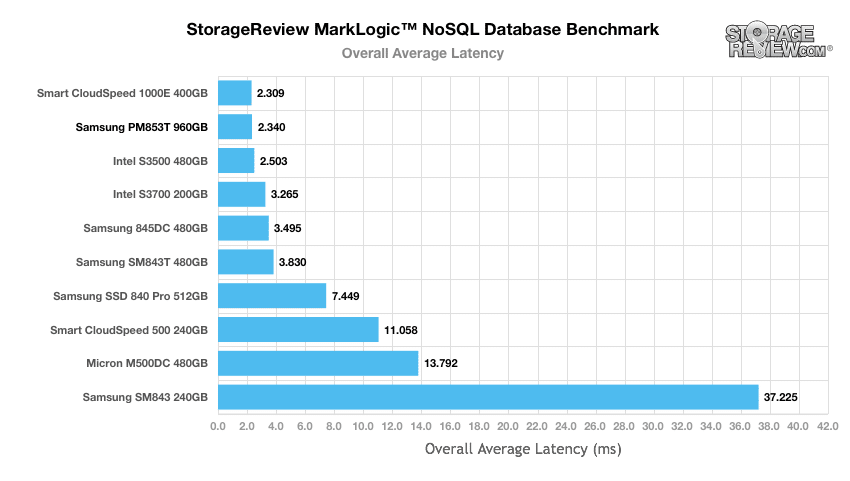
Our MarkLogic NoSQL Database environment requires groups of four SSDs with a usable capacity of at least 200GB, since the NoSQL database requires roughly 650GB of space for its four database nodes. Our protocol uses an SCST host and presents each SSD in JBOD, with one allocated per database node. The test repeats itself over 24 intervals, requiring between 30-36 hours total. MarkLogic records total average latency as well as interval latency for each SSD.
In our overall average latency benchmark, the Samsung PM853T posted top-in-class results, coming in second place with 2.340ms, just behind the Smart CloudSpeed drive.
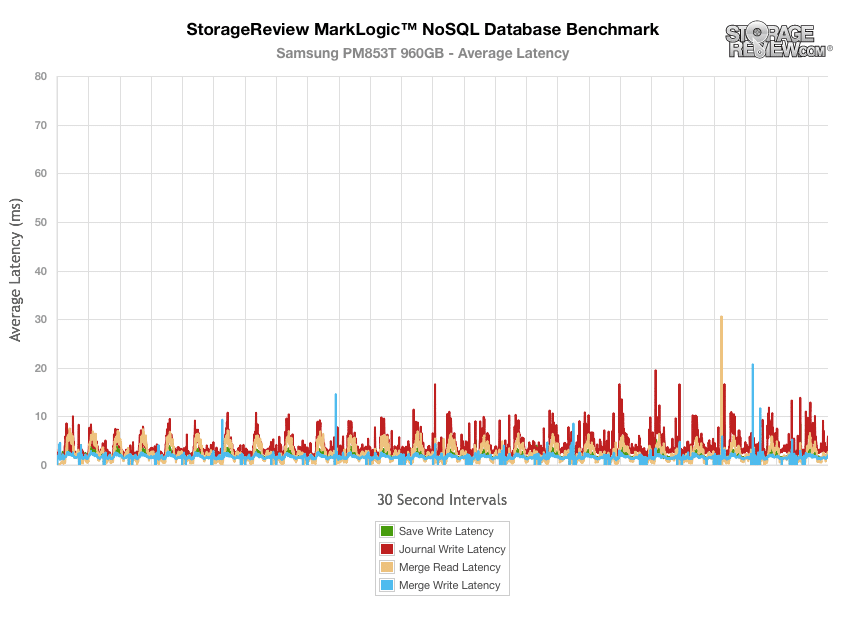
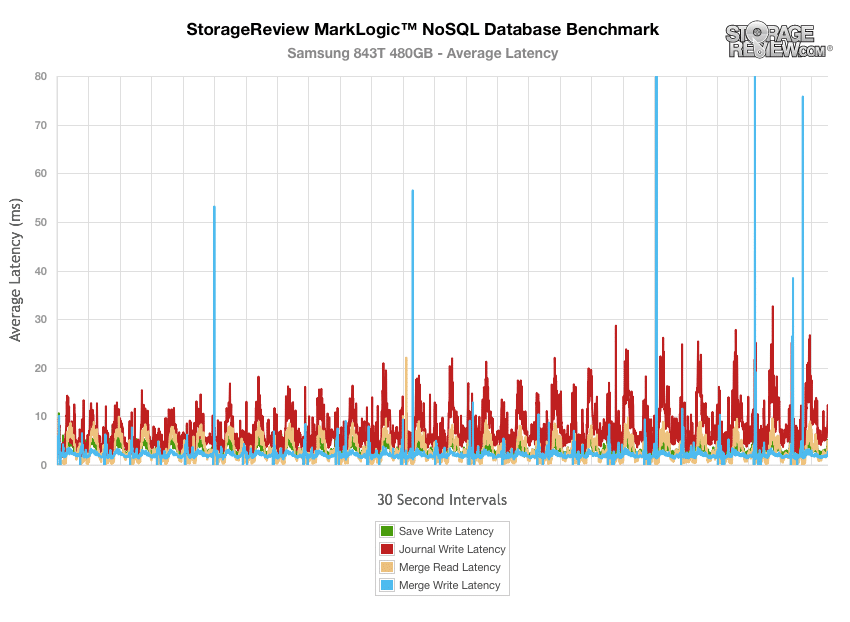
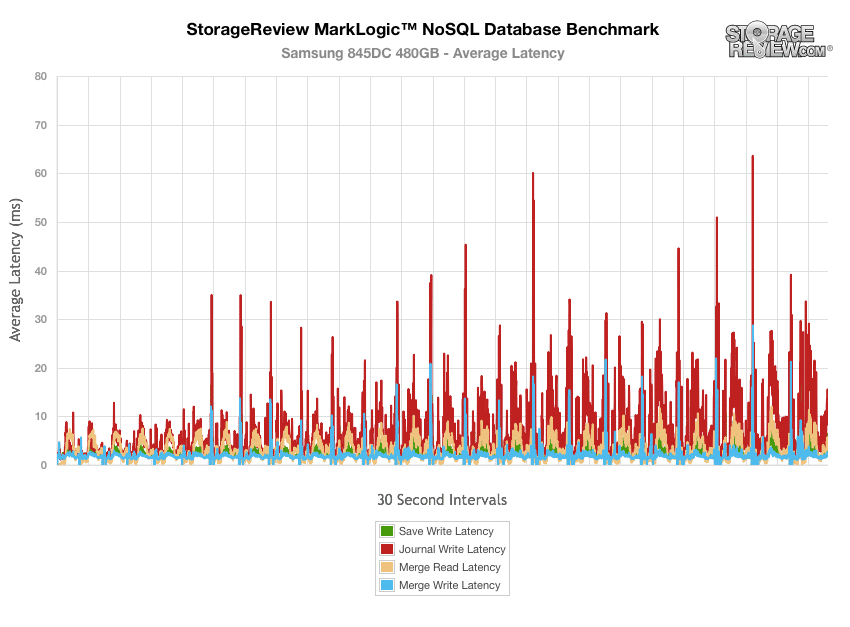
The latency results during the NoSQL benchmark show that the Samsung SM843T and Samsung 845DC EVO did experience a latency spikes throughout, though the PM853T showed a vast improvement.
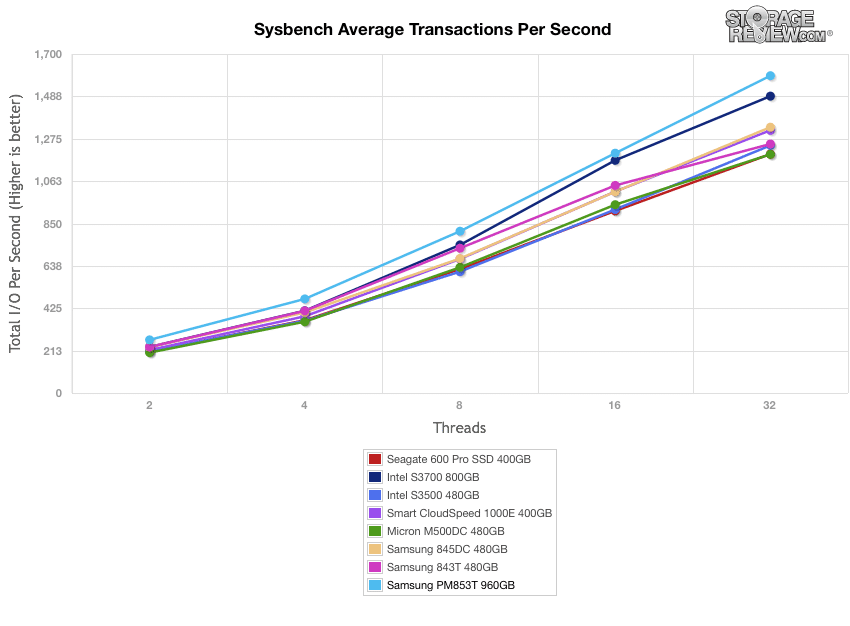
Our next application test consists of Percona MySQL database test via SysBench, which measures the performance of OLTP activity. In this testing configuration, we use a group of Lenovo ThinkServer RD630s and load a database environment onto a single SATA, SAS or PCIe drive. This test measures average TPS (Transactions Per Second), average latency, as well as average 99th percentile latency over a range of 2 to 32 threads.
The Samsung PM853T’s average TPS ranked at the very top of the pack by a noticeable margin, a vast improvement over the SM843T, which placed near the bottom.
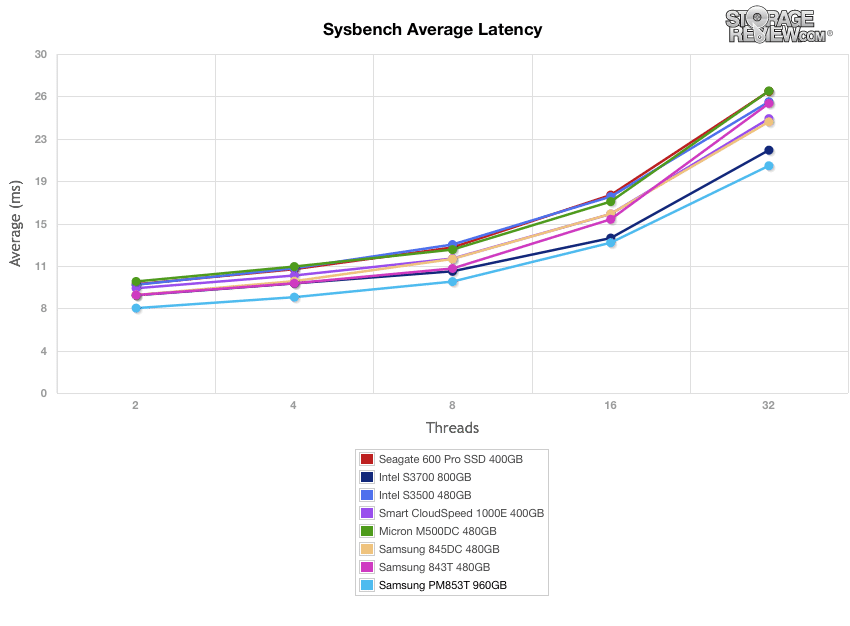
The leaderboard for the average latency benchmark were nearly identical to the average throughput charts, as the PM853T continued to boast impressive top-in-class performance.
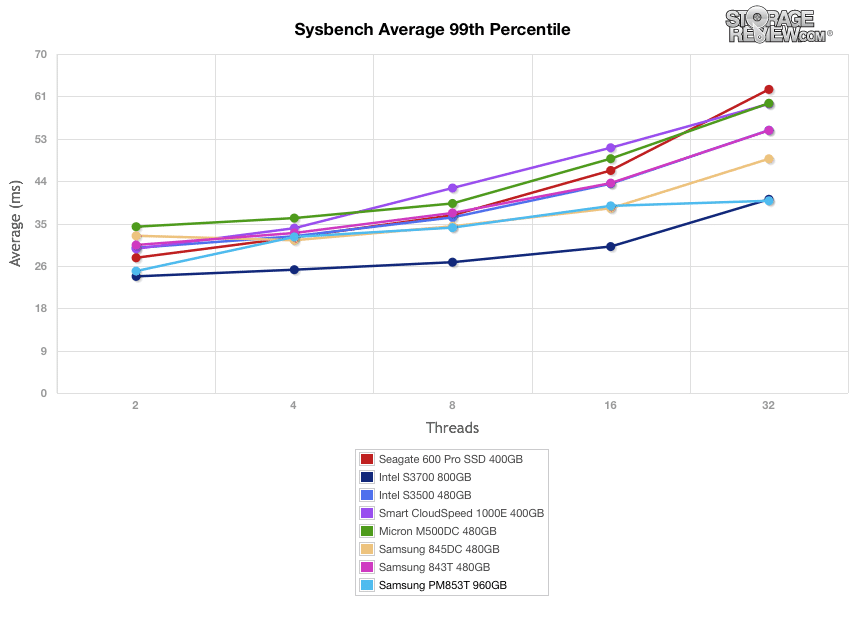
At the lowest overall 99th percentile latency, the Samsung PM853T looked like it was heading for the middle of the pack with its steady incline in latency; however, it leveled off near the end of our test (while the rest of the drives continued their ascent) taking top place by the end, narrowly edging out the Intel S3700.
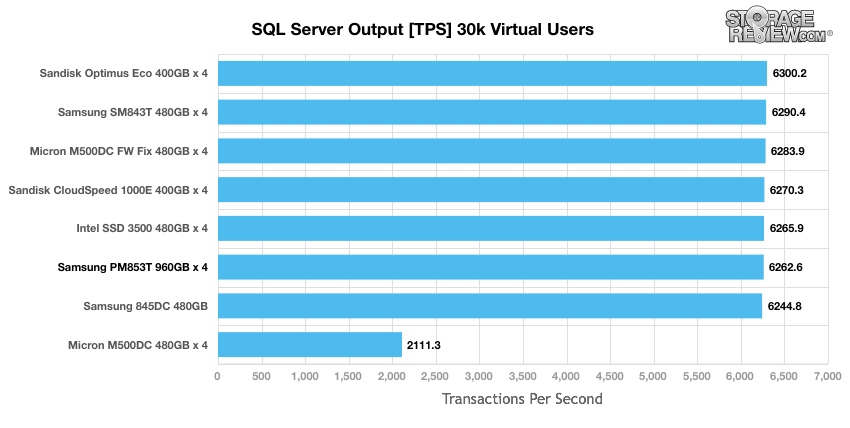
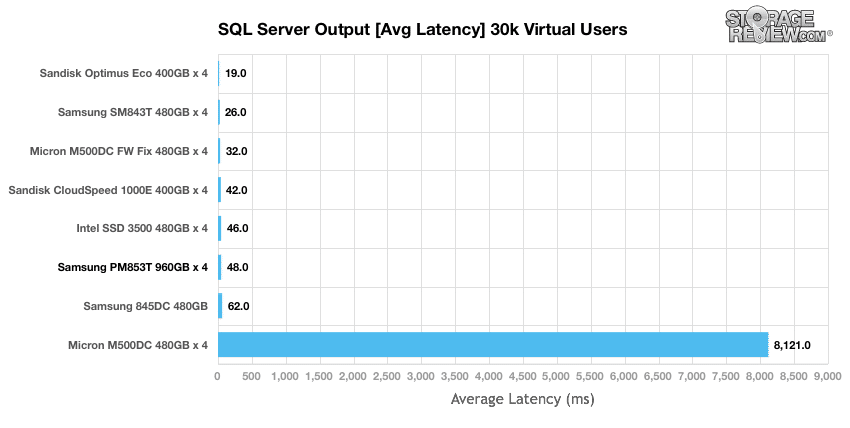
StorageReview’s Microsoft SQL Server OLTP testing protocol employs the current draft of the Transaction Processing Performance Council’s Benchmark C (TPC-C), an online transaction processing benchmark that simulates the activities found in complex application environments. The TPC-C benchmark comes closer than synthetic performance benchmarks to gauging the performance strengths and bottlenecks of storage infrastructure in database environments. Our SQL Server protocol uses a 685GB (3,000 scale) SQL Server database and measures the transactional performance and latency with a 30,000 VU Load.
The Samsung PM853T’s SQL Server Output TPS ranked near the middle of the pack while SanDisk Optimus Eco posted the best performance; however, there was very little discrepancy between most of the drives.
In our average latency benchmark, we saw identical rankings with the Samsung PM853T falling a bit behind and the SanDisk Optimus Eco once again leading the way.
Enterprise Synthetic Workload Analysis
Flash performance varies as the drive becomes conditioned to its workload, meaning that flash storage must be preconditioned before each of the fio synthetic benchmarks ;in order to ensure that the benchmarks are accurate. Each of the comparable drives are secure erased using the vendor's tools and preconditioned into steady-state with a heavy load of 16 threads and an outstanding queue of 16 per thread.
Preconditioning and Primary Steady-State Tests:
- Throughput (Read+Write IOPS Aggregate)
- Average Latency (Read+Write Latency Averaged Together)
- Max Latency (Peak Read or Write Latency)
- Latency Standard Deviation (Read+Write Standard Deviation Averaged Together)
Once preconditioning is complete, each device is then tested in intervals across multiple thread/queue depth profiles to show performance under light and heavy usage. Our synthetic workload analysis for the Samsung 840 Pro uses two profiles which are widely used in manufacturer specifications and benchmarks.
- 4k
- 100% Read and 100% Write
- 8k
- 70% Read/30% Write
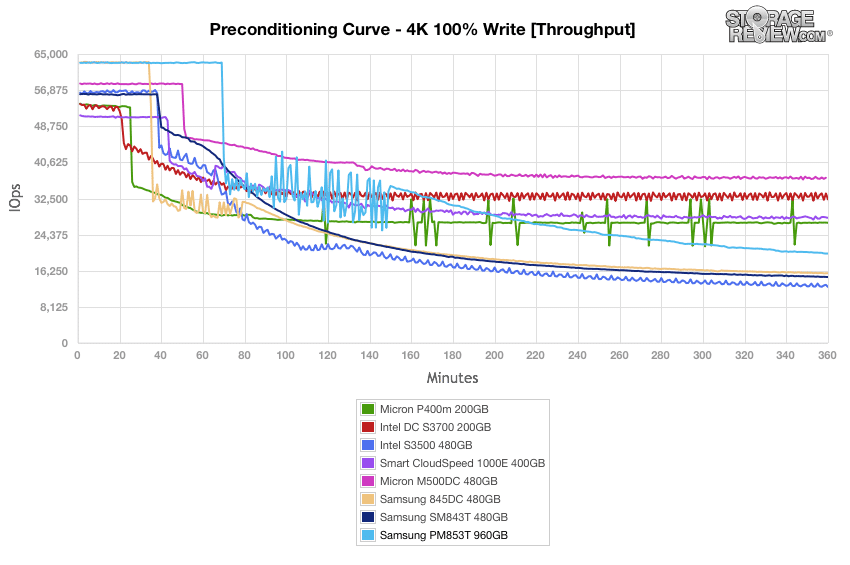
During preconditioning for the 4k synthetic benchmark, the Samsung PM853T performed fairly well at the initial burst stage of our test, thought ended up being at the lower middle of the pack. It did, however, show a significant improvement on the SM843T.
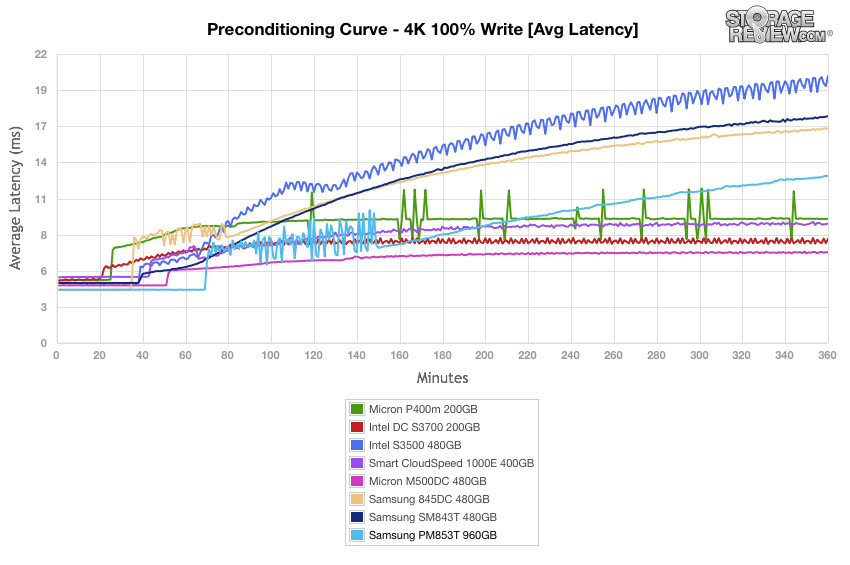
The Samsung PM853T had the best results during the burst stage of our average latency tests; however, it showed a steady increase in latency beginning around the 70 minute mark and ended up at the middle of the pack. Another significant gain in performance over the SM843T showed during this test as well.
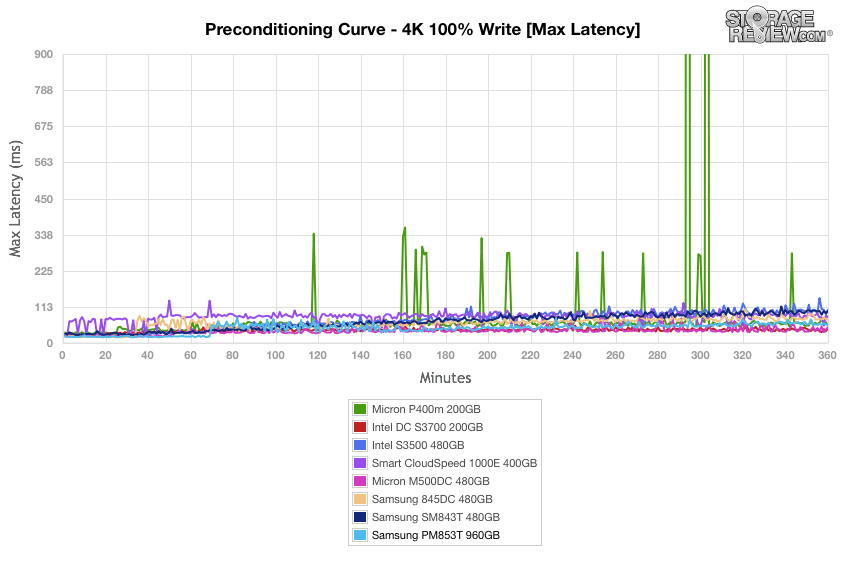
During our maximum latency test, the Samsung PM853T showed great performance, though a small spike occurred at the 70 minute mark, once again.
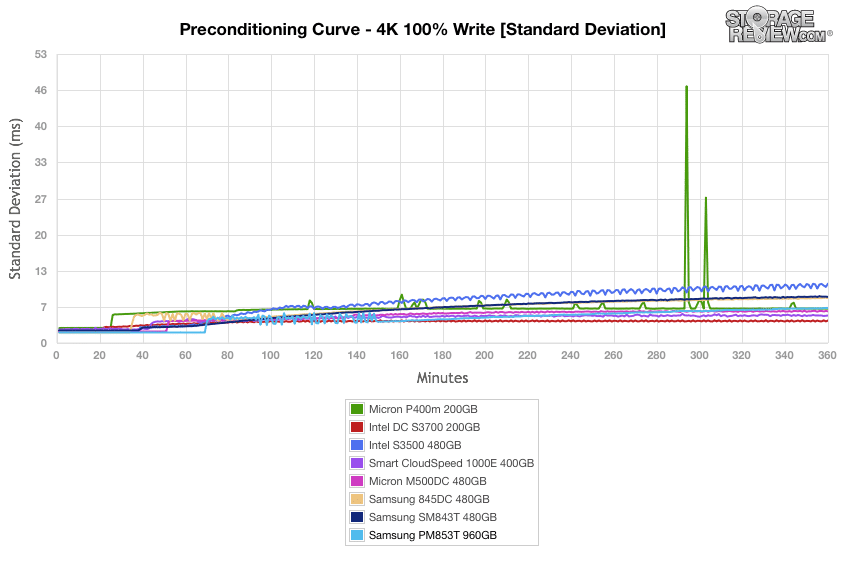
In our Standard Deviation benchmarks, the Samsung PM853T posted good performance with only a gradual gain in latency by the 150 minute mark and showing no spikes whatsoever. The Intel DC S3700 and CloudSpeed drives were the most consistent.
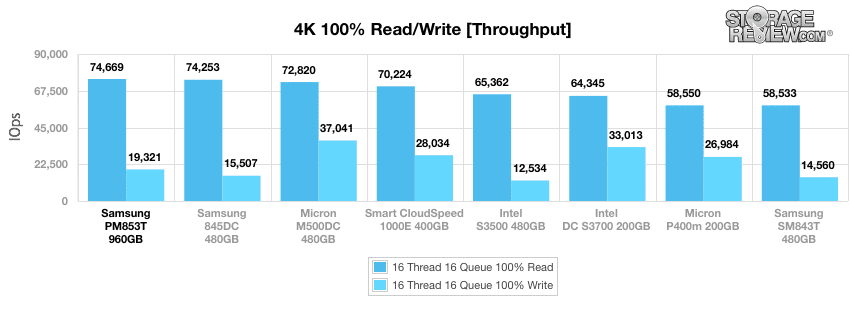
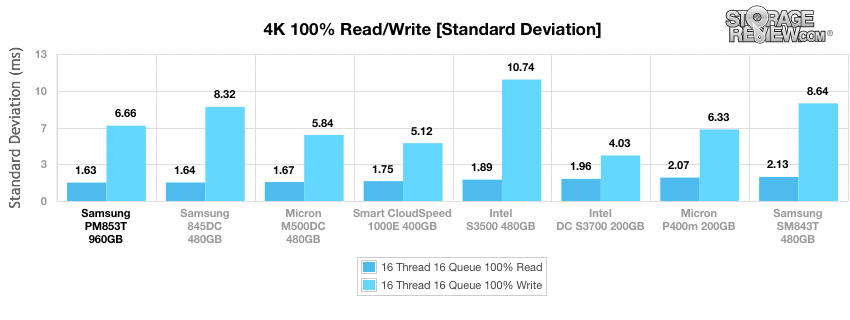
When looking at 4K throughput, the Samsung PM853T boasted the highest read activity at 74,669 IOPS, though it couldn't touch the top of the leaderboard in the write column.
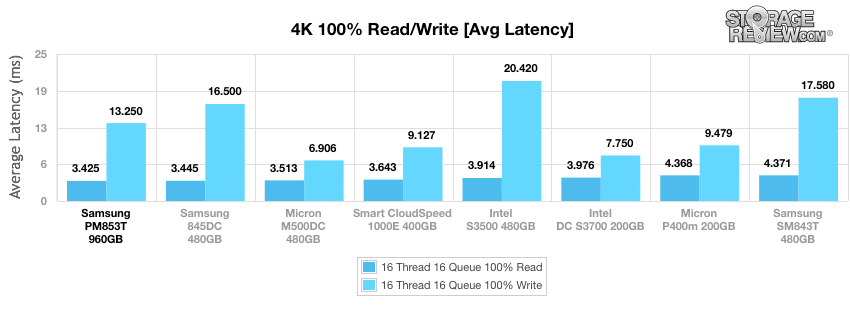
The Samsung PM853T was the top performer in both in average read and write latency at 3.425ms and 13.250ms, respectively.
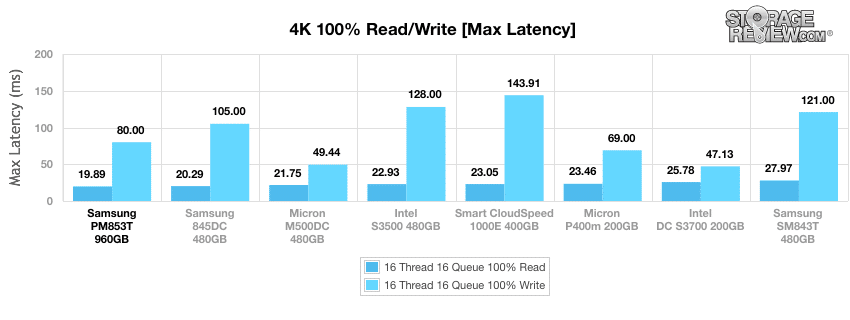
Samsung’s PM853T continued stay at the top of pack in the max latency tests, scoring first in read. The SM843T took last spot again.
The Samsung SM843T drive continued to take top spot in the read column, with a standard deviation of 1.63ms, though narrowly beating out the Samsung 845DC EVO drive.
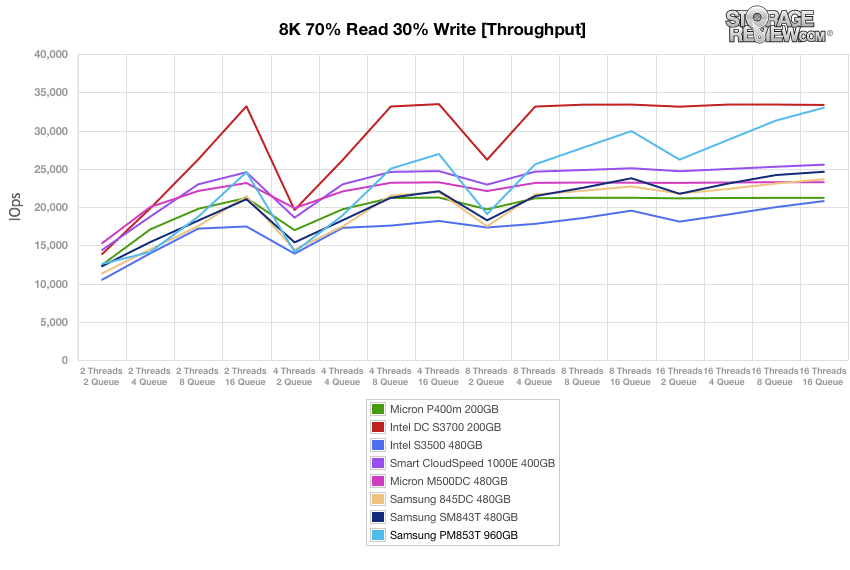
Our next workload uses 8k transfers with a ratio of 70% read operations and 30% write operations. The PM853T started out in the middle of the pack, and ended up coming in second place by the end with a steady incline in throughput at 16T2Q, just below the Intel DC S3700 drive.
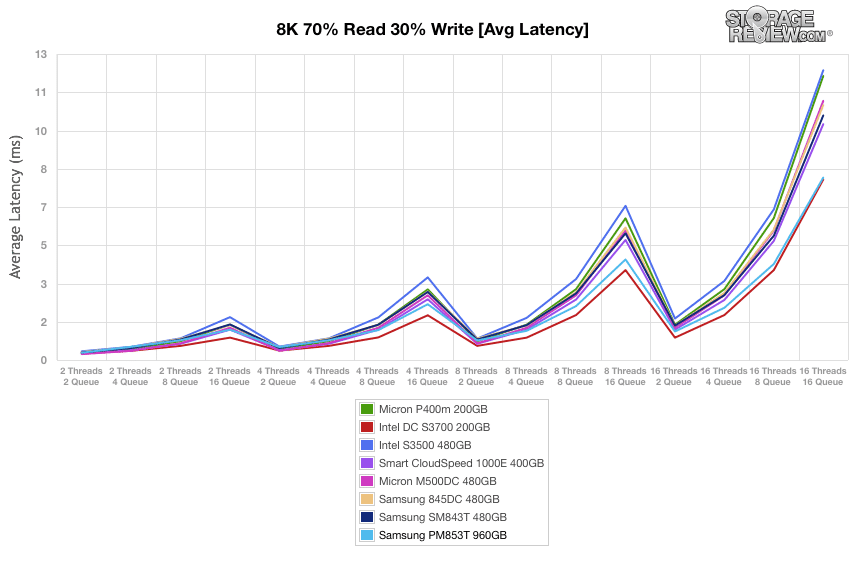
In our average latency tests for the 8K 70/30 tests, the Samsung PM853T consistently stayed with the top performing Intel DC S3700, but only by a narrow margin at 16T/16Q.
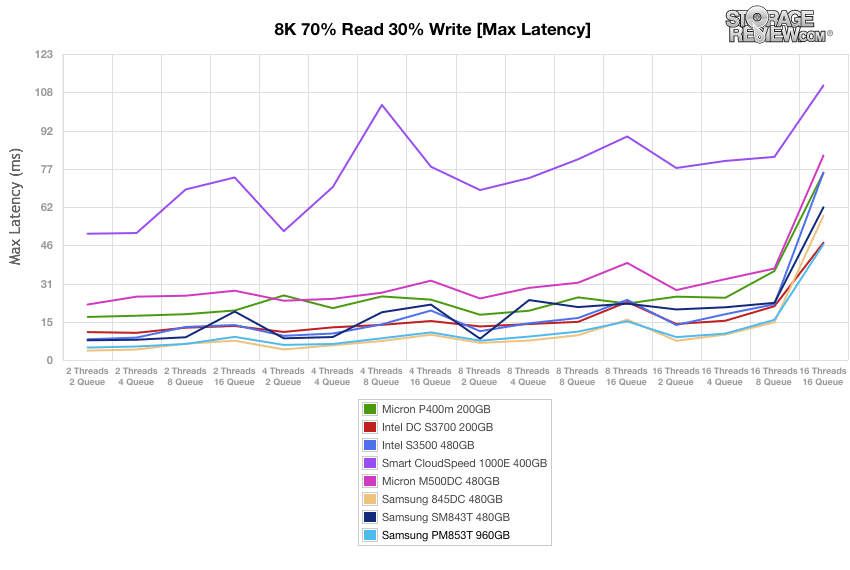
The Samsung PM853T and 845DC EVO were neck and neck in our max latency tests, with the former barely taking the lead from the Intel DC S3700 at the end.
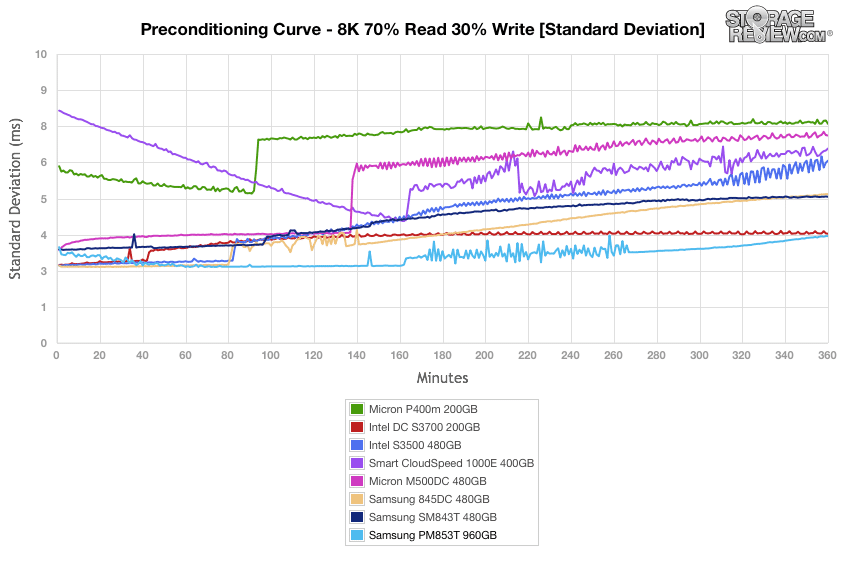
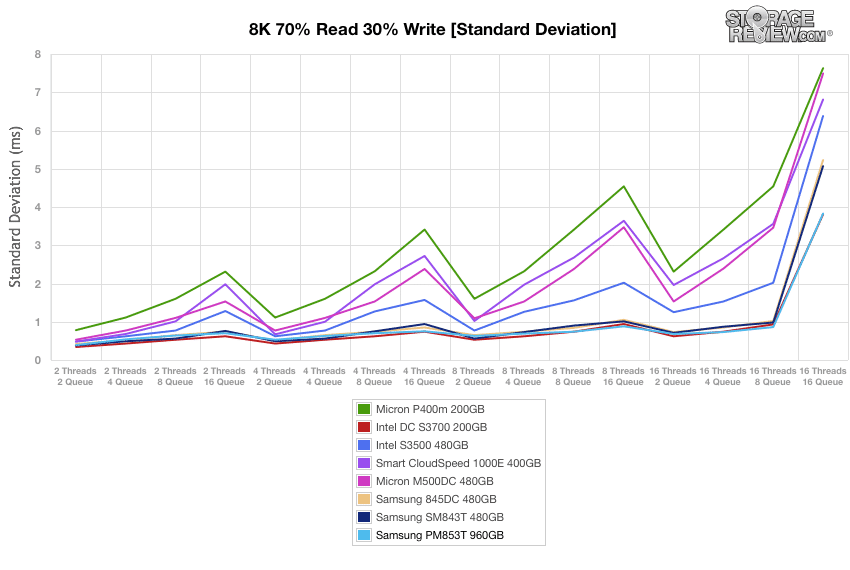
During our standard deviation tests, the PM853T continued to dominate with no noticeable spikes until the very end, falling just behind the Intel DC S3700. The Samsung SM843T performed well in this test as well, taking third spot by 16T/16Q.
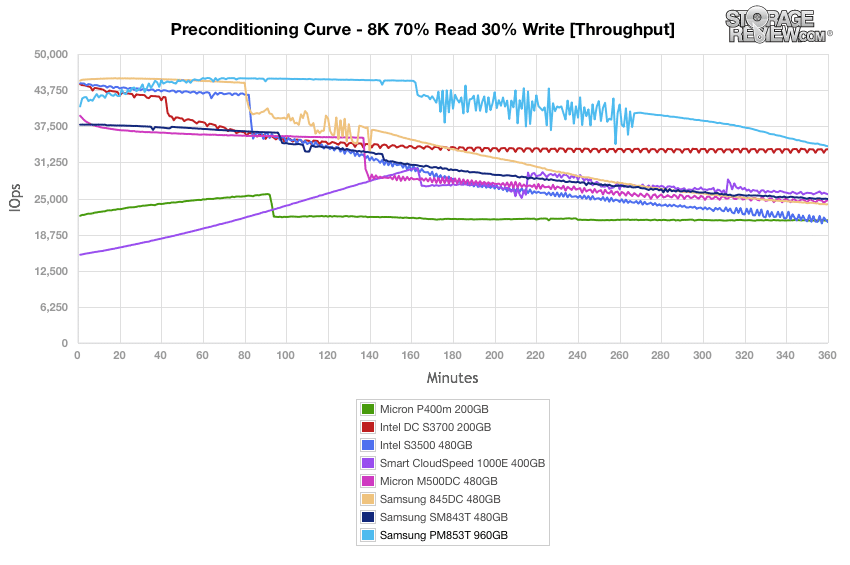
Once the drives are preconditioned, the 8k 70/30 throughput benchmark varies workload intensity from 2 threads and 2 queue up to 16 threads and 16 queue. The Samsung PM853T posted very impressive results during these benchmarks.
Measuring throughput in this workload type, the PM853T was the top performer throughout the majority of the test, including at 16T/16Q, just above the Intel DC S3700 drive.
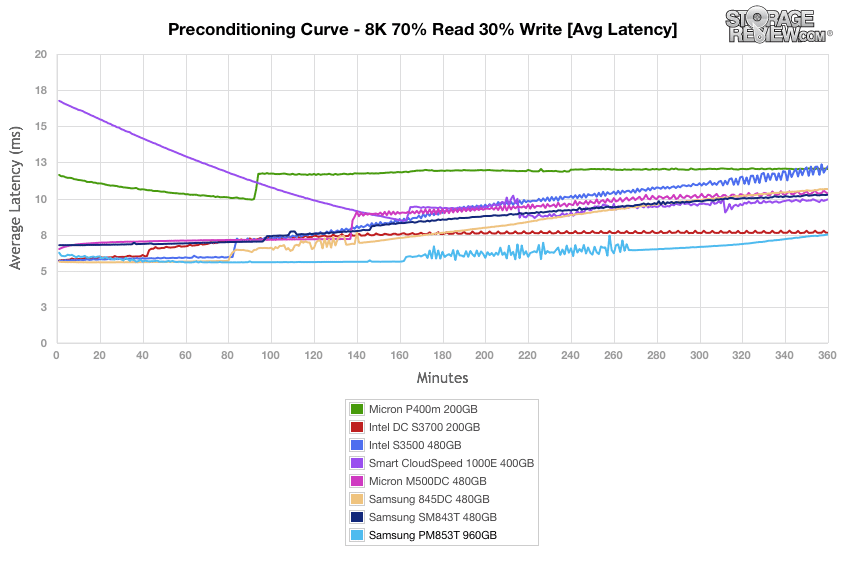
The Samsung PM853T took first place (though by a narrow margin to the Intel DC drive) in average latency measurement with various, smaller spikes between the 170 and 270 minute mark.
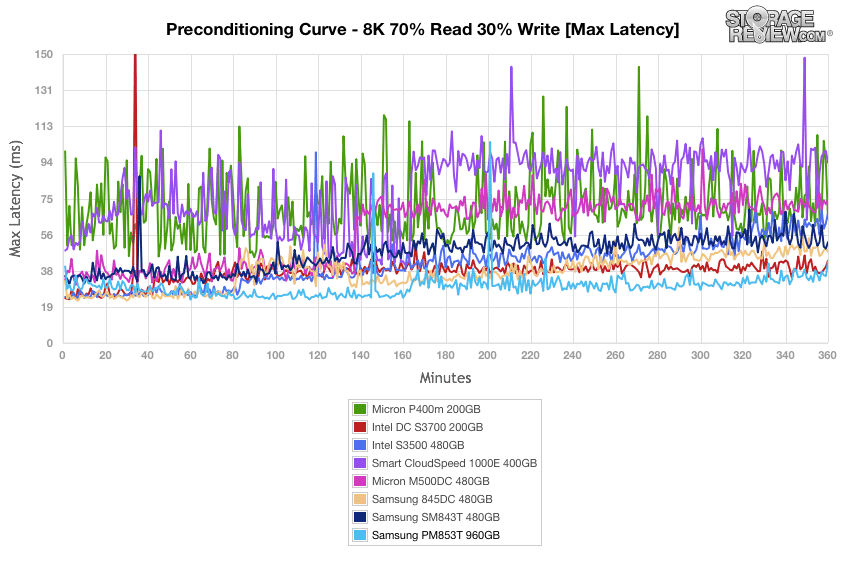
Max latency results told a very similar, with the Samsung PM853T once again taking top spot, but just barely over the Intel DC S3700.
In our last benchmark, we look at standard deviation. The Samsung PM853T once again continued to dominate at the top of the leaderboard, with the Intel DC SSD close behind.
Conclusion
The Samsung PM853T is a top-in-class SATA enterprise-grade SSD designed specifically for data centers looking for a mix of performance, endurance and reasonable cost. Samsung's new SSD stands out by not only being very high performing, but also the first model to ship in the enterprise space using TLC NAND, along with its 845DC EVO brother. Samsung's vertically integrated solution leads to a very consistent level of performance (99.9% reliable latency and QoS) during its lifespan. After putting the PM853T through our benchmark tests, it was evident that the drive offers a major improvement over its already impressive eMLC predecessor, the SM843T.
In our gauntlet of tests, the Samsung PM853T recorded top results in most of our application and synthetic benchmarks. For example, the PM853T was the top drive in our Sysbench MySQL database test as well as in our MarkLogic NoSQL Database benchmark. Like the SM843T, our SQL Server tests showed that the PM853T had no trouble keeping up with high-performance MLC-based SSDs.
In our 4k 100% read and 100% write benchmarks, the PM853T ranked at the upper middle of the pack. Our 8k 70/30 tests told a better story, with the Samsung drive posting impressive results and boasting numbers at the very top of our leader boards. In particular, we were very impressed with its performance during our max latency readings, as it showed the least amount of spikes when compared to the other top-in-class enterprise SSDs. With these impressive performance results, as well as its focus on data protection, enterprise buyers on a budget will find a ton to like with the PM853T.
Pros
- Superior top-class-performance even with TLC NAND
- Impressive sustained performance in workloads with low latency
- Very low $/GB pricing
Cons
- SQL Server latency dipped
Bottom Line
The Samsung PM853T enterprise SSD offers proven reliability, performance, and longevity, making it a perfect fit for enterprises looking a serious top-in-class SSD solution without having to spend a lot to get there.


 Amazon