

The SanDisk Ultra Plus is a mainstream SSD designed for client system use. The Ultra Plus uses a standard 2.5″ 7mm form factor with SATA 6Gb/s interface and is powered by a Marvell 9175 controller with in-house SanDisk firmware and SanDisk’s 19nm MLC NAND. The combined package nets sequential read and write performance of up to 530 MB/s and 445 MB/s respectively. Like most SSDs though, the bottom line isn’t just about top speed, it’s also about smarter features that let users get more out of their drives while maintaining high levels of reliability.
SanDisk has a tremendous NAND production advantage over most other vendors; which when combined with a large engineering team lead to the inclusion of advanced flash management techniques like nCache, a non-volatile write cache. Of course cache on an SSD is nothing new, Marvell-based drives always use an extra on-board DDR chip as part of the package. That implementation is a volatile cache though, nCache is non-volatile group of SLC NAND that is designed specifically to improve random write performance. nCache accumulates small writes, then consolidates and flushes them to the MLC NAND for permanent storage. This method is more efficient both in terms of performance and NAND wear management.
The Ultra Plus sits alongside another SanDisk offering already in the marketplace, the SanDisk Extreme. Both drives will continue to be offered in the market, the move to introduce a second controller platform is interesting though. While the SandForce-based Extreme will continue to drive higher topline performance, SanDisk saw consumer demand for an SSD with something other than SandForce inside. Using a Marvell processor affords SanDisk several other benefits as well though. They get to make their own firmware stack, aiding differentiation and customer support, where the SandForce firmware is generally static. They also get more opportunity to deliver NAND features like nCache described above. The net result may be a drive with more stability, reliability and improved support, since SanDisk owns all key elements of the entire drive.
The Ultra Plus comes in three capacities, designed to meet most users’ needs; 64GB, 128GB and 256GB. Launch pricing for each capacity will be $74.99, $109.99 and $219.99 respectively. SanDisk intentionally left a 512GB capacity off the current release schedule, aiming for the most popular end user capacities. Each drive comes with a three year warranty and all capacities offer endurance of greater than 80TBW. Our review model is the 256GB capacity.
SanDisk Ultra Plus Specifications
- Capacities
- 64GB
- Sequential Read: up to 520 MB/s
- Sequential Write: up to 155 MB/s
- Random Read IOPS: up to 76,000
- Random Write IOPS: up to 29,000
- 128GB
- Sequential Read: up to 530 MB/s
- Sequential Write: up to 290 MB/s
- Random Read IOPS: up to 80,000
- Random Write IOPS: up to 33,000
- 256GB
- Sequential Read: up to 530 MB/s
- Sequential Write: up to 445 MB/s
- Random Read IOPS: up to 82,000
- Random Write IOPS: up to 39,000
- 64GB
- Controller: Marvell 88SS9175
- NAND: SanDisk 19nm eX2 ABL MLC
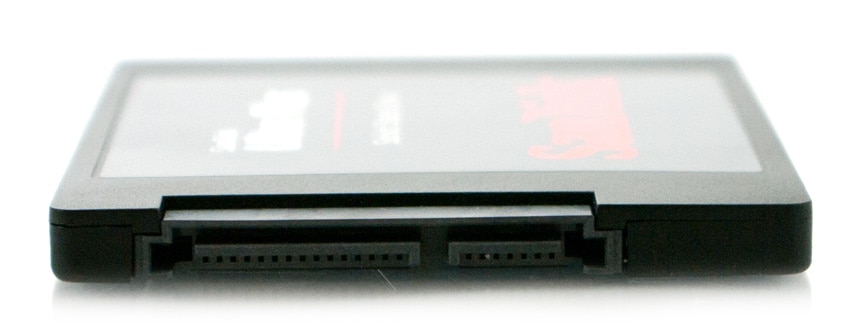
- Interface: SATA 6Gb/s
- Form Factor: 2.5″ 7mm
- Power
- 64GB
- Active: .12W
- Max Read: 2.6W
- Max Write: 2.2W
- Slumber: .08W
- 128GB
- Active: .12W
- Max Read: 2.7W
- Max Write: 3.4W
- Slumber: .08W
- 256GB
- Active: .12W
- Max Read: 2.9W
- Max Write: 4.8W
- Slumber: .08W
- 64GB
- Endurance: More than 80TBW
- MTBF: 2 million hours
- Operating Temp: 0°C – 70°C
- Non-Operating Temp: -55°C – 85°C
- Warranty: 3 Years
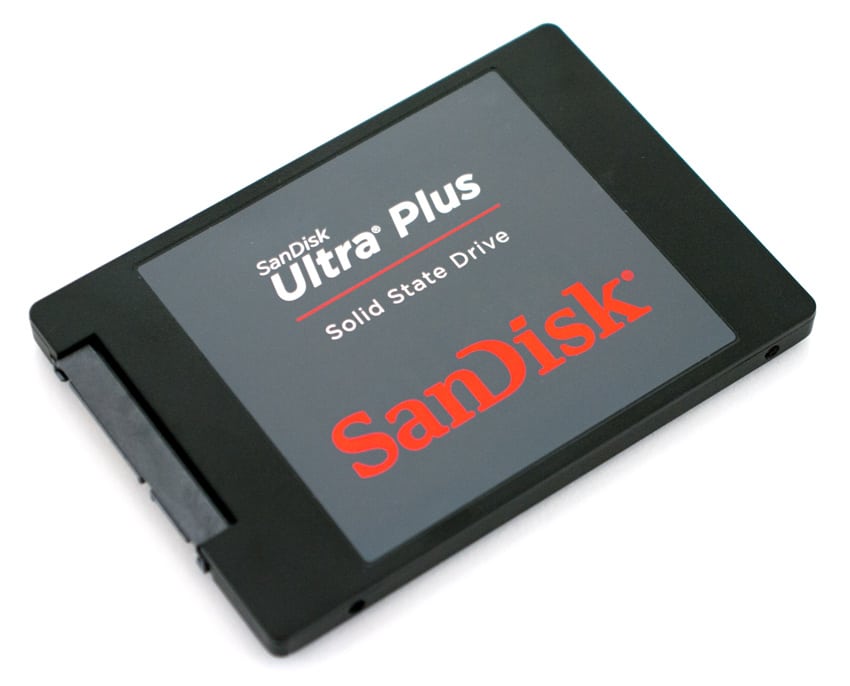
Design and Build
The SanDisk Ultra Plus is a 7mm 2.5-inch SSD designed for desktops, notebooks, and ultrabooks. The design is fairly basic, with a black plastic case with two product labels; front and back. The design is fairly similar to the SanDisk Extreme SSD, although it offers a slimmer profile than the 9.5-mm design on the Extreme.
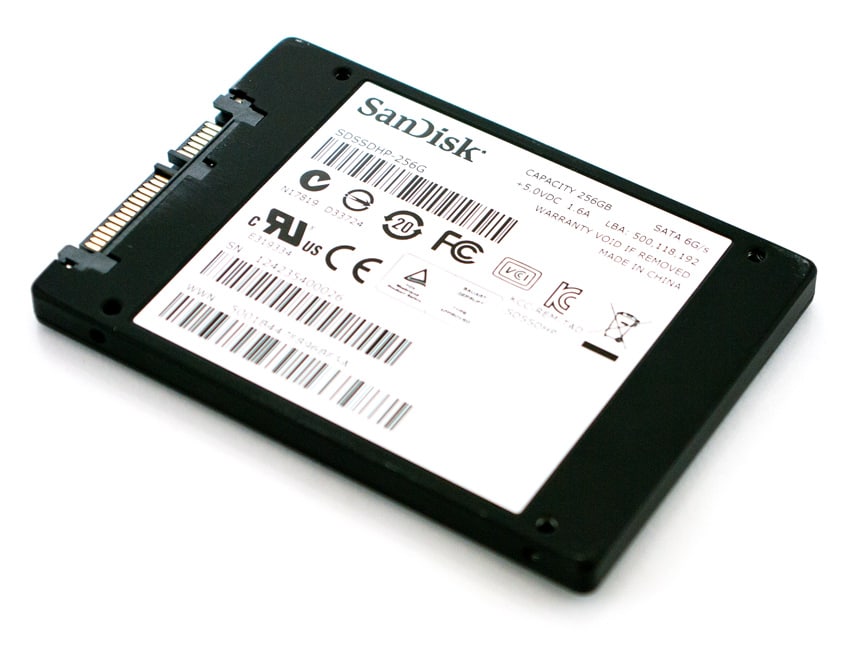
While the top of the SSD is more geared towards showing off the product family and SanDisk branding, the bottom cover shows the detailed information, including capacity, power requirements and other information. The bottom sticker also covers the four screws that hold the two case halves together.
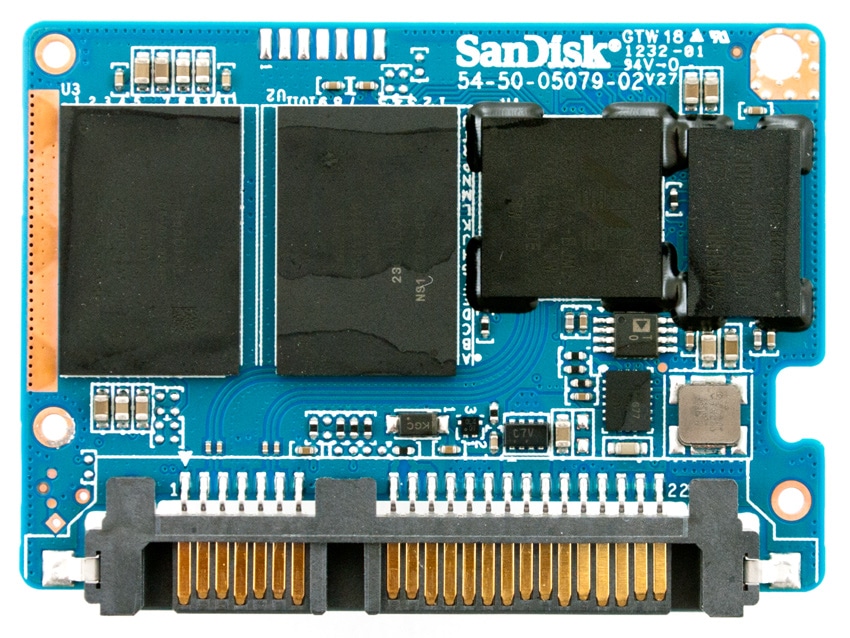
After opening the SanDisk Ultra Plus SSD, we found an extremely small internal board which more resembles an mSATA device than a 2.5-inch drive. By using a board this small, SanDisk is able to manufacturer one board to fit multiple products, including newer small form-factors.
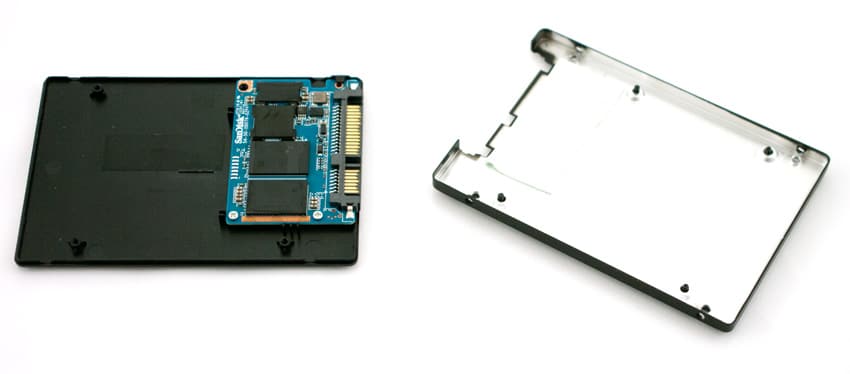
Looking closer at the internal circuit board, we find a Marvell 88SS9175 controller, a single RAM module, and four SanDisk 19nm NAND chips (two top, two bottom). This compact layout could be easily organized into a multitude of small SSD designs, either modular or on-board.
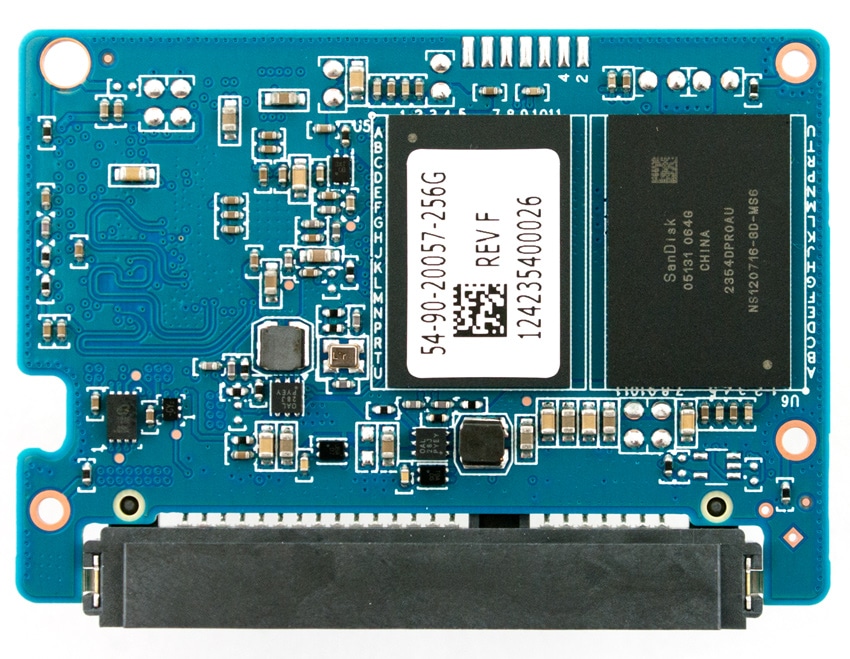
The bottom has the two additional SanDisk NAND chips, wrapping up a very cleanly designed and compact SSD.
Consumer Benchmarks
All consumer SSD benchmarks are conducted with the StorageReview Consumer Testing Platform. The comparables used for this review include:
- SanDisk Extreme SSD (240GB, SandForce SF-2200, SanDisk 24nm MLC NAND, SATA)
- Plextor PX-M5S (256GB, Marvell 9174, Micron 25nm MLC NAND, SATA)
- Samsung SSD 840 Pro (512GB, 300mhz Samsung 3-core MCX controller, Samsung 2x nm Toggle NAND Flash, SATA)
- Corsair Neutron GTX (240GB, LAMD LM87800, Toshiba 24nm toggle NAND, SATA)
- OCZ Vertex 4 (512GB, Indilinx Everest 2, Intel 25nm MLC NAND, SATA)
All IOMeter figures are represented as binary figures for MB/s speeds.
In our first benchmark where we test straight line sequential performance, which the SanDisk Ultra Plus SSD measured 488MB/s read and 424MB/s write.
Switching to a random 2MB transfer size, the SanDisk Ultra Plus dropped in speed, measuring 343MB/s read and 280MB/s write.
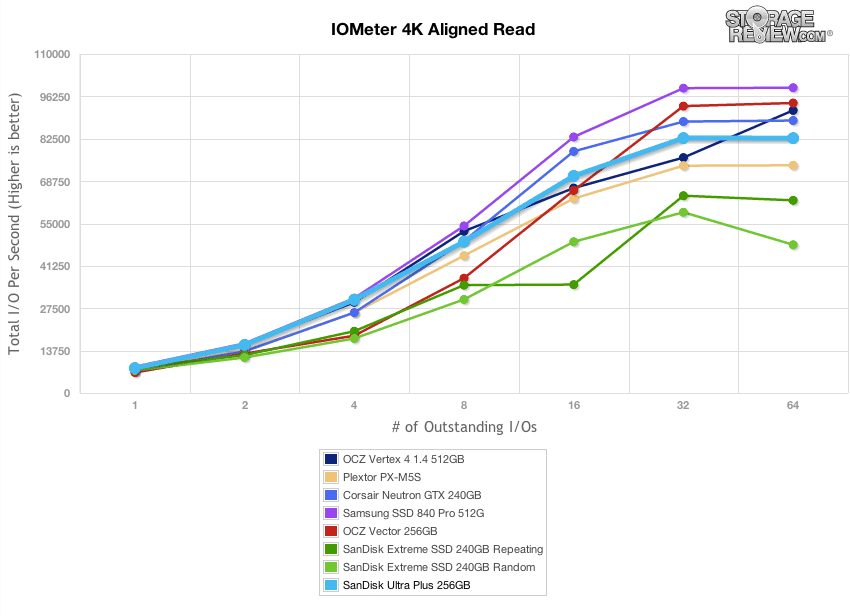
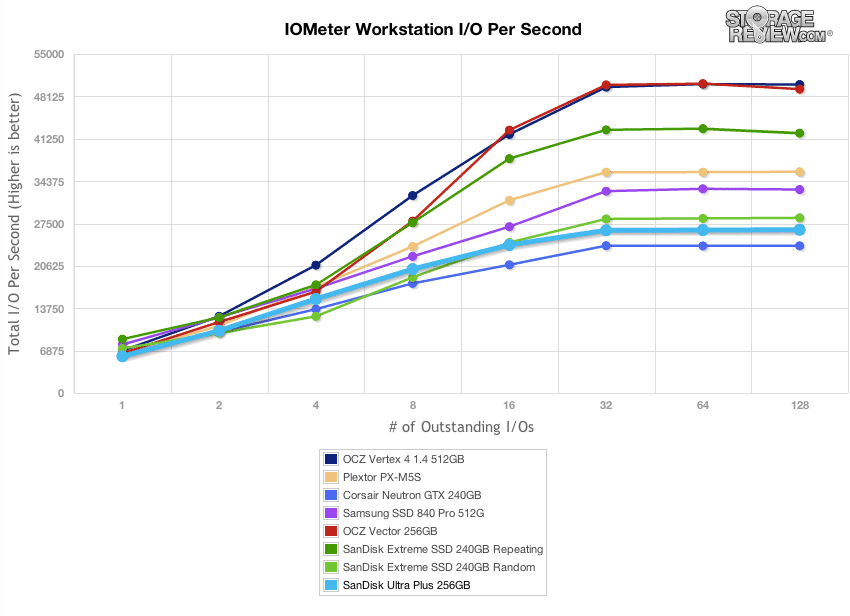
In our next test we shift to a smaller 4k random workload, with 100% read activity that scales from 1QD to 64QD. In this setting the SanDisk Ultra Plus starts off at the middle of the pack and scales to just over 82,000 IOPS.
In our next test looking at 100% 4K random read performance, the SanDisk Ultra Plus slumped to the bottom of the pack, peaking at just over 45,000 IOPS.
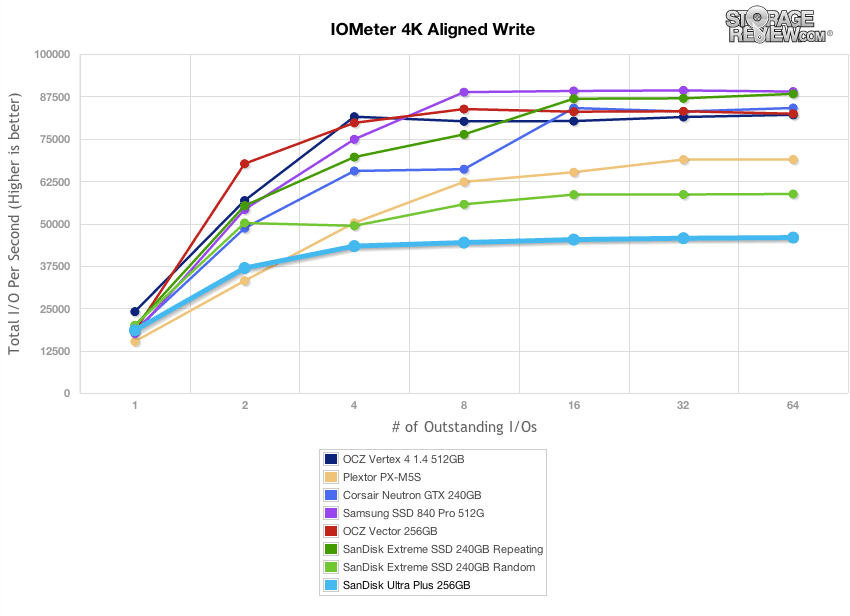
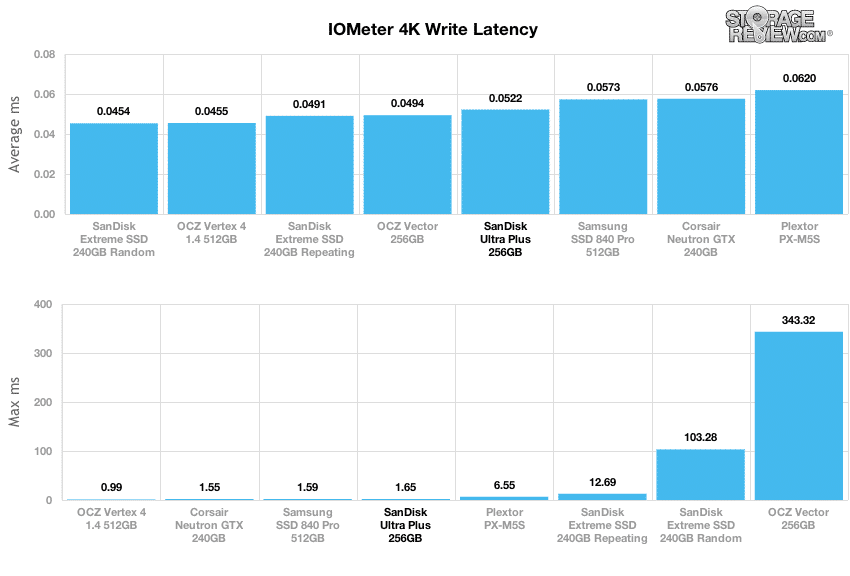
Looking closer at 4K random performance at QD1, we see how well each SSD performs right off the line. While the Ultra Plus came in last with peak 4K write performance, at QD1 its closer to the upper-middle of the pack.
Switching focus to average write latency, the SanDisk Ultra Plus measured 0.0522ms average at QD1, and had an extremely low peak latency of 1.65ms over the duration of that test.
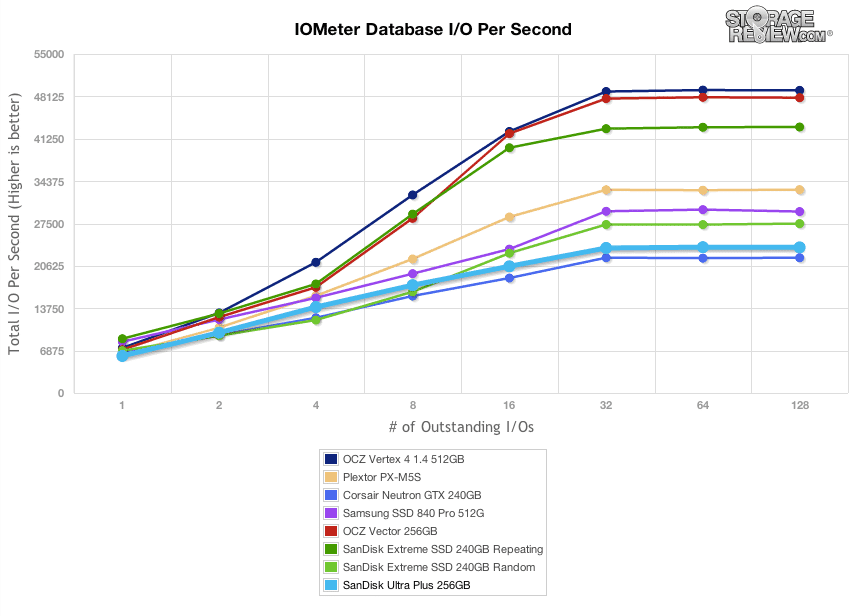
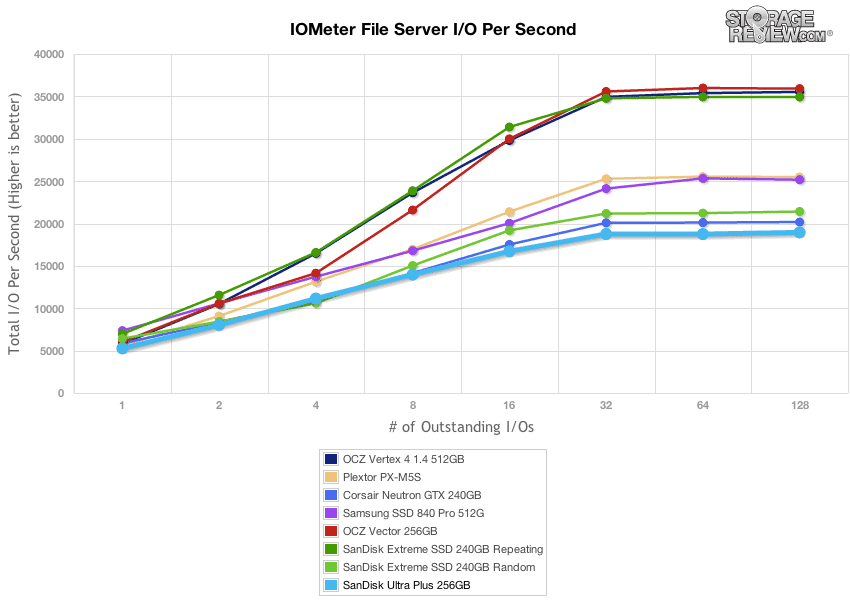
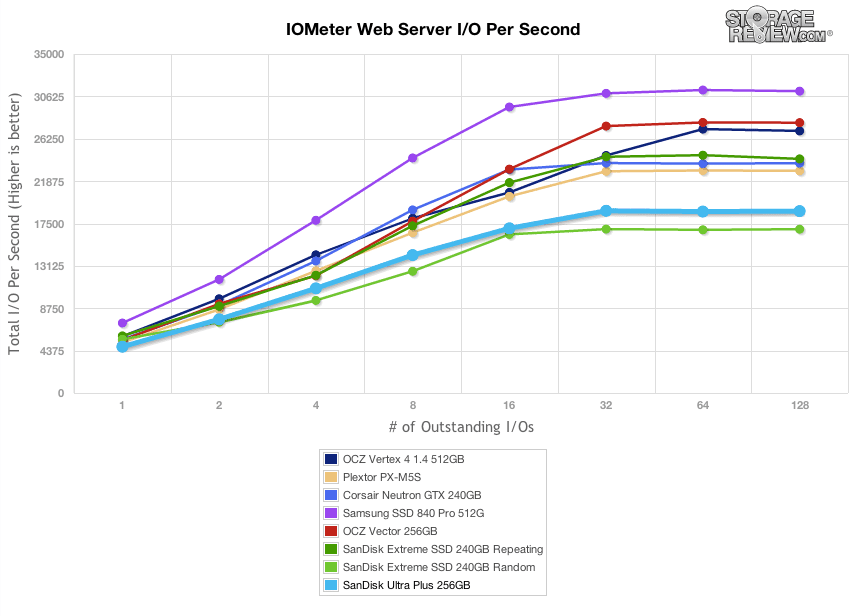
Our last series of synthetic benchmarks compare the hard drives in a series of server mixed-workloads with a queue depth of ranging from 1 to 128. Each of our server profile tests has a strong preference towards read activity, ranging from 67% read with our database profile to 100% read in our web server profile. In all of our mixed workloads the SanDisk Ultra Plus performed near the bottom of the group with weaker low and high-queue depth performance.
The first is our database profile, with a 67% read and 33% write workload mix primarily centered on 8K transfer sizes.
The next profile looks at a file server, with 80% read and 20% write workload spread out over multiple transfer sizes ranging from 512-byte to 64KB.
Our web server profile is read-only with a spread of transfer sizes from 512-byte to 512KB.
The last profile looks at workstation activity, with a 20% write and 80% read mixture using 8K transfers.
Consumer Real-World Benchmarks
For the average consumer, trying to translate random 4K write speeds into an everyday situation is pretty difficult. It helps when comparing drives in every setting possible, but it doesn’t exactly work out into faster everyday usage or better game loading times. For this reason we turned to our StorageMark 2010 traces, which include HTPC, Productivity, and Gaming traces to help readers find out how a drive might rank under their conditions.
The first real-life test is our HTPC scenario. In this test we include: playing one 720P HD movie in Media Player Classic, one 480P SD movie playing in VLC, three movies downloading simultaneously through iTunes, and one 1080i HDTV stream being recorded through Windows Media Center over a 15 minute period. Higher IOps and MB/s rates with lower latency times are preferred. In this trace we recorded 2,986MB being written to the drive and 1,924MB being read. Our second real-life test covers disk activity in a productivity scenario. For all intents and purposes this test shows drive performance under normal daily activity for most users. This test includes: a three hour period operating in an office productivity environment with 32-bit Vista running Outlook 2007 connected to an Exchange server, web browsing using Chrome and IE8, editing files within Office 2007, viewing PDFs in Adobe Reader, and an hour of local music playback with two hours of additional online music via Pandora. In this trace we recorded 4,830MB being written to the drive and 2,758MB being read.
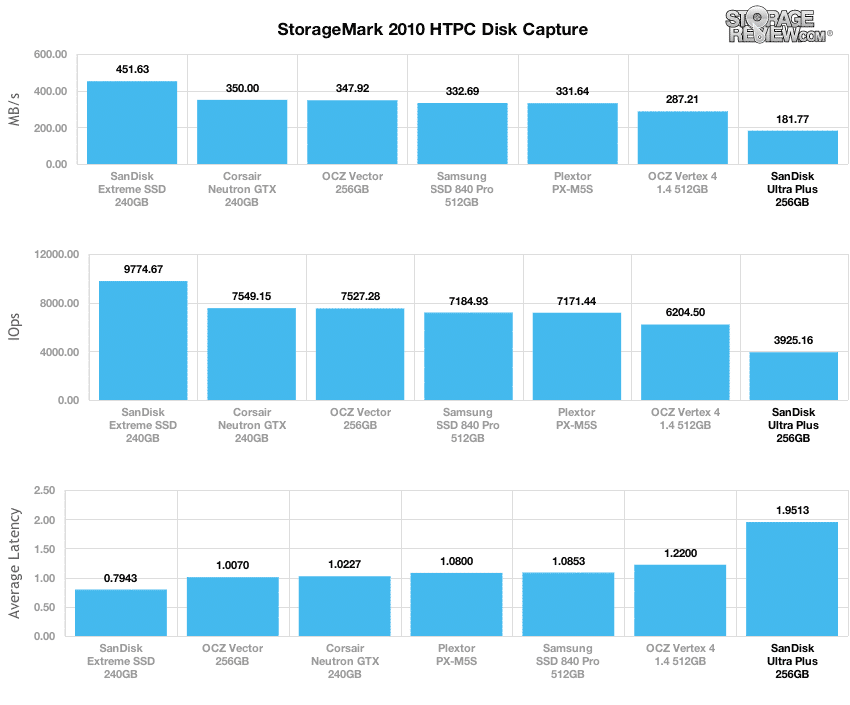
In our HTPC trace the SanDisk Ultra Plus had an average transfer speed of 181MB/s, coming in at the bottom of the group.
Our second real-life test covers disk activity in a productivity scenario. For all intents and purposes this test shows drive performance under normal daily activity for most users. This test includes: a three hour period operating in an office productivity environment with 32-bit Vista running Outlook 2007 connected to an Exchange server, web browsing using Chrome and IE8, editing files within Office 2007, viewing PDFs in Adobe Reader, and an hour of local music playback with two hours of additional online music via Pandora. In this trace we recorded 4,830MB being written to the drive and 2,758MB being read.
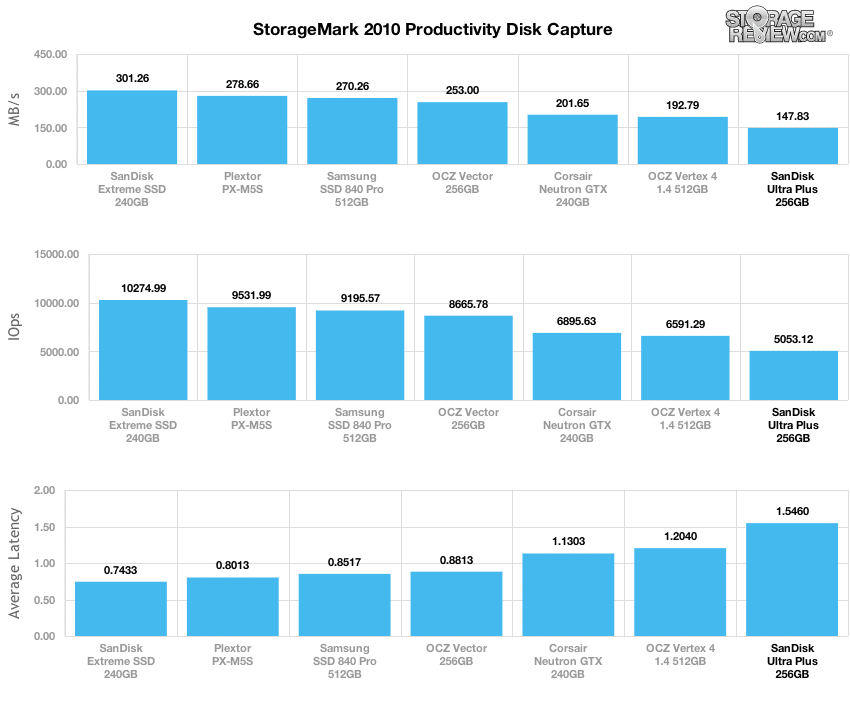
In our Productivity trace, the Ultra Plus measured 147MB/s average, also performing weaker compared to drive in this category.
Our third real-life test covers disk activity in a gaming environment. Unlike the HTPC or Productivity trace, this one relies heavily on the read performance of a drive. To give a simple breakdown of read/write percentages, the HTPC test is 64% write, 36% read, the Productivity test is 59% write and 41% read, while the gaming trace is 6% write and 94% read. The test consists of a Windows 7 Ultimate 64-bit system pre-configured with Steam, with Grand Theft Auto 4, Left 4 Dead 2, and Mass Effect 2 already downloaded and installed. The trace captures the heavy read activity of each game loading from the start, as well as textures as the game progresses. In this trace we recorded 426MB being written to the drive and 7,235MB being read.
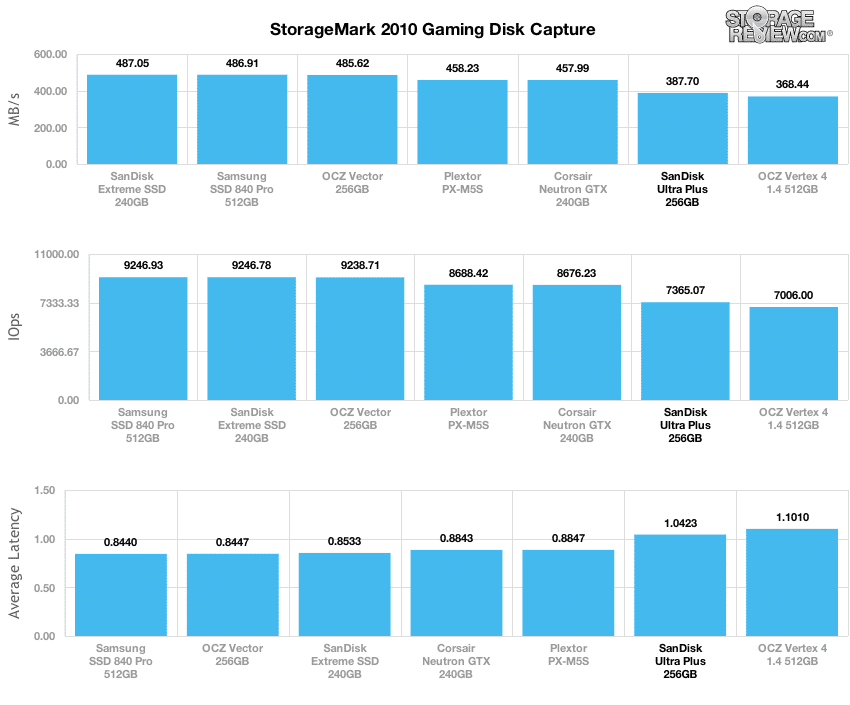
In our last trace covering a gaming profile, the SanDisk Ultra Plus measured 387MB/s average, coming in towards the bottom of the pack but still ahead of the OCZ Vertex 4.
Power Consumption
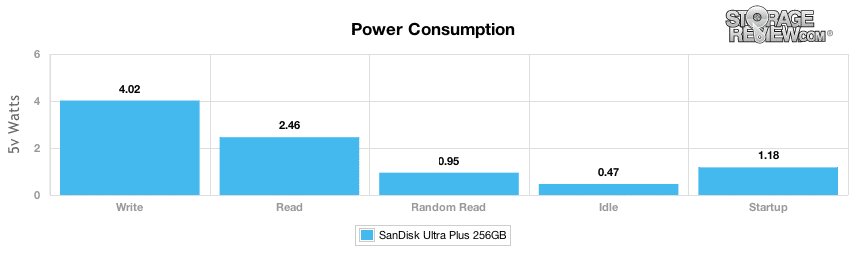
When it comes to power usage, the SanDisk Ultra Plus SSD consumed 0.47 watts at idle and used 1.18 watts at startup. During active use the Ultra Plus consumed 4.02 watts with constant drive activity, 2.46 watts with constant sequential read activity, and 0.95 watts with random 4k read activity.
Enterprise Testing Environment
The lines are blurring between where high-end of consumer flash storage and traditional enterprise flash storage get used in enterprise flash arrays, or arrays that use flash as a tier/cache. With several compelling enterprise solutions now featuring MLC NAND either with enterprise or consumer SSDs, we are putting new high performance solid state drives through the full rigor of our Enterprise Testing Lab. StorageReview’s enterprise lab is equipped to create a variety of hardware and network configurations that are found in datacenters, including servers, networking, rack space, and power conditioning/monitoring.

Our consumer tests worked with the optimized capacity of each drive, but for enterprise benchmarks we like to put equal capacities against each other, since larger drives have an inherent benefit in this type of testing. Since we were only sampled a 256GB OCZ Vector, it isn’t a perfect apples to apples comparison against other drives such as the 512GB Vertex 4 and Samsung SSD 840 Pro, although at the time of this review it was best we had on hand.
The comparables for this review include:
- Plextor PX-M5S (256GB, Marvell 9174, Micron 25nm MLC NAND, SATA)
- Samsung SSD 840 Pro (512GB, 300mhz Samsung 3-core MCX controller, Samsung 2x nm Toggle NAND Flash, SATA)
- Corsair Neutron GTX (240GB, LAMD LM87800, Toshiba 24nm toggle NAND, SATA)
- OCZ Vertex 4 (512GB, Indilinx Everest 2, Intel 25nm MLC NAND, SATA)
We tested the drives using our Lenovo ThinkServer RD240, configured with:
- 2 x Intel Xeon X5650 (2.66GHz, 12MB Cache)
- Windows Server 2008 Standard Edition R2 SP1 64-Bit and CentOS 6.2 64-Bit
- Intel 5500+ ICH10R Chipset
- Memory – 8GB (2 x 4GB) 1333Mhz DDR3 Registered RDIMMs
Enterprise Synthetic Workload Analysis
Flash performance varies greatly over the preconditioning phase of each storage device. Our enterprise storage benchmark process analyzes the drive’s total throughput, average latency, peak latency, and standard deviation throughout preconditioning. Since latency is often more important than throughput we will emphasize the full latency characteristics of each drive.
For each workload, each of the comparable drives are secure erased using the vendor’s tools, preconditioned into steady-state with the same workload the device will be tested with under a heavy load of 16 threads with an outstanding queue of 16 per thread, and then tested in set intervals in multiple thread/queue depth profiles to show performance under light and heavy usage.
Preconditioning and Primary Steady-State Tests:
- Throughput (Read+Write IOPS Aggregate)
- Average Latency (Read+Write Latency Averaged Together)
- Max Latency (Peak Read or Write Latency)
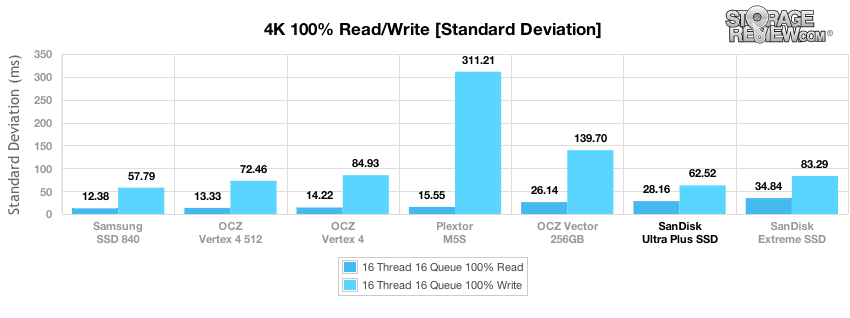
- Latency Standard Deviation (Read+Write Standard Deviation Averaged Together)
Our Enterprise Synthetic Workload Analysis includes four profiles based on real-world tasks. These profiles have been developed to make it easier to compare to our past benchmarks as well as widely-published values such as max 4K read and write speed and 8K 70/30, which is commonly used for enterprise drives. We also included two legacy mixed workloads, the traditional File Server and Webserver, each offering a wide mix of transfer sizes.
- 4K
- 100% Read or 100% Write
- 100% 4K
- 8K 70/30
- 70% Read, 30% Write
- 100% 8K
- File Server
- 80% Read, 20% Write
- 10% 512b, 5% 1k, 5% 2k, 60% 4k, 2% 8k, 4% 16k, 4% 32k, 10% 64k
- Webserver
- 100% Read
- 22% 512b, 15% 1k, 8% 2k, 23% 4k, 15% 8k, 2% 16k, 6% 32k, 7% 64k, 1% 128k, 1% 512k
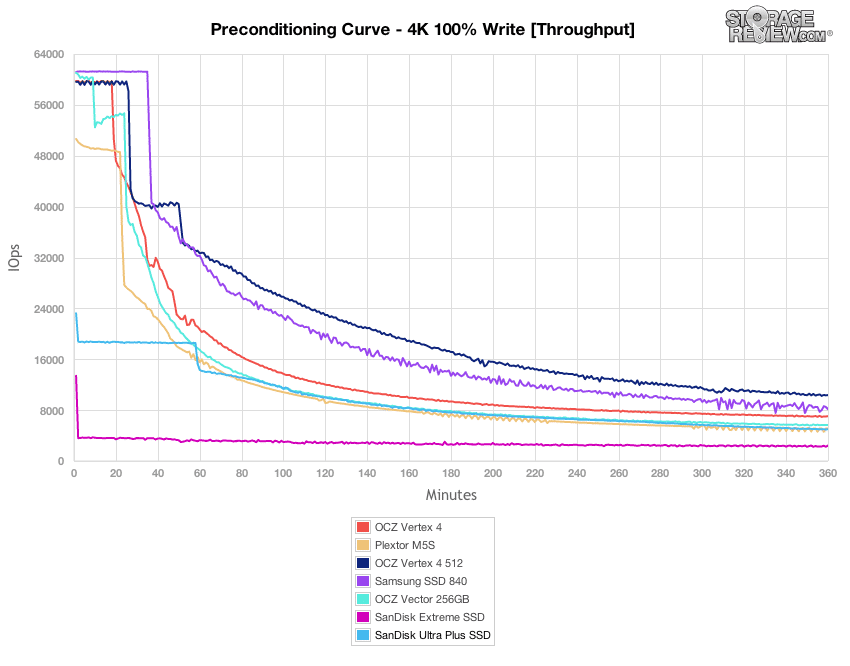
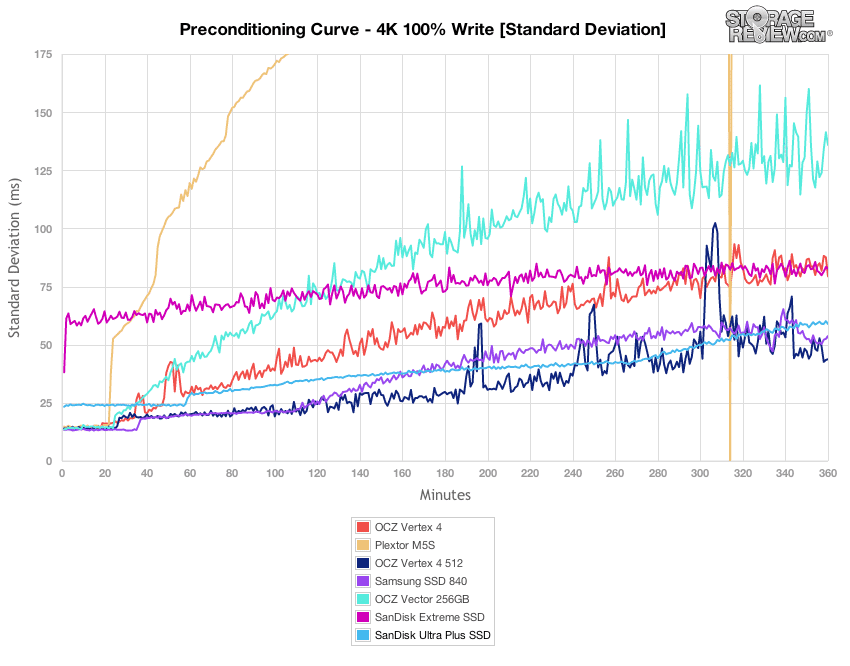
Our first enterprise workloads looks at random 4K performance after the drive has reached steady-state performance. In the first half of the test we preconditioned each drive with a 100% 4K random write workload and gauge how each drive responds in throughput and latency. In this first segment, The SanDisk Ultra Plus started with a burst speed of around 24,000 IOPS before quickly tapering off where it leveled off around 5,000 IOPS.
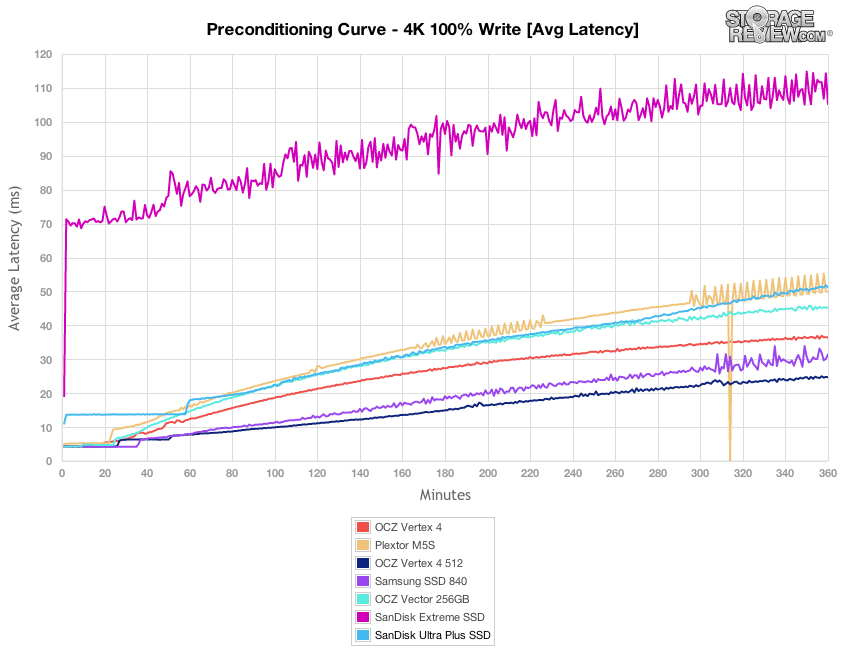
Comparing average latency with a 100% 4K random write workload, the Ultra Plus measured roughly 14ms during burst with a 16T/16Q load, increasing to 50ms as it neared steady-state.
While the SanDisk Ultra Plus came in at the middle of the pack in throughput and average latency, its peak latency performance led the pack with the lowest times in each interval.
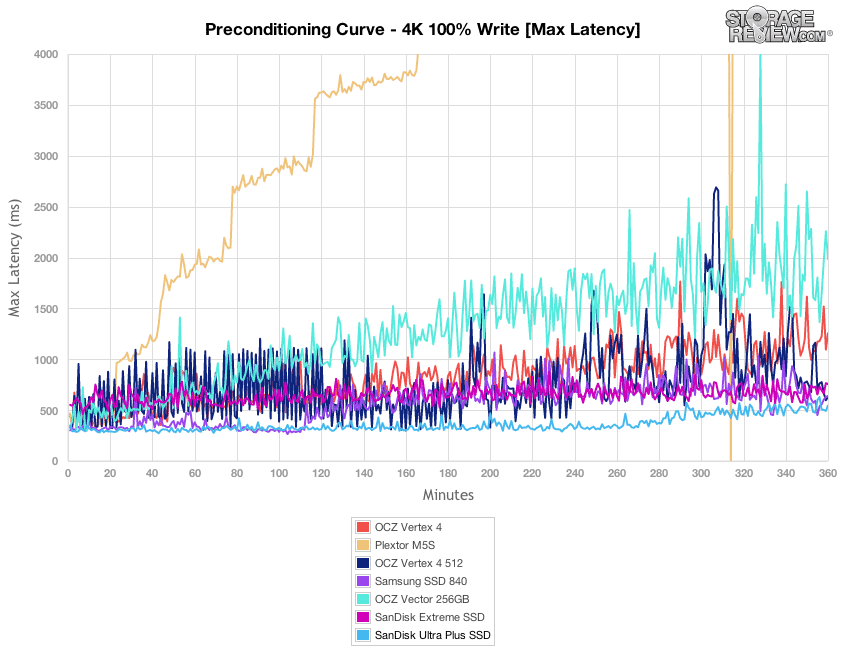
Similar to the performance we noted in the 4k preconditioning max latency section, the Ultra Plus also performed very well in terms of latency consistency.
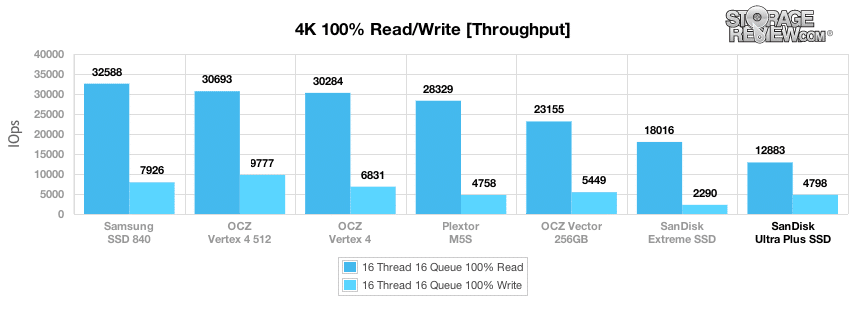
After our 6 hour preconditioning stage had finished with each SSD, we took a longer sample of 100% read and 100% write 4k write performance with a 16T/16Q load. After reaching steady-state, we measured 12,883 IOPS read and 4,798 IOPS write from the Ultra Plus.
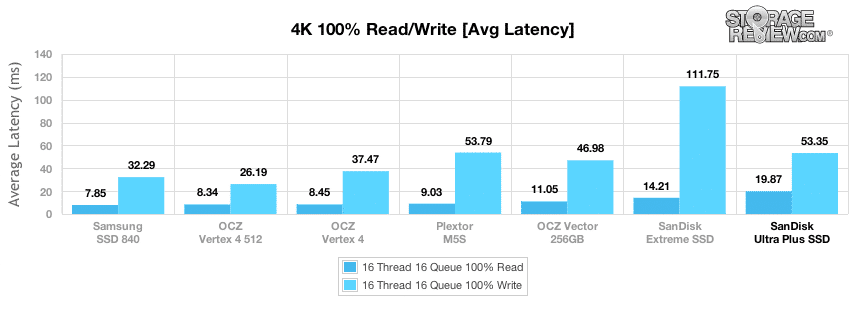
After reaching steady-state, the average response time of the SanDisk Ultra Plus measured 19.87ms in read activity and 53.35ms in write activity.
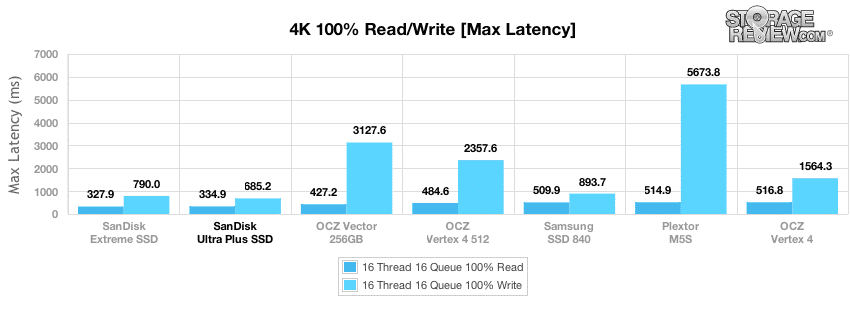
Max latency measured 334.9ms in read activity and 685.2ms in write activity.
Latency consistency was weaker in terms of read activity, but ranked well with write activity.
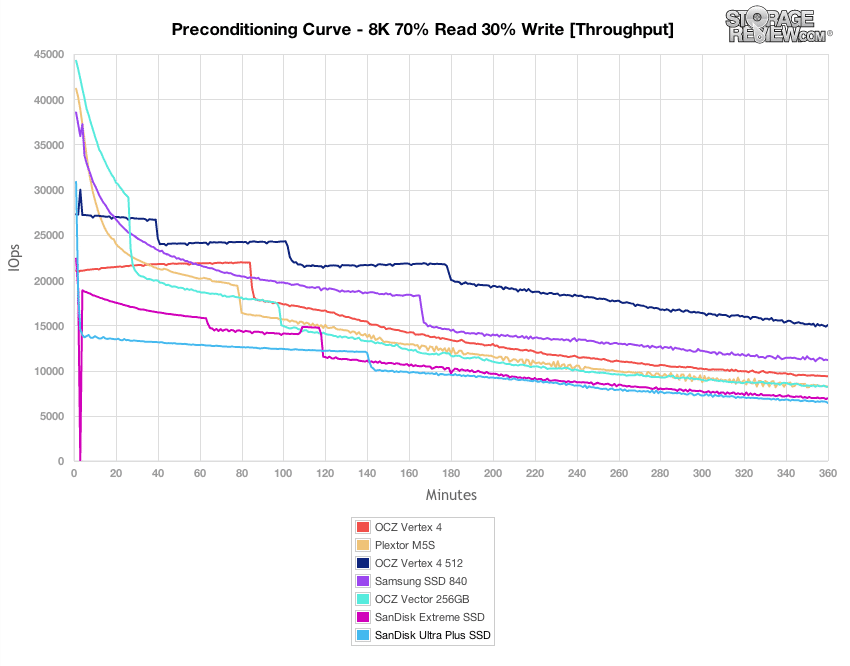
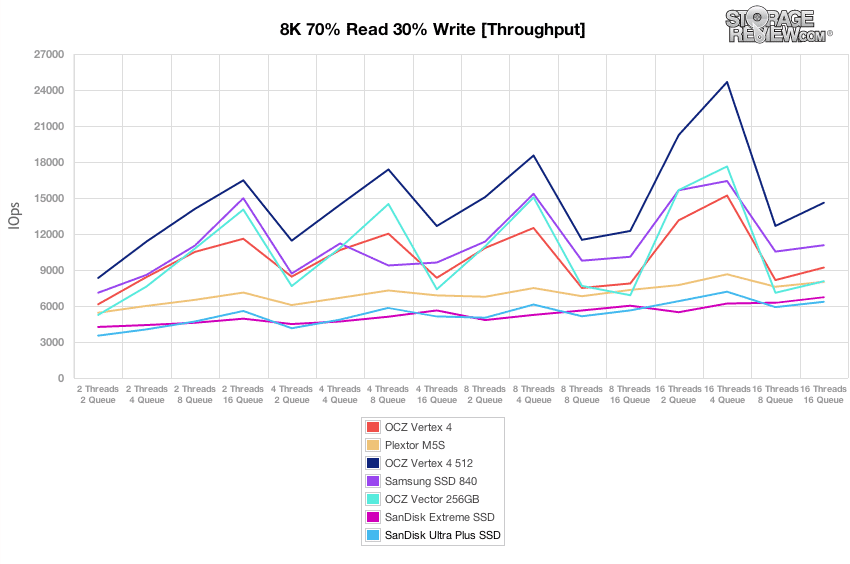
Our next section switches from a constant 100% 4K workload to an 8K 70/30 profile. With a constant 8k 70/30 profile with a 16T/16Q load the Ultra Plus had a burst speed just above 30,000 IOPS before quickly leveling off to around 7,000 IOPS in steady-state.
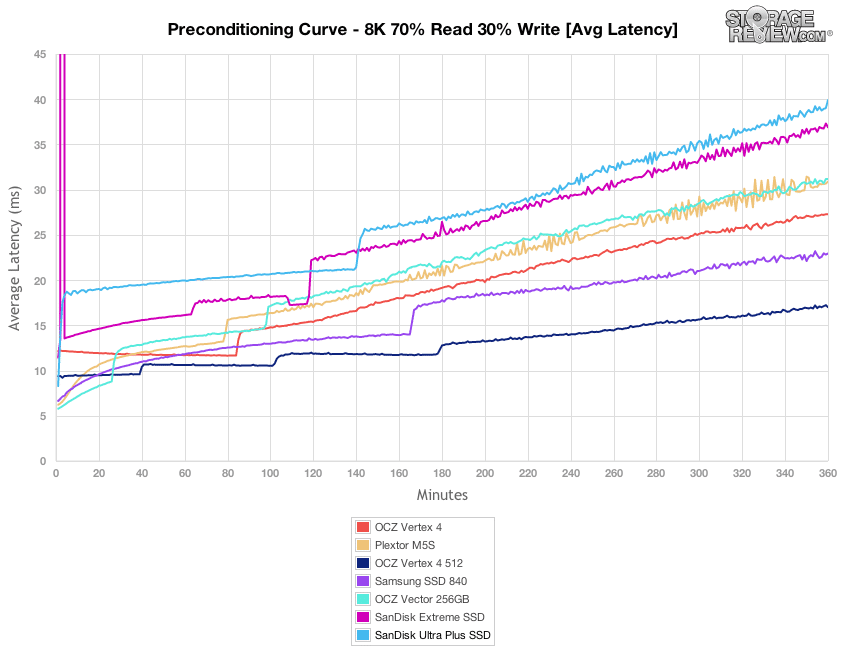
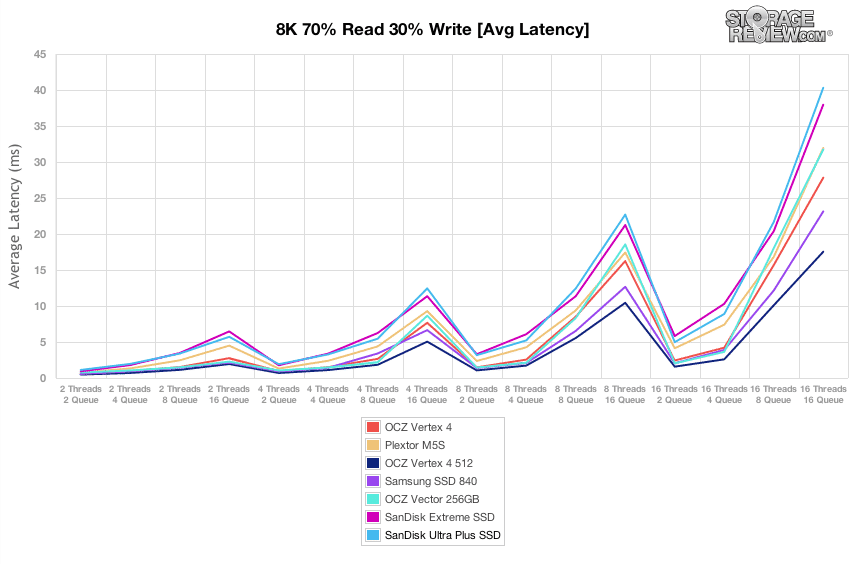
In our 8K 70/30 workload, average latency from the SanDisk Ultra Plus ranged from around 7ms in burst to about 40ms as it reached steady-state.
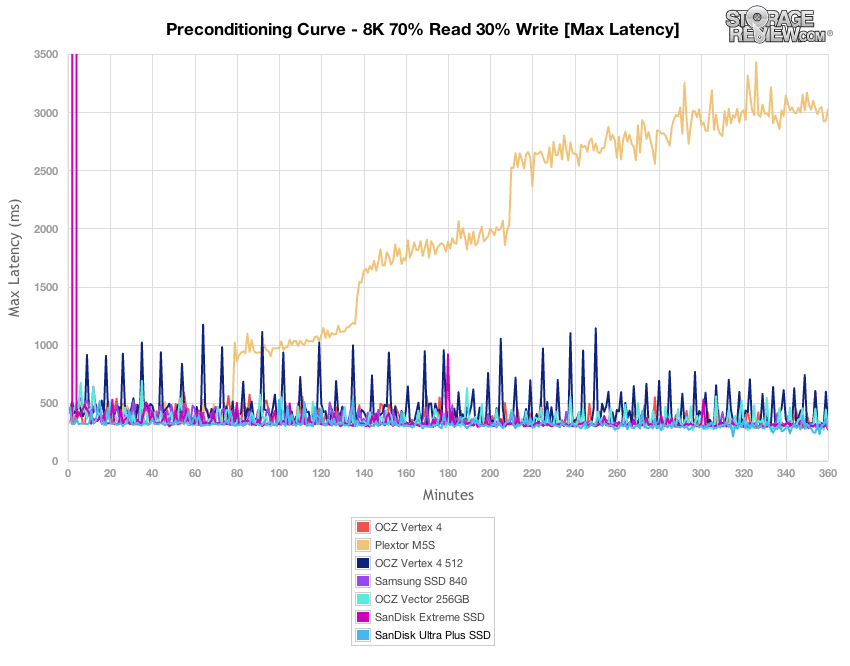
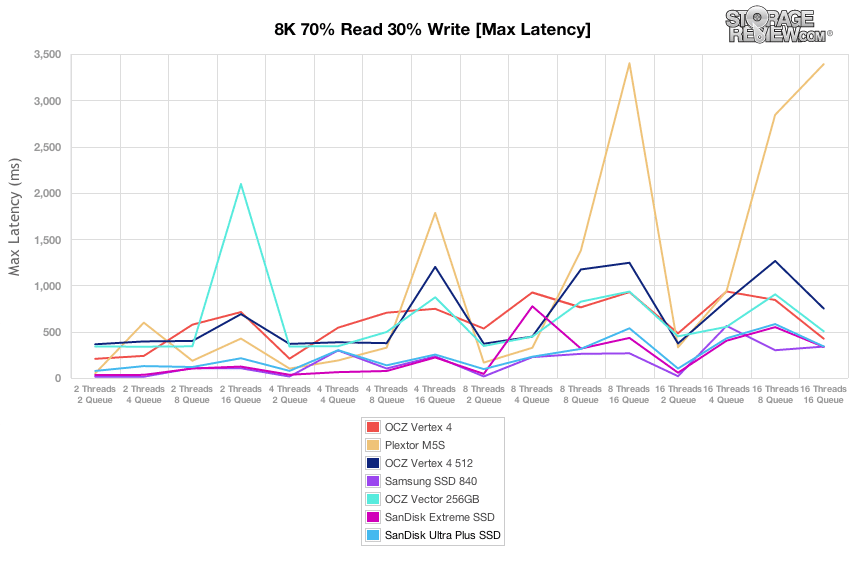
Max latency during the 8K 70/30 preconditioning stage measured between 400-600ms from the SanDisk Ultra Plus.
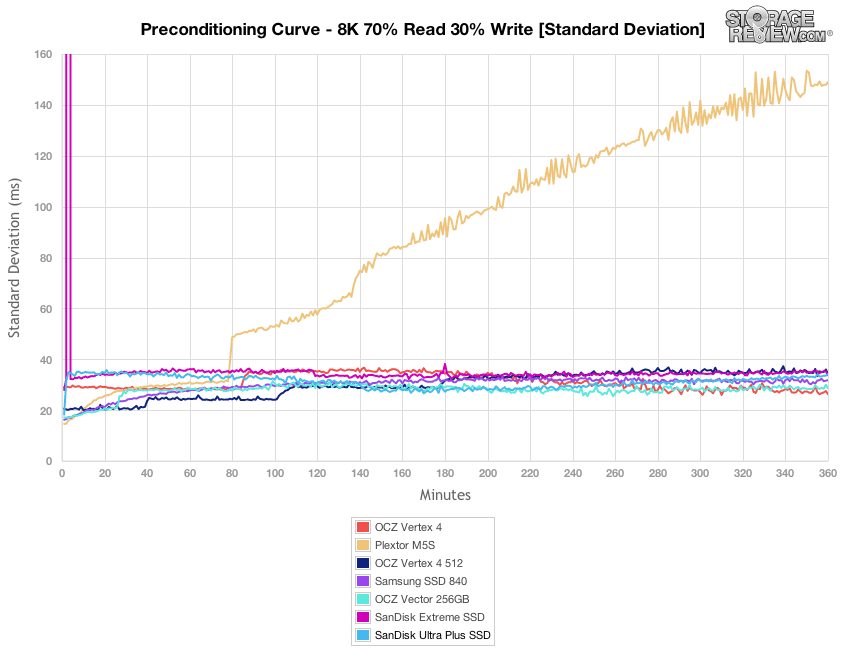
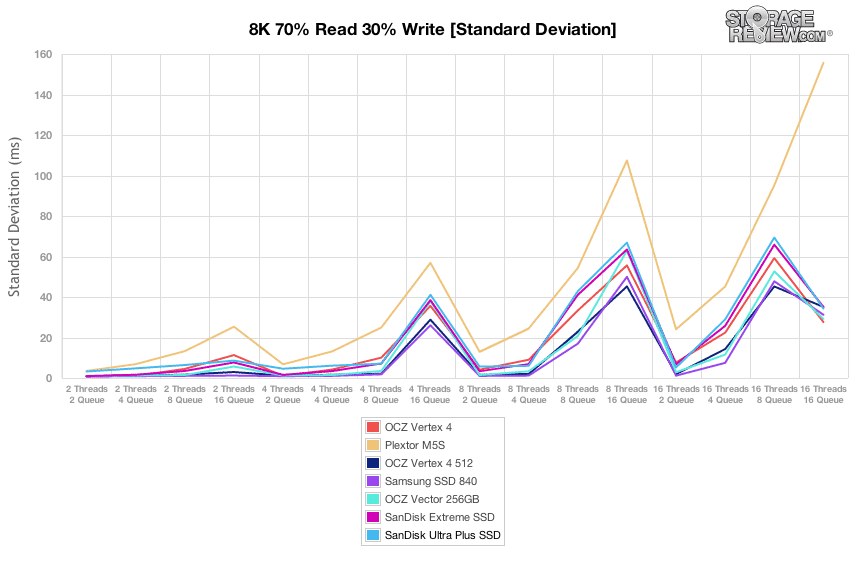
Latency consistency from the SanDisk Ultra Plus ranked upper-middle of the pack in our 8K 70/30 workload.
After the 6-hour 8K 70/30 preconditioning process had finished, the Ultra Plus offered throughput speeds ranging from 3,529 IOPS up to 7,191 IOPS at 16T/4Q.
Comparing average latency in our 8K 70/30 test, the SanDisk Ultra Plus came in at the bottom of the pack, with latency ranging from 1.12ms up to 40.3ms.
Max latency stayed between 100-500ms over the duration of the test, offering lower peak latency than many of the consumer SSDs in this test.
Switching to latency consistency, the SanDisk Ultra Plus came in towards the bottom of the pack, coming in only in front of the Plextor M5S.
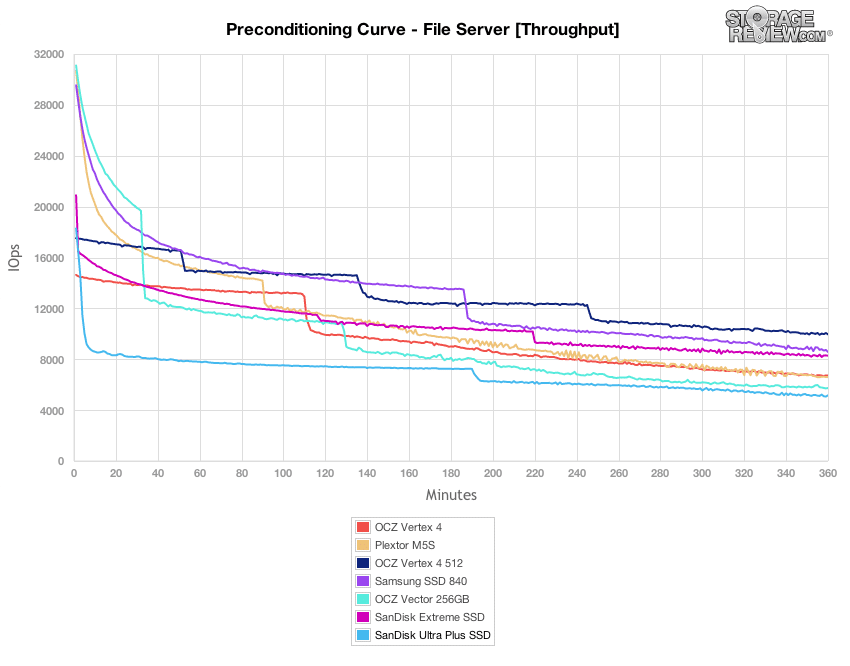
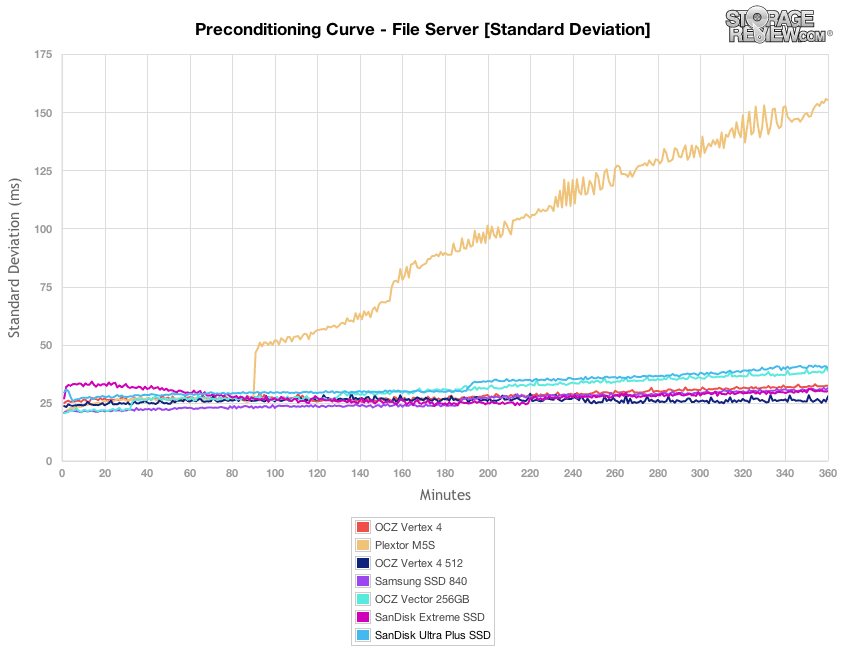
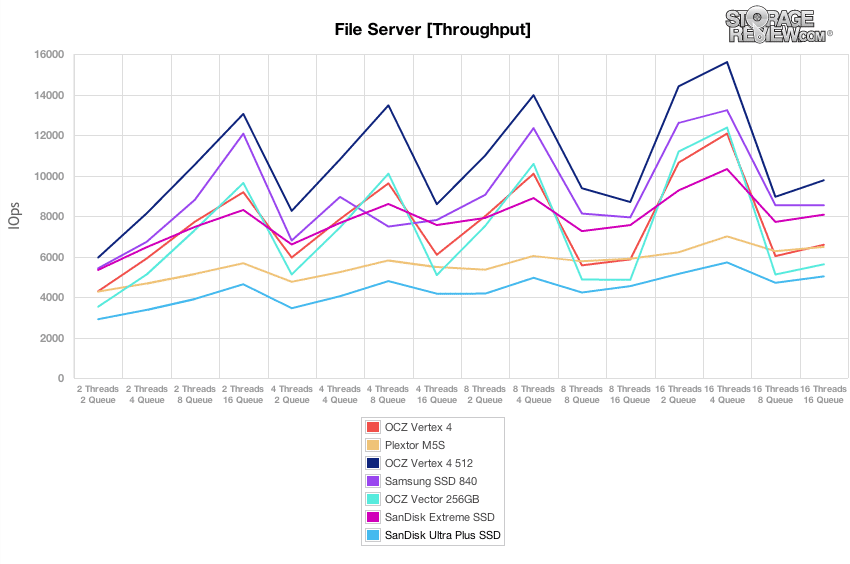
The next workload is our File Server profile, which covers a wide range of transfer sizes spanning from 512b to 512K. With a heavy 16T/16Q saturation load, the SanDisk Ultra Plus had a burst speed measuring about 18,000 IOPS before leveling off to around 5,100 IOPS.
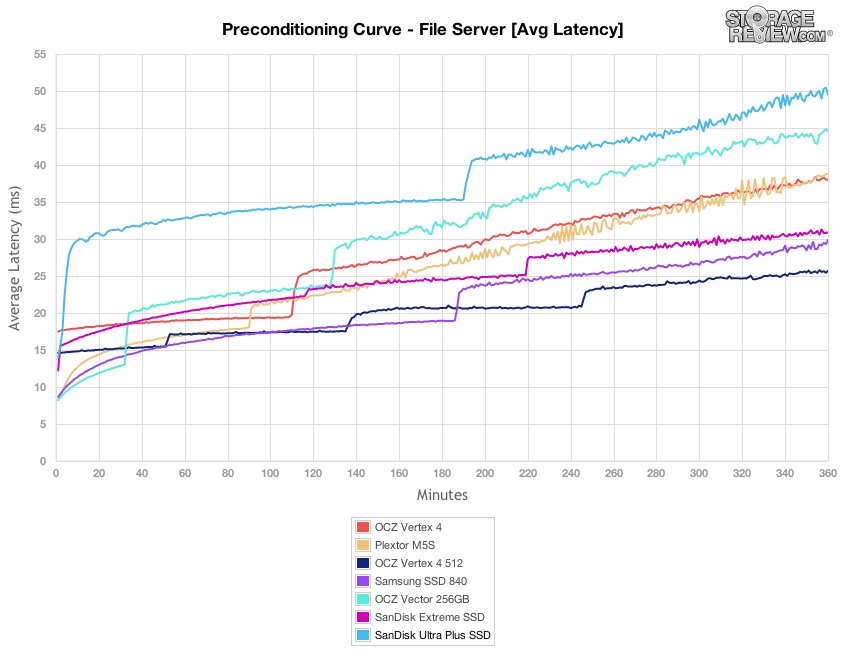
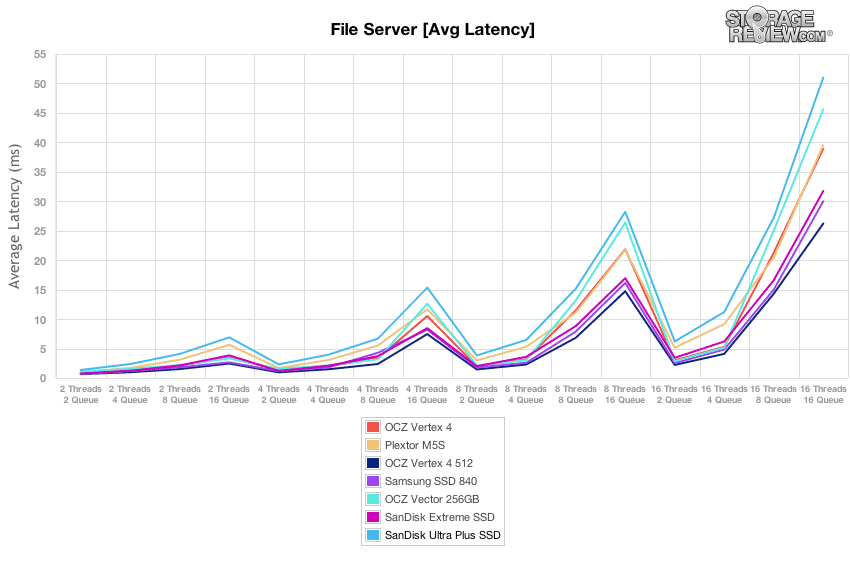
In the File Server preconditioning stage, the SanDisk Ultra Plus ranked at the bottom of the group with the highest average latency after the drive left its burst stage.
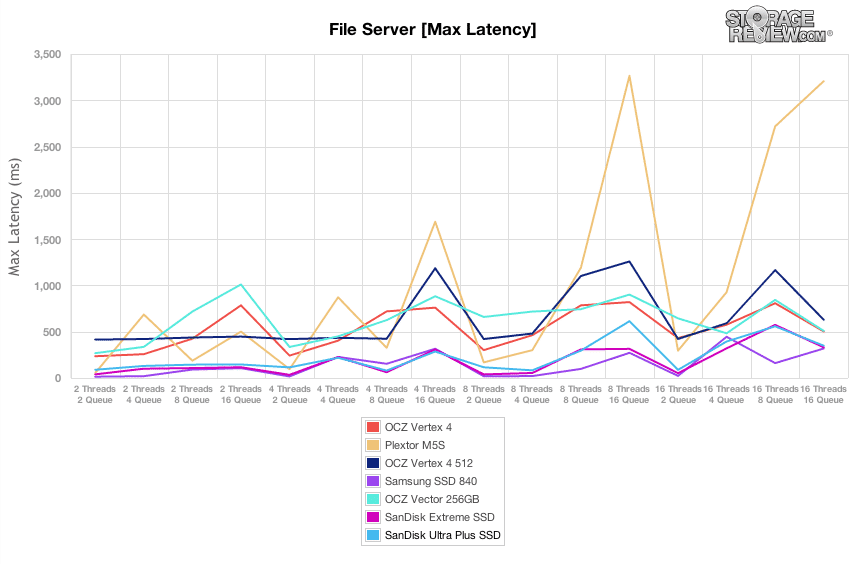
Comparing peak response times only, the SanDisk Ultra had some of the lowest max latency over the duration of the preconditioning stage in our File Server workload.
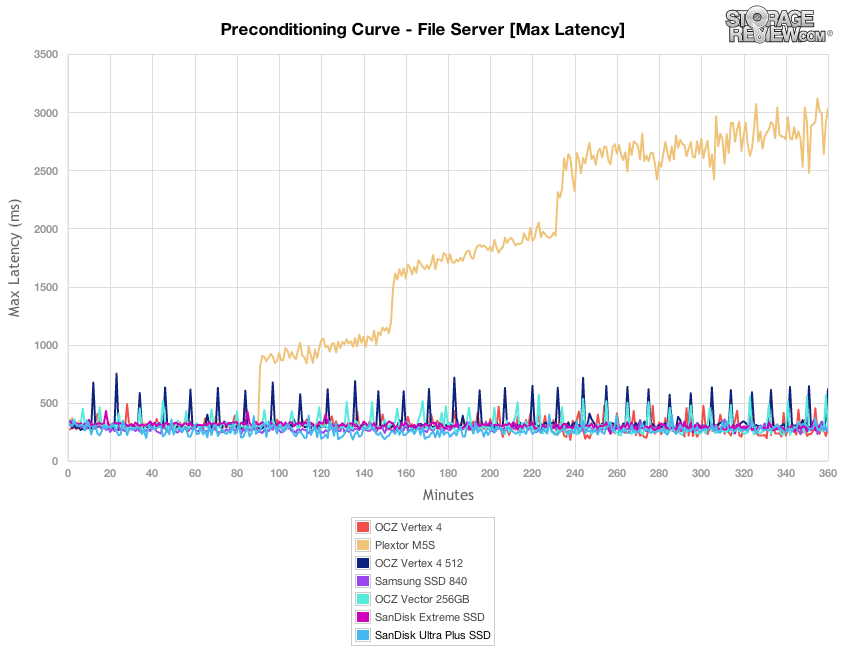
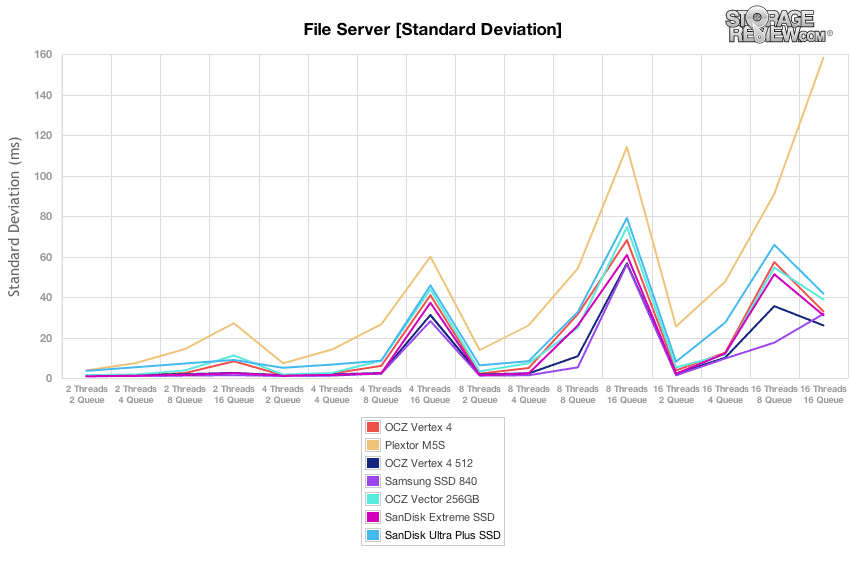
While the SanDisk Ultra Plus offered very low peak response times, its overall consistency was weaker than most in the group with the exception of the Plextor M5S.
After our 6-hour File Server preconditioning stage finished, we measured the performance of the SanDisk Ultra Plus with a load of 2T/2Q up to 16T/16Q. In these tests the Ultra Plus ranked at the bottom of the pack, with performance scaling from 2,903 IOPS at 2T/2Q up to 5,707 IOPS at 16T/4Q.
Average latency in the File Server test scaled from 1.37ms at 2T/2Q up to 50.99ms at 16T/16Q.
Comparing max latency, the SanDisk Ultra Plus stayed at the top of the class, staying below 500ms for the bulk of the test at loaded below an effective queue depth of 64.
While the SanDisk Ultra Plus SSD had very low max latency, its latency standard deviation was higher than most in the group except for the Plextor M5S.
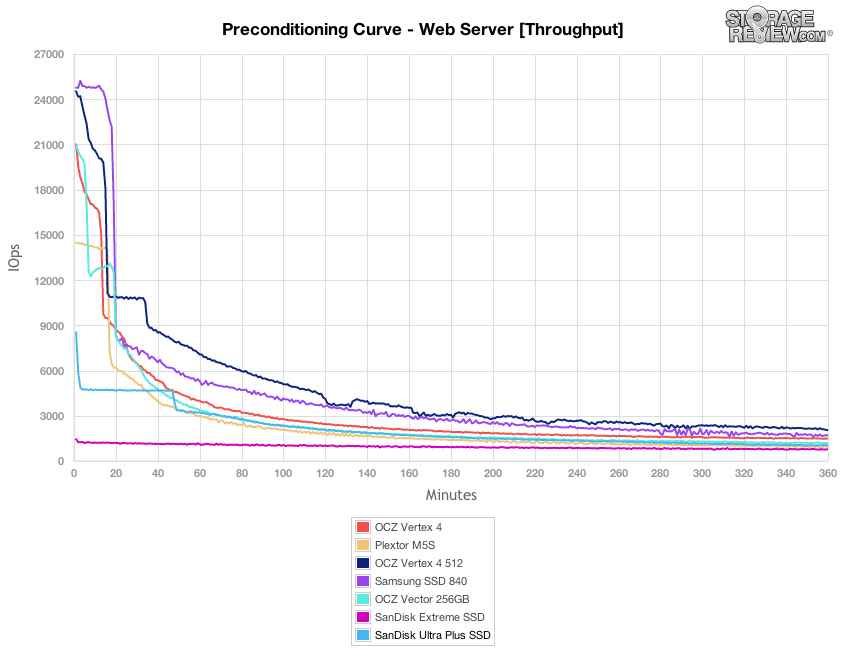
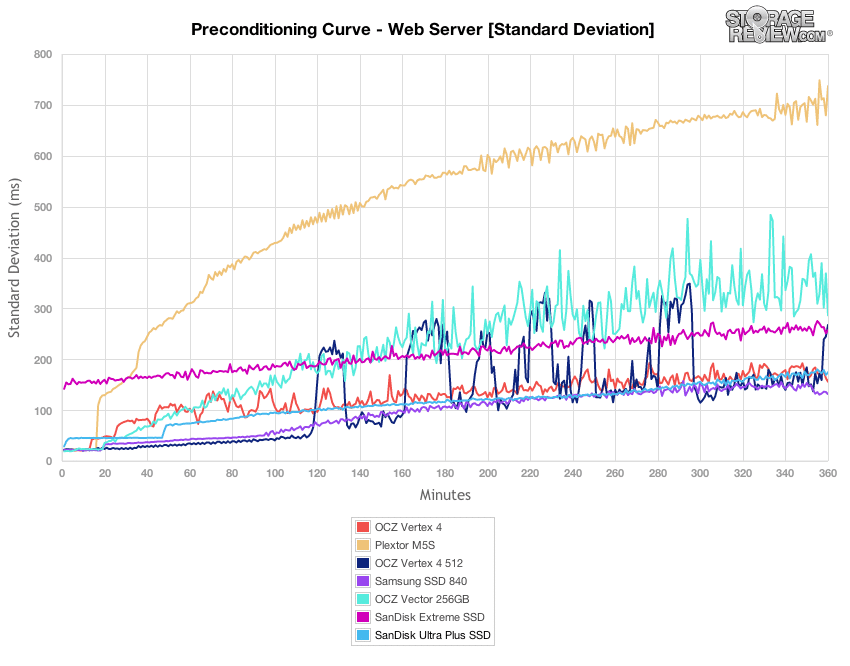
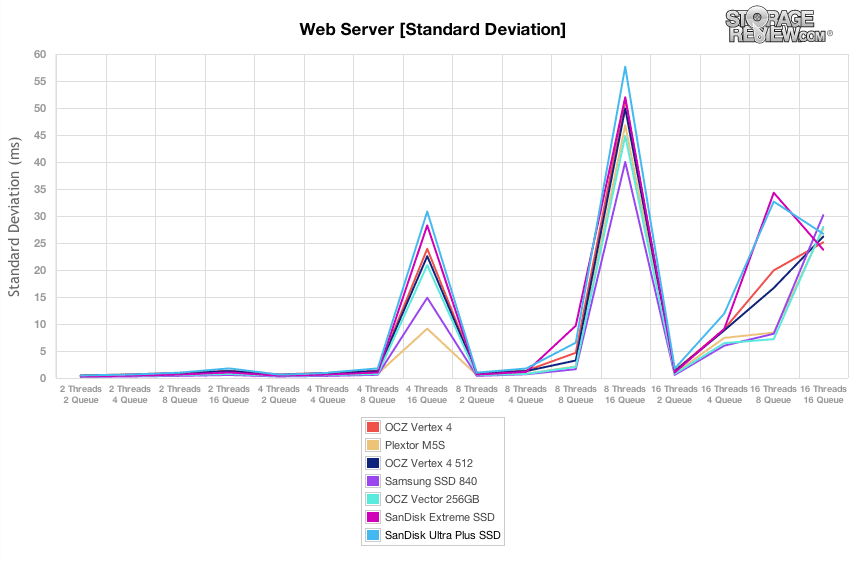
Our final preconditioning workload takes the traditional 100% read activity Web Server test and flips it to 100% write to precondition each SSD. This is our most aggressive workload, although it doesn’t really match any real-world conditions with 100% write. In this section the SanDisk Ultra Plus levels off towards the lower middle of the pack, averaging about 1,500 IOPS as it neared steady-state.
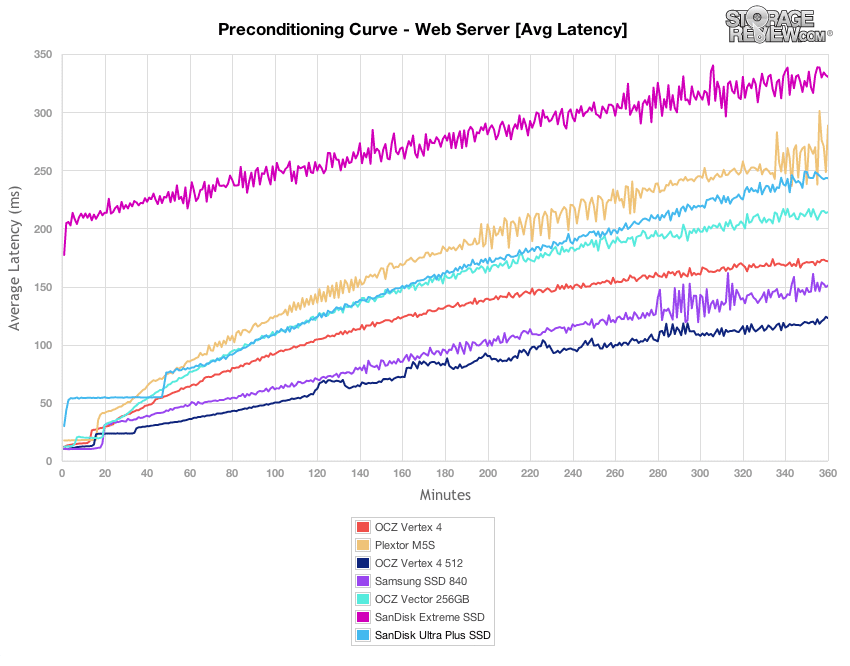
Under a heavy 100% write profile with a 16T/16Q the Ultra Plus had a response time that averaged close to 250ms as it neared steady-state. This came ahead of the Plextor M5S and the SanDisk Extreme.
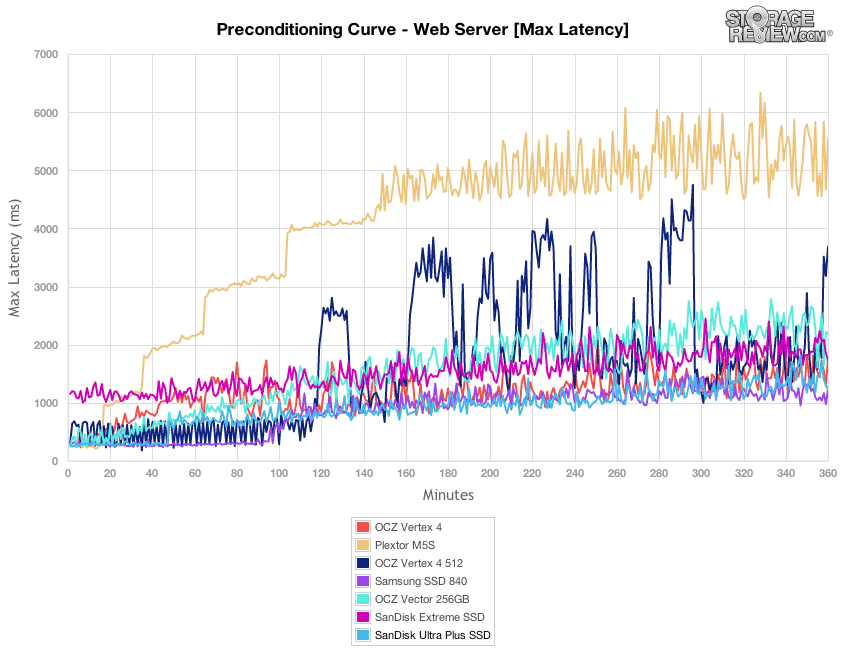
Comparing max latency in our heavy Web Server preconditioning run the SanDisk Ultra Plus had some of the lowest peak response times in the group as it neared steady-state.
The latency standard deviation profile of the SanDisk Ultra Plus remained very smooth as the drive neared steady-state, coming in just below the Samsung SSD 840 Pro and the OCZ Vertex 4.
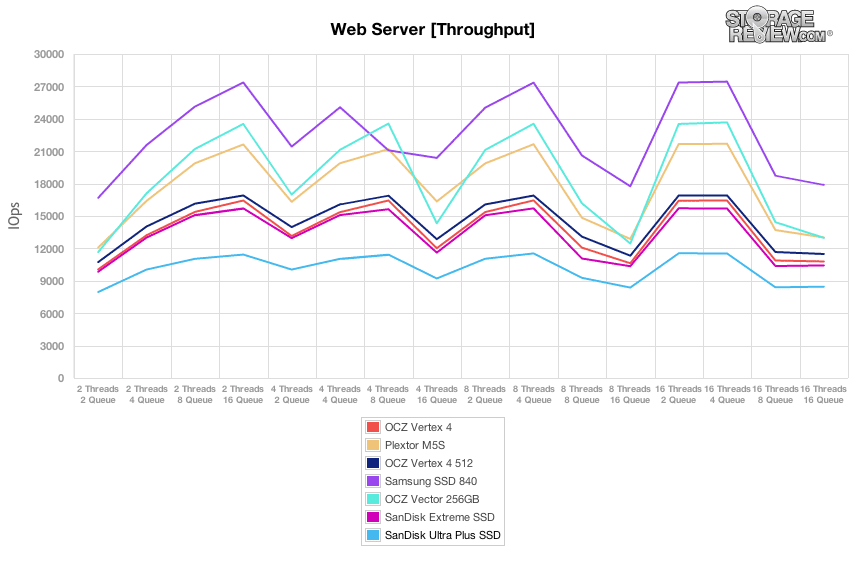
After each SSD finished our preconditioning stage in the Web Server test, we flipped the workload back to 100% read. In read-only conditions, the SanDisk Ultra SSD came in at the bottom of the pack, with performance scaling between 7,960 IOPS at 2T/2Q and reaching a peak of 11,544 IOPS at 16T/2Q.
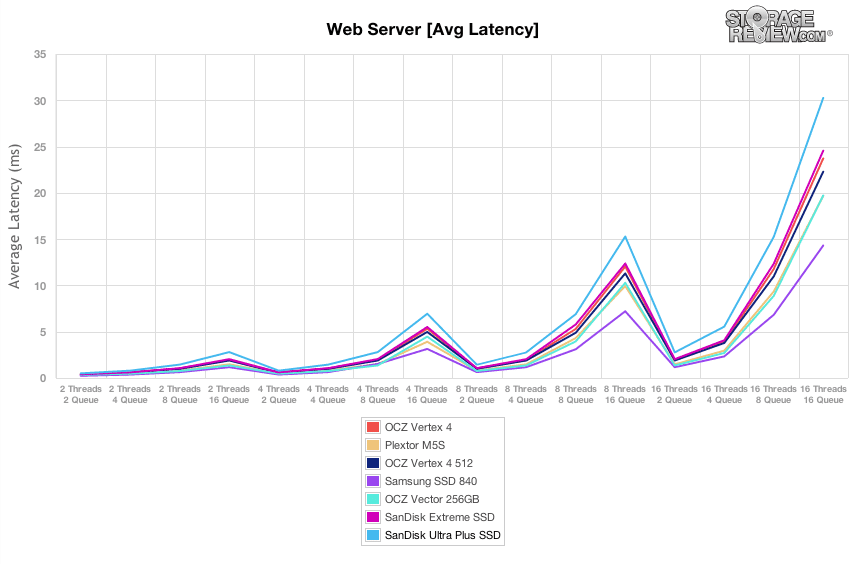
With lower throughput in the consumer SSD group, the SanDisk Ultra SSD had the highest average response times, scaling from 0.499ms at 2T/2Q up to 30.3ms at 16T/16Q.
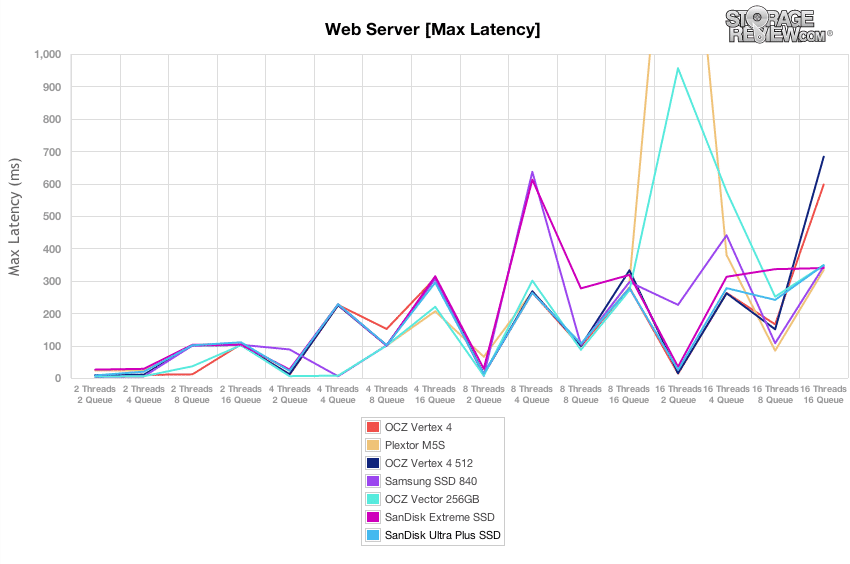
Over the load range of 2T/2Q to 16T/16Q the SanDisk Ultra Plus kept its peak response times below 300ms for all workloads except 16T/16Q where it increased to 350ms.
Comparing latency standard deviation in our 100% read Web Server test, the SanDisk Ultra SSD had the weakest latency consistency over the duration of the test, except for 16T/16Q where it slightly edged out the OCZ Vector and Samsung SSD 840 Pro.
Conclusion
There are many reasons to like the SanDisk Ultra Plus, primarily due to engineering benefits that include the SanDisk NAND, firmware and NAND management techniques. This combination has historically proven to yield SSDs with higher reliability and quicker turn cycles in the event issues need to be resolved. The Ultra Plus also uses a Marvell controller, which SanDisk used in large part to have a secondary non-SandForce drive.
Some of SanDisk’s secret sauce in the Ultra Plus involves nCache, which is a non-volatile write cache that essentially organizes small writes into larger, more NAND friendly writes. There are certainly some NAND endurance benefits here, SanDisk quotes endurance numbers of 80TBW which is quite high for a drive of this class, but in terms of performance benefit we didn’t see it pan out well in either of our consumer or enterprise workloads. In many of our burst-oriented consumer workloads the Ultra Plus came in below its high-performance and mainstream competition, with the biggest differences in our real-world traces as well as our IOMeter mixed-workload profiles. Testing the Ultra Plus in our enterprise-focused endurance workload found similar behavior, with the SanDisk SSD trailing at the bottom of the pack.
Overall for customers looking to buy a non-SandForce SSD from SanDisk, the Ultra Plus brings another option to the table. Compared to the SanDisk Extreme, the Ultra Plus also comes in a thinner form-factor, aimed at denser installations. While performance could be improved across the board, reliability and price may sway some customers looking for an SSD.
Pros
- Home grown firmware, software and NAND
- Very compact design geared towards notebooks and ultrabooks
- Low max latency during consumer and enterprise workloads
Cons
- Lower burst performance than many mainstream and high-performance consumer SSDs
- Weaker enterprise workload throughput
Bottom Line
The SanDisk Ultra Plus SSD gives customers a second choice in the SanDisk lineup that doesn’t use a SandForce controller. While the benefits of tighter firmware integration and in-house SanDisk NAND may offer higher levels of reliability, in terms of performance, it lagged behind in our consumer and enterprise workloads.


 Amazon