

ScaleFlux uniquely focuses on computational storage at scale. Its new Computational Storage Device (CSD) 3000 is a Gen4 SSD with integrated data compression and decompression engines, which the company says can quadruple capacity and double performance. We’ll be putting those claims to the test.
ScaleFlux CSD 3000 Specifications
For background on computational storage, our ScaleFlux CSD 2000 review (the previous version of the CSD 3000 reviewed here) is a worthwhile read. In short, computational storage integrates computing resources in the storage itself instead of relying on the host system’s computing resources.
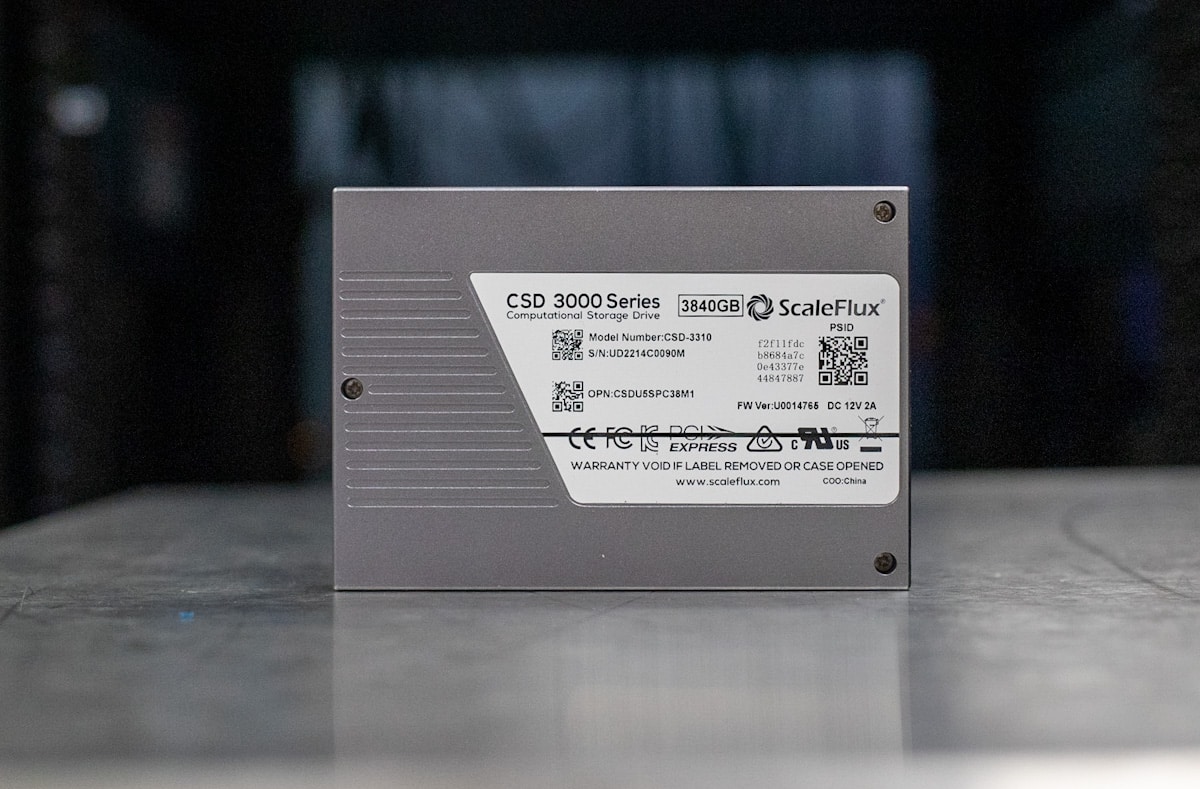
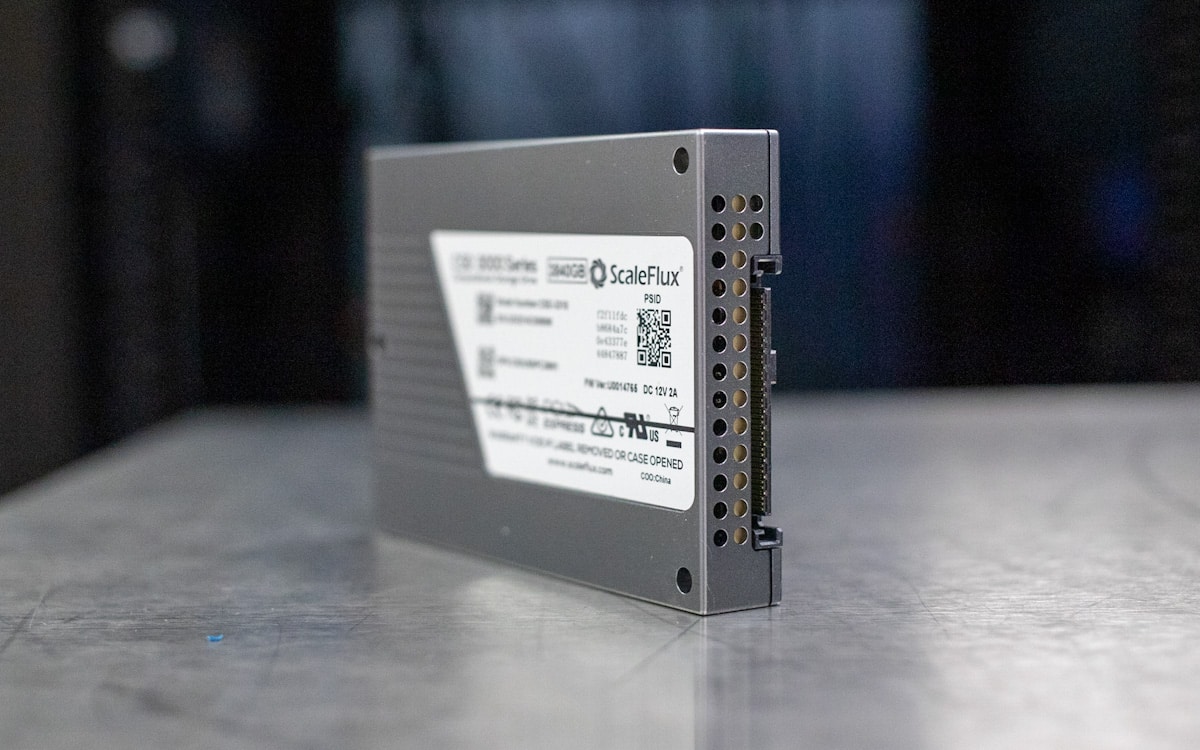
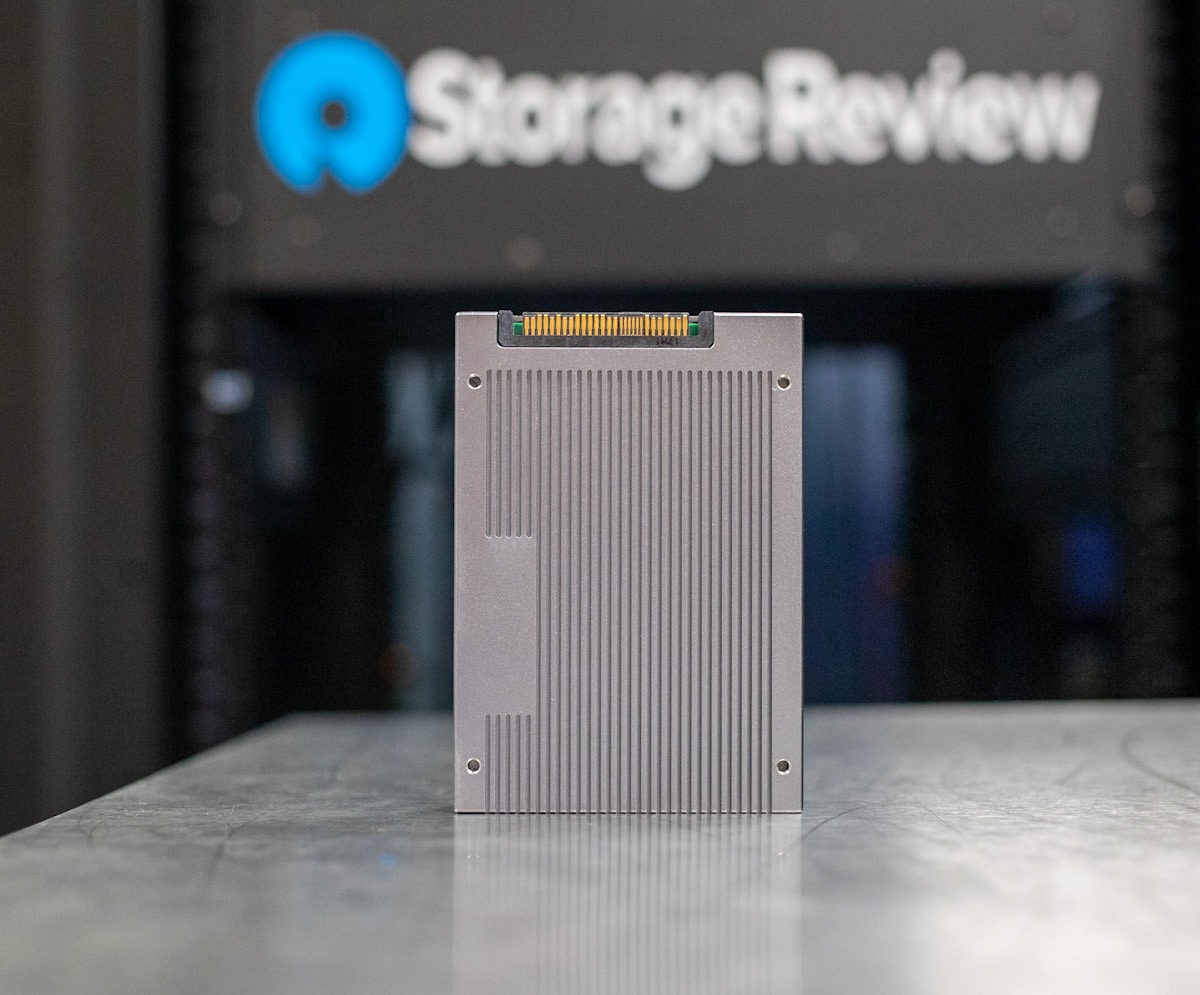
Computational power in the CSD 3000 comes from the SFX 3000 Storage Processor, a custom SoC ARM chip with dedicated hardware acceleration. This drive is available in the 2.5-inch U.2 form factor in capacities of 3.2TB, 3.84TB, 6.4GB, and 7.68TB. It uses a PCIe Gen4 x4 interface, an improvement over the CSD 2000’s Gen3 interface.
ScaleFlux offers a similar drive, the NSD 3000. It has built-in compression but doesn’t have the capacity multiplier of the CSD 3000.
Key specifications of the CSD 3000 are in the table below.
| Form Factor | 2.5″ U.2 (15mm) |
| Default Capacities | 3.2TB, 3.84TB, 6.4TB, 7.68TB |
| Host Interface | PCIe Gen4 x4 |
| Virtualization | SR-IOV with 15 Virtual Functions |
| Security
|
TCG Opal 2.0 with HW Security Acceleration
|
| Management | NVMe-MI 1.1 over SMBus
|
| Power | <20W Typical, <5W Idle
|
| Reliability | End-to-End Datapath Protection, Power Loss
Protection, LDPC Error Correction, NAND Die RAID |
| Sequential Read | 7.2 GB/s |
| Sequential Write | 4.8 GB/s* |
| Random Read (4kB) | 1450 kIOPS |
| Random Write (4kB) | 380 kIOPS* |
| Sustained 70/30 Random 4kB Read/Write with 2:1 Compressible Data | 1020 kIOPS |
ScaleFlux CSD 3000 Testing Background and Comparables
The StorageReview Enterprise Test Lab provides a flexible architecture for conducting benchmarks of enterprise storage devices in an environment comparable to what administrators encounter in real deployments. The Enterprise Test Lab incorporates a variety of servers, networking, power conditioning, and other network infrastructure that allows our staff to establish real-world conditions to accurately gauge performance during our reviews.
We incorporate these details about the lab environment and protocols into reviews so that IT professionals and those responsible for storage acquisition can understand the conditions under which we have achieved the following results.
ScaleFlux CSD 3000 Testbed
We used a different system from our regular testbed to review the CSD 3000. With the drive as unique as this is and the different test platform leveraged, we won’t be comparing it head-to-head against traditional Gen4 NVMe SSDs. This review leverages our Intel OEM Scalable Gen3 Server, which is well-equipped with dual Intel 8380 processors, offering CPU power well over what’s needed to stress high-performance local storage. Its high-level specifications include the following:
- 2 x Intel Scalable Gen3 8380
- 32 x 32GB DDR4 3200MHz
- Ubuntu 20.04.2 Live Server (Synthetic workloads)
- VMware ESXi 7.0u2 (Application workloads)
- 8 x PCI Gen4 U.2 NVMe Bays
To measure the performance of the ScaleFlux CSD 3000, we leverage VDbench, which can have the level it can be compressed adjusted before each workload. Usually, this setting is kept to 0% by default, but we ramped it to 50% for a 2:1 compression factor when testing this SSD. These two runs are reflected in the charts below.
ScaleFlux CSD 3000 Performance
Note: After we reviewed the ScaleFlux CSD 3000, we have been given two newer models with production firmware. We’ve updated the review with the latest results from these two capacity points.
VDBench Workload Analysis
Regarding benchmarking storage devices, application testing is best, and synthetic testing comes in second place. While not a perfect representation of actual workloads, synthetic tests help baseline storage devices with a repeatability factor that makes it easy to compare competing solutions.
These workloads offer a range of different testing profiles ranging from “four corners” tests, and common database transfer size tests to trace captures from different VDI environments. These tests leverage the common vdBench workload generator, with a scripting engine to automate and capture results over a large compute testing cluster. This allows us to repeat the same workloads across a wide range of storage devices, including flash arrays and individual storage devices.
Our testing process for these benchmarks fills the entire drive surface with data, then partitions a drive section equal to 25% of the drive capacity to simulate how the drive might respond to application workloads. This differs from complete entropy tests, which use 100% of the drive and takes them into a steady state. As a result, these figures will reflect higher-sustained write speeds.
Profiles:
- 4K Random Read: 100% Read, 128 threads, 0-120% iorate
- 4K Random Write: 100% Write, 64 threads, 0-120% iorate
- 64K Sequential Read: 100% Read, 16 threads, 0-120% iorate
- 64K Sequential Write: 100% Write, 8 threads, 0-120% iorate
- Synthetic Database: SQL and Oracle
- VDI Full Clone and Linked Clone Traces
This drive’s uniqueness means we will only be comparing it to itself. For comparison, we will look at the ScaleFlux CSD 3000 with VDBench sending incompressible data and 2:1 compressible data.
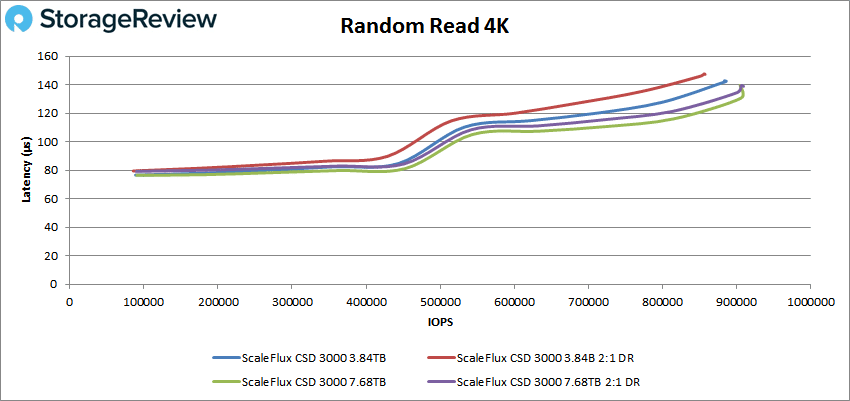
In our first benchmark, 4K random read, the CSD 3000’s compressed performance steadily climbed to 909K IOPS with 139µs latency for the 7.68TB model (the 3.85TB model was a bit back from the others). The drive was slightly slower without compression and the same capacity, topping out at 886K IOPS at 142.4µs .
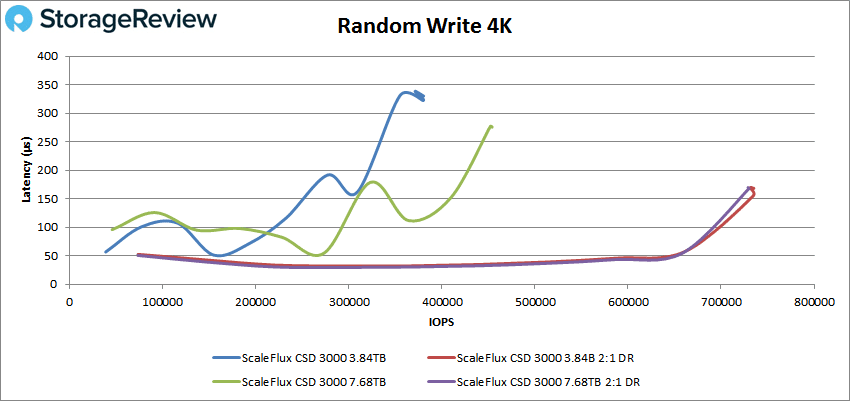
 The uncompressed CSD 3000 showed a rollercoaster-like curve in our next test, 4K random write, with the 7.68TB model showing the best results of the two: peaking at 454K IOPS with 275.7µs latency. The compressed drive showed much better results both ending around 735K IOPS and 168.2 µs.
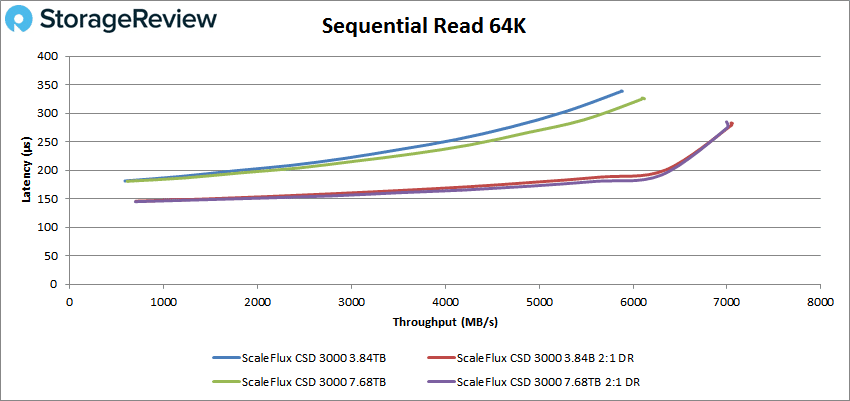
Moving on to sequential 64K tests, we start with read performance, which tells a similar story (the compressed drives again having impressive numbers). Both capacities had virtually identical performance, with the 3.84TB model slightly edging out the higher capacity 113K IOPS (or 7.06GB/s) at 282µs. The top uncompressed drive (7.68TB) reached 98K IOPS at 326.8µs.
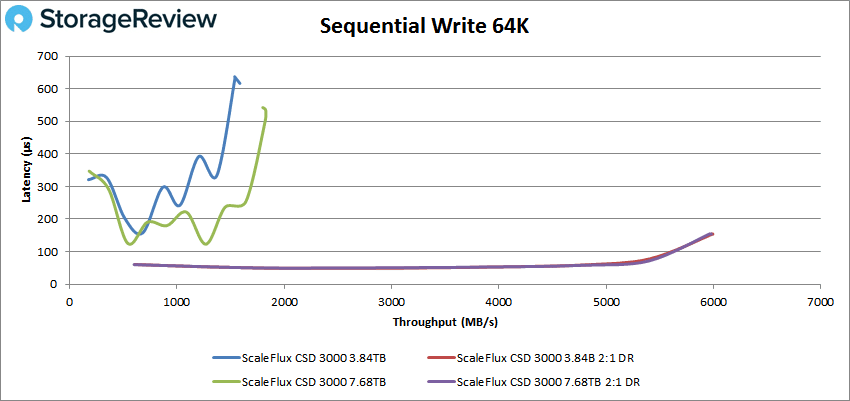
The 64K sequential write, results were in even more favor with the compressed versions. Both capacities again had identical performance (though as you can see, the 3.84TB just ever-so-slightly outperformed the larger capacity with 96K IOPS at 154µs latency, staying well below 100µs until it approached 90K IOPS. On the contrary, the uncompressed drive saw severe spikes, finishing at 29K IOPS at 534µs for the 7,68TB capacity and 25K IOPS at 616.6µs for the 3.85TB capacity.
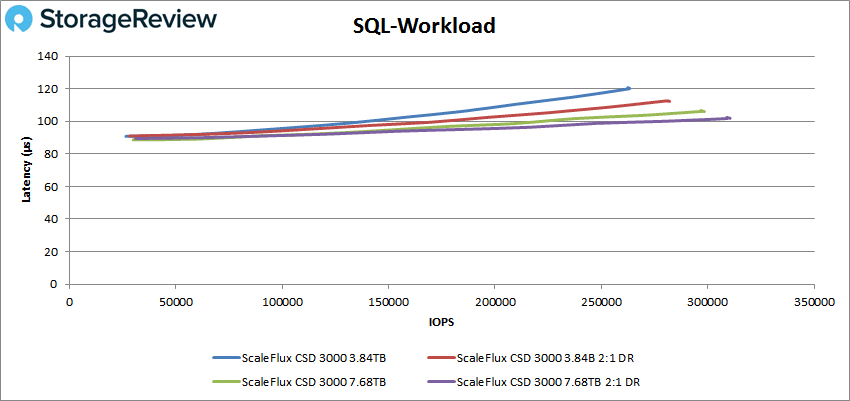
Our next set of tests is our SQL workloads: SQL, SQL 90-10, and SQL 80-20. The SQL workload test is first; the CSD 3000 shows a similar curve when compressed and uncompressed with the high-capacity models, though the compressed version was slightly better with 310K IOPS with a latency of 101.9µs.
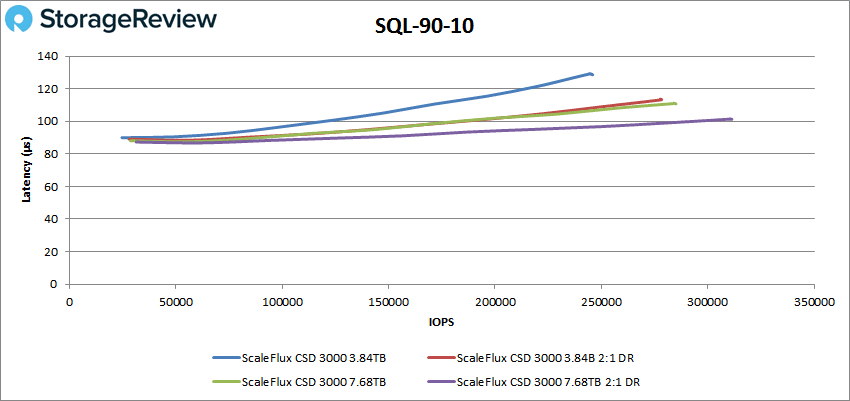
 With SQL 90-10, the 7.68TB compressed CSD 3000 was the best performing drive once again, completing the test at 311K IOPS and a latency of 101.3 µs. By comparison, the best uncompressed drive (also 7.68TB) finished at 285K IOPS and 110.8µs in latency.
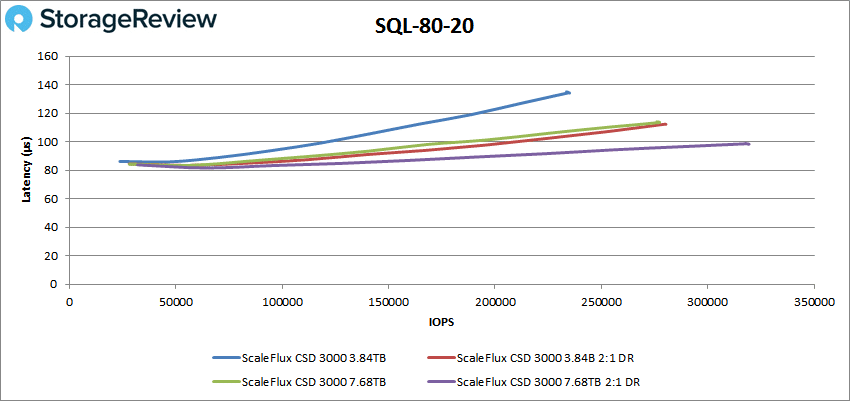
In SQL 80-20, we see the both capacities of compressed CSD 3000 taking top spots, with the 7.68TB model ending at 319 IOPS at 98.3µs latency. The 7.68TB uncompressed was noticeably behind (though very close to the small capacity model) with 277K IOPS at 113.5µs.
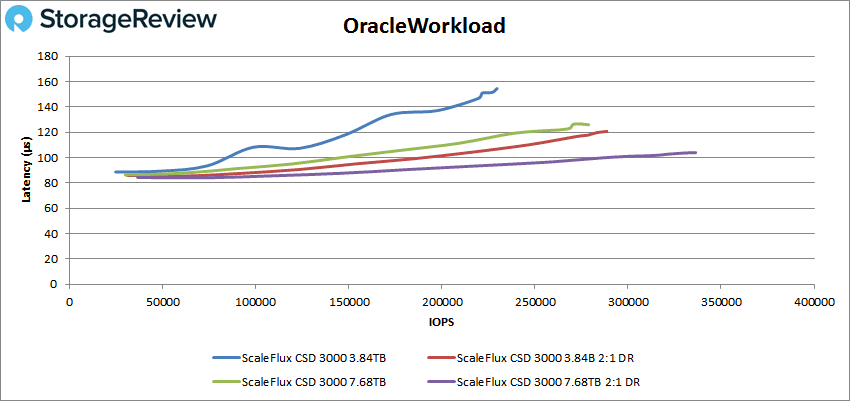
Next are our Oracle workloads: Oracle, Oracle 90-10, and Oracle 80-20. Here, the compressed CSD 3000 drives continued their overall superior performance. Starting with the Oracle workload test, the best showing was 7.68TB compress drive with 336K IOPS with a latency of 103.9 µs. The compressed 7.68TB drive was well back, peaking at 279K IOPS with 126µs latency.
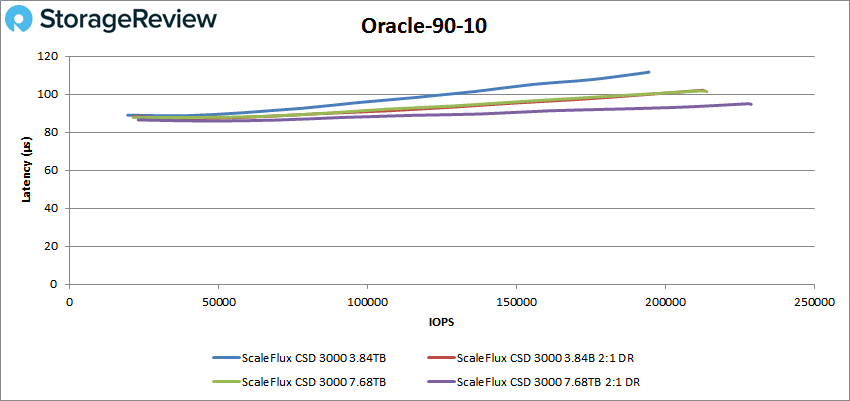
 In Oracle 90-10; the compressed 7.86TB drive finished at 229K IOPS at a 94.7µs latency. The 3.84TB (compressed) and 7.68TB (uncompressed) drives showed identical performance, with 214K IOPS at 101.4µs in latency.
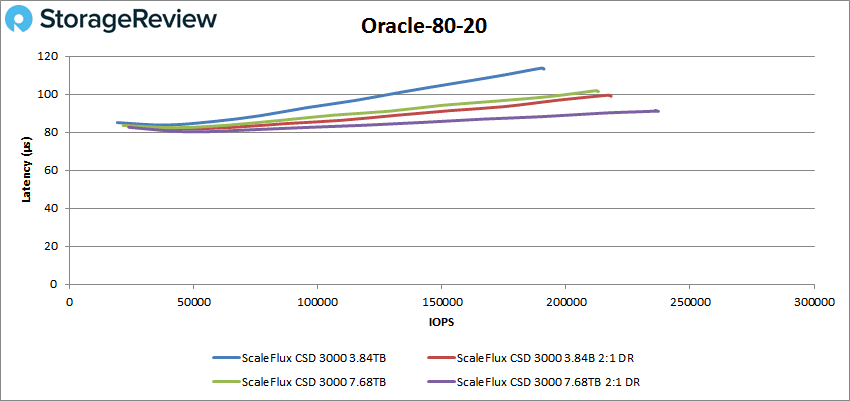
Moving on to Oracle 80-20 told a similar story once again. The uncompressed 7.68TB drive finished at 237K IOPS with a 91µs latency, while the 7.68TB compressed drive was trailed with 213 IOPS at a latency of just 101.9µs.
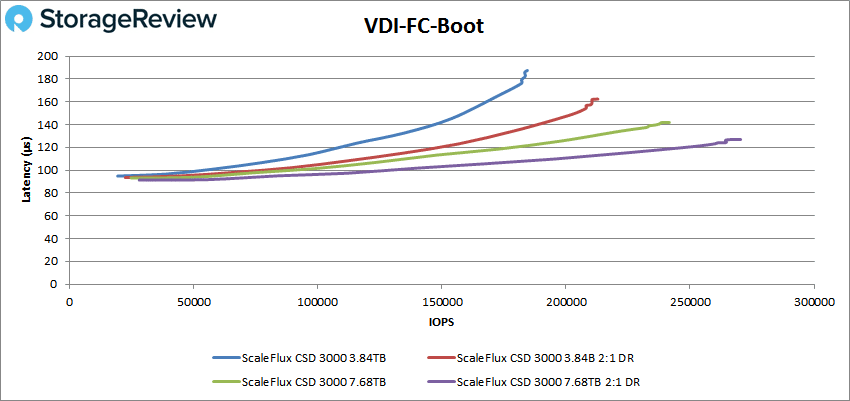
Next, we switched to our VDI clone tests, Full Clone (FC) and Linked Clone (LC). All drives showed minor tail-end instability in VDI FC Boot. Compressed, the 7.68TB CSD 3000 finished at on top again with 270K IOPS with a 126.9µs latency; compressed, its top performer capacity of the 7.68TB drive again (which actually surpassed the 3.84TB compressed drive) with 242K IOPS at a latency of 141.9µs.
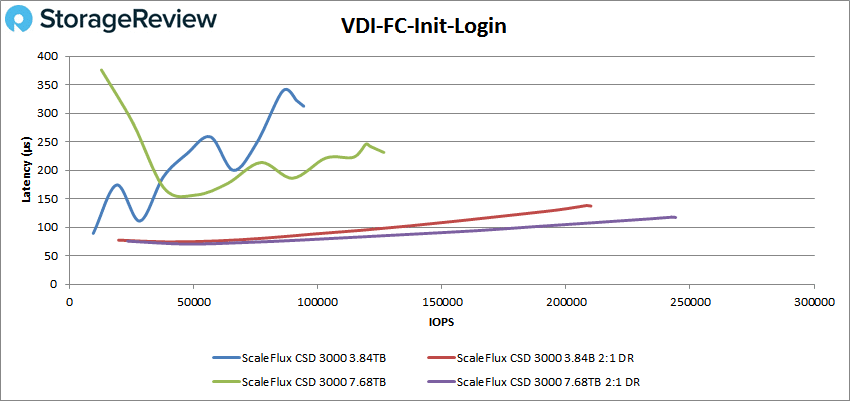
 VDI FC Initial Login tells a different story, as the compressed drives were far and beyond better while the uncompressed drives were all over the place. The 7.68TB compressed drive peaked at 244K IOPS with 117.2µs latency, while the 3.84TB model peaked at 210K IOPS at 137.2µs in latency. The uncompressed drives finished at 127K IOPS with a latency of 231.1µs (7.68TB) and 94K IOPS with a latency of 312.4µs (3.84TB).
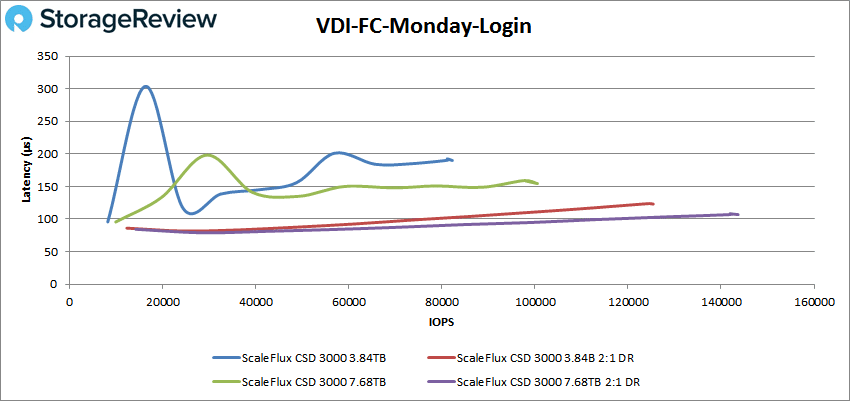
The compressed CSD 3000 continued to impress in our last FC test, Monday Login, where its best number was 144K IOPS with a 106.9µs latency (7.68TB). The uncompressed 7.68TB drive showed 100K IOPS with a latency of 154.6µs.
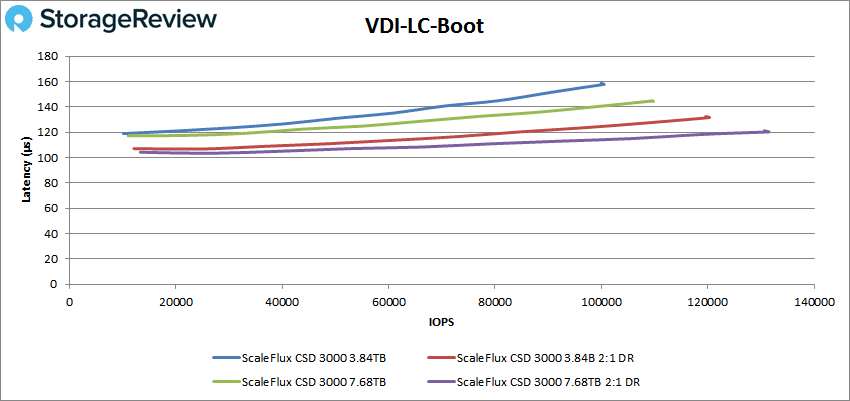
We’ll now switch over to the LC tests, where all drives showed stable lines in the Boot test. The compressed drives continued its dominance (especially the 7.68TB, which posted 131K IOPS and a latency of 120.1µs). The top uncompressed drive (7.68TB) was able to reach 110 IOPS at 144.4µs.
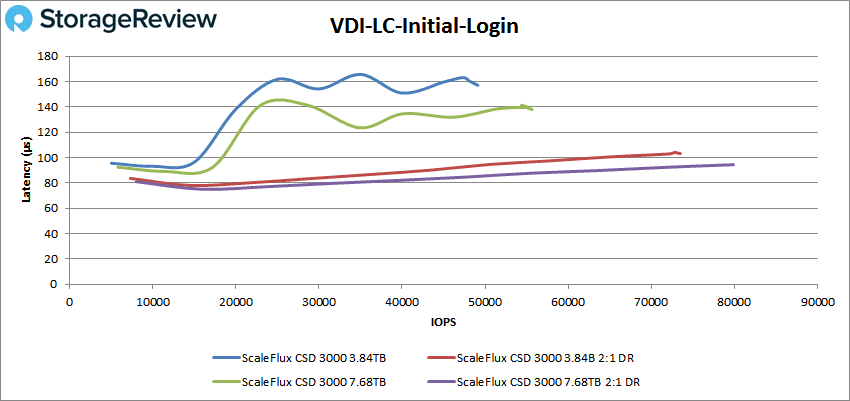
 We see unstable behavior from the uncompressed drives in LC Initial Login was it approaches 20,000 IOPS; its final number was 49K IOPS/157.1µs (3.84TB) and 56K IOPS/138µs (7.68TB). As always, the compressed drives showed better performance and stability, completing the test at 73K IOPS/103.1µs (3.84TB) and 80K IOPS/94.4µs (7.68TB).
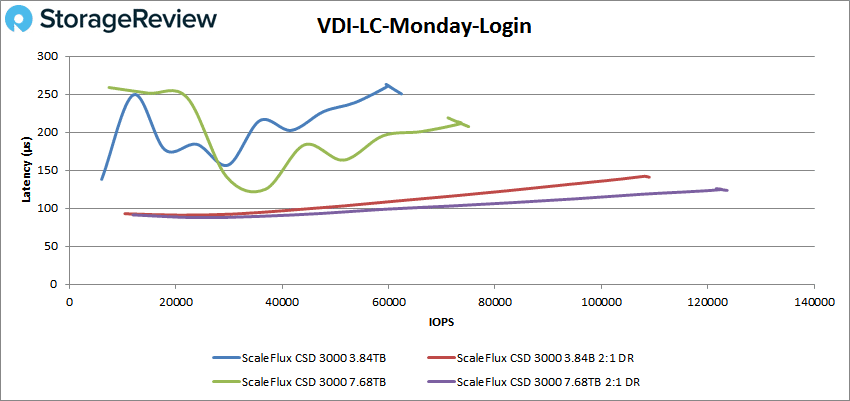
In our very last test, the uncompressed drives still find themselves underperforming compared to the compressed versions. In LC Monday Login, which again showed some odd latency spikes for the compressed drives, the 3.84TB and 7.68TB finished at 62K IOPS/250.1µs and 75K IOPS/207.5µs, respectively. The compressed drive’s final number were much better at 109K IOPS/140.9µs (3.84TB) and 124K IOPS/123.5µs (7.68TB).
Conclusion
ScaleFlux continues to focus on computational storage. The CSD 3000 drive we looked at in this review improves on the earlier CSD 2000 mainly by offering a PCIe Gen4 interface, which gives it much higher performance potential.
We tested the CSD 3000 under Linux in our Intel OEM Gen3 scalable server in an uncompressed state and again in a 2:1 compressed state to take advantage of the drive’s onboard compression engines. The drive showed superior performance and lower latency across all tests using compressible data, often with double-digit performance deltas.
Performance highlights (top results/capacity) with compressed data include 909K IOPS in 4K random read for the 7.68TB (versus 886K IOPS uncompressed), 735K IOPS in 4K random write for the 7.68TB (454K IOPS uncompressed), 7.06GB/s in 64K sequential read for the 3.85TB (6.12GB/s uncompressed), and 6GB/s in 64K sequential write (1.82GB/s uncompressed).
The CSD 3000 showed similar compressed and uncompressed numbers in our SQL and Oracle tests, though the compressed drive was more consistent. In one example, SQL 80-20, the compressed drive achieved 319 IOPS at 98.3µs latency (7.68TB model) while the uncompressed model was noticeably behind with 277K IOPS at 113.5µs
Finally, our VDI Full and Linked clone tests saw the most noticeable differences between the CSD 3000 running compressed versus uncompressed data – that is, the compressed data performed much better and more consistently. To pick one example, VDI LC Initial Login showed the uncompressed drives with peak performance of 49K IOPS/157.1µs (3.84TB) and 56K IOPS/138µs (7.68TB) while the compressed drives showed completed the test at 73K IOPS/103.1µs (3.84TB) and 80K IOPS/94.4µs (7.68TB).
On a cautionary note, we did see some unexplained latency spikes and reduced performance while running uncompressed data. This occurred across our 4K/64K, SQL/Oracle, and VDI FC/LC testing, so it wasn’t just isolated to one scenario.
The CSD3000’s strengths will be best shown when it can work with some compressible data, as that’s where it will have the most significant advantages overall over traditional SSDs. ScaleFlux has also added VMWare support with this version, which it didn’t have when we reviewed the earlier CSD 2000. That’s a big plus, but it’s still missing support for Windows virtualization. Nonetheless, ScaleFlux’s CSD 3000 is worth considering if you can line up your workloads with platform support and the drive’s substantial compression strengths.


 Amazon