

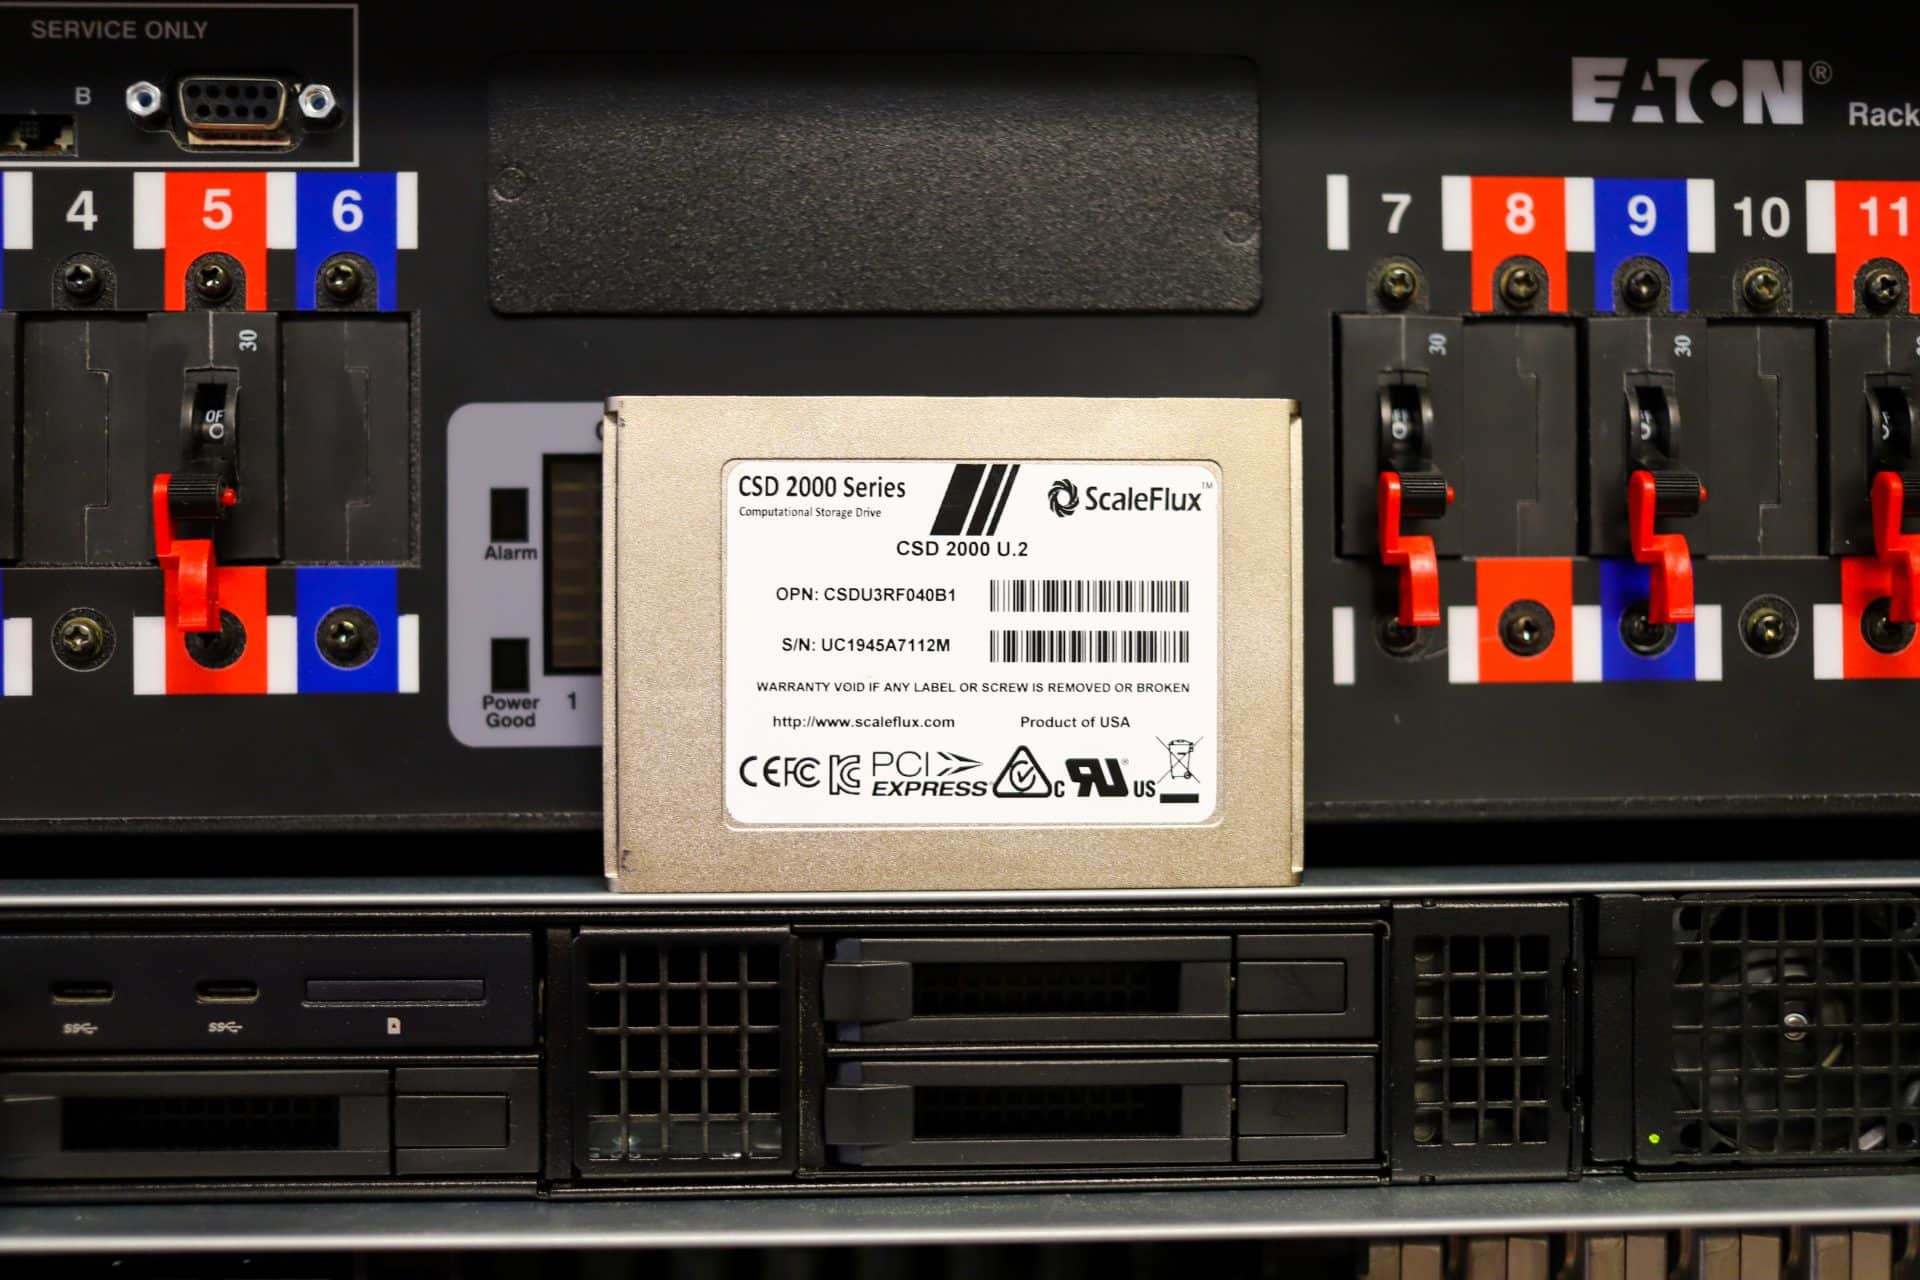
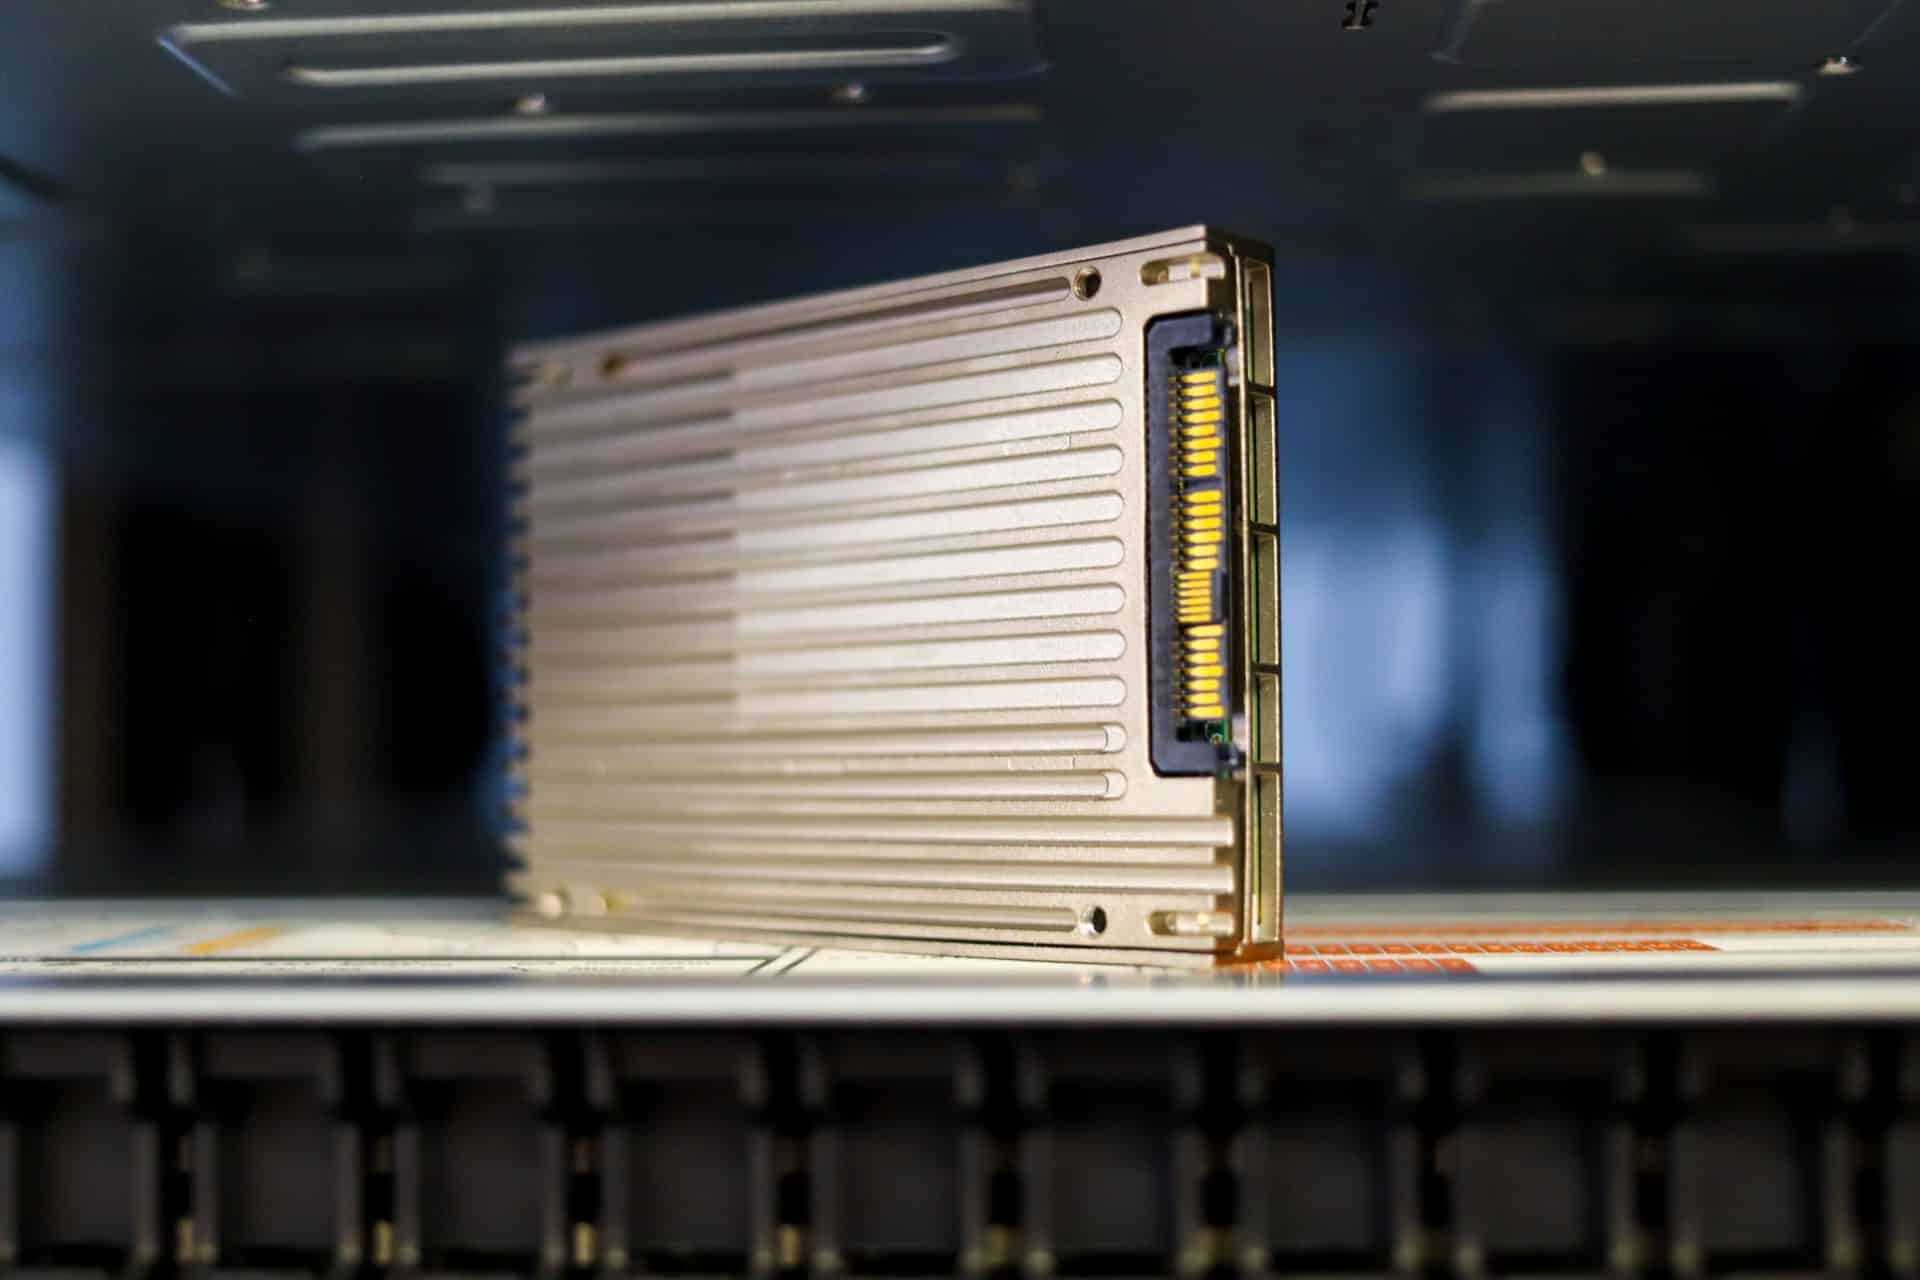
ScaleFlux is a company that is solely focused on computational storage, more specifically computational storage at scale. The company is primarily doing this with its ScaleFlux Computational Storage Drives (CSD). As you may have guessed by their name, the CSD is an NVMe SSD integrated with compute engines that can improve drive and system performance. But computational storage means a lot of different things, depending on who you’re talking to. In this review, we get a taste of ScaleFlux’s perspective, with the ScaleFlux CSD 2000.
What Is Computational Storage?
We’ve actually been writing about computational storage for several years here at StorageReview. In a nutshell, computational storage is taking compute resources (that are not the system’s compute and/or memory architecture) and placing them within the storage itself.
Sometimes these compute resources are placed between the host and storage as well. This can reduce data movement, take the strain off the systems compute resources, and potentially increase performance or at least performance consistency. There are many vendors participating in computational storage though, so it’s important to understand that the term “computational storage” can mean very different things, depending on the product.
ScaleFlux CSD 2000 and Computational Storage
ScaleFlux CSD sets itself apart by introducing data path compression/ decompression engines. According to the company, this can effectively quadruple capacity and double performance. Of course, this assumes the data is compressible, something fundamental for this platform to work well. Assuming the conditions are right, the effective capacity becomes a strong selling point.
There’s also a cost and density argument to be made. By compressing data, and netting more effective capacity, ScaleFlux figures organizations can save up to 50% on the cost of flash. They can also offer “more” flash in the same slot thanks to compression.
Cost and efficiency mean little without performance, which ScaleFlux claims can be doubled over traditional SSDs? The drive comes in both a Data Center and Data Scale version but let’s look at top numbers here. The top number with a 1:1 data compression is 750K IOPS in 4K read and 490K IOPS in 4K write for a 2:1 data compression. For sequential speeds, the drive is quoted to hit 3GB/s in either compression and up to 2.3GB/s write in 1:1 compression.
A few other differences with the CSD are that it has tunable FTL/FM that allows users to optimize performance and price per GB. Running high performance can lead to power and temperature issues, though these can be throttled to avoid overheating. Data protection seems to always be in the news anymore, and on that end, the CSD claims end-to-end data protection and ECC on all internal memories in the data path as well as power loss protection.
To get in on this CSD action with ScaleFlux, there are a couple of drawbacks. One is that the drive we’re reviewing is Gen 3, at a time when traditional SSDs have migrated to PCIe Gen 4. This is a solvable problem. Another hit is the currently, driver support is limited to Linux. Windows and VMware are out. Localized virtualization would be an interesting use case and ripe for data-reduction benefits. Hopefully, more broad-based support is to come.
ScaleFlux CSD 2000 Key Specifications
| Form Factors | PCIe AIC & 2.5” U.2 |
| Interface | PCIe Gen3 x4 Low latency block storage device |
| NAND Media | 3D TLC & 3D QLC |
| Power Loss Protection | Yes |
| Data Protection |
|
| Power |
|
| Operating Temperature | 50°C @ 200LFM (AIC) 35°C @ 200LFM (U.2) |
| Temperature Protection | Thermal Throttling Enabled |
| MTTF | 2 Million Hours |
| Compute Capability |
|
| Software Compatibility | Linux OS 2.6 Kernel or later Only
|
Compression with ScaleFlux
Out of the gate, we wanted to get a handle on how compression is implemented. To get started in Linux, you need to load their custom driver to view and interact with the drive, which is a branch of the common nvme-cli toolset. This allows you to view the drive as is, format it, as well as interact and/or modify the usable capacity based on the current dataset. Below is a quick example of the output before and after our workload testing. The first command of “sfx-nvme list” shows the installed drive.
root@storagereview:~# sfx-nvme list
Node SN Model Namespace Usage Format FW Rev BUS:slot:func
/dev/sfdv0n1 UC1945A7112M CSDU3RF040B1 1 3.20 TB / 3.20 TB 512 B + 0 B 4870 0000:d8:00.0
After our first round of benchmarks with fully imcompressible data (our normal working dataset) we see the drive showing a 1.00 compression ratio.
root@storagereview:~# cat /sys/block/sfdv*/sfx_smart_features/sfx_capacity_stat
free_space physical_size logical_size comp_ratio provisioned_cap space_flag
2736 6251231232 6251231312 1.00 6251233968 0
Next, we switched the vdbench compression level to 4x, allowing the drive to work some of its magic behind the scenes. After that completed and we queried the SSD again, we see the increased size and the 4.10 compression ratio. So the good news, is that with this basic shakeout, the drives does what it claims to do, in terms of compression functionality.
root@storagereview:~# cat /sys/block/sfdv*/sfx_smart_features/sfx_capacity_stat
free_space physical_size logical_size comp_ratio provisioned_cap space_flag
4728607824 1522626144 6251231312 4.10 6251233968 0
ScaleFlux CSD 2000 Performance
VDBench Workload Analysis
When it comes to benchmarking storage devices, application testing is best, and synthetic testing comes in second place. While not a perfect representation of actual workloads, synthetic tests do help to baseline storage devices with a repeatability factor that makes it easy to do apples-to-apples comparisons between competing solutions.
These workloads offer a range of different testing profiles ranging from “four corners” tests, common database transfer size tests, to trace captures from different VDI environments. All of these tests leverage the common vdBench workload generator, with a scripting engine to automate and capture results over a large compute testing cluster. This allows us to repeat the same workloads across a wide range of storage devices, including flash arrays and individual storage devices.
Our testing process for these benchmarks fills the entire drive surface with data, then partitions a drive section equal to 25% of the drive capacity to simulate how the drive might respond to application workloads. This is different than full entropy tests, which use 100% of the drive and takes them into a steady state. As a result, these figures will reflect higher-sustained write speeds.
Profiles:
- 4K Random Read: 100% Read, 128 threads, 0-120% iorate
- 4K Random Write: 100% Write, 64 threads, 0-120% iorate
- 64K Sequential Read: 100% Read, 16 threads, 0-120% iorate
- 64K Sequential Write: 100% Write, 8 threads, 0-120% iorate
- Synthetic Database: SQL and Oracle
- VDI Full Clone and Linked Clone Traces
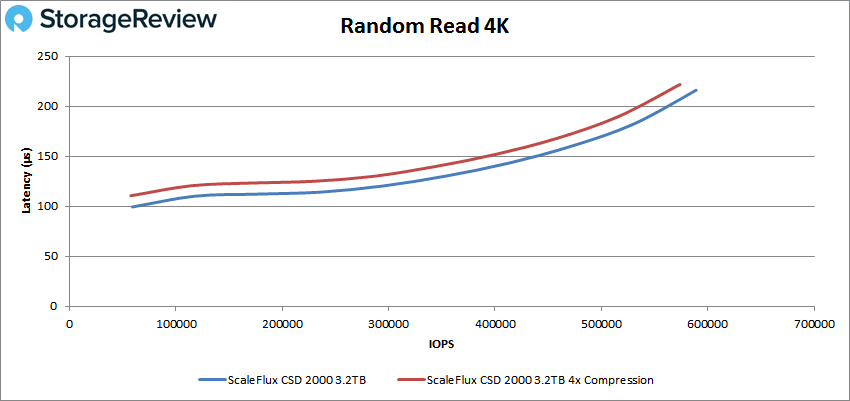
For comparison, we will be looking at the ScaleFlux SSD with VDBench sending incompressible data and 4x compressible data. In random 4K, the incompressible CSD started under 100µs and peaked at 588,893 IOPS with a latency of 216µs. With compression, the drive was only a bit slower with a peak of 573,460 IOPS at a latency of 222µs.
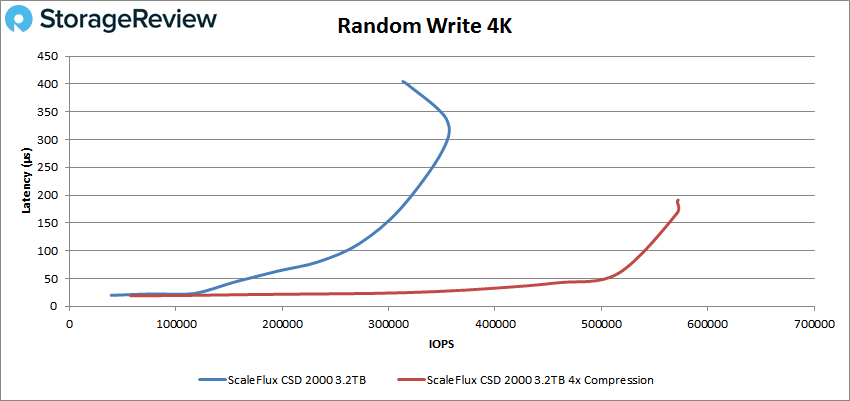
4K random write saw the incompressible drive peak at about 355K IOPS at roughly 325µs before dropping off some. With compression, the drive stayed below 100µs for the most part with a peak of about 572K IOPS with 168µs for latency.
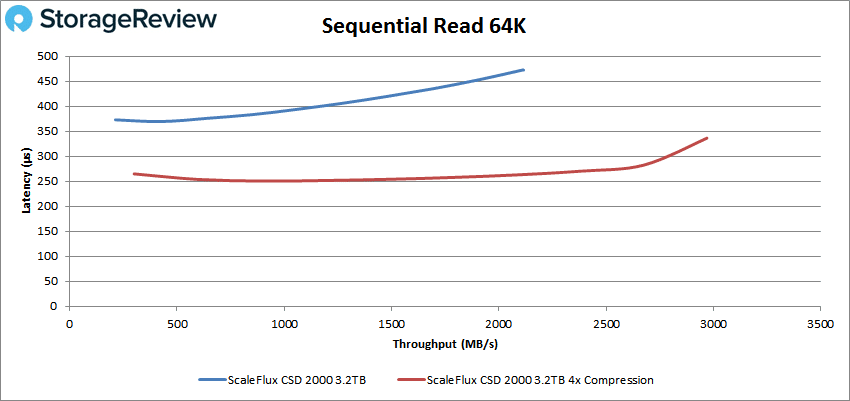
Switching over to 64K sequential workloads, for read the incompressible drive hit a peak of 33,785 IOPS or 2.11GB/s at a latency of 473µs. With compression, we saw the drive hit 47,489 IOPS or 2.97GB/s at a lower latency of 336µs.
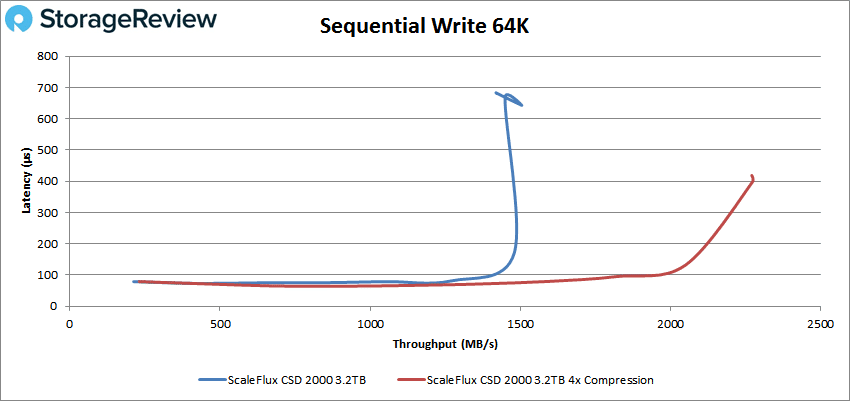
In 64K write both configs ran under 100µs for a big chunk of the test. The incompressible config peaked at 24,074 IOPS or 1.5GB/s at a latency of 643µs. With 4x compression, we saw a peak of 36,364 IOPS or 2.27GB/s at a latency of 397µs.
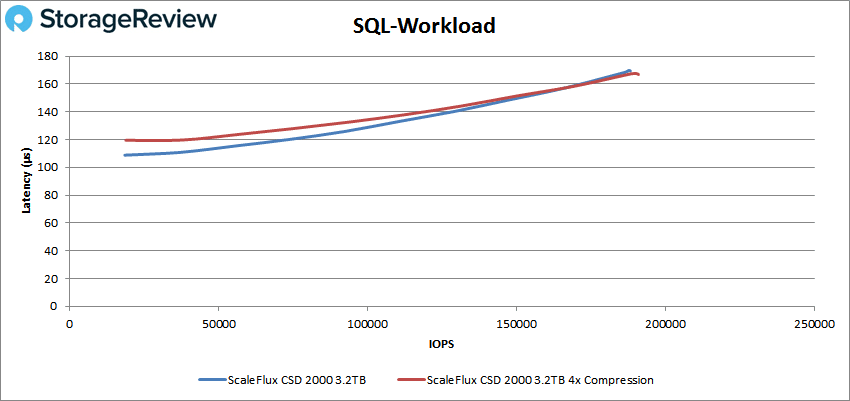
Our next set of tests are our SQL workloads: SQL, SQL 90-10, and SQL 80-20. Starting with SQL, both data configs were very similar. The incompressible peaked at 188,269 IOPS and 167µs for latency while the compressed data going to the drive peaked at 190,370 IOPS with a latency of also 167µs.
In SQL 90-10 the incompressible ScaleFlux CSD 2000 hit a peak of 185,310 IOPS with a latency of 172µs. With 4x compression going to the drive, it hit a peak of 220,615 IOPS and a latency of 144µs.
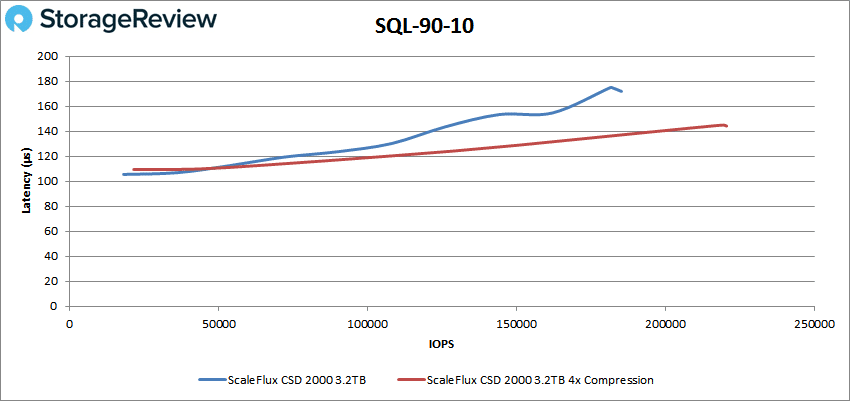
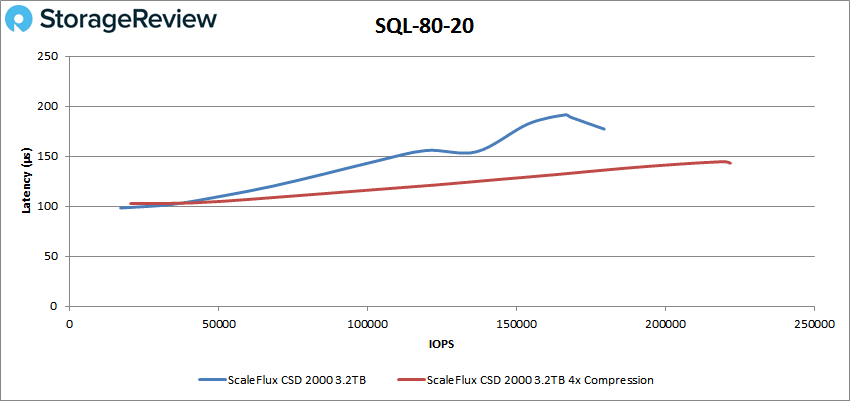
SQL 80-20 had the incompressible drive peak at 179,482 IOPS with a latency of 177µs. Looking at compression going to the CSD, we saw a peak of 221,851 IOPS at a latency of 143µs.
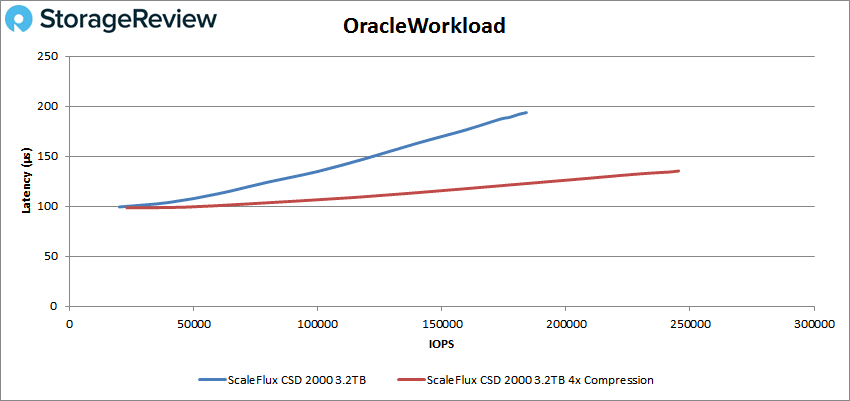
Next up are our Oracle workloads: Oracle, Oracle 90-10, and Oracle 80-20. Starting with Oracle, the incompressible peaked at 184,048 IOPS and a latency of 194µs. Looking at the drive with compression going to it we saw a peak of 245,385 IOPS and a latency of 135µs.
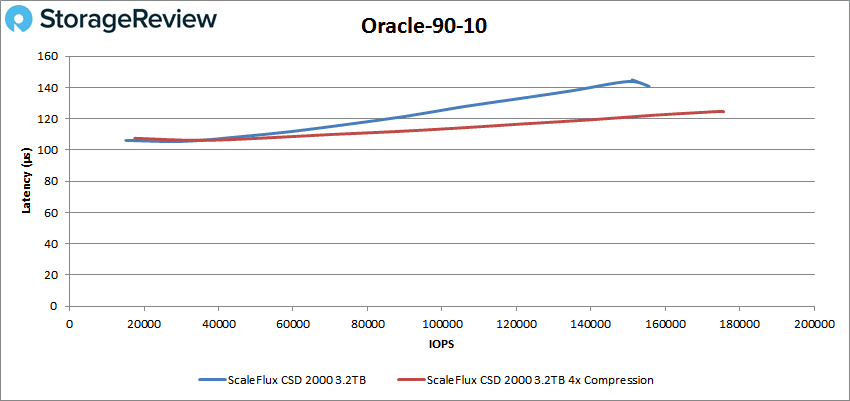
Oracle 90-10 had both start off near the same in performance and latency. The incompressible version peaked at 155,641 IOPS at a latency of 141µs. With the compression version hitting a peak of 175,681 IOPS with a latency of 125µs.
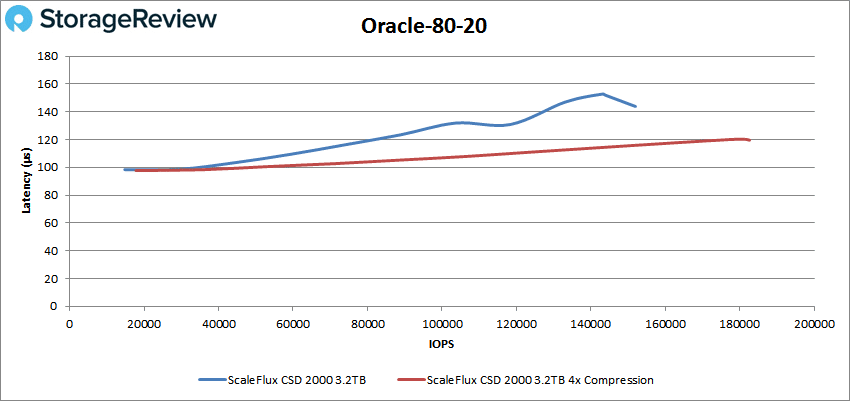
Oracle 80-20 booth drive configurations started off under 100µs. With incompressible data, the peak was 151,983 IOPS at 144µs for latency. With compressed data, we saw a peak performance of 182,640 IOPs with a latency of 120µs.
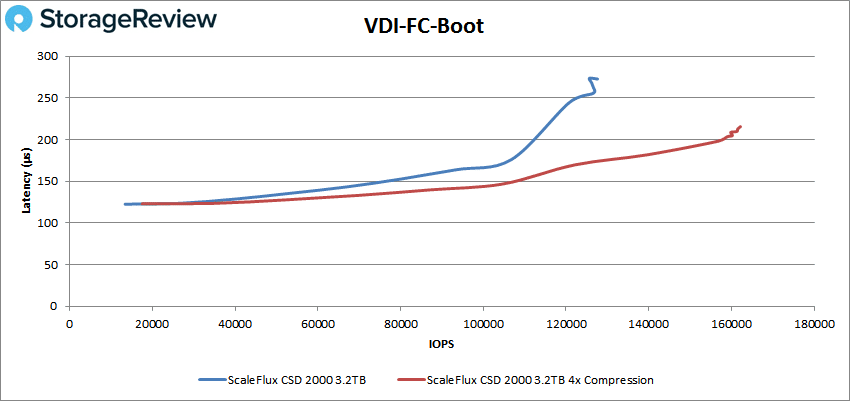
Next, we switched over to our VDI clone test, Full and Linked. For VDI Full Clone (FC) Boot, the ScaleFlux CSD 2000 without incompressible data the drive hit a peak of 127,616 IOPS at a latency of 263µs. Sending the 4x compression bumped performance up to 161,543 IOPS with 216µs for latency.
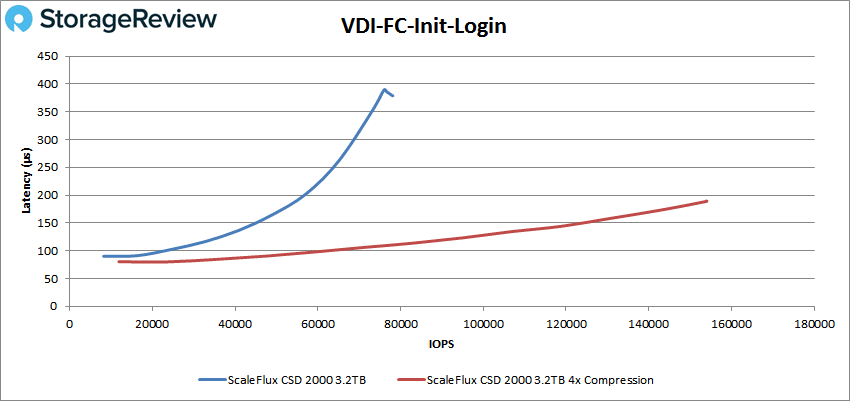
VDI FC Initial Login gave us peaks of 78,125 IOPS at 379µs with incompressible data and 154,077 IOPS at 189µs with compressed data.
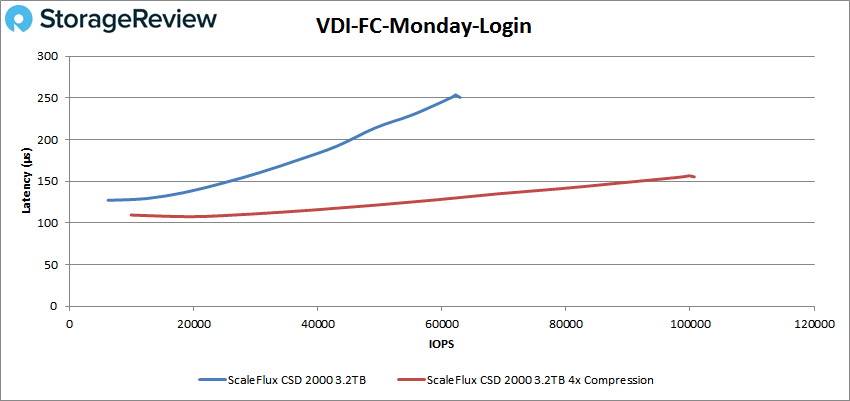
For VDI FC Monday the incompressible drive peaked at 62,922 IOPS with a latency of 251µs. With 4x compression, there was a much higher peak at 100,680 IOPS with a latency of only 156µs.
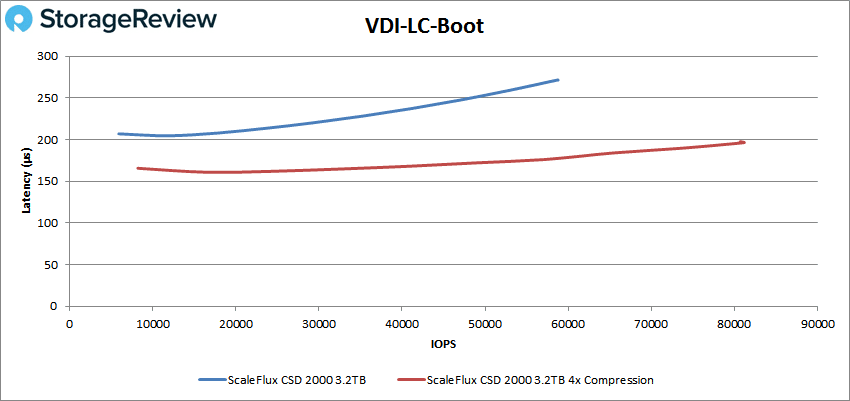
For VDI Linked Clone (LC) Boot, the incompressible data to drive hit a peak of 58,705 IOPS with latency being 271µs. When we sent 4x compression to the drive it peaked at 81,137 IOPPS and latency of 196µs.
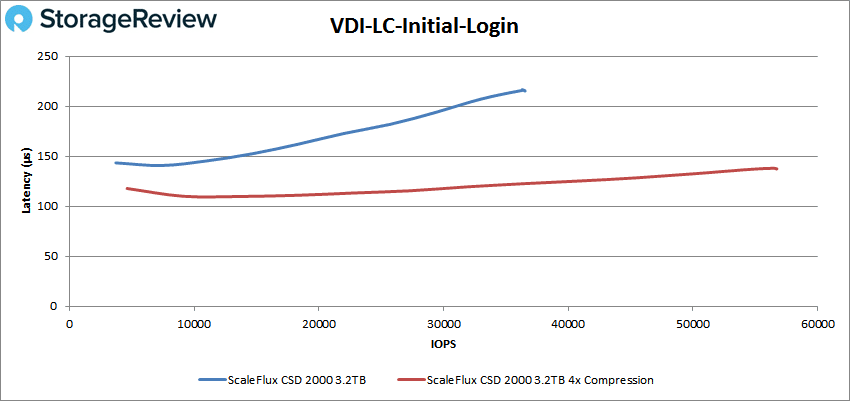
VDI LC Initial Login had the drive with incompressible data hitting peak performance of 36,537 IOPS at a latency of 215µs. When the 4x compressed data hit the drive it peaked at 56,739 IOPS and a latency of 137µs.
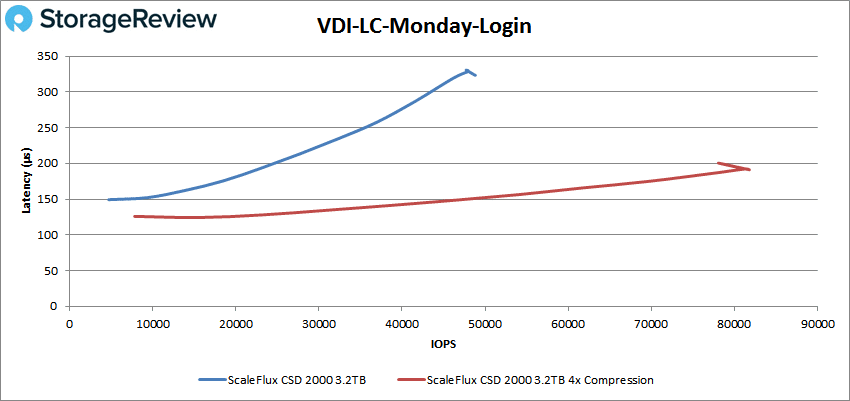
Finally, with VDI LC Monday Login the incompressible drive hit a peak of 48,814 IOPS at a latency of 323µs. With compression, the SSD hit a peak of 81,799 IOPS with a latency of 192µs.
Conclusion
ScaleFlux solely focuses on computational storage. This is done primarily through its SSDs, known as ScaleFlux Computational Storage Drives (CSD). These are PCIe Gen3 SSDs with compute engines to improve performance and data efficiencies. The company has a handful of different drives but for this review, we looked at the ScaleFlux CSD 2000.
The main differentiator between the ScaleFlux drive and other computational storage is the data path compression/ decompression engine. ScaleFlux claims a quadrupling of capacity while doubling performance, thanks to their computational tech. Not only does this hit a performance angle, but it could also lower the cost per TB of SSD storage given the storage efficiencies when data is highly compressible.
The primary concern then is does the compression engine work? That was an easy yes, as we manipulated compression in our testing right out of the gate. We started out with entirely incompressible data and as expected, saw a ratio from the drive of 1:1. Switching to a 4X compression ratio, netted us a 4.1:1 compression rate on the drive. The critical first step was met with a checkmark before looking at performance.
First, let’s look at the drive without incompressible data being sent to it. Highlights include 589K IOPS in 4K read, 355K IOPS in 4K write, 2.11GB/s in 64K read, and 1.5GB/s in 64K write. In SQL we saw peaks of 188K IOPS, 185K IOPS in SQL 90-10, and 179K IOPS in SQL 80-20. For our Oracle workloads, we saw peaks of 184K IOPS, 156K IOPS in Oracle 90-10, and 152K IOPS in Oracle 80-20. With our VDI Clone tests the CSD 2000 without compression gave us 128K IOPS in boot, 78K IOPS in Initial Login, and 63K IOPS in Monday Login for Full Clone. For Linked Clone, the drive gave us 59K IOPS in boot, 37K IOPS in Initial Login, and 49K IOPS in Monday Login.
Once we sent 4X compressed data, we were pleasantly surprised to see the performance jump in every test except 4K read, where it wasn’t that far apart. Highlights include 573K IOPS in 4K read, 572K IOPS in 4K write, 2.97GB/s in 64K read, and 2.27GB/s in 64K write. In SQL we saw peaks of 190K IOPS, 221K IOPS in SQL 90-10, and 222K IOPS in SQL 80-20. For Oracle, we saw peaks of 245K IOPS, 176K IOPS in Oracle 90-10, and 183K IOPS in Oracle 80-20. With our VDI Clone tests the ScaleFlux with compression gave us 162K IOPS in boot, 154K IOPS in Initial Login, and 101K IOPS in Monday Login for Full Clone. For Linked Clone, the drive gave us 81K IOPS in boot, 57K IOPS in Initial Login, and 82K IOPS in Monday Login.
The ScaleFlux CSD 2000 is really an interesting product and points to a potential shakeup in the traditional SSD space as computational storage gains its legs. CSD has been around for many years now, so the concept isn’t new. What’s likely lacking is execution. For their part, ScaleFlux is the first of any of the CSD guys to get something in our lab. Confidence on its own though doesn’t carry the day, the drive has to perform.
In this case, performance isn’t just the numbers you see in our charts, though it did just fine there. The proof in this SSD pudding is around its ability to work well against compressible data. It does this exactly as expected in our testing, even delivering a little performance pop in all but one test profile. For this SSD to make sense, the use case just needs alignment. Compressible data will greatly benefit from the ScaleFlux technology, no doubt there. So long as you don’t need VMware or Windows virtualization support right now, the CSD 2000 is definitely worth exploring in a PoC to see just how much your workload can benefit.


 Amazon