

|

Early this summer the firm announced its third-generation unit. “X15-36LP” always struck us as a bit unwieldy. Seagate has fortunately dubbed its latest as the Cheetah 15K.3, intuitive enough especially considering that their latest generation 10,000 RPM unit bears the name Cheetah 10K.6. The 15K.3 doubles the line’s flagship capacity to a respectable 73 gigabytes through the use of 4 18-gig platters. 3.6 millisecond seek times and an 8-megabyte buffer round out the vitals.
The 15K.3 is the first Ultra320 SCSI drive to hit our testbed. Ultra320’s most highly-touted feature, of course, is an increase in the throughput ceiling to 320 MB/sec. Keep in mind that the current transfer rate champion, Seagate’s own X15-36LP, barely tops 60 MB/sec in its outer sectors. While figures like these threaten Ultra2 SCSI’s 80 MB/sec limit, Ultra160’s 160 MB/sec limit maintains plenty of headroom. It is only in multi-drive scenarios that 160 MB/sec limitations arise. Our base drive tests occur with a single unit as the only active device on the host adapter. In such a setup, any performance advantages that Ultra320 (along with the requisite higher-bandwidth 64-bit PCI slots) would deliver over 160 are negligible. For our performance tests, we’re going to take advantage of the specification’s backwards compatibility and run the drive in Ultra160 mode off of our current host adapter. Bear in mind that improved bandwidth is only one of the benefits that Ultra320 delivers. A host of improvements in protocol and error correction should elevate data integrity and device interoperability to new levels.
The 15K.3 incorporates Seagate’s Fluid Dynamic Bearing motors, utilizing liquid rather than ball bearings in its spindle. It’s little known that the X15-36LP also used FDB motors; for one reason or another, Seagate didn’t publicize the feature. Perhaps the company feared that touting the new motor would undermine the reputation of reliability that the Cheetah family as a whole enjoys. In our opinion, usage of FDB motors indicates the reverse: fluid bearings are a mature, time-tested technology that may be integrated into the most demanding enterprise-class products.
 With this generation Seagate is more than ever emphasizing 15K RPM performance per dollar spent. The company points out that a similarly priced 10k RPM drive, while delivering double the capacity, fails to deliver equivalent performance even if the drive is “short stroked” and half the capacity remains unused. Further, they argue, the 15K.3’s doubled capacity over its predecessor halves the costs of supporting infrastructure such as cases, racks, and the rooms needed to store such arrays. Throw in the assertion that a drive’s purchase price represents only 20% of its total cost of ownership and the premium one pays for a batch of these screamers is negligible.
What kind of performance does the 15K.3 deliver? Lets take a look!
Low-Level ResultsFor diagnostic purposes only, StorageReview measures the following low-level parameters: Average Read Access Time– An average of 25,000 random accesses of a single sector each conducted through IPEAK SPT’s AnalyzeDisk suite. The high sample size permits a much more accurate reading than most typical benchmarks deliver and provides an excellent figure with which one may contrast the claimed access time (claimed seek time + the drive spindle speed’s average rotational latency) provided by manufacturers. WB99 Disk/Read Transfer Rate – Begin– The sequential transfer rate attained by the outermost zones in the hard disk. The figure typically represents the highest sustained transfer rate a drive delivers. WB99 Disk/Read Transfer Rate – End– The sequential transfer rate attained by the innermost zones in the hard disk. The figure typically represents the lowest sustained transfer rate a drive delivers. |
For more information, please click here.
|
Note: Scores on top are better. |
|
|||||||||||||||||||||||||||
|
|
||||||||||||||||||||||||||
ST373453LW Average Read Service Time |
ST373453LW Average Write Service Time
|
||||||||||||||||||||||||||
The 15K.3 turns in a measured average access time of 5.9 milliseconds, a figure that ties it with the Cheetah X15-36LP and Fujitsu MAM3367 as the lowest we’ve recorded. Subtracting two milliseconds to account for the rotational latency of a 15K RPM spindle yields a measured average seek time of 3.9 milliseconds, a bit higher than Seagate’s 3.6 ms claim.
Average write access time weighs in at 6.2 ms, edging out the MAM3367 by a tenth of one millisecond as the fastest we’ve measured to date.
|
Note: Scores on top are better. |
|
|||||||||||||||||||||||||||
|
|
||||||||||||||||||||||||||
ST373453LW Transfer Rate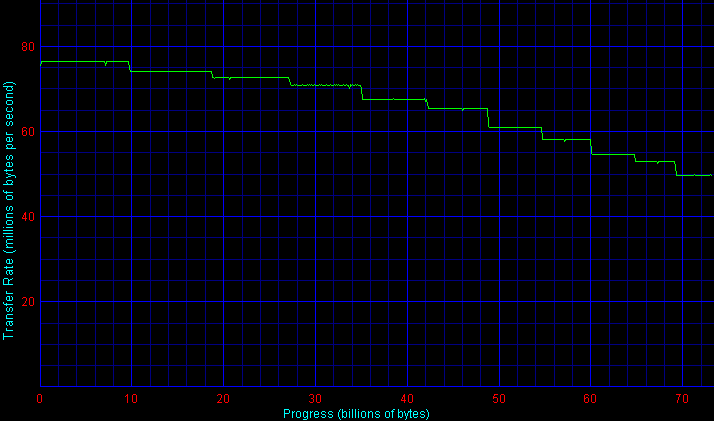
|
|||||||||||||||||||||||||||
State-of-the-art areal density combined with a 15,000 RPM spindle power the 15K.3’s sequential transfer rates to new heights. Outer zone rates shatter the previous record, held by Seagate’s own 2nd-generation 15K RPM unit, by 26% with a score exceeding 76 MB/sec. An inner-zone score of 51.1 MB/sec is also impressive, though it breaks former records by a bit less of a margin.
Single-User PerformanceStorageReview uses the following tests to assess non-server use: StorageReview.com Office DriveMark 2002– A capture of 30 minutes of actual computer productivity use that exactingly recreates a typical office-style multitasking environment. The applications include: Outlook XP, Word XP, Excel XP, PowerPoint XP, Calypso (a freeware e-mail client), SecureCRT v3.3 (a telnet/SSH client), CuteFTP Pro v1.0 (an FTP/SSH client), ICQ 2000b), Palm Hotsync 4.0, Gravity 2.3 (a Usenet/newsgroups client), PaintShop Pro v7.0, Media Player v8 for the occasional MP3, and Internet Explorer 6.0. StorageReview.com High-End DriveMark 2002– A capture of VeriTest’s Content Creation Winstone 2001 suite. Applications include Adobe Photoshop v5.5, Adobe Premiere v5.1, Macromedia Director v8.0, Macromedia Dreamweaver v3.0, Netscape Navigator v4.73, and Sonic Foundry Sound Forge v4.5. Unlike typical productivity applications, high-end audio- and video- editing programs are run in a more serial and less multitasked manner. The High-End DriveMark includes significantly more sequential transfers and write (as opposed to read) operations. |
StorageReview.com Bootup DriveMark 2002– A capture of the rather unusual Windows XP bootup process. Windows XP’s boot procedure involves significantly different access patterns and queue depths than those found in other disk accesses. This test recreates Windows XP’s bootup from the initial bootstrap load all the way to initialization and loading of the following memory-resident utilities: Dimension4 (a time synchronizer), Norton Antivirus 2002 AutoProtect, Palm Hotsync v4.0, and ICQ 2000b.
StorageReview.com Gaming DriveMark 2002– A weighted average of the disk accesses featured in five popular PC games: Lionhead’s Black & White v1.1, Valve’s Half-Life: Counterstrike v1.3, Blizzard’s Diablo 2: Lord of Destruction v1.09b, Maxis’s The Sims: House Party v1.0, and Epic’s Unreal Tournament v4.36. Games, of course, are not multitasked- all five titles were run in a serial fashion featuring approximately half an hour of play time per game.
For more information, please click here.
|
Note: Scores on top are better. |
Though primarily intended for enterprise-level server markets, the 15K.3 will undoubtedly find its way into many a power-user’s workstation and desktop machine. In the StorageReview.com Office Drivemark 2002, the Cheetah delivers an astonishing 578 IO/s per second. The 15K.3 improves upon its predecessor by a very significant 19%.
In the SR High-End DriveMark 2002, a mix of applications that emphasize writes and sequential transfers, the 15K.3 maintains its impressive showing, once again improving upon the X15-36LP by nearly 20%.
Windows XP in conjunction with its built-in defragmenter attempts to optimize the OS bootup process. Heavier queue depths emerge as a result. In the SR Bootup DriveMark 2002, the 15K.3 slips ever so slightly, besting its predecessor by “just” 17%.
Finally, for those willing to spring for ultra-high end enterprise-class drives for their gaming pleasure, Seagate’s latest won’t disappoint. In the SR Gaming DriveMark 2002, the Cheetah again tops all comers by at least 19%.
Multi-User PerformanceStorageReview uses the following tests to assess server performance: StorageReview.com File Server DriveMark 2002– A mix of synthetically-created reads and writes through IOMeter that attempts to model the heavily random access that a dedicated file server experiences. Individual tests are run under loads with 1 I/O, 4 I/Os, 16 I/Os, and 64 I/Os outstanding. The Server DriveMark is a convenient at-a-glance figure derived from the weighted average of results obtained from the four different loads. StorageReview.com Web Server DriveMark 2002– A mix of synthetically-created reads through IOMeter that attempts to model the heavily random access that a dedicated web server experiences. Individual tests are run under loads with 1 I/O, 4 I/Os, 16 I/Os, and 64 I/Os outstanding. The Server DriveMark is a convenient at-a-glance figure derived from the weighted average of results obtained from the four different loads. For more information click here. |
|
Note: Scores on top are better. |
|
|||||||||||||||||||||||||||
|
|
||||||||||||||||||||||||||
Multi-user and file-server performance has traditionally been dominated by Fujitsu SCSI drives. Last year, for example, the MAM3367 edged out the Cheetah X15-36LP as the fastest server drive around. The Cheetah 15.3K steals the crown back to Seagate’s camp, turning in scores about 4% higher than that of the MAM.
Legacy PerformanceeTesting Lab’s WinBench 99 Disk WinMark tests are benchmarks that attempt to measure desktop performance through a rather dated recording of high-level applications. Despite their age, the Disk WinMarks are somewhat of an industry standard. The following results serve only as a reference; SR does not factor them into final judgments and recommends that readers do the same. |
|
Note: Scores on top are better. |
|
|||||||||||||||||||||||||||
|
|
||||||||||||||||||||||||||
Heat and NoiseIdle Noise– The sound pressure emitted from a drive measured at a distance of 18 millimeters. The close-field measurement allows for increased resolution between drive sound pressures and eliminates interactions from outside environmental noise. Note that while the measurement is an A-weighted decibel score that weighs frequencies in proportion to human ear sensitivity, a low score does not necessarily predict whether or not a drive will exhibit a high-pitch whine that some may find intrusive. Conversely, a high score does not necessarily indicate that the drive exhibits an intrusive noise envelope. Net Drive Temperature– The highest temperature recorded from a 16-point sample of a drive’s top plate after it has been under heavy load for 80 minutes. The figures provided are net temperatures representing the difference between the measured drive temperature and ambient temperature. For more information, please click here. |
|
Note: Scores on top are better. |
|
|||||||||||||||||||||||||||
|
|
||||||||||||||||||||||||||
Despite the impressive performance outlined above, the Cheetah 15K.3’s most astonishing attribute may be its idle noise floor. With a sound pressure measurement of just 45.1 dB/A at a distance of 18 millimeters, the 15K.3 finds itself among the idle noise generated by typical 7200 RPM ATA drives!
Seek noise also continues to decline. Just a few years ago top-end drives would churn away with a racket easily heard one room removed. The 15K.3, however, emits seek sounds more like that of quieter 7200 RPM SCSI units.
Since the X15’s inception Seagate has repeatedly emphasized the importance of maintaining the series’ power consumption (and thus heat generation) within the lines of 10K RPM drives. 15K RPM drives nonetheless seemed to run hotter than their 10K brethren… until now. At just 25.1 degrees Celsius above ambient, the 15K.3 lands itself squarely within the realm of 7200 RPM SCSI drives! It thus may be installed into any well-ventilated machine without requiring active cooling. 15K drives have finally reached a point where they may be unobtrusively integrated into a high-end desktop machine.
ConclusionSeagate’s latest 15K product once again sets the standard against which this year’s crop of drives will be judged. The 15K.3 scales new heights in single-user performance and sets a new standard for server-class speed. And, in a pleasant surprise, the heat and noise floors delivered by this 15,000 RPM drive rival that of 7200 RPM units! As always, we should point out that competing drives from Fujitsu and Maxtor loom on the horizon. Yet for now, it is clear that in all imaginable applications the Cheetah 15K.3 is king. |


 Amazon