

|
 Introduced in 1996, Seagate’s venerable 10K RPM line is now in its sixth generation. Featuring up to four platters that pack 36 gigabytes of data each, the flagship Cheetah 10K.6 can store 146 gigabytes of data in a low-profile form factor. The drive features Seagate’s most ambitious claimed average seek time yet at just 4.7 milliseconds. Buffer has been doubled up to 8 megabytes… a no brainer when high-performance ATA drives are now standardizing on the same size!
The 10K.6 is the second Ultra320 SCSI drive to hit our testbed. Ultra320’s most highly-touted feature, of course, is an increase in the throughput ceiling to 320 MB/sec. Keep in mind that the current transfer rate champion, Seagate’s own Cheetah 15K.3, pushes 76 MB/sec in its outer sectors. While figures like these threaten Ultra2 SCSI’s 80 MB/sec barrier, Ultra160’s 160 MB/sec limit maintains plenty of headroom. It is only in multi-drive scenarios that 160 MB/sec bottlenecks arise. Our base drive tests occur with a single unit as the only active device on the host adapter. In such a setup, any performance advantages that Ultra320 (along with the requisite higher-bandwidth 64-bit PCI slots) would deliver over 160 are negligible. For our performance tests, we’re going to take advantage of the specification’s backwards compatibility and run the drive in Ultra160 mode off of our current host adapter. Bear in mind that improved bandwidth is only one of the benefits that Ultra320 delivers. A host of improvements in protocol and error correction should elevate data integrity and device interoperability to new levels.
 Interestingly, Seagate chose to stick with traditional ball-bearing motors in the 10K.6 rather than introducing the fluid dynamic bearing motors that hit the 15K series with last year’s X15-36LP. Why? There’s really no concrete answer aside from the general impression that the 15K series incorporates all of the latest and greatest technologies while the 10K line retains the tried and true.
What new heights does Seagate’s latest scale? Let’s take a look!
Low-Level ResultsFor diagnostic purposes only, StorageReview measures the following low-level parameters: Average Read Access Time– An average of 25,000 random accesses of a single sector each conducted through IPEAK SPT’s AnalyzeDisk suite. The high sample size permits a much more accurate reading than most typical benchmarks deliver and provides an excellent figure with which one may contrast the claimed access time (claimed seek time + the drive spindle speed’s average rotational latency) provided by manufacturers. WB99 Disk/Read Transfer Rate – Begin– The sequential transfer rate attained by the outermost zones in the hard disk. The figure typically represents the highest sustained transfer rate a drive delivers. WB99 Disk/Read Transfer Rate – End– The sequential transfer rate attained by the innermost zones in the hard disk. The figure typically represents the lowest sustained transfer rate a drive delivers. |
For more information, please click here.
|
Note: Scores on top are better. |
|
|||||||||||||||||||||||||||||||||
|
|
||||||||||||||||||||||||||||||||
ST3146807LW Average Read Service Time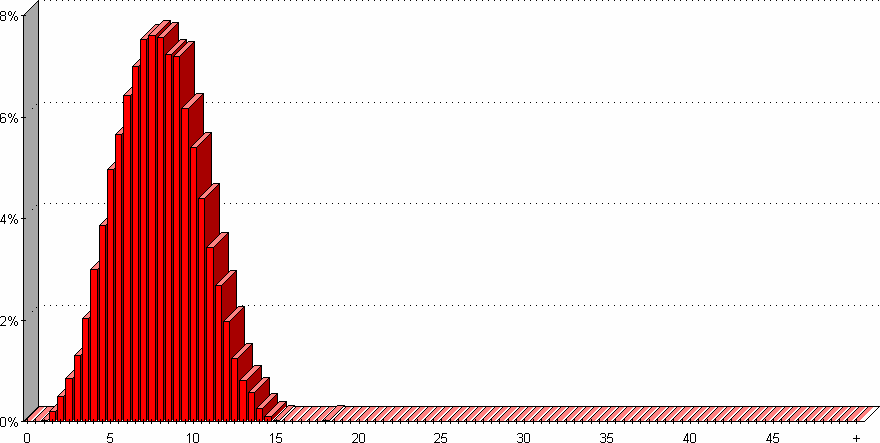 |
ST3146807LW Average Write Service Time
|
||||||||||||||||||||||||||||||||
AnalyzeDisk pegs the Cheetah 10K.6’s access time at 8.0 milliseconds. Subtracting three milliseconds to account for the rotational latency of a 10K RPM drive yields a measured seek time of 5.0 ms. Though it misses Seagate’s claimed average seek time of 4.7 ms, the 10K.6 nonetheless exhibits a half-millisecond improvement over the Cheetah 73LP and is more in line with the competition from Maxtor and Fujitsu.
Average write access times weigh in at 8.3 milliseconds. Here the 10K.6 narrowly edges out the Atlas and MAN drives in posting a best-of-class score.
|
Note: Scores on top are better. |
|
|||||||||||||||||||||||||||||||||
|
|
||||||||||||||||||||||||||||||||
ST3146807LW Transfer Rate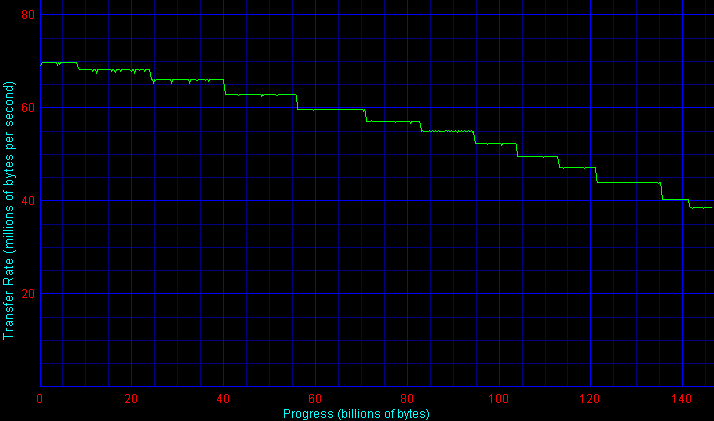
|
|||||||||||||||||||||||||||||||||
As one would expect from a drive featuring state-of-the-art data density, the Cheetah 10K.6’s outer zone transfer rate significantly improves on that of its predecessor. At 69 MB/sec, the 10K.6 is second only to Seagate’s own 15,000 RPM Cheetah 15K.3. Inner zone transfers decay to 40.4 MB/sec. Interestingly, though impressive in its own right, the 10K.6 doesn’t quite snatch the inner-zone distinction from the Cheetah 36ES, a curious drive that exhibits the least decay between outer and inner zones that we’ve ever seen in a traditional magnetic media unit.
Single-User PerformanceStorageReview uses the following tests to assess non-server use: StorageReview.com Office DriveMark 2002– A capture of 30 minutes of actual computer productivity use that exactingly recreates a typical office-style multitasking environment. The applications include: Outlook XP, Word XP, Excel XP, PowerPoint XP, Calypso (a freeware e-mail client), SecureCRT v3.3 (a telnet/SSH client), CuteFTP Pro v1.0 (an FTP/SSH client), ICQ 2000b), Palm Hotsync 4.0, Gravity 2.3 (a Usenet/newsgroups client), PaintShop Pro v7.0, Media Player v8 for the occasional MP3, and Internet Explorer 6.0. StorageReview.com High-End DriveMark 2002– A capture of VeriTest’s Content Creation Winstone 2001 suite. Applications include Adobe Photoshop v5.5, Adobe Premiere v5.1, Macromedia Director v8.0, Macromedia Dreamweaver v3.0, Netscape Navigator v4.73, and Sonic Foundry Sound Forge v4.5. Unlike typical productivity applications, high-end audio- and video- editing programs are run in a more serial and less multitasked manner. The High-End DriveMark includes significantly more sequential transfers and write (as opposed to read) operations. |
StorageReview.com Bootup DriveMark 2002– A capture of the rather unusual Windows XP bootup process. Windows XP’s boot procedure involves significantly different access patterns and queue depths than those found in other disk accesses. This test recreates Windows XP’s bootup from the initial bootstrap load all the way to initialization and loading of the following memory-resident utilities: Dimension4 (a time synchronizer), Norton Antivirus 2002 AutoProtect, Palm Hotsync v4.0, and ICQ 2000b.
StorageReview.com Gaming DriveMark 2002– A weighted average of the disk accesses featured in five popular PC games: Lionhead’s Black & White v1.1, Valve’s Half-Life: Counterstrike v1.3, Blizzard’s Diablo 2: Lord of Destruction v1.09b, Maxis’s The Sims: House Party v1.0, and Epic’s Unreal Tournament v4.36. Games, of course, are not multitasked- all five titles were run in a serial fashion featuring approximately half an hour of play time per game.
For more information, please click here.
|
Note: Scores on top are better. |
Posting a StorageReview.com Office DriveMark 2002 of 450 IOs/sec, the Cheetah 10K.6 trails the category-leading Maxtor Atlas 10k III by a scant 1% gap.
The Seagate does, however, make substantial headway in the SR High-End DriveMark 2002, a suite that emphasizes transfer rates. Here the 10K.6 posts the best score ever recorded for a 10,000 RPM unit.
The 10K.6 also does very well in the SR Bootup DriveMark 2002. The Bootup DriveMark introduces higher-than-normal queue depths on test drives; Seagate’s contender tops the Atlas by a comfortable 8% margin.
Finally, in the SR Gaming DriveMark 2002, the Atlas asserts its dominance and maintains a 7% lead over Seagate’s contender.
Multi-User PerformanceStorageReview uses the following tests to assess server performance: StorageReview.com File Server DriveMark 2002– A mix of synthetically-created reads and writes through IOMeter that attempts to model the heavily random access that a dedicated file server experiences. Individual tests are run under loads with 1 I/O, 4 I/Os, 16 I/Os, and 64 I/Os outstanding. The Server DriveMark is a convenient at-a-glance figure derived from the weighted average of results obtained from the four different loads. StorageReview.com Web Server DriveMark 2002– A mix of synthetically-created reads through IOMeter that attempts to model the heavily random access that a dedicated web server experiences. Individual tests are run under loads with 1 I/O, 4 I/Os, 16 I/Os, and 64 I/Os outstanding. The Server DriveMark is a convenient at-a-glance figure derived from the weighted average of results obtained from the four different loads. For more information click here. |
|
Note: Scores on top are better. |
|
|||||||||||||||||||||||||||||||||
|
|
||||||||||||||||||||||||||||||||
In a file server scenario, the Cheetah 10K.6 posts a score just shy of Fujitsu’s MAM3735. Its 258 IOs/sec represents a substantial improvement over the Cheetah 73LP. When it comes to the read-oriented activity of a web server, the situation flips: Seagate’s drive edges past the Fujitsu.
Legacy PerformanceeTesting Lab’s WinBench 99 Disk WinMark tests are benchmarks that attempt to measure desktop performance through a rather dated recording of high-level applications. Despite their age, the Disk WinMarks are somewhat of an industry standard. The following results serve only as a reference; SR does not factor them into final judgments and recommends that readers do the same. |
|
Note: Scores on top are better. |
|
|||||||||||||||||||||||||||||||||
|
|
||||||||||||||||||||||||||||||||
Heat and NoiseIdle Noise– The sound pressure emitted from a drive measured at a distance of 18 millimeters. The close-field measurement allows for increased resolution between drive sound pressures and eliminates interactions from outside environmental noise. Note that while the measurement is an A-weighted decibel score that weighs frequencies in proportion to human ear sensitivity, a low score does not necessarily predict whether or not a drive will exhibit a high-pitch whine that some may find intrusive. Conversely, a high score does not necessarily indicate that the drive exhibits an intrusive noise envelope. Net Drive Temperature– The highest temperature recorded from a 16-point sample of a drive’s top plate after it has been under heavy load for 80 minutes. The figures provided are net temperatures representing the difference between the measured drive temperature and ambient temperature. For more information, please click here. |
|
Note: Scores on top are better. |
|
|||||||||||||||||||||||||||||||||
|
|
||||||||||||||||||||||||||||||||
The Cheetah 10K.6’s idle noise comes in at 48.5 dB/A measured from a distance of 18 millimeters. While the score is a substantial improvement over the Cheetah 73LP, it is interesting to note that the Cheetah 15K.3 remains substantially quieter. The advantages of fluid bearing motors become quite clear when a 15k RPM drive delivers a significantly lower noise floor than a 10K unit that remains equipped with ball bearings.
Seek noises are improved when contrasted with those of the 73LP. The 10K.6’s seeks may be subjectively described as “lighter,” “hollow,” and ultimately less obtrusive.
Like the Cheetah 15K.3, the 10K.6 exhibits an admirable drop in heat levels. The drive’s maximum top-plate measurement of 24.4 degrees Celsius above ambient temperature is almost a 5 degree drop from the levels reached by the 73LP. Still hotter than ATA drives, no question, but more manageable than ever.
ConclusionThough it doesn’t break any barriers when it comes to our main battery of tests, the Cheetah 10K.6 nevertheless manages to combine top-class desktop and server performance with 146 gigabytes of capacity all into a low-profile case. It also makes significant headway in improving heat and noise floors. While impending competition looms from Fujitsu and Maxtor, the 10K.6 is a compelling offering in today’s mainstream SCSI market. |


 Amazon