

Being able to see into one’s storage can be critical in some cases and at least helpful in most. This becomes even more beneficial when dealing with multi-vendor NAS and/or SAN arrays. SolarWinds’ Storage Resource Monitor (SRM) is a relatively in-expensive way for organizations to gain insight into their arrays. SolarWinds SRM gives administrators insight into all storage layers including virtualization and applications and supports several of the large vendors with a support list that continues to grow.
The idea of looking into a multi-vendor NAS or SAN array holds an appeal to IT administrators beyond curiosity. SRM enables admins to view and manage all of their storage arrays through a single-pane-of-glass. With SRM admins can monitor system performance of the various arrays and pinpoint hot spots or bottlenecks. Admins can setup alerts for various aspects of their system. And they will be able to better setup capacity planning knowing what is available and how it is performing. All of the panels are highly customizable as are the alerts, so admins can set them up to best fit the organization they work in.
SolarWinds SRM can be downloaded in a free 30-day trail before purchase and starts at $2,935.
Supported Storage Devices
- NetApp
- NetApp E-series
- NetApp Filers (OnTAP 7-mode)
- NetApp Filers (Clustered Data OnTAP (CDOT))
- EMC
- EMC CLARiiON
- EMC VNX
- EMC Celerra
- EMC Isilon
- EMC Symmetrix VMAX, VMAXe, DMX
- Dell
- Dell PowerVault MD3xxxi
- Dell EqualLogic
- Dell Compellent
- IBM
- IBM N Series
- IBM DS3xxx, 4xxx, 5xxx
- IBM 6xxx, 8xxx
- IBM Spectrum Virtualize (Vxxx and SVC)
- IBM Spectrum Accelerate (XIV)
- IBM (ESS) Enterprise Storage Server
- Hitachi
- Hitachi Data Systems AMS
- Hitachi Data Systems USP, USPV, VSP
- Hitachi Data Systems HUS 100 Block-side, HUS VM Block-side
- HP
- HP StoreServ 3PAR
- HP StoreVirtual/LeftHand P4xxx
- HP StorageWorks EVA
- HP StorageWorks XP
- HP MSA/P2xxx
- Other Vendors
- Oracle/SUN: StorageTek 2xxx & 6xxx, Virtual Storage Manager 99xx Series, Flex
- Oracle/Pillar
- Xiotech: Emprise 7000, Magnitude 3D 3xxx and 4xxxr
- ONStor
- Dot Hill AssuredSAN 4xxx/5xxx
System Requirements
- Hard Drive: 50GB
- Memory: 8GB
- CPU: 2.0GHz dual-processor (dual-core recommended)
- .NET Framework: Version 3.5 SP1 and 4.0 .NET Framework
- Database
- SQL 2008, 2008 SP1, 2008 SP2, 2008 SP3
- SQL 2008 R2, 2008 R2 SP1, 2008 R2 SP2
- SQL 2012, SQL 2012 SP1
- Operating System
- Windows Server 2003 SP2, 2003 R2 SP2, (32-bit & 64-bit)
- Windows 2008, 2008 SP2, 2008 R2, 2008 R2 SP1
- Windows Server 2012, 2012 R2 with IIS, in 32-bit mode
- Web Console Browser: Microsoft IIS, version 6.0 and higher, in 32-bit mode
Usability
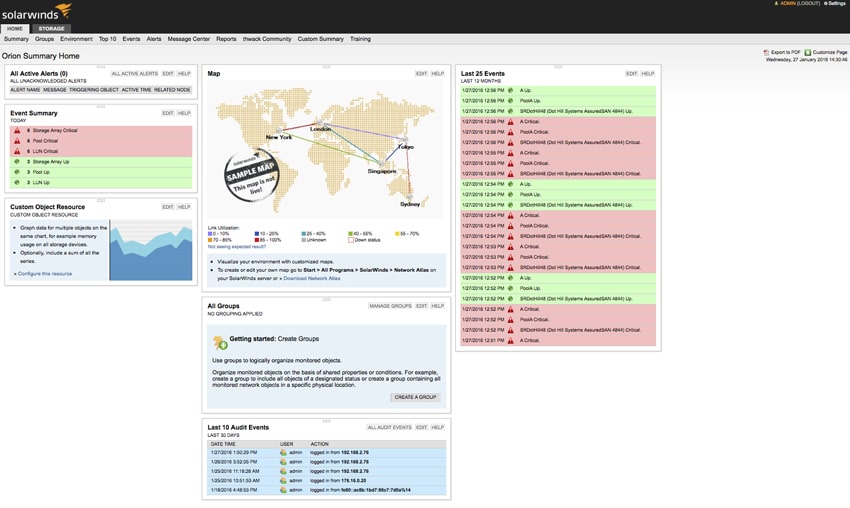
The main advantage of SRM is that all of an organizations various storage arrays can be viewed together in a single-pane-of-glass. While SRM supports all of the above arrays for our usage and review we will only be looking at one array a DotHill AssuredSAN Ultra48. The first screen users come to gives them an overall view of the system and highlights events (red color indicates something is wrong, green indicates that operation is normal). Beneath the Home tab are several other tabs running from right to left: Summary, Groups, Environment, Top 10, Events, Alerts, Message Center, Reports, thwack Community, Custom Summary, and Training. The Home tab and its Summary sub-tab are the same screen that primary highlights events and alerts. The Tabs and Sub tabs help users by allowing them to easily set up groups, monitor the most active arrays, go over events, set up custom alerts, and give them access to help.
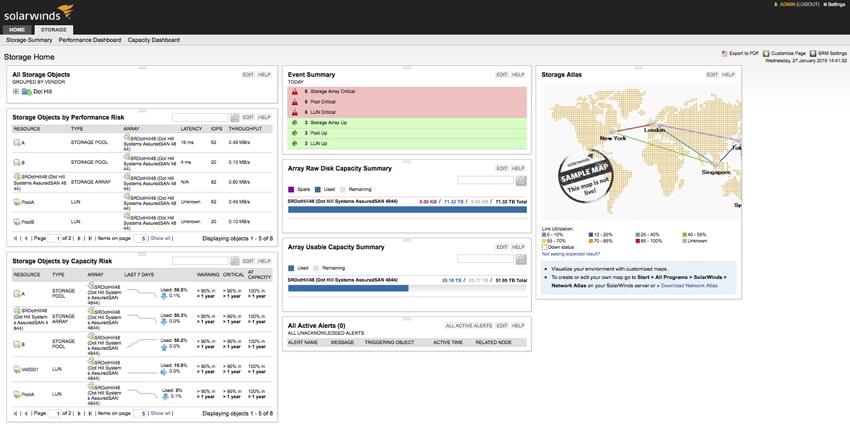
That takes care of the sub tabs beneath home. Looking over at the next main tab, marked Storage, there are three sub tabs here, the main one being Storage Summary. As the name suggests, this tab gives an overall summary of the storage arrays under the SRM blanket. Keep in mind that the layout is completely customizable and the layout shown here is from a practical standpoint in order to get all of the information within the picture. The first box on the upper left hand side is All Storage Objects, here users will see all of the arrays grouped together by vendor. Through this box users can further expand on each vendor, then each array, all the way down to individual LUNS and pull up a detailed summary on any level by double clicking on it. The box beneath that is the Storage Objects by Performance Risk. Once again users can see each aspect of their storage and see a readout of performance to know whether or not something is amiss. Beneath that box is the Storage Objects by Capacity Risks. Here users can see how much capacity has been used and an estimate as to when capacity will be full. Running down the middle, the top box is the event summary, as it sounds it once again gives admins a look at events that are currently happening but can run back through the entire year. Beneath that are two capacity summaries for Raw and Usable, with an indication of how much is currently being used and how much remains. On the bottom is a box for all active alerts. And finally off on the right hand side is the Storage atlas.
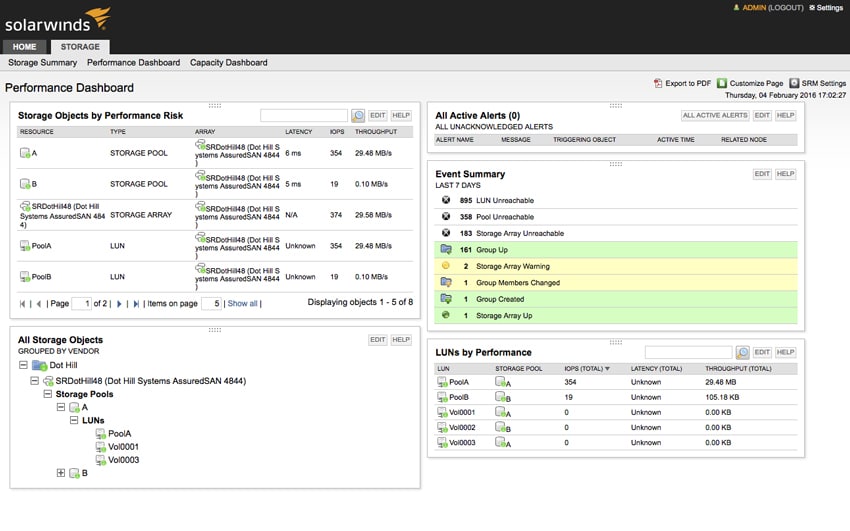
Clicking on the Performance Dashboard shows some of the same elements that were seen in the Storage Summary. Storage Objects by Performance Risk as mentioned above users can see a readout of performance to know whether or not something is amiss. They can change the interval at which they see the performance as well. This tab also has All Storage Objects, All Active Alerts, and Event Summary. Something that is unique to this tab is the LUNs by Performance. Much like the Storage Objects by Performance Risk, users can see how each LUN is performing. If performance of any aspect is noted to be an issue, users can go back to the alerts tab and set certain alerts if performance dropped below a defined threshold.
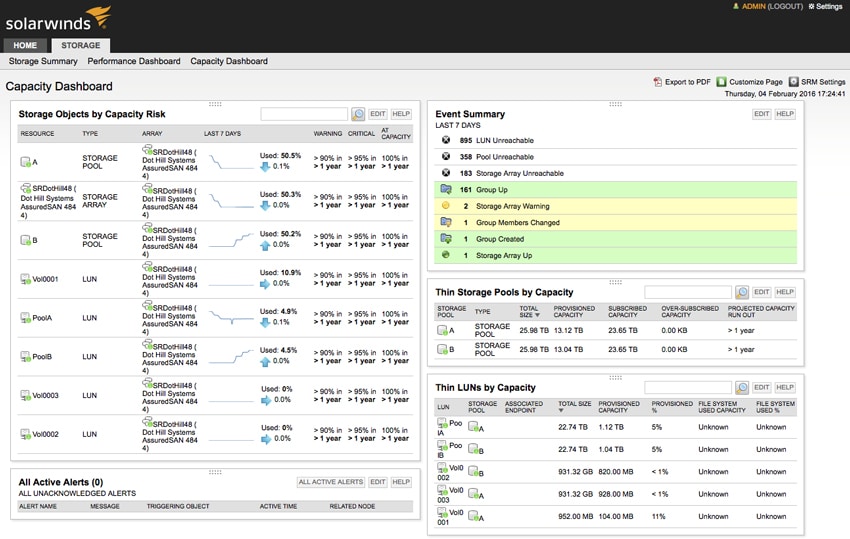
The Capacity Dashboard also has some overlap with Storage Summary. Again there is the Event Summary and Active Alerts (these appear on each page as they made be critical information that admins need to know at any given time) as well as Storage Objects by Capacity Risks. Again users can see what capacity is used with a rough estimate as to when the total capacity will be used and when an alert will be generated telling admins that they are close to maximum capacity. What’s unique to this tab is Thin Storage Pools by Capacity and Thin LUNs by Capacity. Once again users can set up alerts based off of capacity, if the capacity of a certain LUN is getting close users can customize when the alert goes off.
Conclusion
There is more than one data center out there that houses arrays from different vendors. While admins are able to see inside each one they generally have to do it one at a time. SolarWinds SRM enables IT administrators to view all of the arrays, even from various vendors, from a single-pane-of-glass. Once the software is installed, they only need one browser window open to see everything in their data center. At a glance users can see any alerts, events, and how much capacity as well as the performance of each array. Not only that they can quickly delve deeper down to the LUN to check on capacity and performance. This could potentially speed up troubleshooting as well as help in the future for capacity planning. Almost every bit of SRM is customizable so users can set it up any way they choose that helps them carry out tasks faster.
At StorageReview, we found the software easy to install to give us insight into our storage. For our testing purposes we only set up one array, a DotHill AssuardSAN Ultra48, though users can set up all compatible arrays under SRM. Right off the bat we were able to see what alerts were active and the events that had happened over the past few days. We were able to quickly click through our arrays, and expand it all the way down to the LUNs. We could see our capacity and performance and when we would use up the capacity at our given rate (it is a rough estimate, not an exact time). Customizing the various screens was simple and intuitive.
Of course SRM is only one component of the larger SolarWinds offering. It's insights though are very helpful and pretty deep for supported arrays. Even just looking at the SRM component, with enterprises that have several arrays in their environment, it's hard to imagine not getting the value out of SRM given its modest pricing. Anyone wondering if the fit is there for a given environment can also play with SRM free for 30 days to try it out.
Pros
- Easy to use
- Gives insights into multiple arrays at once
- Wide selection of arrays (and growing) that are natively compatible
Cons
- Can be a bit repetitive within different screens
- Estimates on capacity and performance could probably be fine-tuned more
The Bottom Line
SolarWinds Storage Resource Monitor is a cost-effective method for seeing into all the arrays in a data center at once, give administrators the ability to troubleshoot and capacity plan more effectively.


 Amazon