

Density matters more than ever in the modern data center, where every inch of rack space and watt of power consumed directly impacts operational efficiency and cost. Solidigm’s D5-P5336 122.88TB SSD arrives as a compelling solution to this challenge, packing a remarkable capacity into a single U.2 drive and setting a new benchmark in SSD storage density.
This unprecedented storage density not only streamlines physical infrastructure but also transforms data center design possibilities by significantly reducing rack space requirements and enhancing overall energy efficiency. As data centers increasingly balance the soaring demands of AI workloads, content delivery, and object storage against the pressures of sustainability and cost, drives like the Solidigm D5-P5336 represent not just technological advancement but an essential evolution in enterprise storage strategy.
We’re already seeing this adoption take place; server and storage vendors are qualifying high-capacity drives quickly so they can respond to customers’ calls for storage efficiency. Dell Technologies, for instance, has already added support for 122.88TB drives in their PowerScale line of storage arrays, and they’ve just shown the PowerEdge R7725xd, which can accommodate nearly 3PB of capacity with these capacious drives.
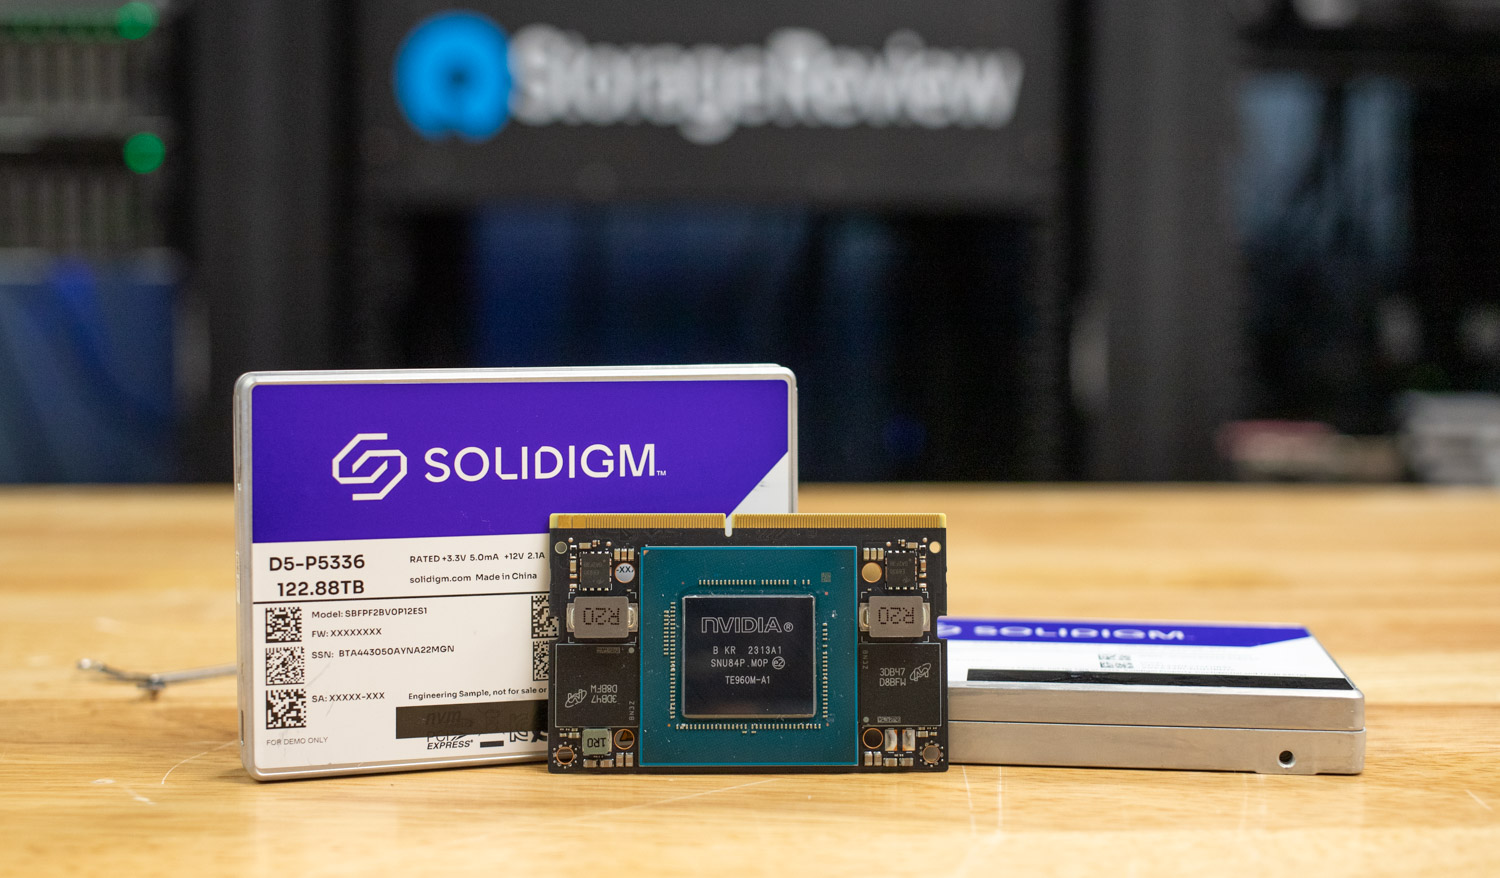
For this review, we won’t reach those levels of scale; we have only a single drive for this report. That said, our workloads will demonstrate where this drive excels across various enterprise workloads, including those designed to support modern AI applications. If you prefer a slightly more whimsical approach to using 122.88TB SSDs, we explored the potential of the Solidigm 122TB D5-P5336 in a unique edge AI deployment earlier this year, utilizing the NVIDIA Jetson Orin Nano Super.
One last note before we dive in. It’s essential to understand what the 122.88TB P5336 is and isn’t. This launch is an extension of the Drive family, which was launched in mid-2023. Solidigm was one of the first to commercialize QLC storage for enterprise use cases, bringing density, cost-effectiveness, good read performance, and adequate performance to workloads that could benefit from this unique blend. Since then, the industry has rushed to catch up to Solidigm’s capacity leadership. With the variety of drive configurations and form factors, however, the waters have become relatively muddied. Although the Solidigm 122.88TB drive remains a Gen4 model in a U.2 form factor (it is also available in E1.L), it is designed to provide high capacity at an attractive TB/$ ratio.
Build and Design
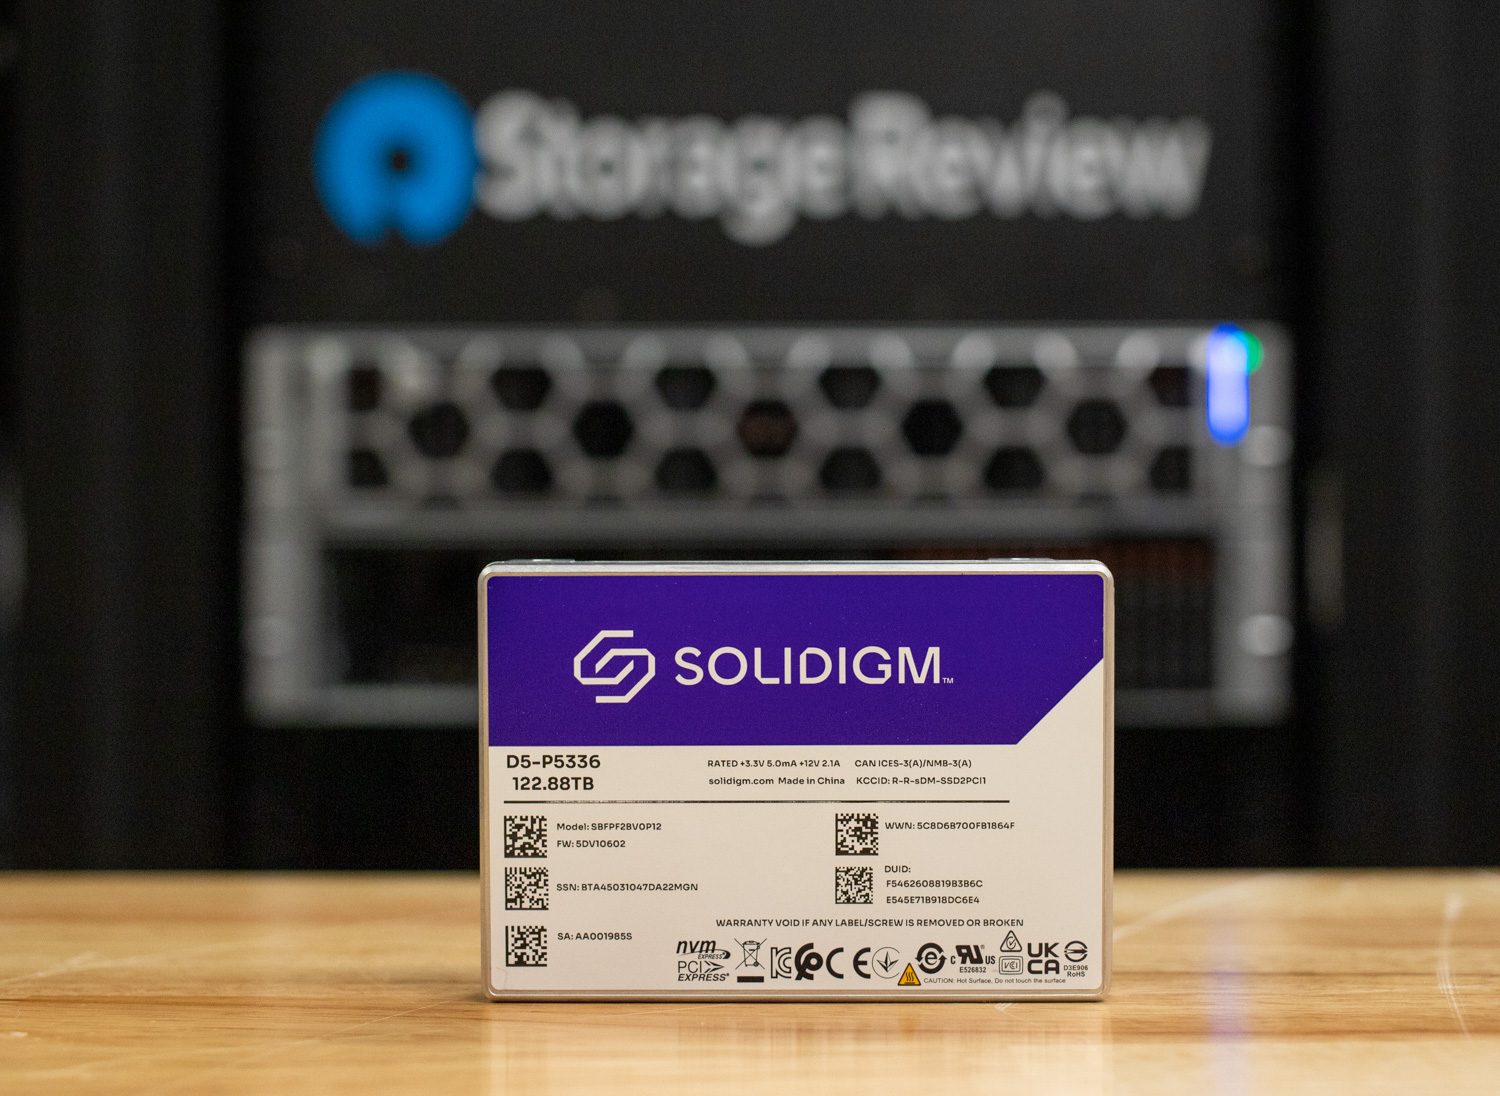
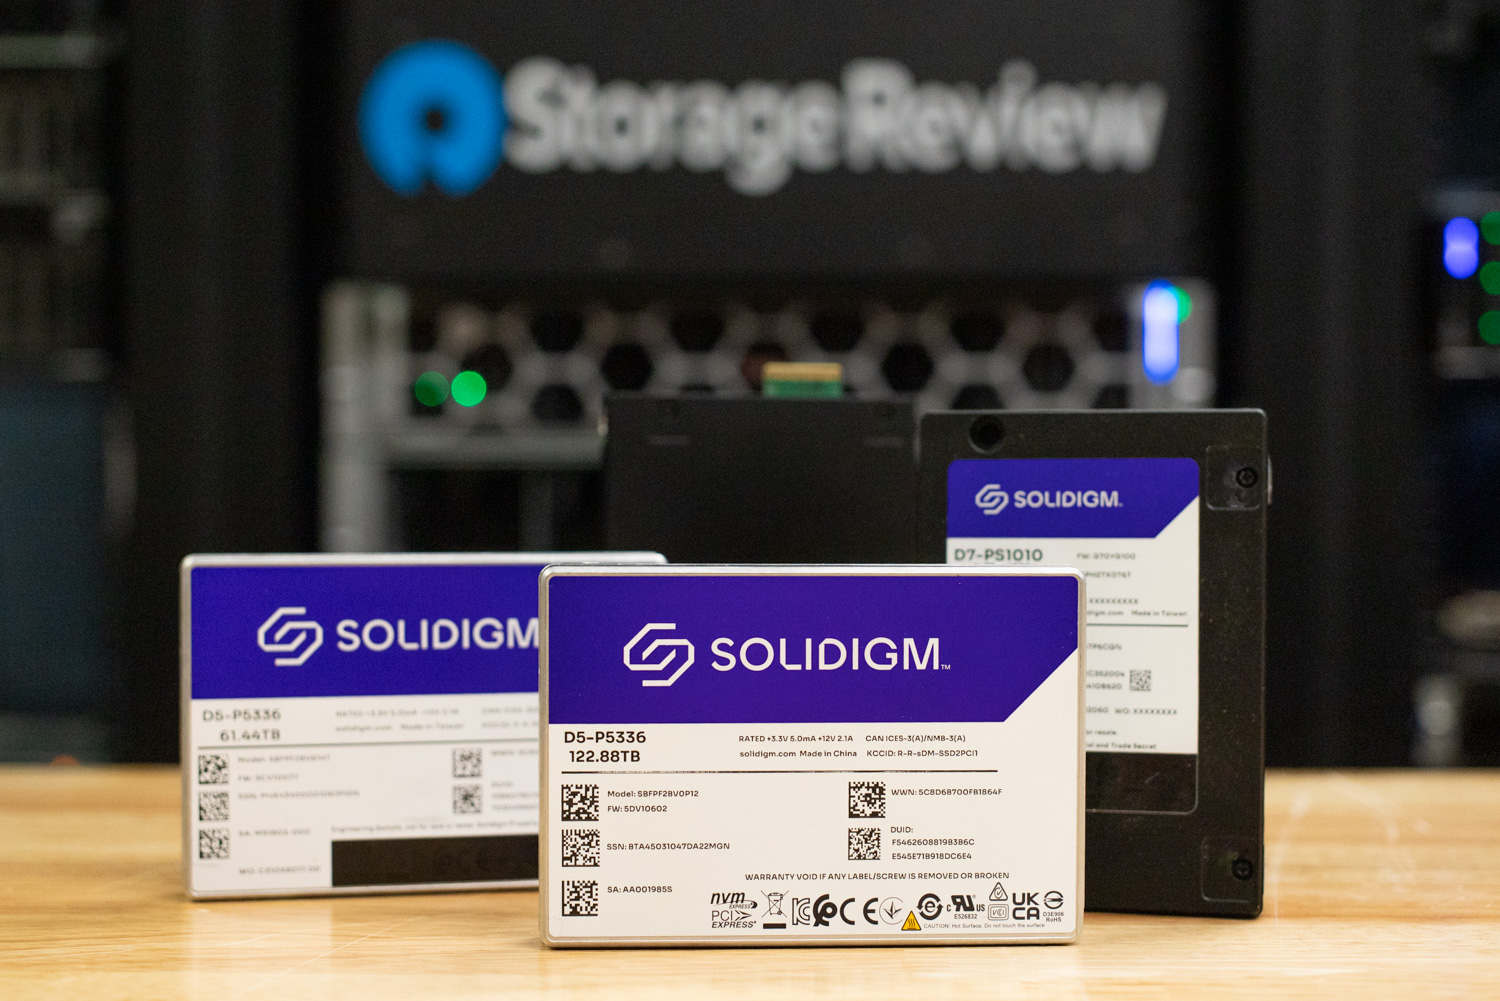
The Solidigm D5-P5336 122.88TB maintains the same core architecture as the previously reviewed 61.44TB model, using 192-layer QLC NAND. This consistency ensures predictable performance, thermal behavior, and interface compatibility across capacities, which is critical for scale-out deployments. As a 32KB I/O Unit drive (up from 16KB in the 61TB version), the 122TB D5-P5336 is optimized for mid-sized I/O patterns commonly found in object storage and AI data pipelines. This design provides greater workload flexibility while maintaining efficiency.
What sets this model apart is its 122.88 TB capacity, which doubles the storage without an increase in physical space. Housed in a standard 2.5-inch U.2 15mm form factor, it is also offered in E3.S 7.5mm and E1.L 9.5mm configurations to support diverse hyperscale needs. The drive utilizes the PCIe Gen4 x4 NVMe interface, delivering up to 7GB/s of sequential read throughput and 3GB/s of write throughput. While it does not adopt PCIe Gen5, Gen4 provides sufficient bandwidth for the read-intensive workloads the D5-P5336 targets, including AI pipelines, content distribution, and object storage.
From a performance standpoint, the drive delivers up to 900,000 IOPS for random reads (4K, QD256) and 19,000 IOPS for random writes (16K, QD256). Read latency is listed at 110 microseconds (4K) and write latency at 40 microseconds (32K). Sequential access latency is even lower, with reads at 8 microseconds (4K) and writes at 21 microseconds (32K), supporting highly responsive operation in large-scale deployments.
Comparing the 122TB P5336 to the prior 61TB drive, the higher-capacity SSD runs at a lower-listed write performance. Sequential 128K transfers dip to 3GB/s from 3.3GB/s, and 16K random write performance drops more substantially, from 43K IOPS to just 19K IOPS. As we work through the evaluation, it is essential to note that the capacities will diverge as specific workloads stress the drives in terms of sequential or random transfer performance.
The drive includes SK hynix DRAM cache and power-loss protection capacitors. These components ensure reliable buffering and safeguard data during unexpected power events, which is mandatory in enterprise-scale environments. Reliability of the drive includes a mean time between failures (MTBF) rating of two million hours and an unrecoverable bit error rate of less than one bit error per 100 quadrillion bits read.
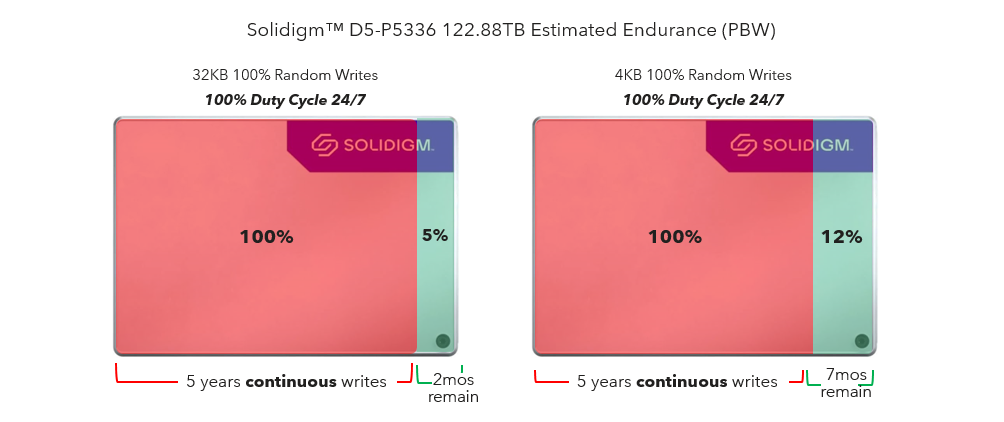
Organizations are concerned about the overall lifespan of SSDs, with the focus on the number of writes over many years of usage. The endurance rating for the Solidigm D5-P5336 is 0.6 drive writes per day (DWPD), based on a 32K random write workload, which translates to 134.3 petabytes written (PBW) over the warranty period. The 122TB D5-P5336 SSD from Solidigm sets a new benchmark for endurance, designed for continuous 24/7 operation over a five-year period. It can handle either 32KB random writes, retaining 5% of its endurance after five years, or 4K random writes, with 12% endurance remaining. While it maintains a Drive Writes Per Day (DWPD) rating of 0.60, the increased NAND capacity enables it to support continuous workloads more effectively.
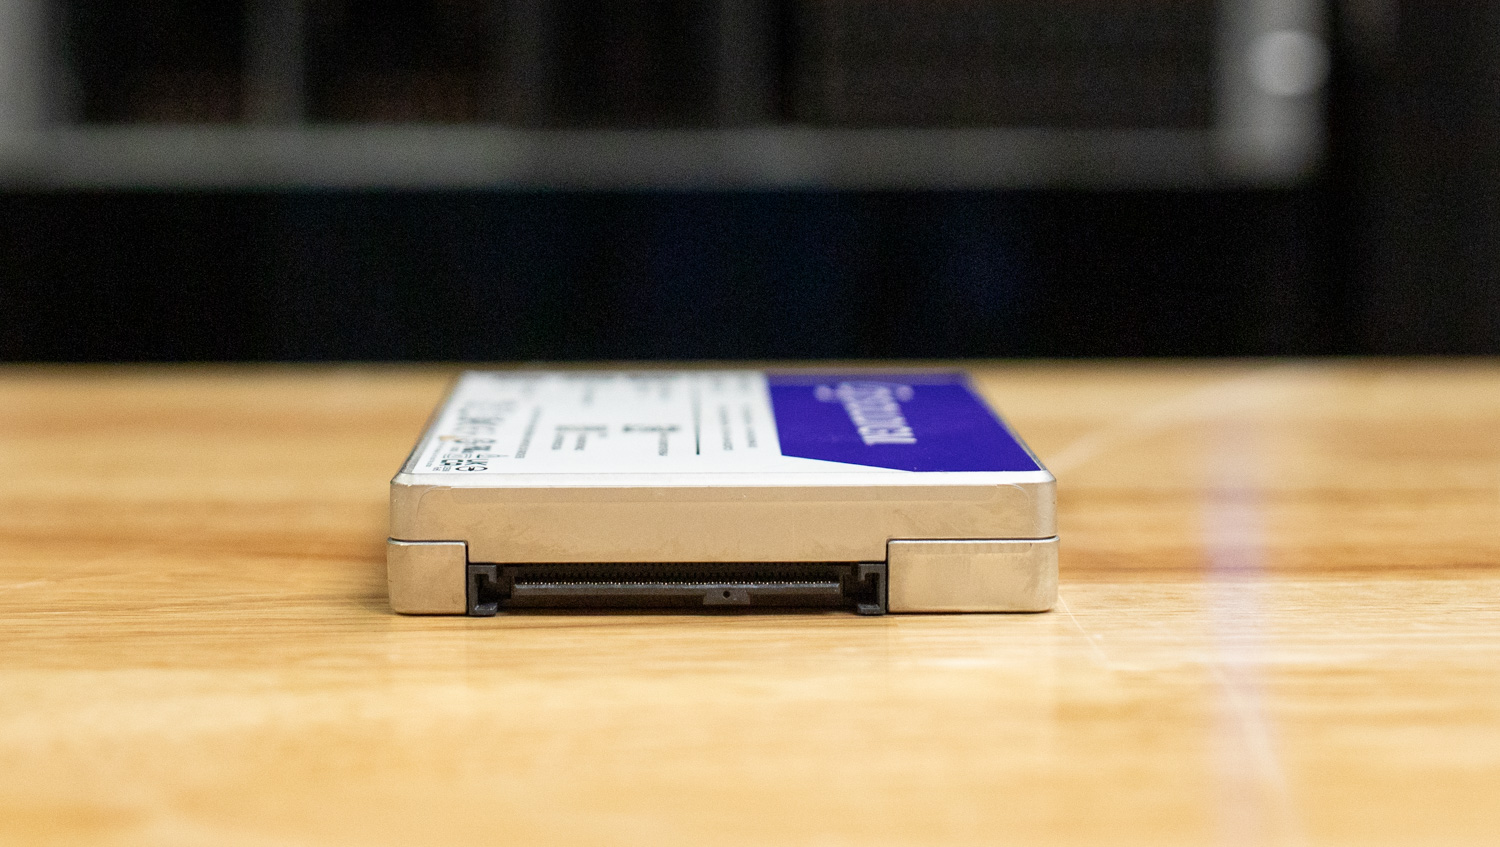
The drive is passively cooled and housed in a solid aluminum case. It operates with a modest power profile of 24 watts active and 5 watts idle, allowing it to integrate easily into existing infrastructures. It weighs approximately 166.4 grams, supports an operating temperature range of 0 to 70 degrees Celsius, vibration resistance up to 2.17 GRMS, shock resistance up to 1,000 G, and is backed by a five-year warranty. It is designed for environments that prioritize density, efficiency, and rack consolidation, delivering massive capacity within a familiar enterprise form factor.
Solidigm D5-P5336 Series (122.88TB) Specifications
| Specifications Overview | Solidigm D5-P5336 Series (122.88TB) |
|---|---|
| Capacity | 122.88TB |
| Form Factor | U.2 15mm or E1.L 9.5mm |
| Interface | PCIe 4.0 x4, NVMe |
| Use Case | Server / Enterprise |
| Sequential Read | 7000MB/s |
| Sequential Write | 3000MB/s |
| Random Read (IOPS) | 900,000 (4K, QD256) |
| Random Write (IOPS) | 19,000 (16K, QD256) |
| Latency (Read/Write) | Read: 110μs (4K) / Write: 40μs (32K) |
| Sequential Latency (typ.) | Read: 8μs (4K) / Write: 21μs (32K) |
| Power (Active/Idle) | Active: 24W / Idle: 5W |
| Endurance | 0.6 DWPD (32K RW) / 134.3 PBW |
| MTBF | 2 million hours |
| UBER | <1 sector per 10 bits read |
| Operating Temp | 0°C to 70°C |
| Vibration/Shock | 2.17 GRMS (operating), 1,000 G (shock) |
| Warranty | 5 years |
| Weight | 166.4g ± 10g |
Performance Testing
Drive Testing Platform
We leverage a Dell PowerEdge R760 running Ubuntu 22.04.02 LTS as our test platform across all the workloads in this review. Equipped with a Serial Cables Gen5 JBOF, it offers wide compatibility with U.2, E1.S, E3.S and M.2 SSDs Our system configuration is outlined below:
- 2 x Intel Xeon Gold 6430 (32-Core, 2.1GHz)
- 16 x 64GB DDR5-4400
- 480GB Dell BOSS SSD
- Serial Cables Gen5 JBOF
Drives Compared
- Solidigm P5336 122.88TB (Gen4 | 2.5″ | U.2)
- Solidigm P5336 61.44TB (Gen4 | 2.5″ | U.2)
- Micron 6550 ION 61.44TB (Gen5 | E3.S)
As stated in the introduction, the high-capacity enterprise drive market is complex, with various form factors, NAND types, and cost-performance profiles to consider. For this review, we have a small group of SSDs to compare with the 122.88TB Solidigm P5336, including the smaller 61.44TB Solidigm P5336 and the 61.44TB Micron 6550.
The Micron 6550 is unique in that it is Gen5 and TLC-based, and one of the few in production at this capacity point. The Micron drive will have the advantage of higher I/O speeds.
As we review the performance results, it is essential to understand this staging. In deployment, these drives may not compete directly, but they do overlap in the capacities they offer. To provide a reference for scale, we have included the Micron drive in this review.
CDN Performance
To simulate a realistic, mixed-content CDN workload, the SSDs were subjected to a multi-phase benchmarking sequence designed to replicate the I/O patterns of content-heavy edge servers. The testing procedure encompasses a range of block sizes, including both large and small, distributed across random and sequential operations, with varying concurrency levels.
Before the main performance tests, each SSD completed a total device fill with a 100% sequential write pass using 1MB blocks. This process utilized synchronous I/O and a queue depth of four, allowing for four simultaneous jobs. This phase ensures the drive enters a steady-state condition representative of real-world usage. Following the sequential fill, a secondary three-hour randomized write saturation stage was executed using a weighted bssplit (blocksize/percentage) distribution, heavily favoring 128K transfers (98.51%), with minor contributions from sub-128K blocks down to 8K. This step emulates fragmented and uneven write patterns often seen in distributed cache environments.
The main testing suite focused on scaled random read and write operations to measure the drive’s behavior under variable queue depths and job concurrency. Each test ran for five minutes (300 seconds) and was followed by a three-minute idle period, allowing internal recovery mechanisms to stabilize performance metrics.
- Executed using a fixed block size distribution favoring 128K (98.51%), with the remaining 1.49% of operations composed of smaller transfer sizes ranging from 64K to 8K. Each configuration varied across 1, 2, and 4 concurrent jobs, with queue depths of 1, 2, 4, 8, 16, and 32, to profile throughput scalability and latency under typical edge-write conditions.
- A heavily mixed block size profile, mimicking CDN content retrieval, was used, starting with a dominant 128K (83.21%) component and followed by a long tail of over 30 smaller block sizes, spanning from 4K to 124K, each with fractional frequency representation. This distribution reflects the diverse request patterns encountered during video segment fetching, thumbnail access, and metadata lookups. These tests were also run across the complete matrix of job counts and queue depths.
This combination of preconditioning, saturation, and mixed-size randomized access tests is designed to reveal how SSDs handle sustained CDN-like environments, emphasizing responsiveness and efficiency in bandwidth-heavy and highly parallelized scenarios.
CDN Workload Read 1
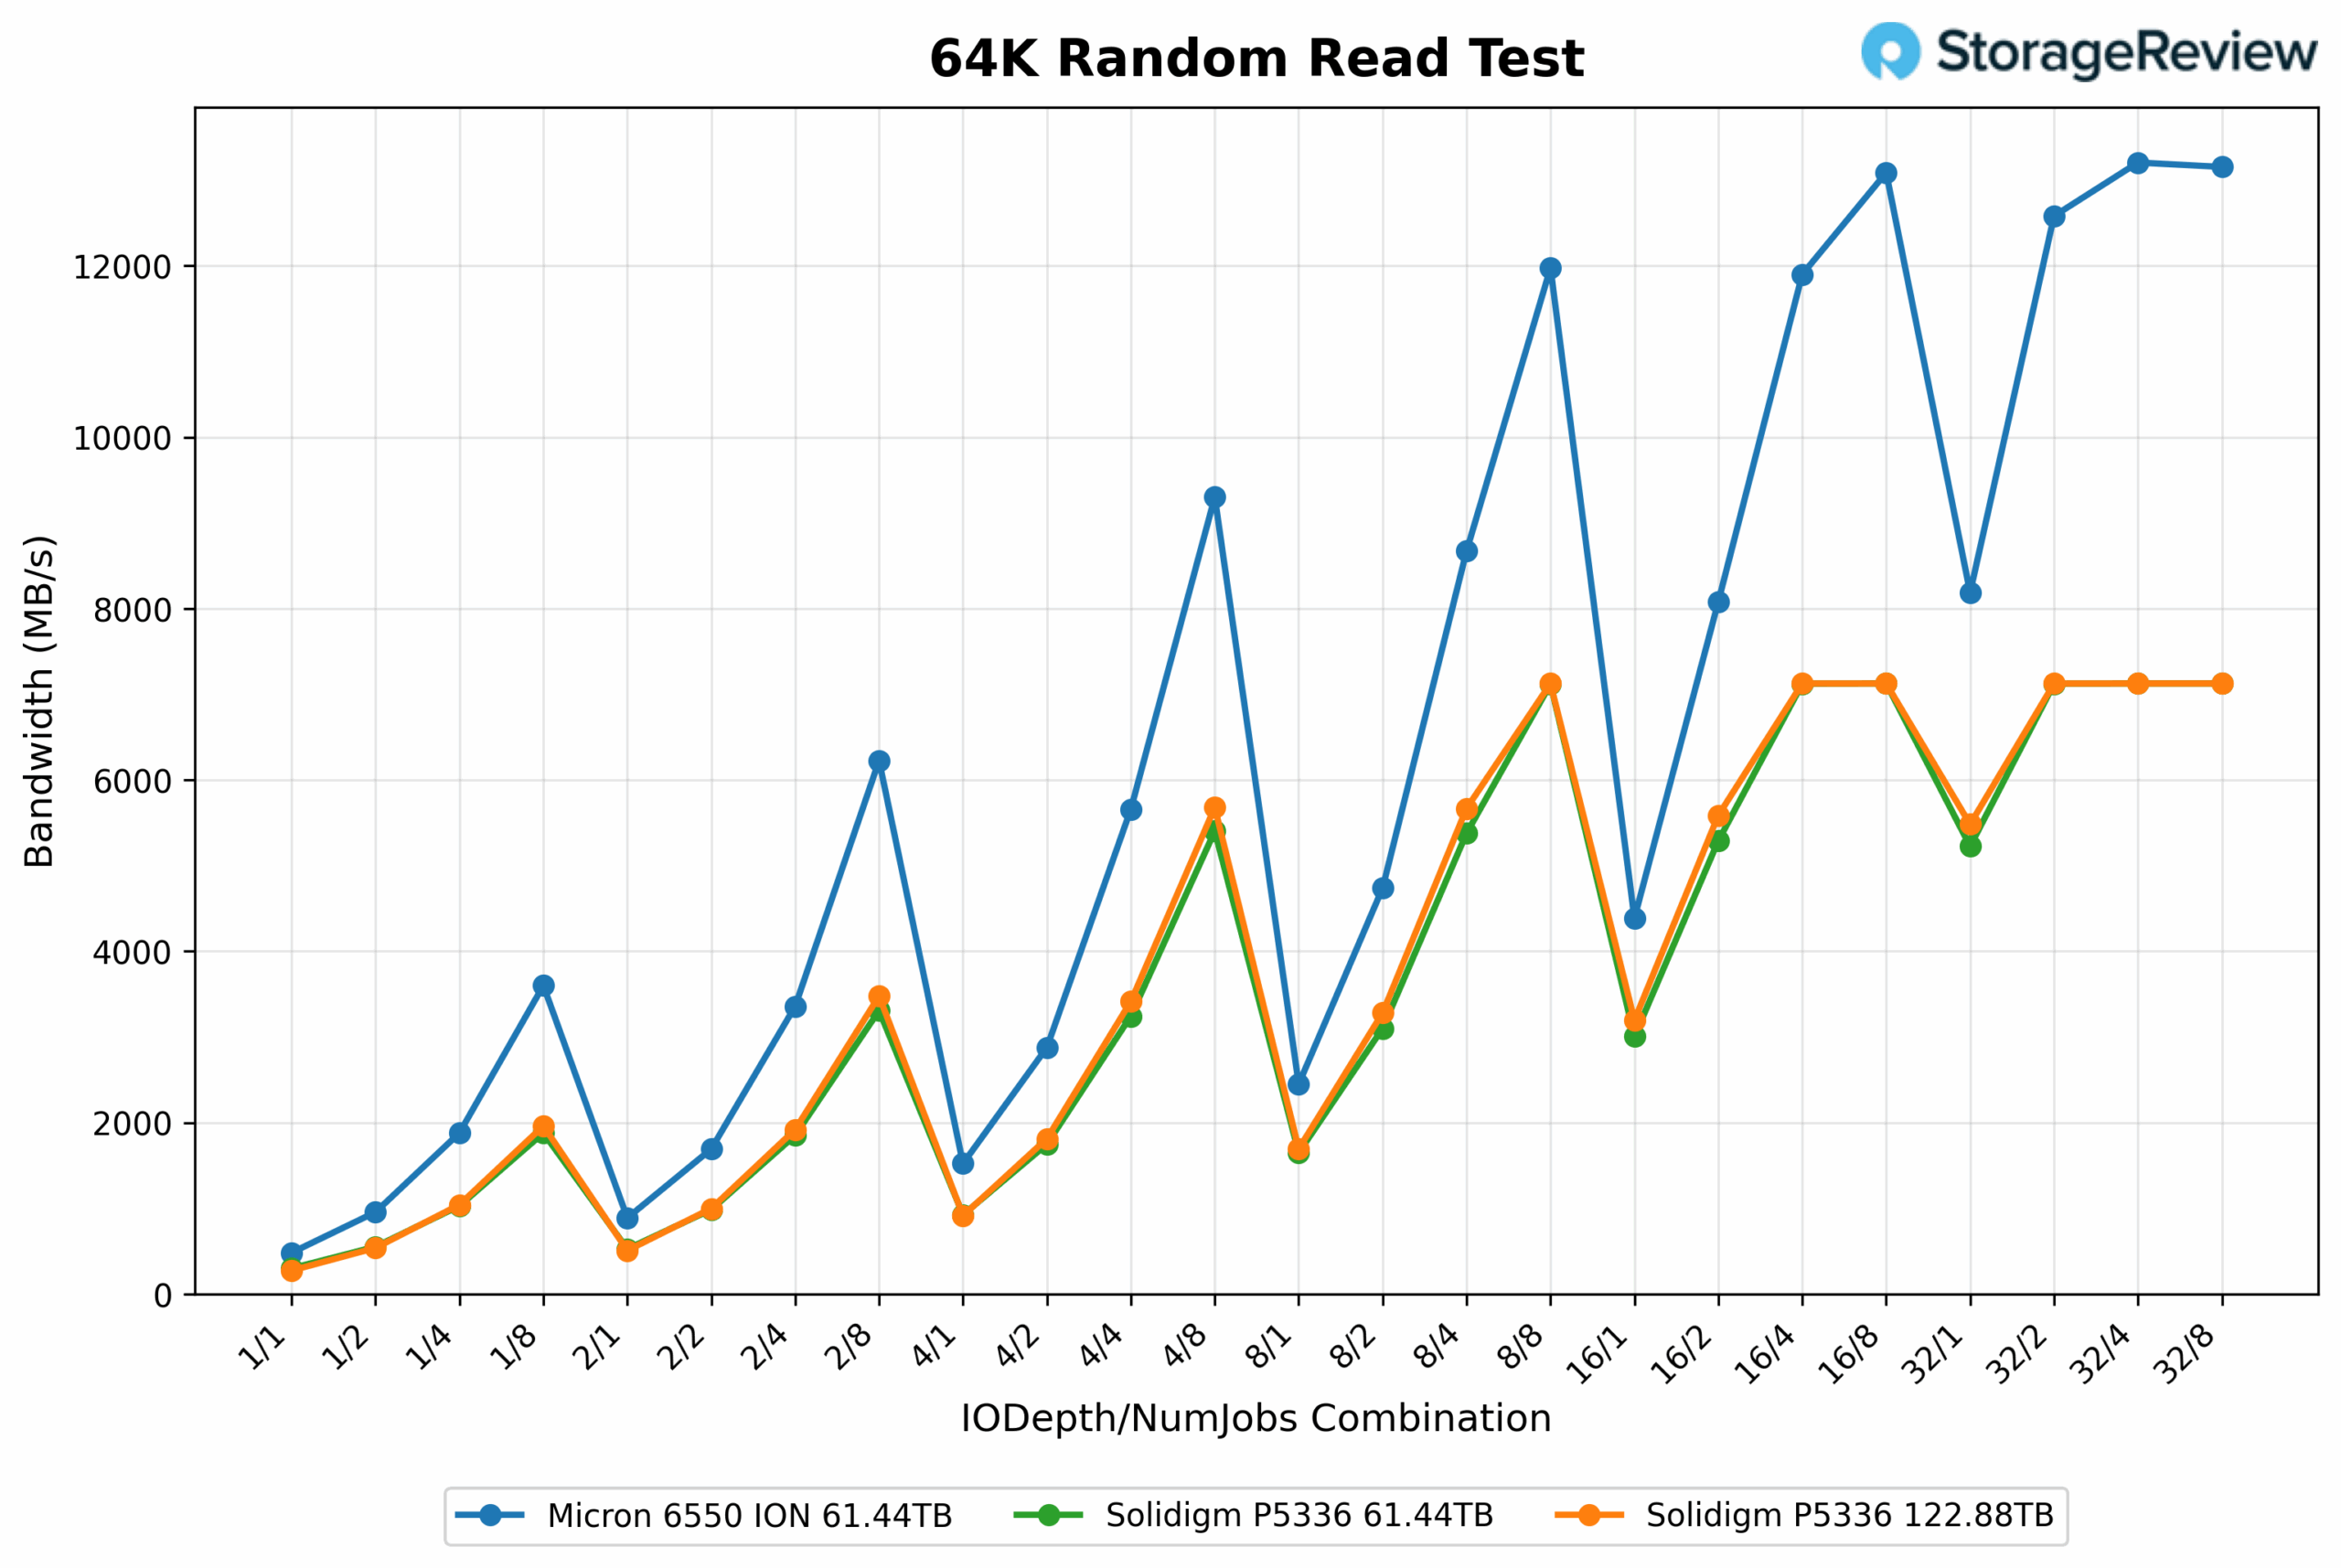
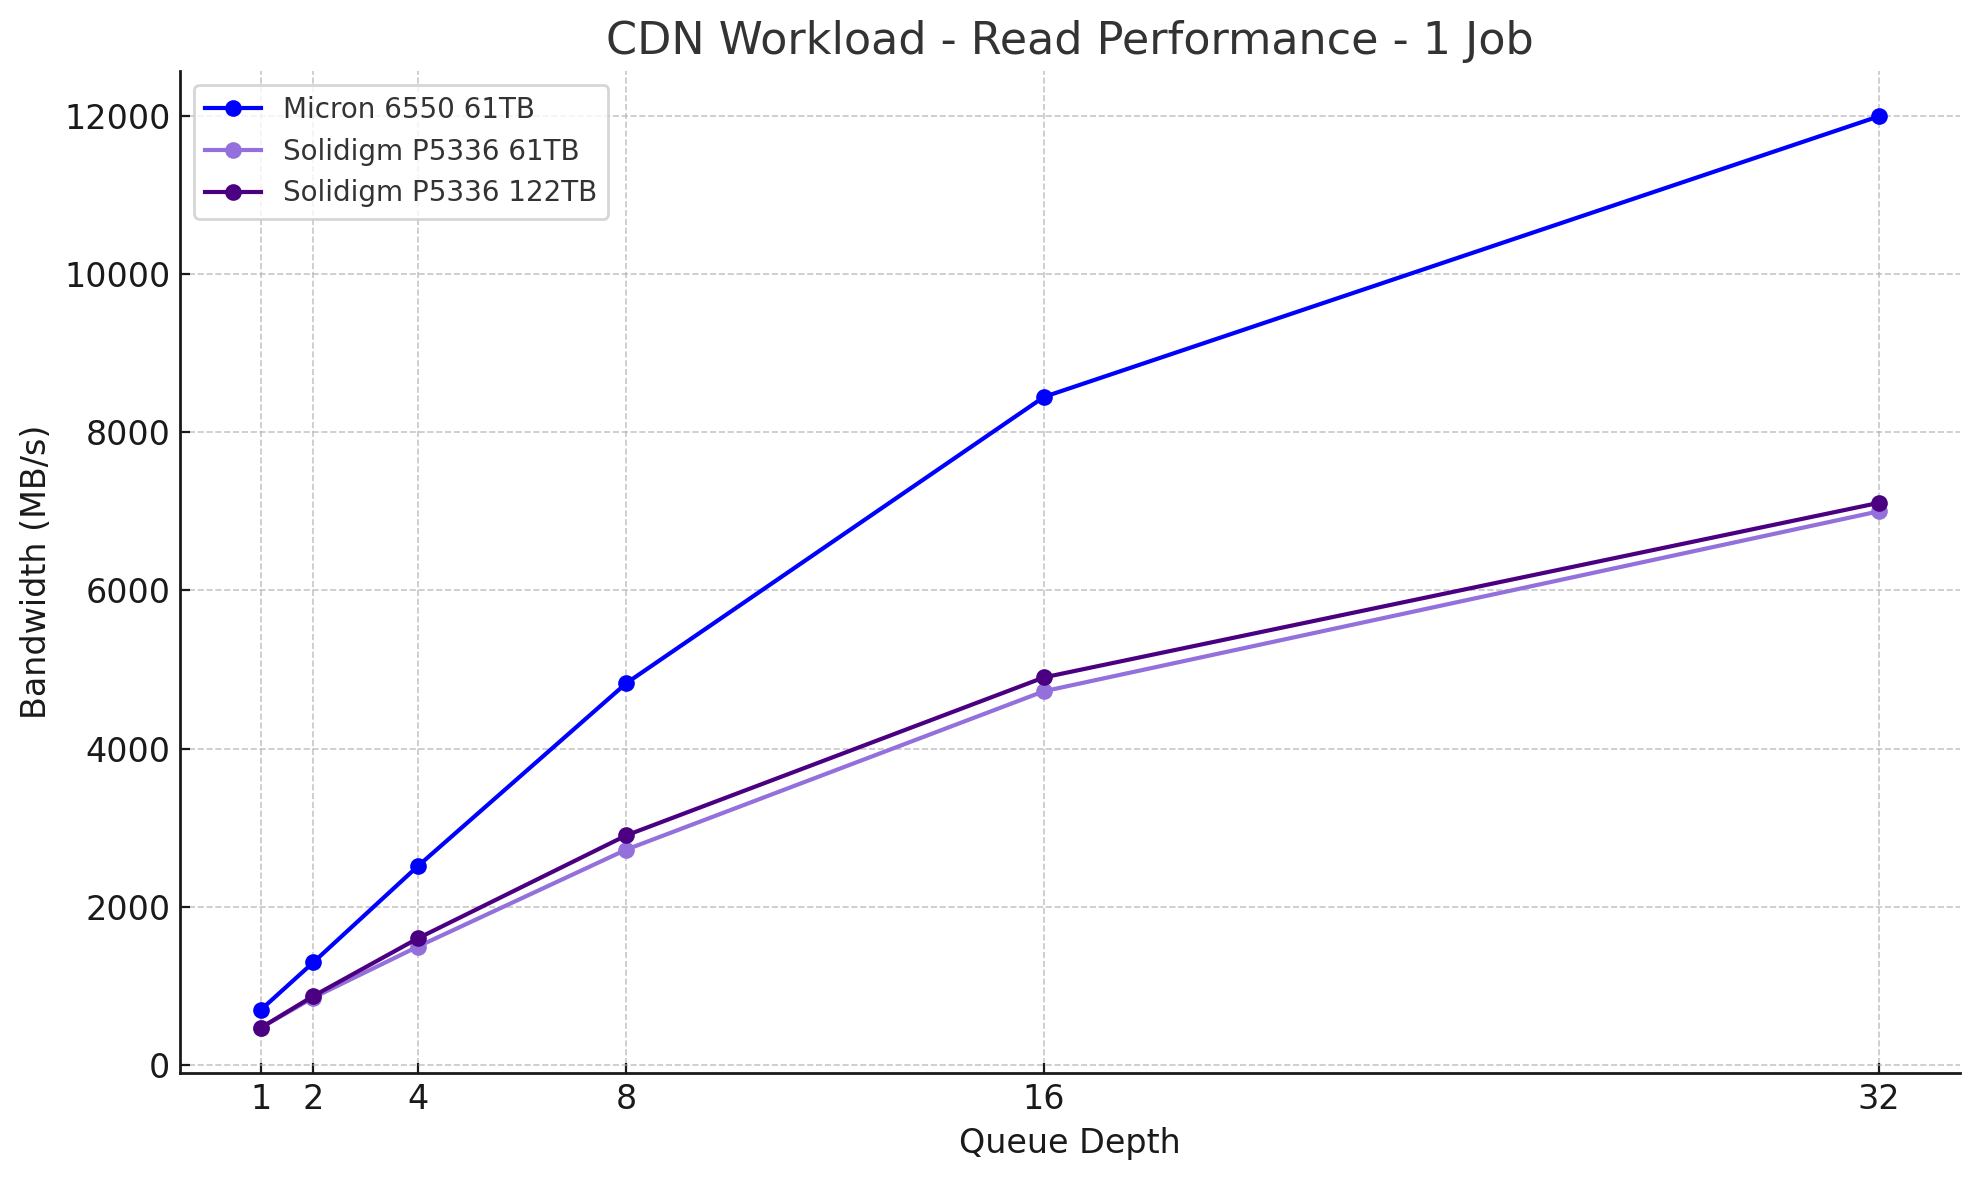 In this single-threaded read test simulating light content delivery traffic, the Solidigm P5336 122.88TB and Solidigm P5336 61.44TB exhibit consistent scaling characteristics. The 122.88TB model reaches 7,109MB/s at QD32, slightly ahead of the 61.44 TB’s 7,002MB/s. This near-identical scaling suggests that Solidigm’s higher-capacity model retains the same efficiency under light read pressure without performance degradation. In contrast, the Micron 6550 61.44TB scales much more aggressively, topping out at 12,288MB/s.
CDN Workload Read 2
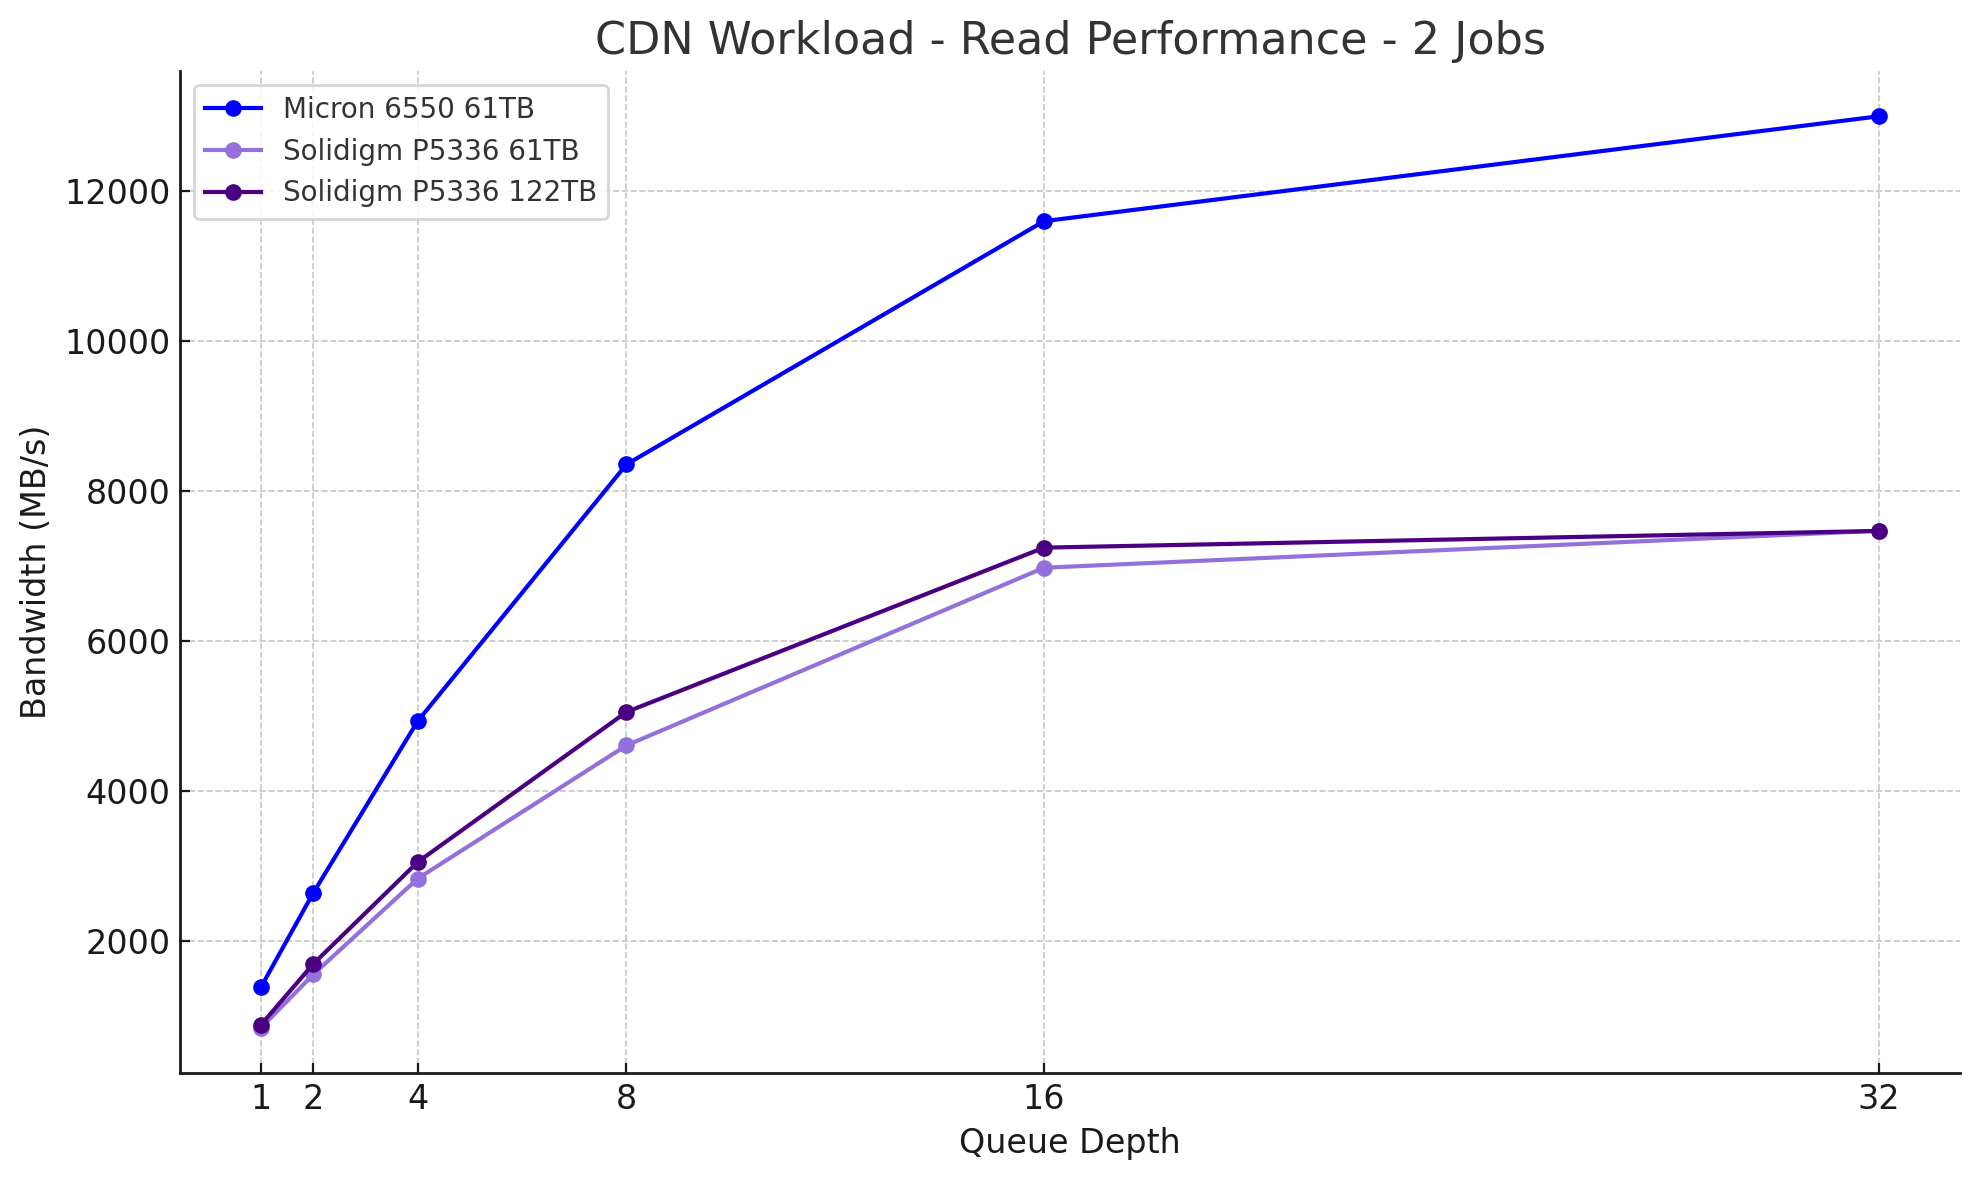 With two threads applied, the Solidigm P5336 122.88TB and P5336 61.44TB deliver nearly identical performance, scaling from 840MB/s at QD1 to approximately 7,467MB/s and 7,469MB/s respectively at QD32. Both drives demonstrate consistent gains up to QD16, after which throughput levels off, indicating a saturation point in their current architecture. For applications with moderate parallelism, this provides a reliable baseline for predictable scaling. The Micron 6550, in contrast, shows a higher overall scaling range, starting at 1,384MB/s and continuing upward to 13,312MB/s at QD32, reflecting the benefits of its TLC NAND and Gen5 interface.
CDN Workload Read 4
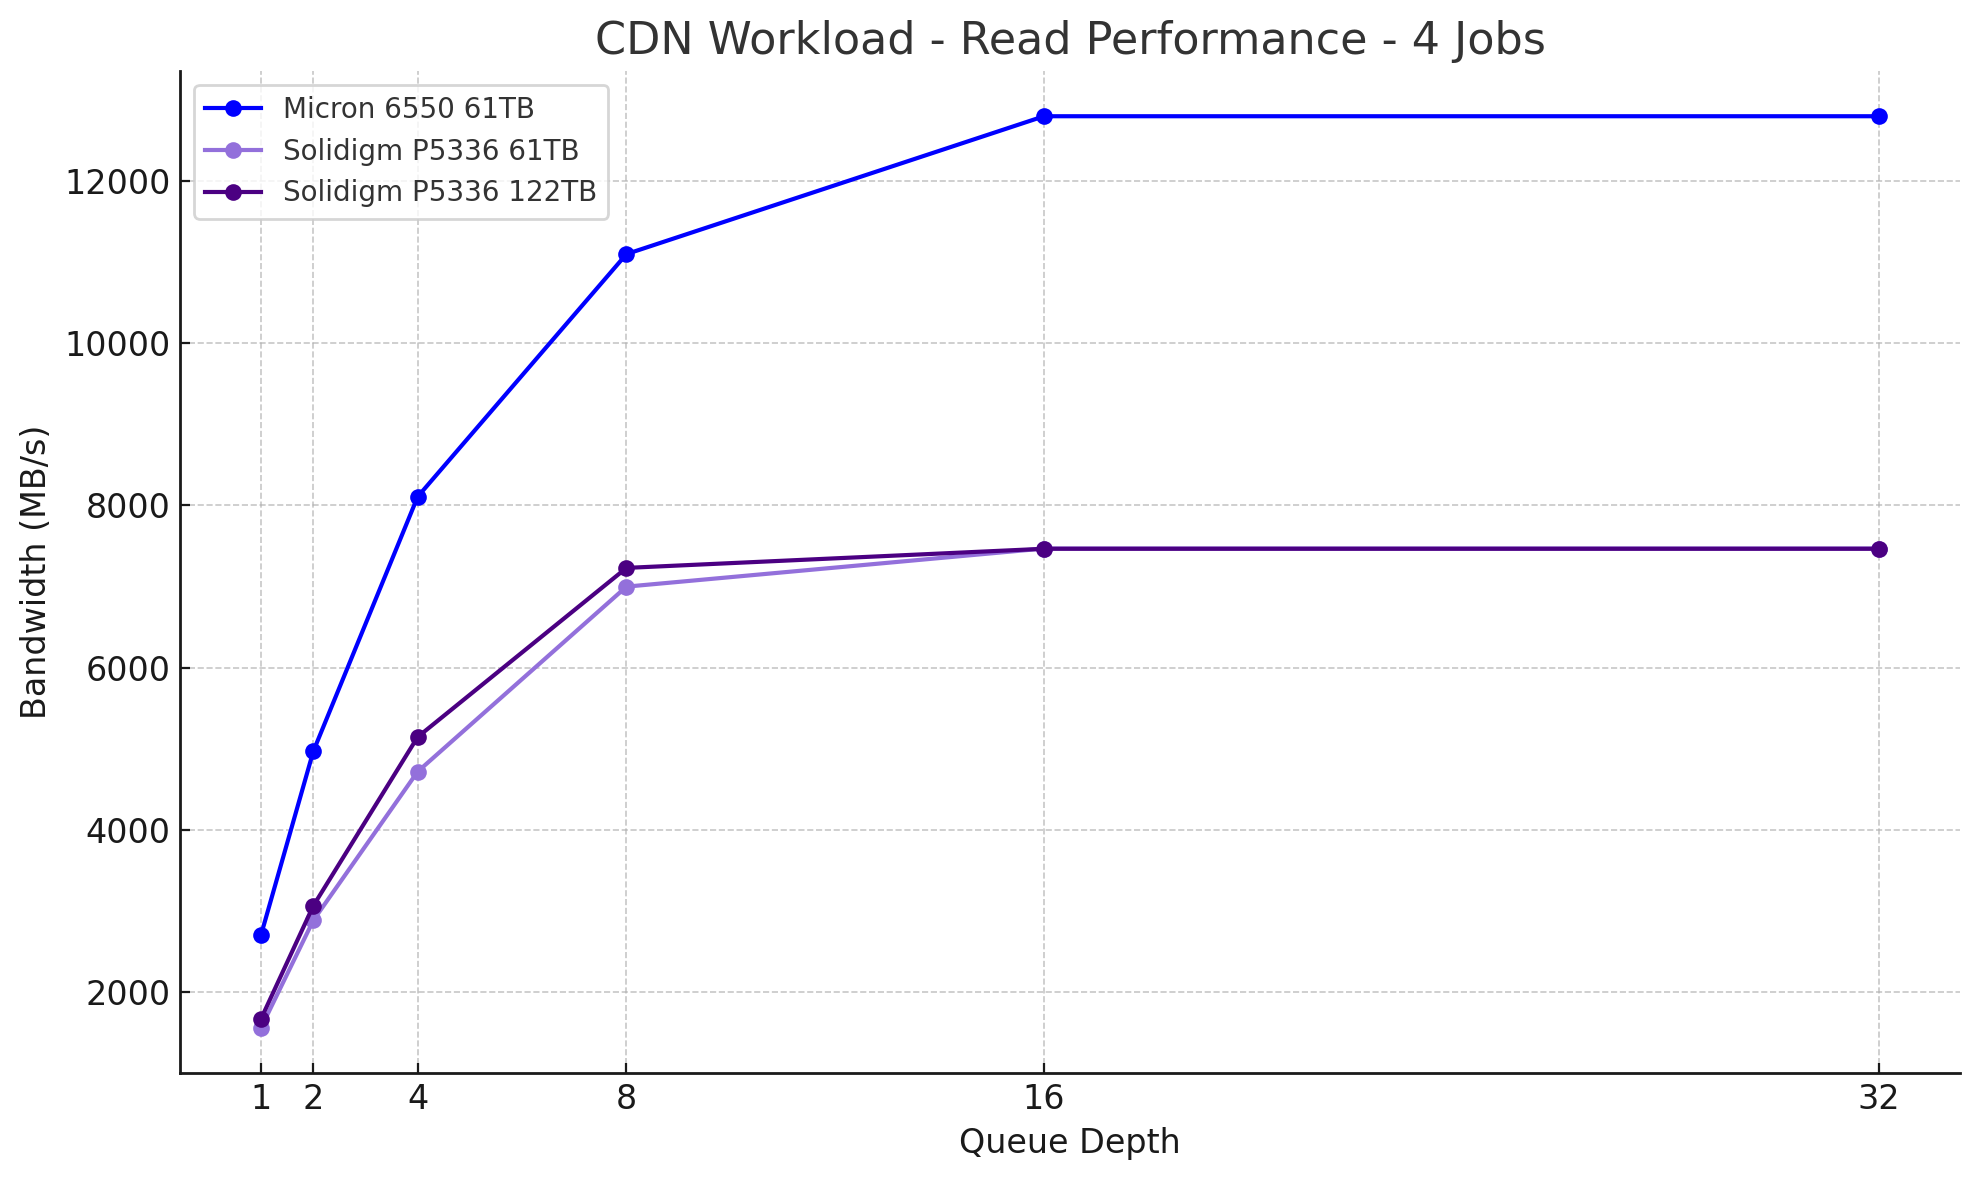 This high-demand read scenario places greater stress on the drives with increased concurrency. The Solidigm P5336 122.88TB and P5336 61.44TB drives exhibit consistent scaling, reaching approximately 7,466–7,469MB/s at QD16 and maintaining stability through QD32. The results between the two capacities remain effectively identical, reinforcing Solidigm’s consistent controller behavior across its high-capacity lineup. In comparison, the Micron 6550 achieved 13,107MB/s by QD16 and sustained that bandwidth through the remainder of the test.
CDN Workload Write 1
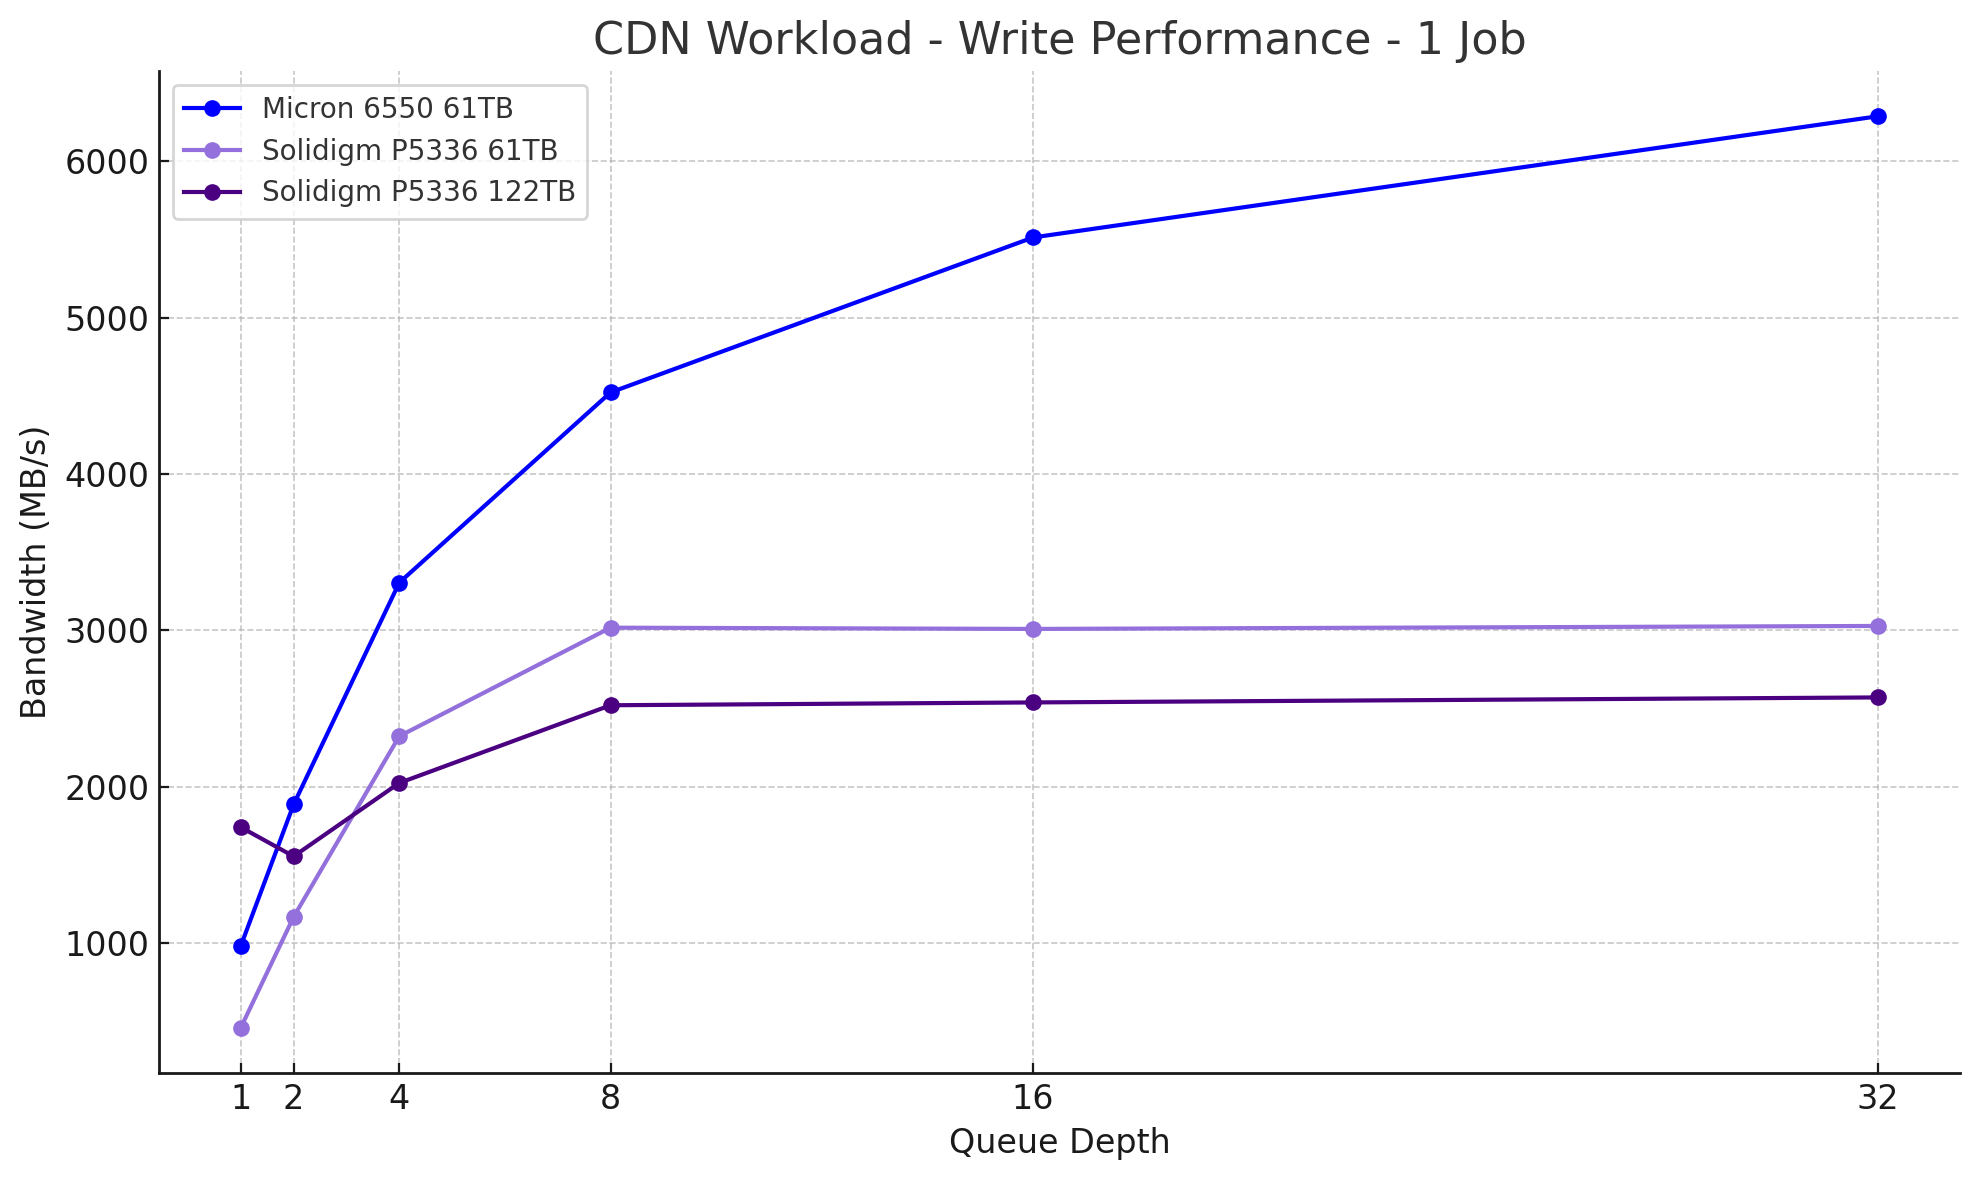 Transitioning into write performance under single-threaded conditions, the Solidigm P5336 122.88TB begins at 1,742MB/s and reaches approximately 2,572MB/s at QD32. The Solidigm P5336 61.44TB starts lower at 461MB/s but scales more aggressively, peaking at 3,029MB/s. The Micron 6550 starts at 984MB/s and continues scaling consistently through the queue depth range, reaching 6,288MB/s by QD32. The Solidigm models exhibit differing scaling characteristics, whereas Micron maintains a more linear progression across the test.
CDN Workload Write 2
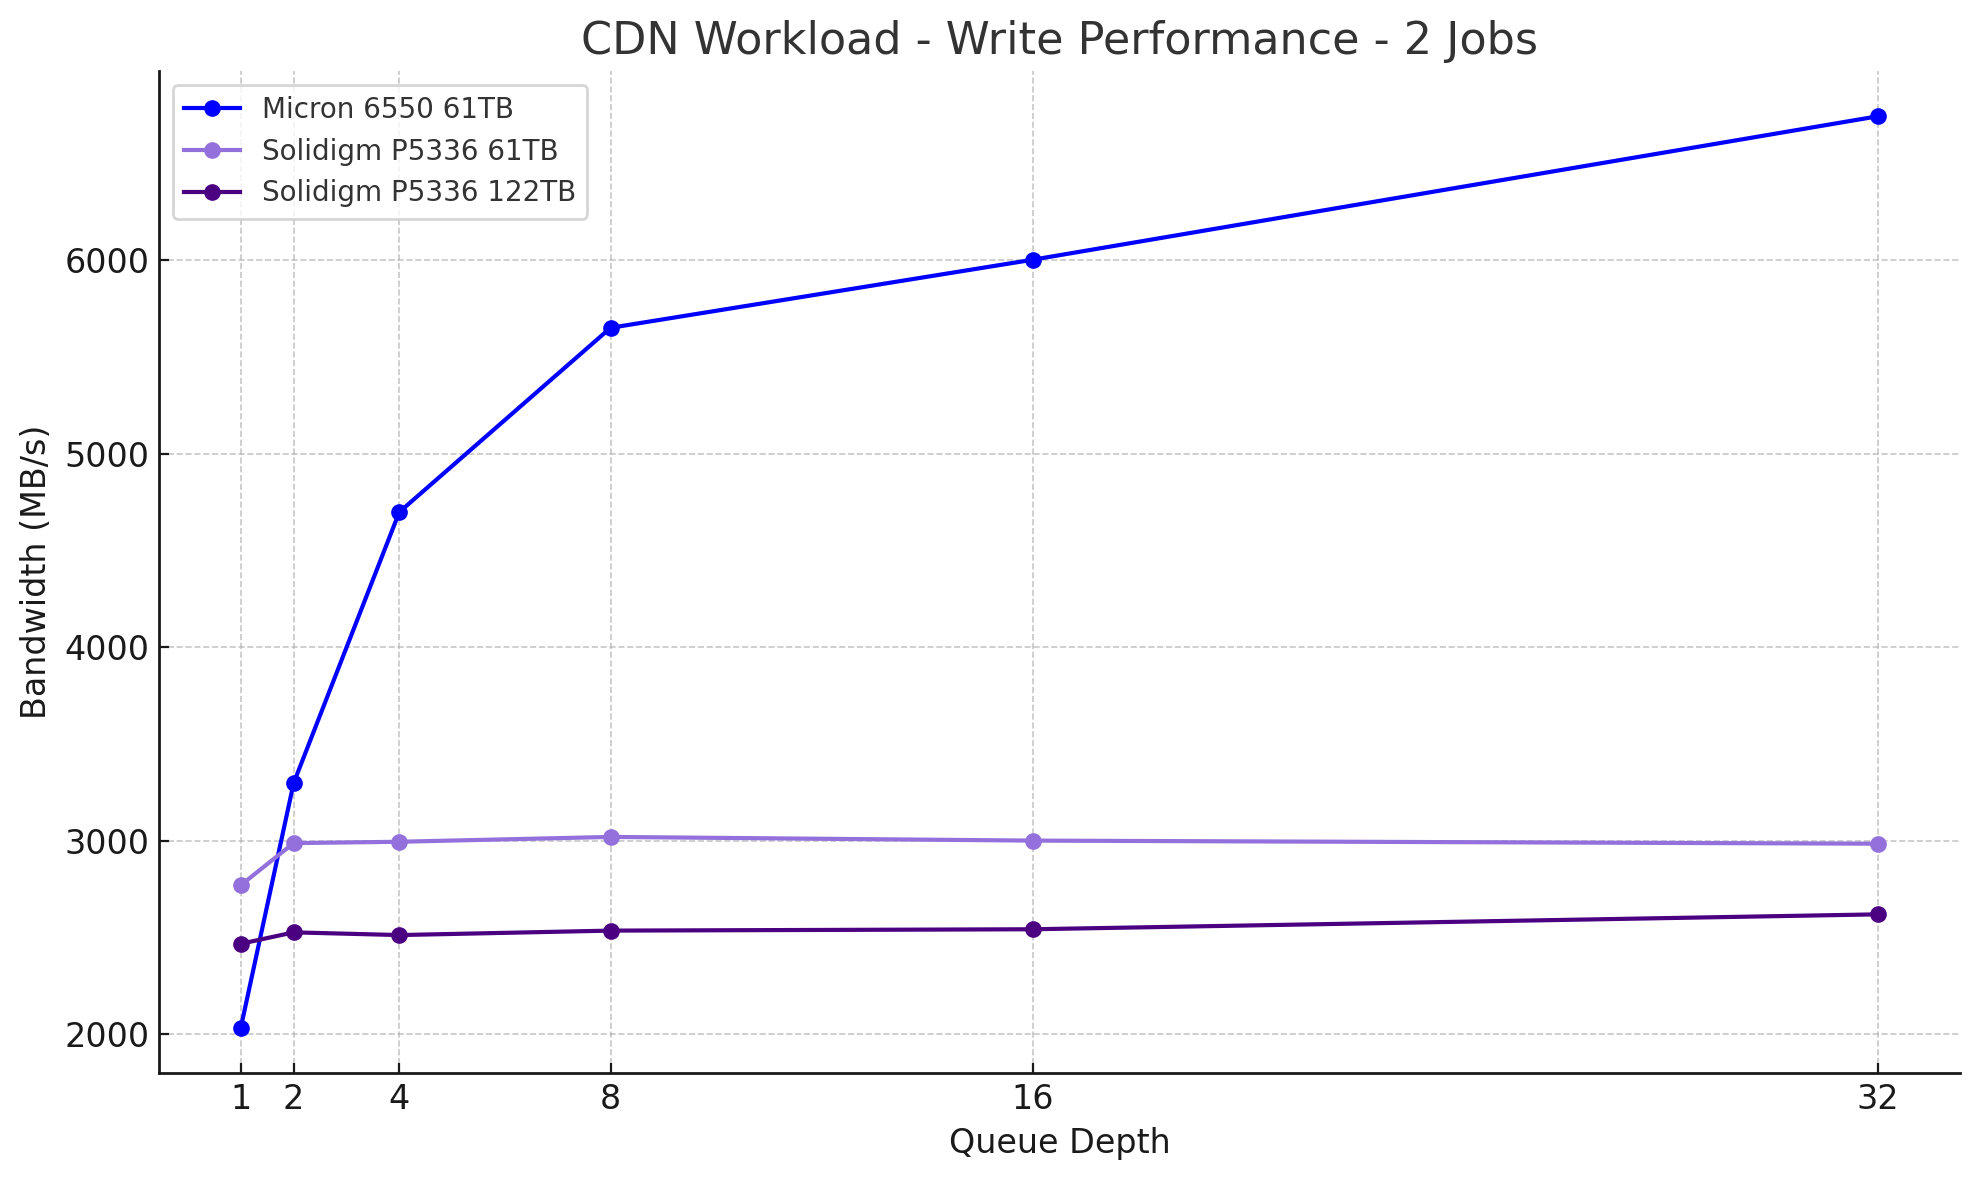 Moving into dual-threaded write performance, bandwidth increases for all three drives. The Solidigm P5336 61.44TB starts at 2,771MB/s and maintains relatively steady output through QD32, with only minor fluctuations. The Solidigm P5336 122.88TB operates within a narrower range, staying between 2,468MB/s and 2,620MB/s across all queue depths. The Micron 6550 exhibits continued scaling, beginning at 2,035MB/s and reaching 6,743MB/s by QD32. The Solidigm drives maintain consistent throughput, while the Micron shows a broader scaling profile over the same range.
CDN Workload Write 4
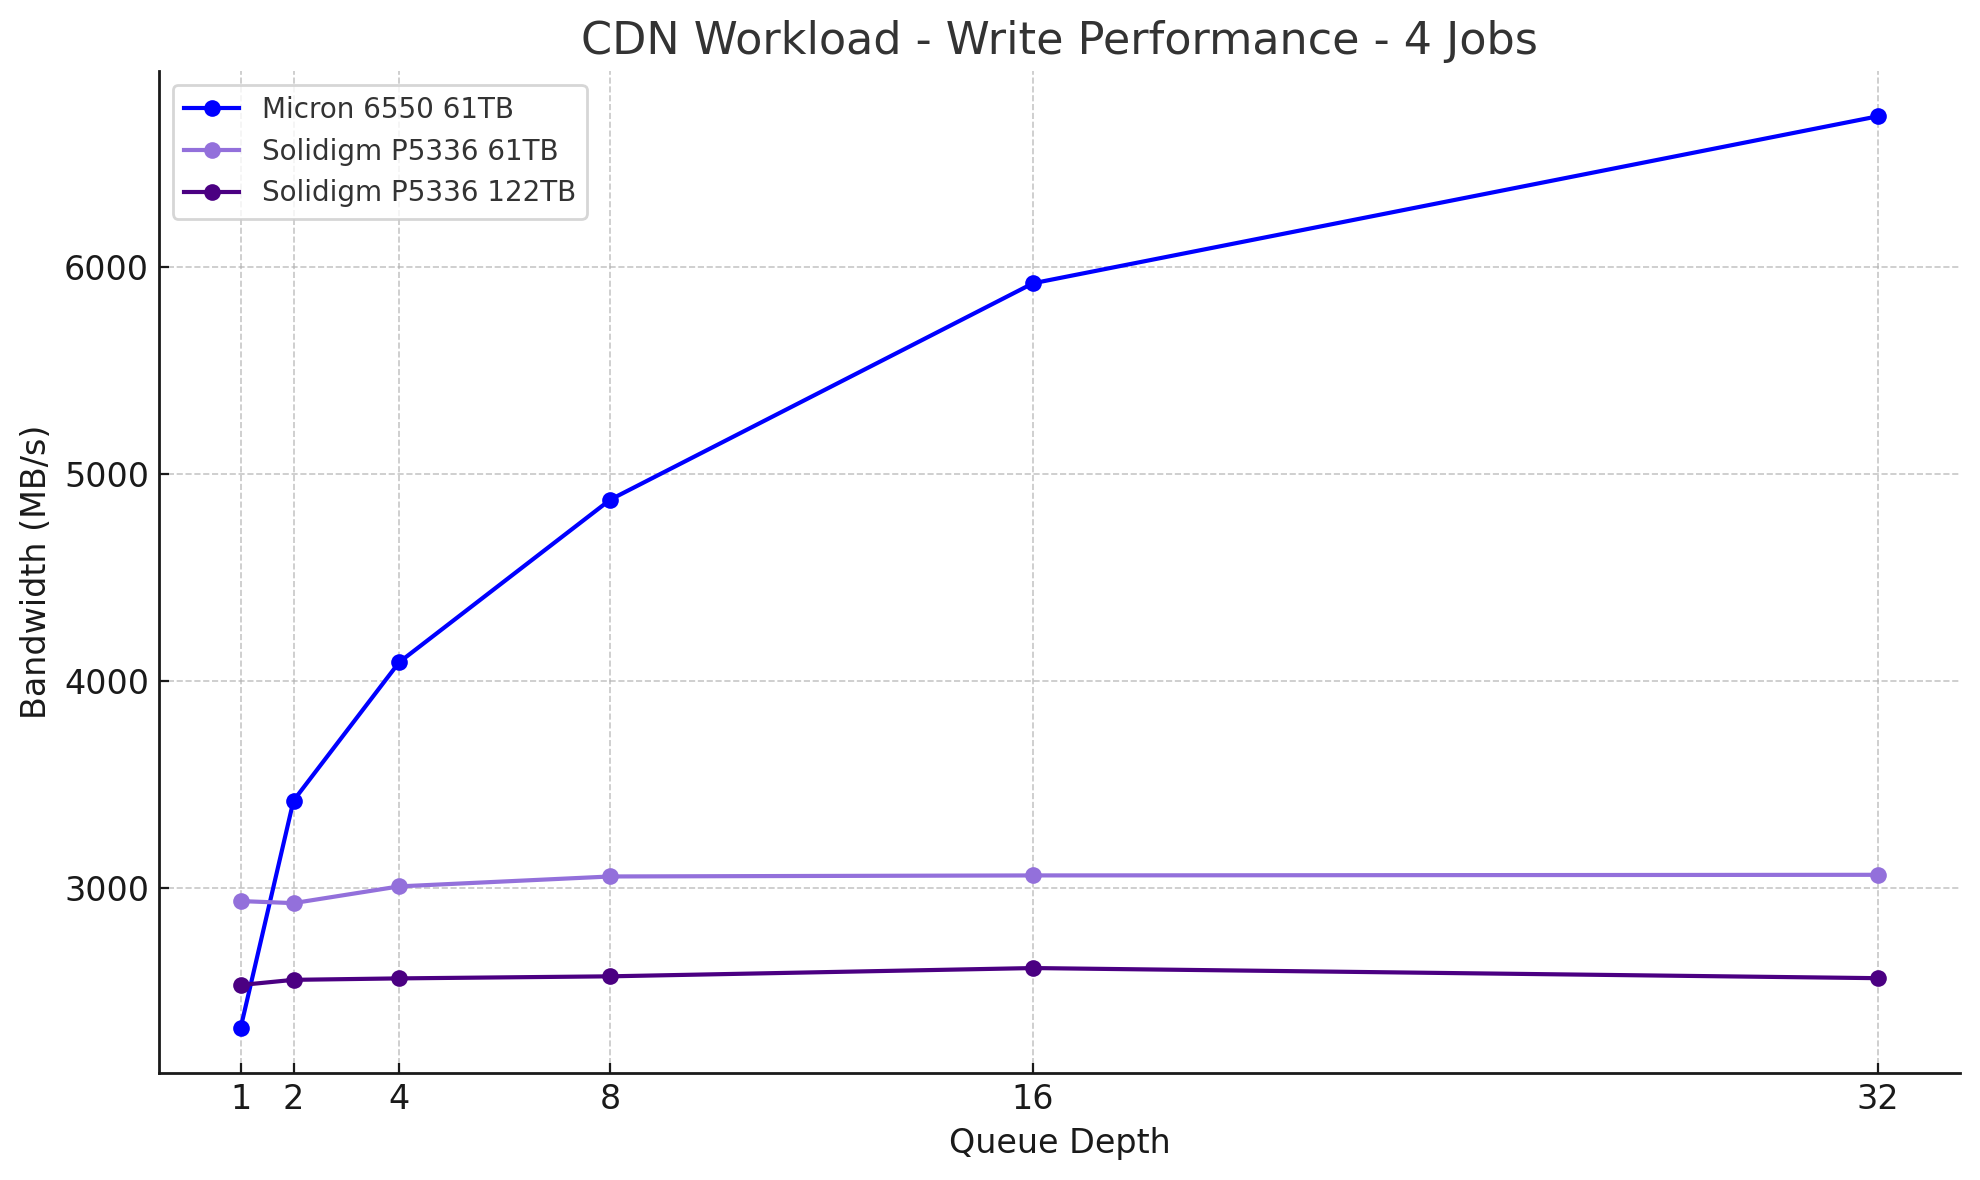 Under maximum concurrency, both Solidigm P5336 models show stable but limited scaling. The P5336 61.44TB starts at approximately 2,935MB/s and peaks at 3,062MB/s, while the P5336 122.88TB begins at 2,529MB/s and ends slightly lower at 2,562MB/s. This results in a roughly 16% lower peak throughput for the 122.88TB model compared to the 61.44TB version. The Micron 6550, on the other hand, scales steadily from 2,323MB/s to 6,731MB/s by QD32.
ObjectStorage Performance
This test leverages an FIO script approximating an ObjectStorage workload, with 65% of requests issued at a 64 KiB transfer size to represent common small-block operations, 15% at 8 MiB for mid-range streaming workloads, and another 15% at 64 MiB to stress the drive’s large-block handling. The final 5% at 1 GiB payload pushes the maximum sequential throughput. By interleaving these four block sizes in the specified proportions, it simulates a mixed workload that reveals both the controller’s agility under small I/O and its raw bandwidth capabilities under massive transfers.
Random Read (1 Thread, 40QD)
| Drive | Read Bandwidth (MB/s) | Read IOPS | Read Latency (ms) |
|---|---|---|---|
| Micron 6550 61TB | 13,444.10 | 3,165.10 | 12.5011 |
| Solidigm P5336 61TB | 7,117.38 | 1,673.76 | 23.4513 |
| Solidigm P5336 122TB | 7,101.97 | 1,674.78 | 23.4385 |
In this single-threaded, high-depth random read test, the Solidigm P5336 122.88TB and P5336 61.44TB perform nearly identically. The 122.88TB model reaches 7,101.97MB/s and 1,674.78 IOPS with a latency of 23.44ms, while the 61.44TB variant measures 7,117.38MB/s and 1,673.76 IOPS at 23.45ms. The difference in bandwidth between the two Solidigm capacities is under 0.25%, highlighting consistent performance across the P5336 line for random read workloads.
The Micron 6550 delivers significantly higher performance, reaching 13,444.10 MB/s and 3,165.10 IOPS with a lower latency of 12.50ms. Its advantage in this scenario is influenced by its use of TLC NAND and a PCIe Gen5 interface, both of which contribute to stronger random read throughput and responsiveness compared to the QLC-based, Gen4 Solidigm drives.
Sequential Read (1 Thread, 40QD)
| Drive | Read Bandwidth (MB/s) | Read IOPS | Read Latency (ms) |
|---|---|---|---|
| Micron 6550 61TB | 13,955.46 | 223.32 | 174.723 |
| Solidigm P5336 61TB | 7,098.64 | 114.12 | 341.727 |
| Solidigm P5336 122TB | 7,103.98 | 114.60 | 340.322 |
Moving on to sequential read performance, the Solidigm P5336 122.88TB and P5336 61.44TB show nearly identical results. The 122.88TB model reaches 7,103.98MB/s with 114.60 IOPS and a latency of 340.32ms, while the 61.44TB version comes in at 7,098.64MB/s, 114.12 IOPS, and 341.73ms. The difference in performance between the two is less than 0.1%, reflecting consistent behavior across both capacities in sustained sequential read workloads. The Micron 6550 measures significantly higher at 13,955.46MB/s and 223.32 IOPS with 174.72ms latency, offering roughly 96% higher throughput than either Solidigm model in this test.
Random Read (4 Thread, 10QD)
| Drive | Read Bandwidth (MB/s) | Read IOPS | Read Latency (ms) |
|---|---|---|---|
| Micron 6550 61TB | 13,301.67 | 3,142.01 | 12.5619 |
| Solidigm P5336 61TB | 7,131.65 | 1,686.98 | 22.9787 |
| Solidigm P5336 122TB | 7,131.95 | 1,690.84 | 22.9315 |
Moving to read at four threads and a queue depth of 10, the Solidigm P5336 122.88TB records 7,131.95MB/s, 1,690.84 IOPS, and 22.93ms latency. The Solidigm P5336 61.44TB comes in just behind at 7,131.65MB/s and 1,686.98 IOPS, with a latency of 22.98ms. The difference in bandwidth between the two models is less than 0.005 %. The Micron 6550 achieves 13,301.67MB/s and 3,142.01 IOPS with a latency of 12.56ms, offering approximately 86% more throughput than either Solidigm drive.
Sequential Read (4 Thread, 10QD)
| Drive | Read Bandwidth (MB/s) | Read IOPS | Read Latency (ms) |
|---|---|---|---|
| Micron 6550 61TB | 13,524.00 | 218.06 | 171.040 |
| Solidigm P5336 61TB | 7,130.97 | 115.03 | 315.565 |
| Solidigm P5336 122TB | 7,130.99 | 114.72 | 316.304 |
In this four-thread sequential read test at queue depth 10, the Solidigm P5336 122.88TB reaches 7,130.99MB/s with 114.72 IOPS and 316.30ms latency. The Solidigm P5336 61.44TB latency matches closely at 7,130.97MB/s, 115.03 IOPS, and 315.57ms. The two models exhibit nearly identical sequential performance across capacities, with a difference of less than 0.01%. The Micron 6550 outputs 13,524.00MB/s and 218.06 IOPS with a latency of 171.04ms, providing approximately 89% higher throughput than either Solidigm drive under the same conditions.
DLIO Checkpointing Benchmark
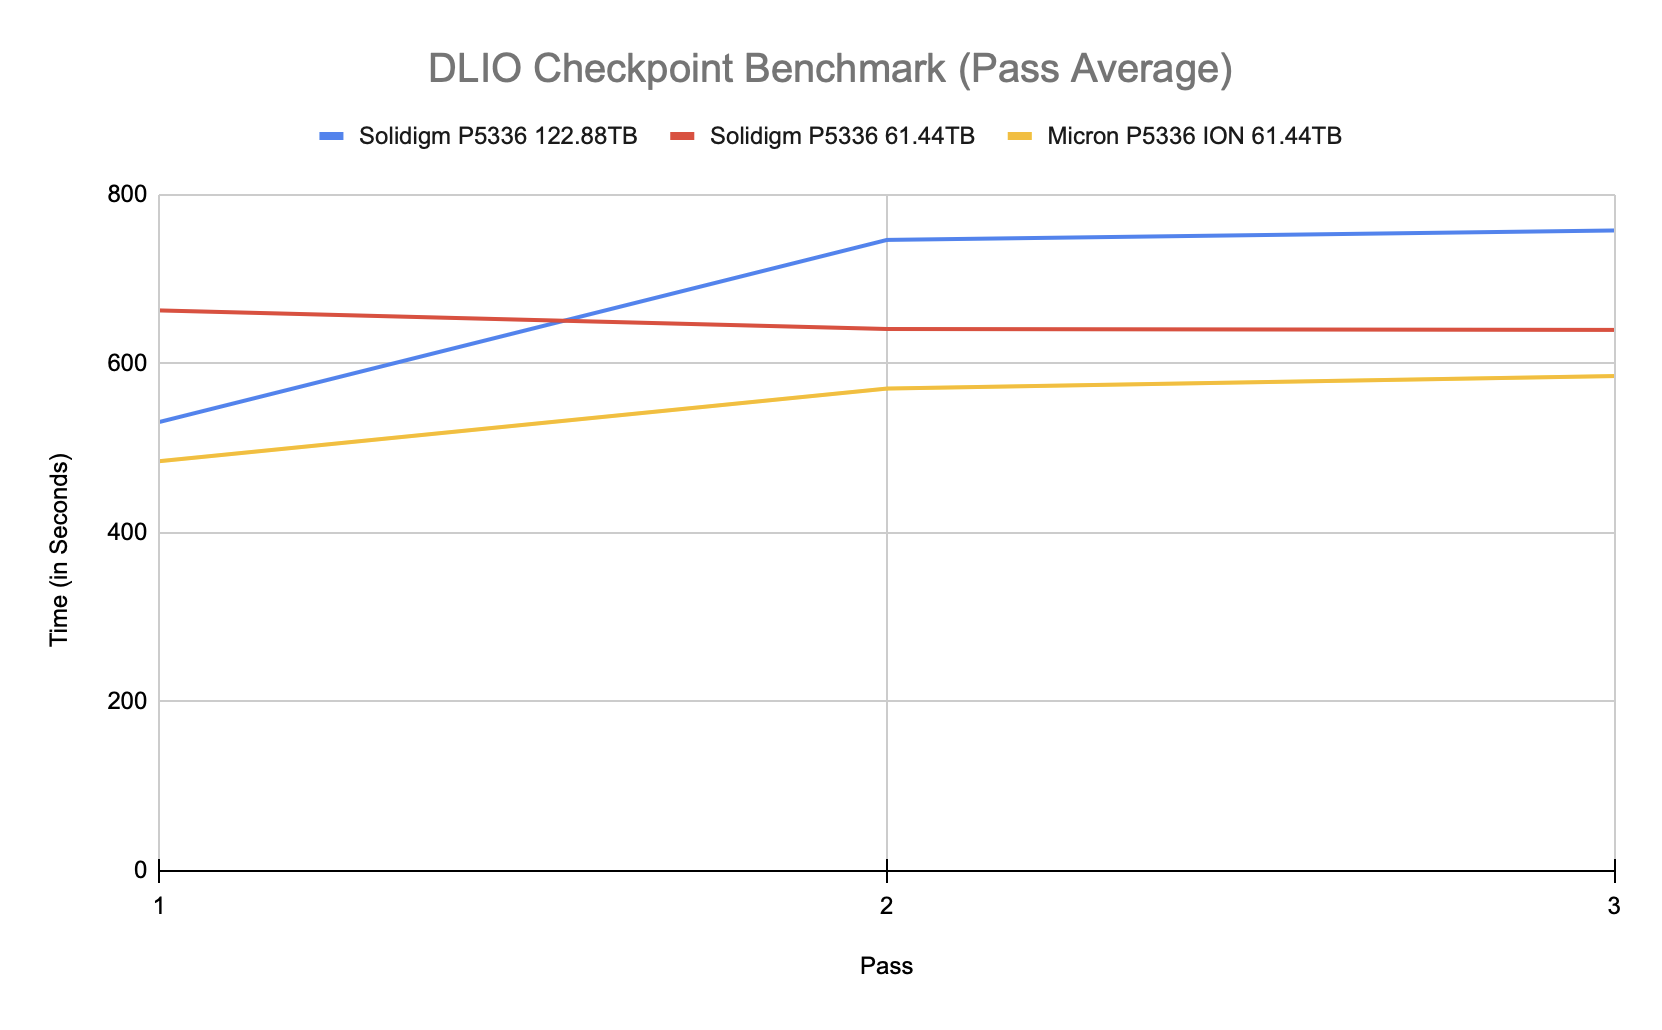
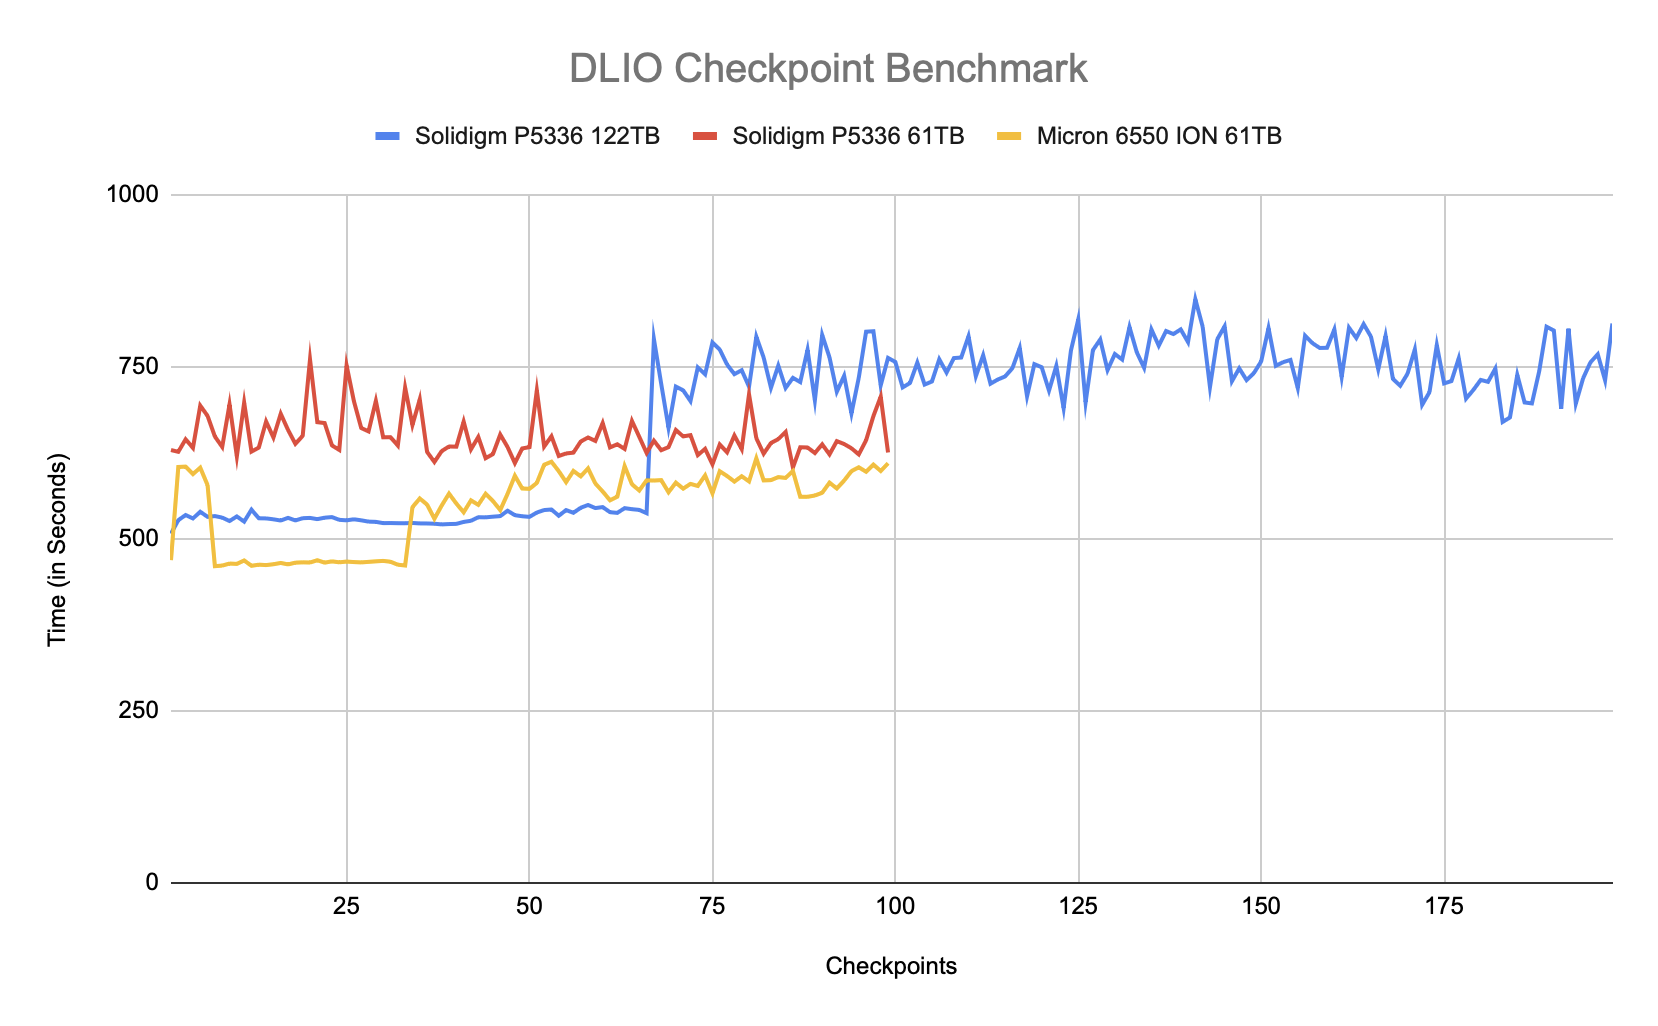
To evaluate SSD real-world performance in AI training environments, we utilized the Data and Learning Input/Output (DLIO) benchmark tool. Developed by Argonne National Laboratory, DLIO is specifically designed to test I/O patterns in deep learning workloads. It provides insights into how storage systems handle challenges such as checkpointing, data ingestion, and model training. The chart below illustrates how both drives handle the process across 99 checkpoints (198 for the 122TB). When training machine learning models, checkpoints are essential for saving the model’s state periodically, preventing loss of progress during interruptions or power failures. This storage demand requires robust performance, especially under sustained or intensive workloads. We used DLIO benchmark version 2.0 from the August 13, 2024, release.
To ensure our benchmarking reflected real-world scenarios, we based our testing on the LLAMA 3.1 405B model architecture. We implemented checkpointing using torch.save() to capture model parameters, optimizer states, and layer states. Our setup simulated an eight-GPU system, implementing a hybrid parallelism strategy with 4-way tensor parallel and 2-way pipeline parallel processing distributed across the eight GPUs. This configuration resulted in checkpoint sizes of 1,636GB, representative of modern large language model training requirements.
Comparing the 61TB and 122TB Solidigm P5336 in checkpoint performance, the 122TB SSD sees longer checkpoint times once the drive is filled up. In the first pass, the gap between the two SSDs is approximately 20% faster for the 122 TB version than for the 61TB version, while in the second and third passes, it is tracked at 16.4% and 18.4% slower, respectively. The 61TB Micron 6550 comes in with an average checkpoint time of 585 seconds in the third pass, compared to 640 seconds by the 61TB P5336 and 757 seconds by the 122TB P5336.
The 122TB Solidigm P5336 has a unique advantage out of the gate when it comes to checkpoints; it can hold a lot of them. While the 61TB SSDs top out at 33 checkpoints per pass, the 122TB model can fit 66 of them before reaching capacity. While the average time-per-pass chart above somewhat obscures the amounts, the per-checkpoint time view helps to illustrate the capacity advantage. Both Solidigm SSDs stabilize after the first pass of checkpoints complete, while the Micron 6550 is relatively consistent throughout the test, trending faster.
FIO Performance Benchmark
To measure the storage performance of each SSD across common industry metrics, we leverage FIO. Each drive is run through the same testing process, which includes a preconditioning step of two full drive fills with a sequential write workload, followed by measurement of steady-state performance. As each workload type being measured changes, we run another preconditioning fill of that new transfer size.
In this section, we focus on the following FIO benchmarks:
- 128K Sequential
- 64K Random
- 16K Random
- 4K Random
With the high-capacity QLC SSDs designed for large transfer sizes, our write speed tests stop at 16K random. For 4K, we leverage the pre-filled state from the 16K workload to measure only 4K random read performance.
128K Sequential Precondition (IODepth 256 / NumJobs 1)
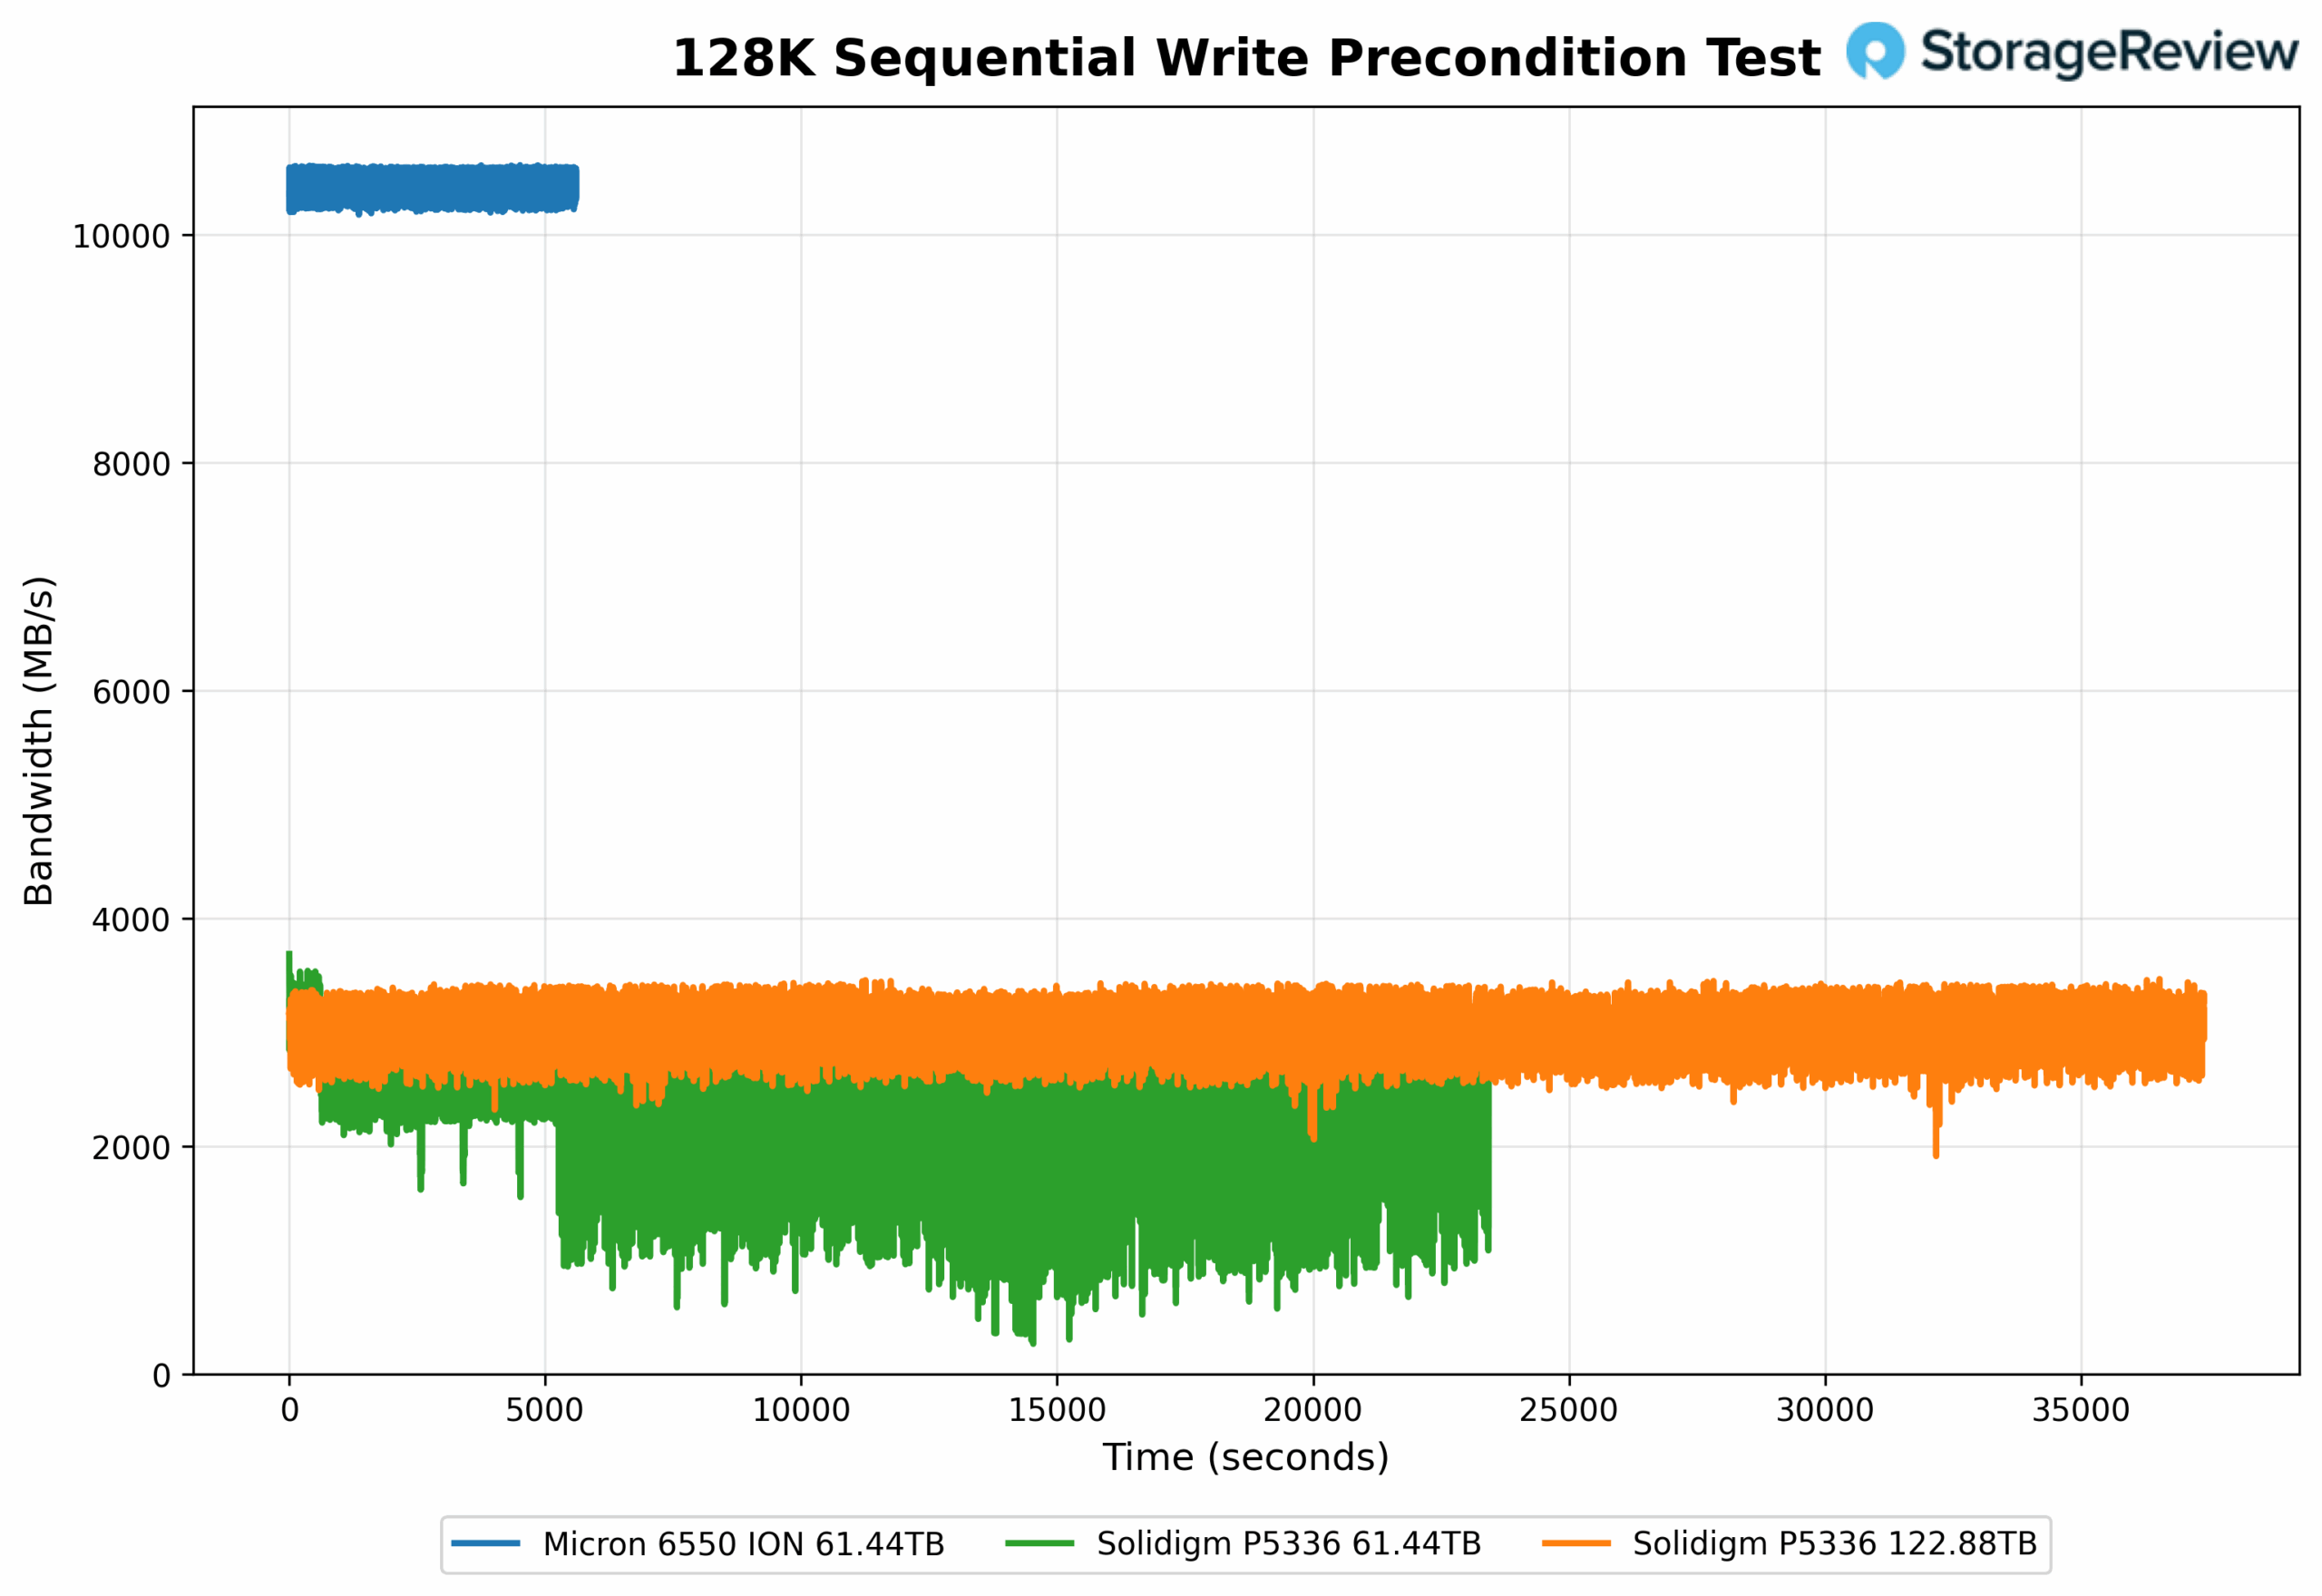
In this heavy queue-depth preconditioning test, the Solidigm P5336 122.88TB achieves 3,134 MB/s, while the P5336 61.44TB reaches 2,500.9 MB/s. This represents a 25.3% improvement in write bandwidth for the higher-capacity model. The Micron 6550 tops the chart at 10,455.3 MB/s. Although both Solidigm models trail the Micron in raw throughput, the performance gap between the 122TB and 61TB models highlights optimization at scale within the same P5336 platform, with the larger drive showing clear gains in sustained sequential write handling. While the Micron 6550 appears to have a much smaller preconditioning stage, its higher write speed enabled it to complete the first fill much faster.
128K Sequential Precondition Latency (IODepth 256 / NumJobs 1)
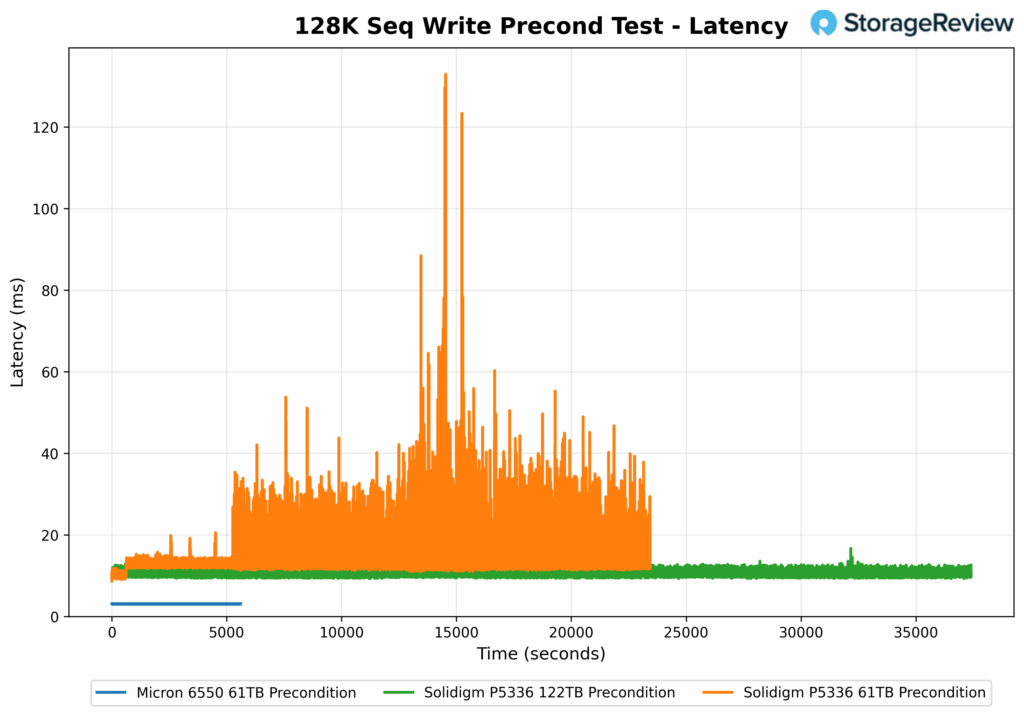
In terms of latency during the preconditioned 128K sequential write, the Micron 6550 records the lowest value at 3.06ms. The Solidigm P5336 122.88TB follows at 10.21ms, while the P5336 61.44TB comes in at 12.80ms. This marks a 20.2% latency reduction for the 122.88TB model compared to the 61.44TB model, reflecting more efficient and steady latency, and demonstrating improvements made within the Solidigm P5336 series.
128K Sequential Write (IODepth 16 / NumJobs 1)
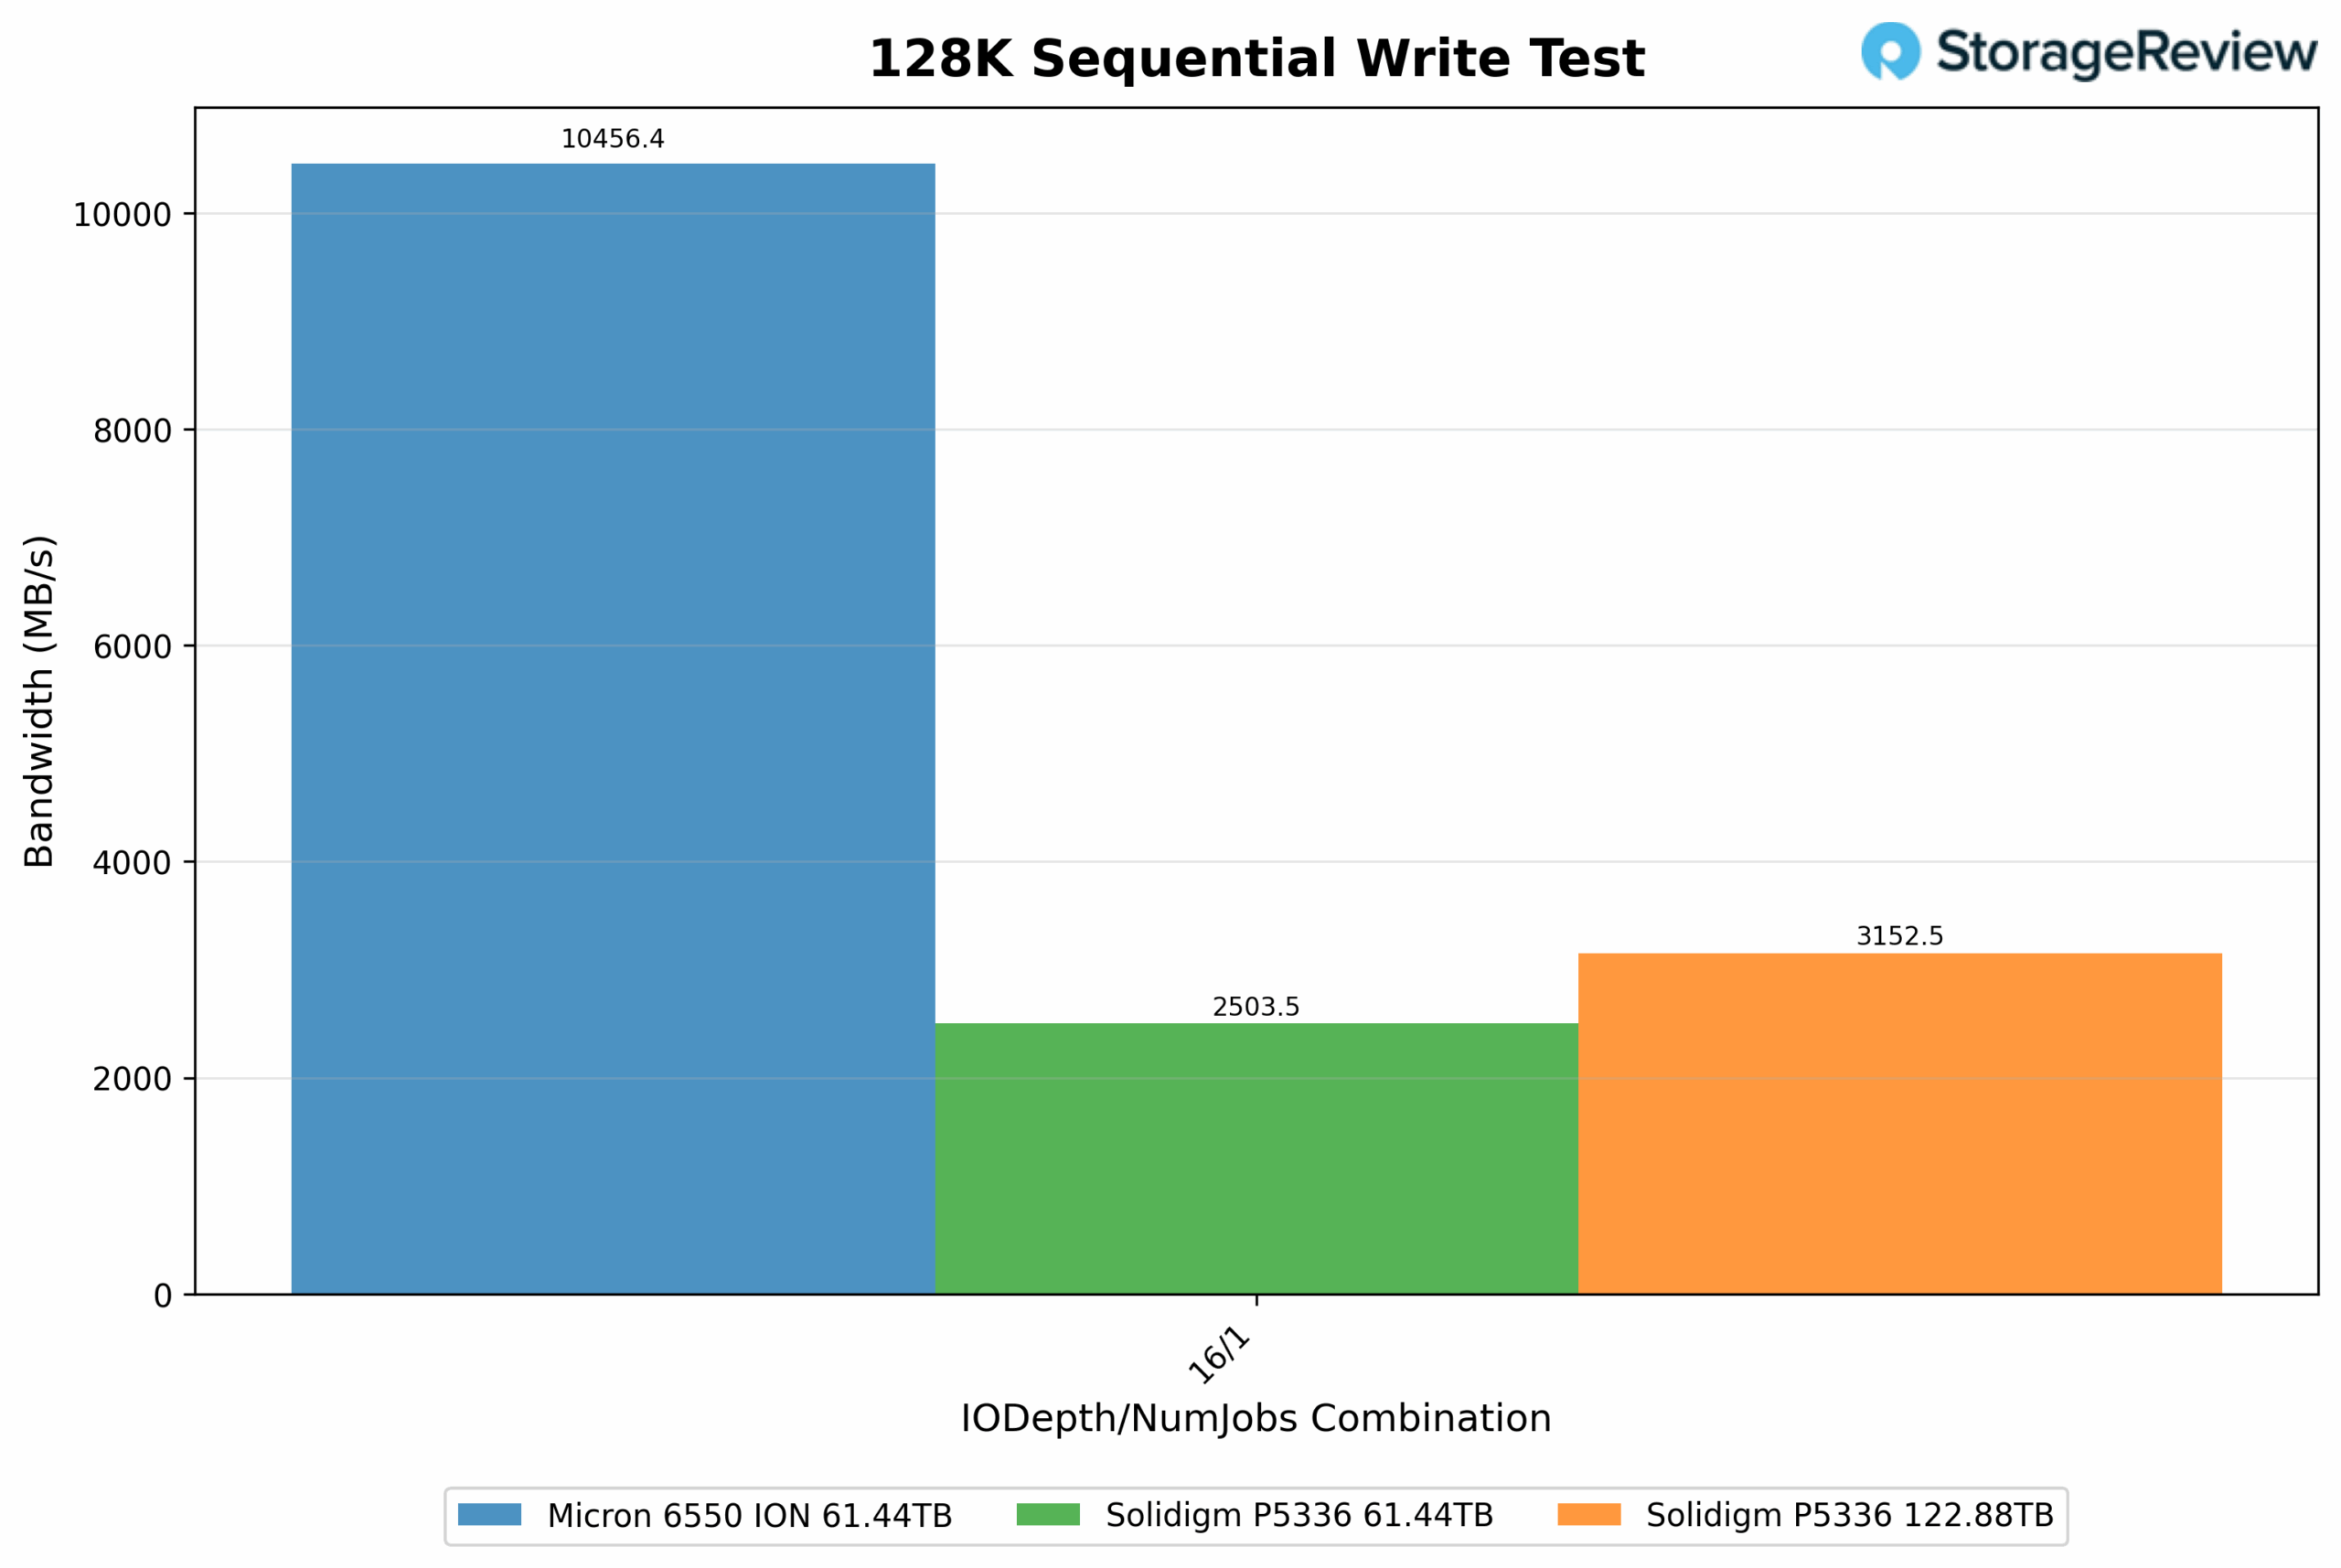
In this sequential write test using a queue depth of 16 and a single job, the Solidigm P5336 122.88TB reaches 3,152.5MB/s with 25,220 IOPS. The P5336 61.44TB model trails at 2,503.5MB/s and 20,030 IOPS, resulting in a 25.9% improvement in throughput compared to the 122 TB model. The Micron 6550 achieves the highest overall performance at 10,456.4MB/s and 83,650 IOPS, surpassing both Solidigm drives.
128K Sequential Write Latency (IODepth 16 / NumJobs 1)
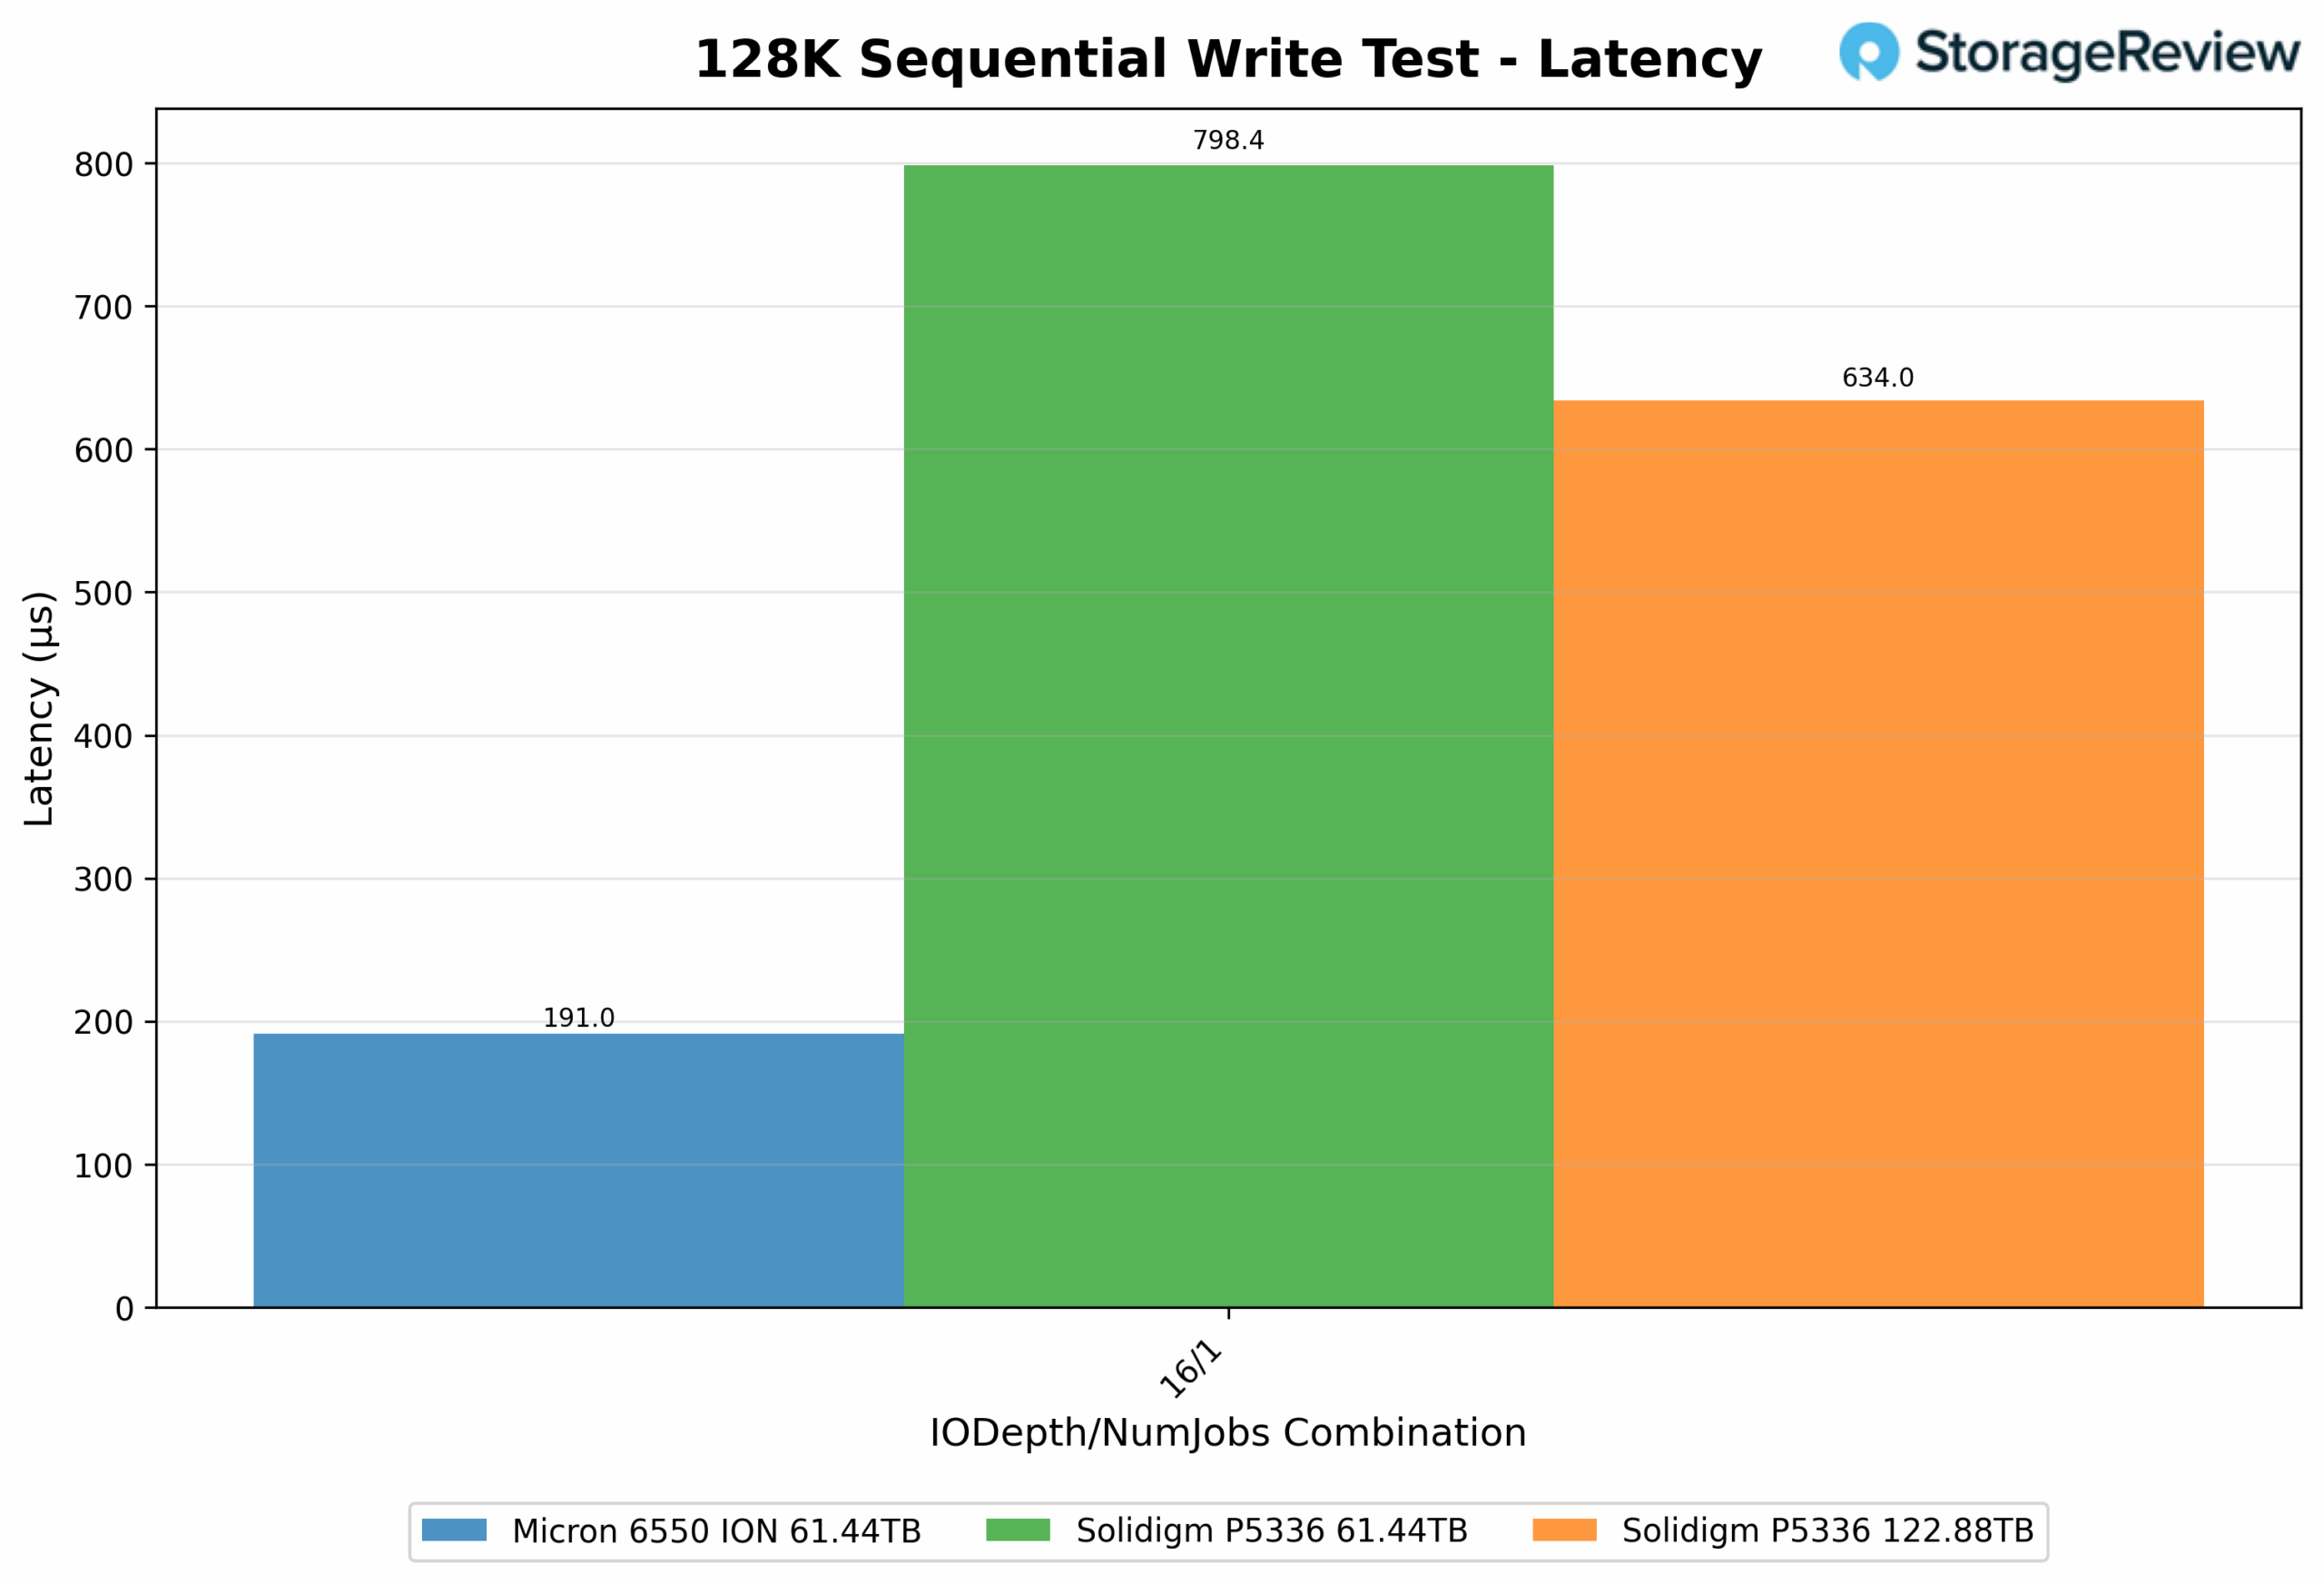 In terms of latency, the Micron 6550 registers the lowest latency at 0.191ms. The Solidigm P5336 122.88TB follows with 0.634ms, demonstrating better responsiveness than the P5336 61.44TB, which measures 0.798ms. This reflects a 20.5% reduction in latency for the higher-capacity Solidigm model, indicating improved efficiency in sequential write operations.
128K Sequential Read (IODepth 64 / NumJobs 1)
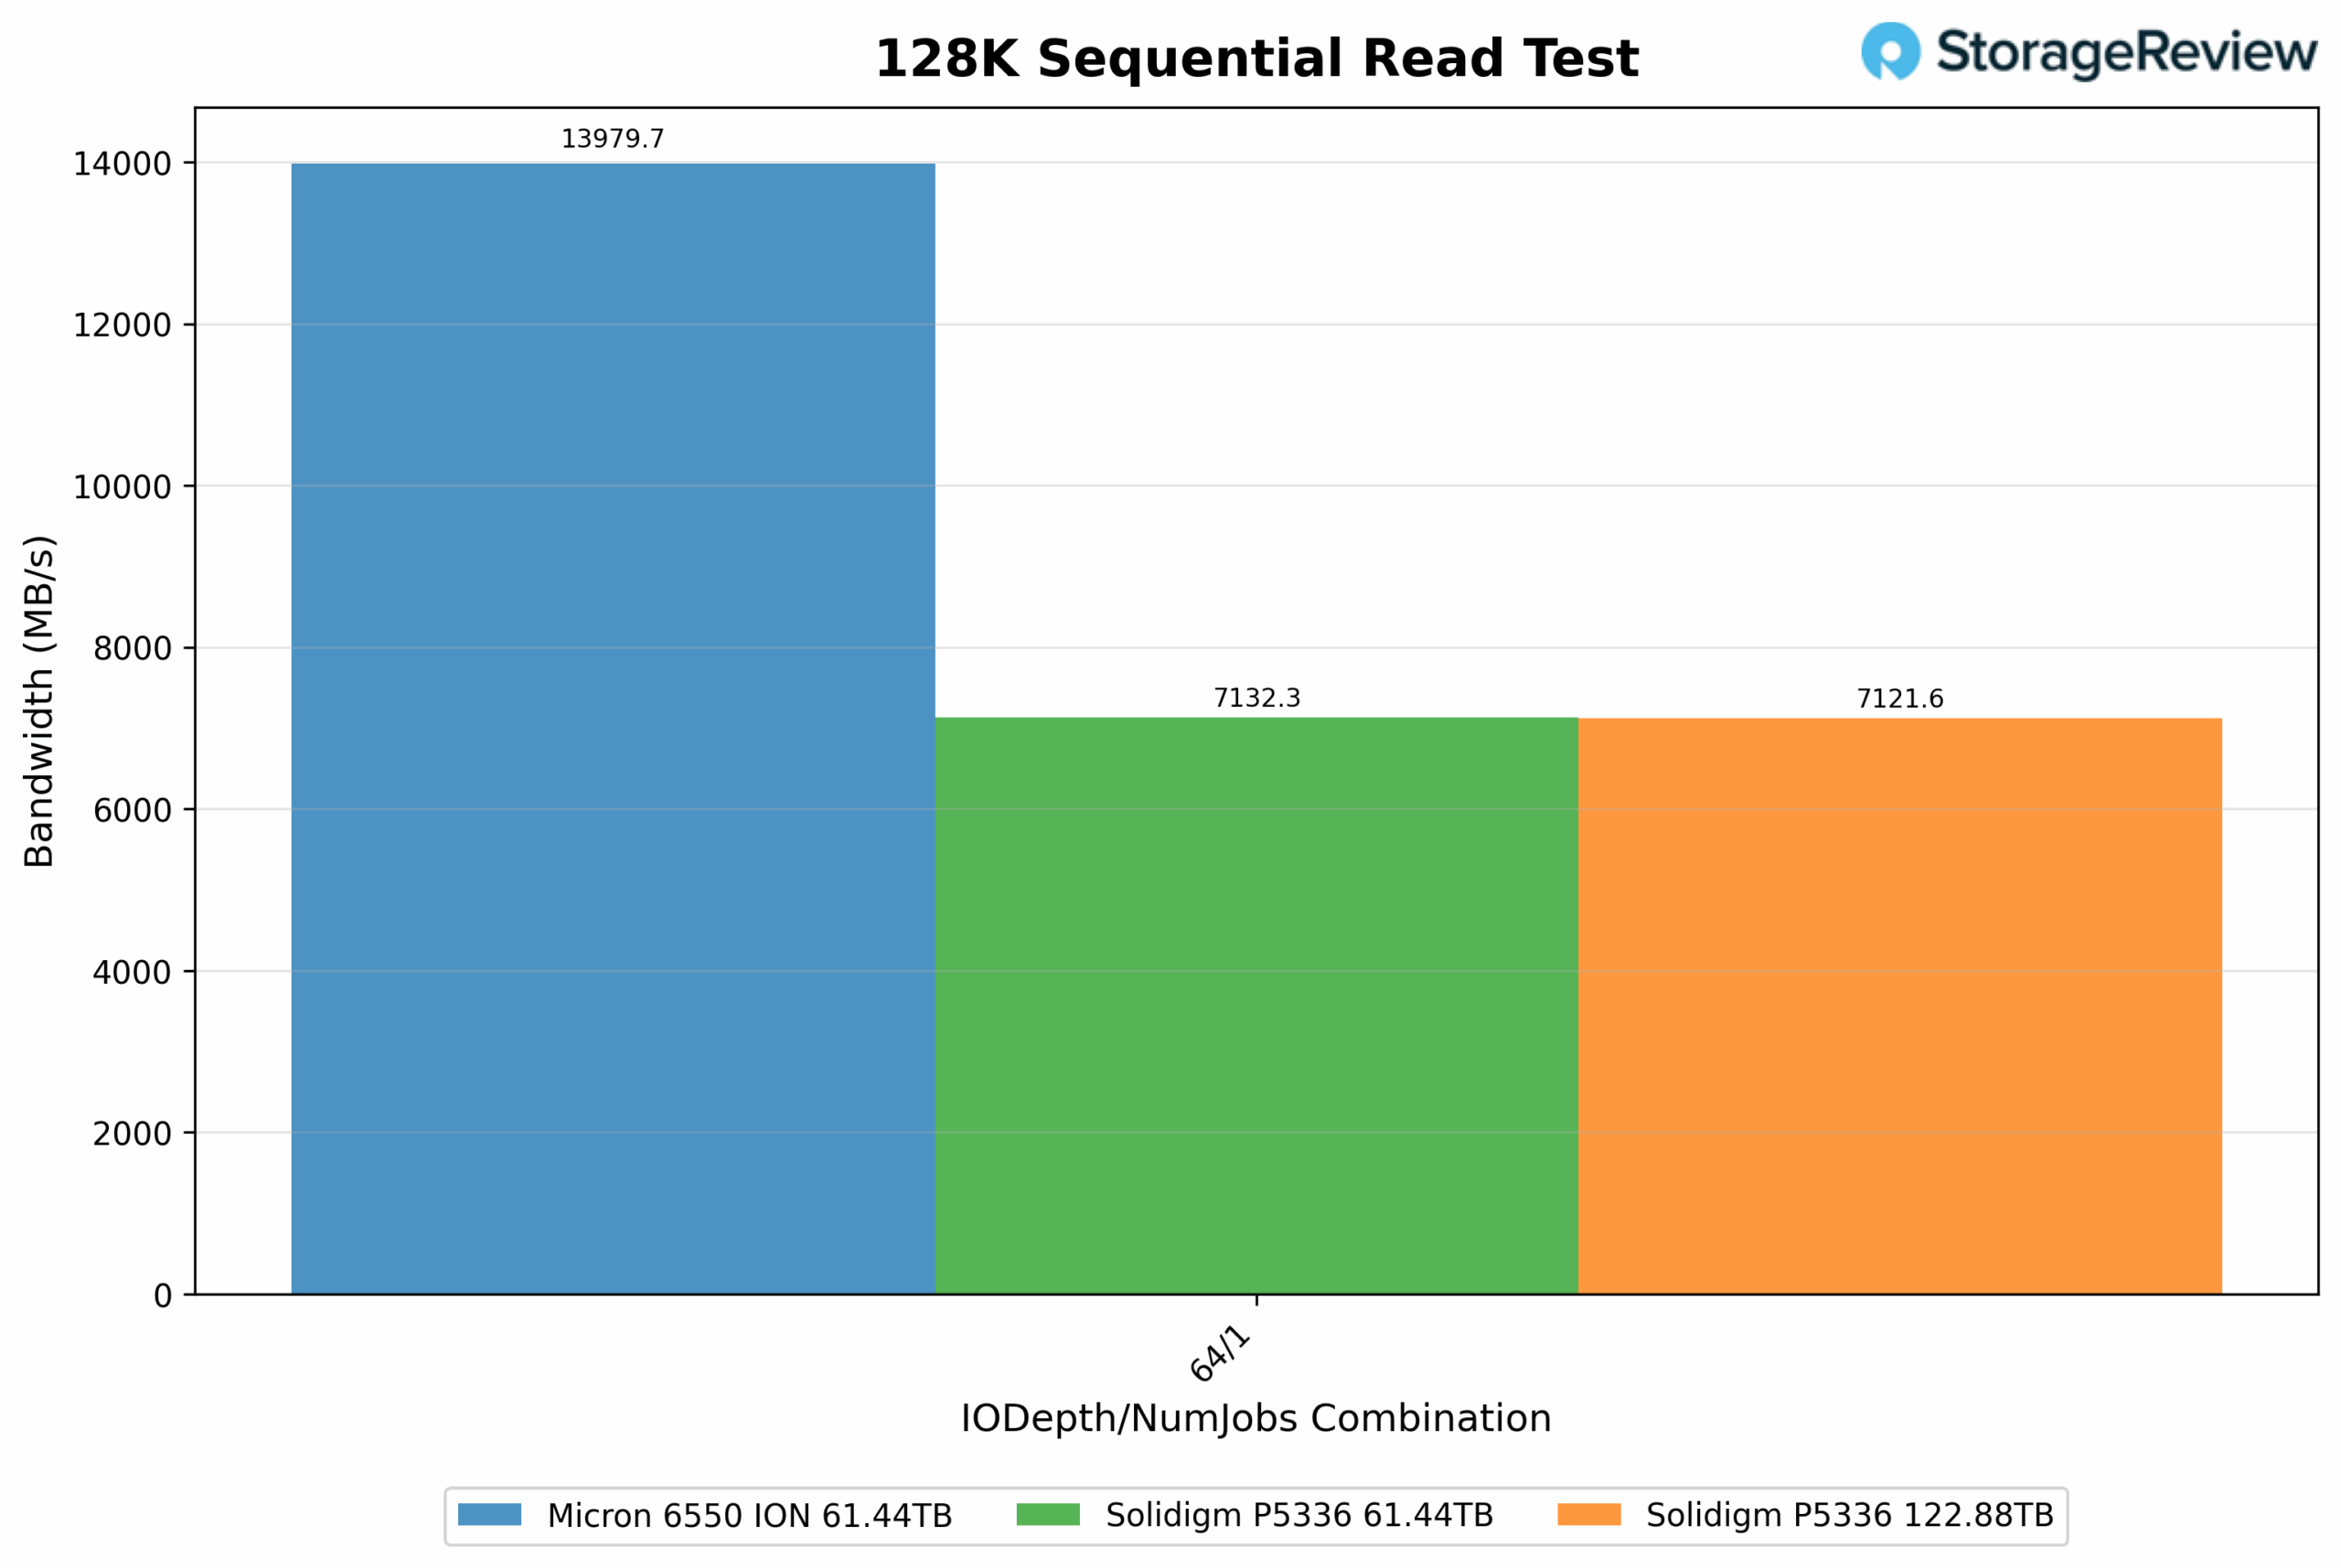 In this 64-queue depth sequential read test, the Solidigm P5336 61.44TB reaches 7,132.3MB/s and 57,060 IOPS, while the 122.88TB model follows closely behind at 7,121.6MB/s and 56,970 IOPS. The difference between the two is less than 0.2%, showing no measurable throughput advantage here from the increased capacity. The Micron 6550 achieves 13,979.7MB/s and 111,840 IOPS, delivering nearly 96% more read bandwidth than either Solidigm model in this test.
128K Sequential Read Latency (IODepth 64 / NumJobs 1)
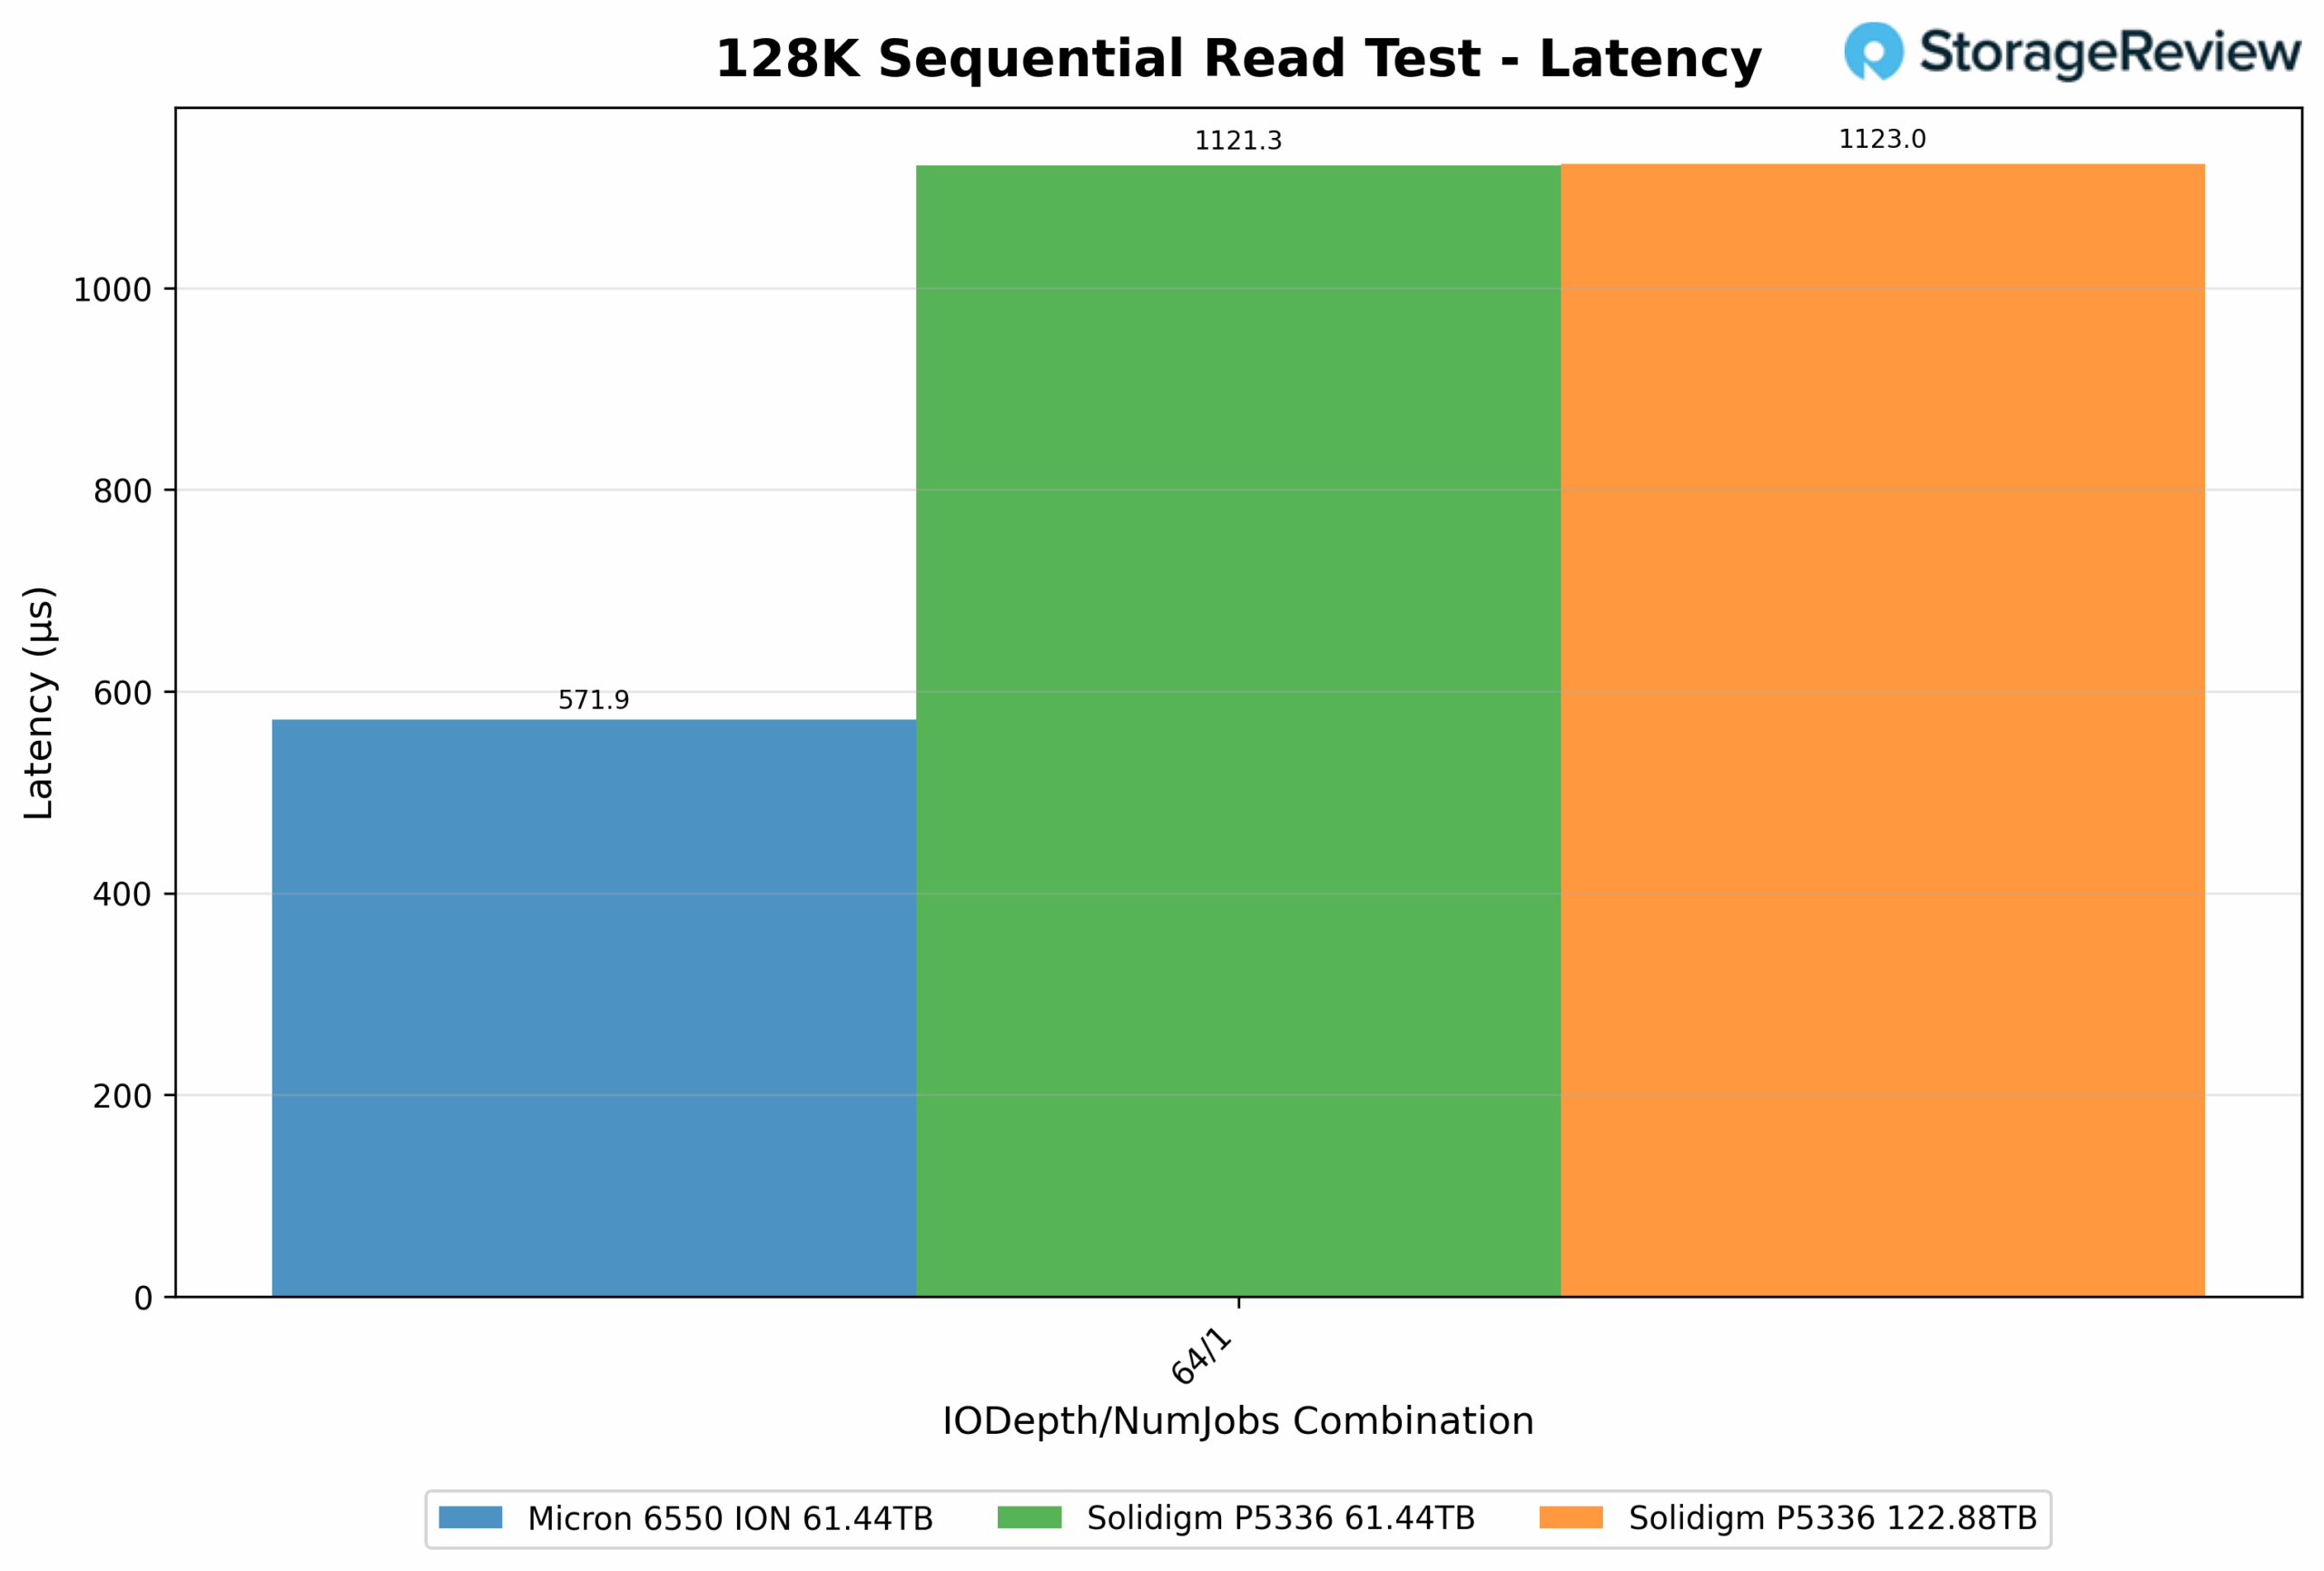
In this sequential read latency test, the Micron 6550 achieves the lowest latency at 0.572 ms. The Solidigm P5336 122.88TB measures 1.123ms, nearly identical to the P5336 61.44TB at 1.121ms. The results show no real latency advantage from the increased capacity, with both Solidigm drives performing equally in terms of sequential read responsiveness.
64K Random Write
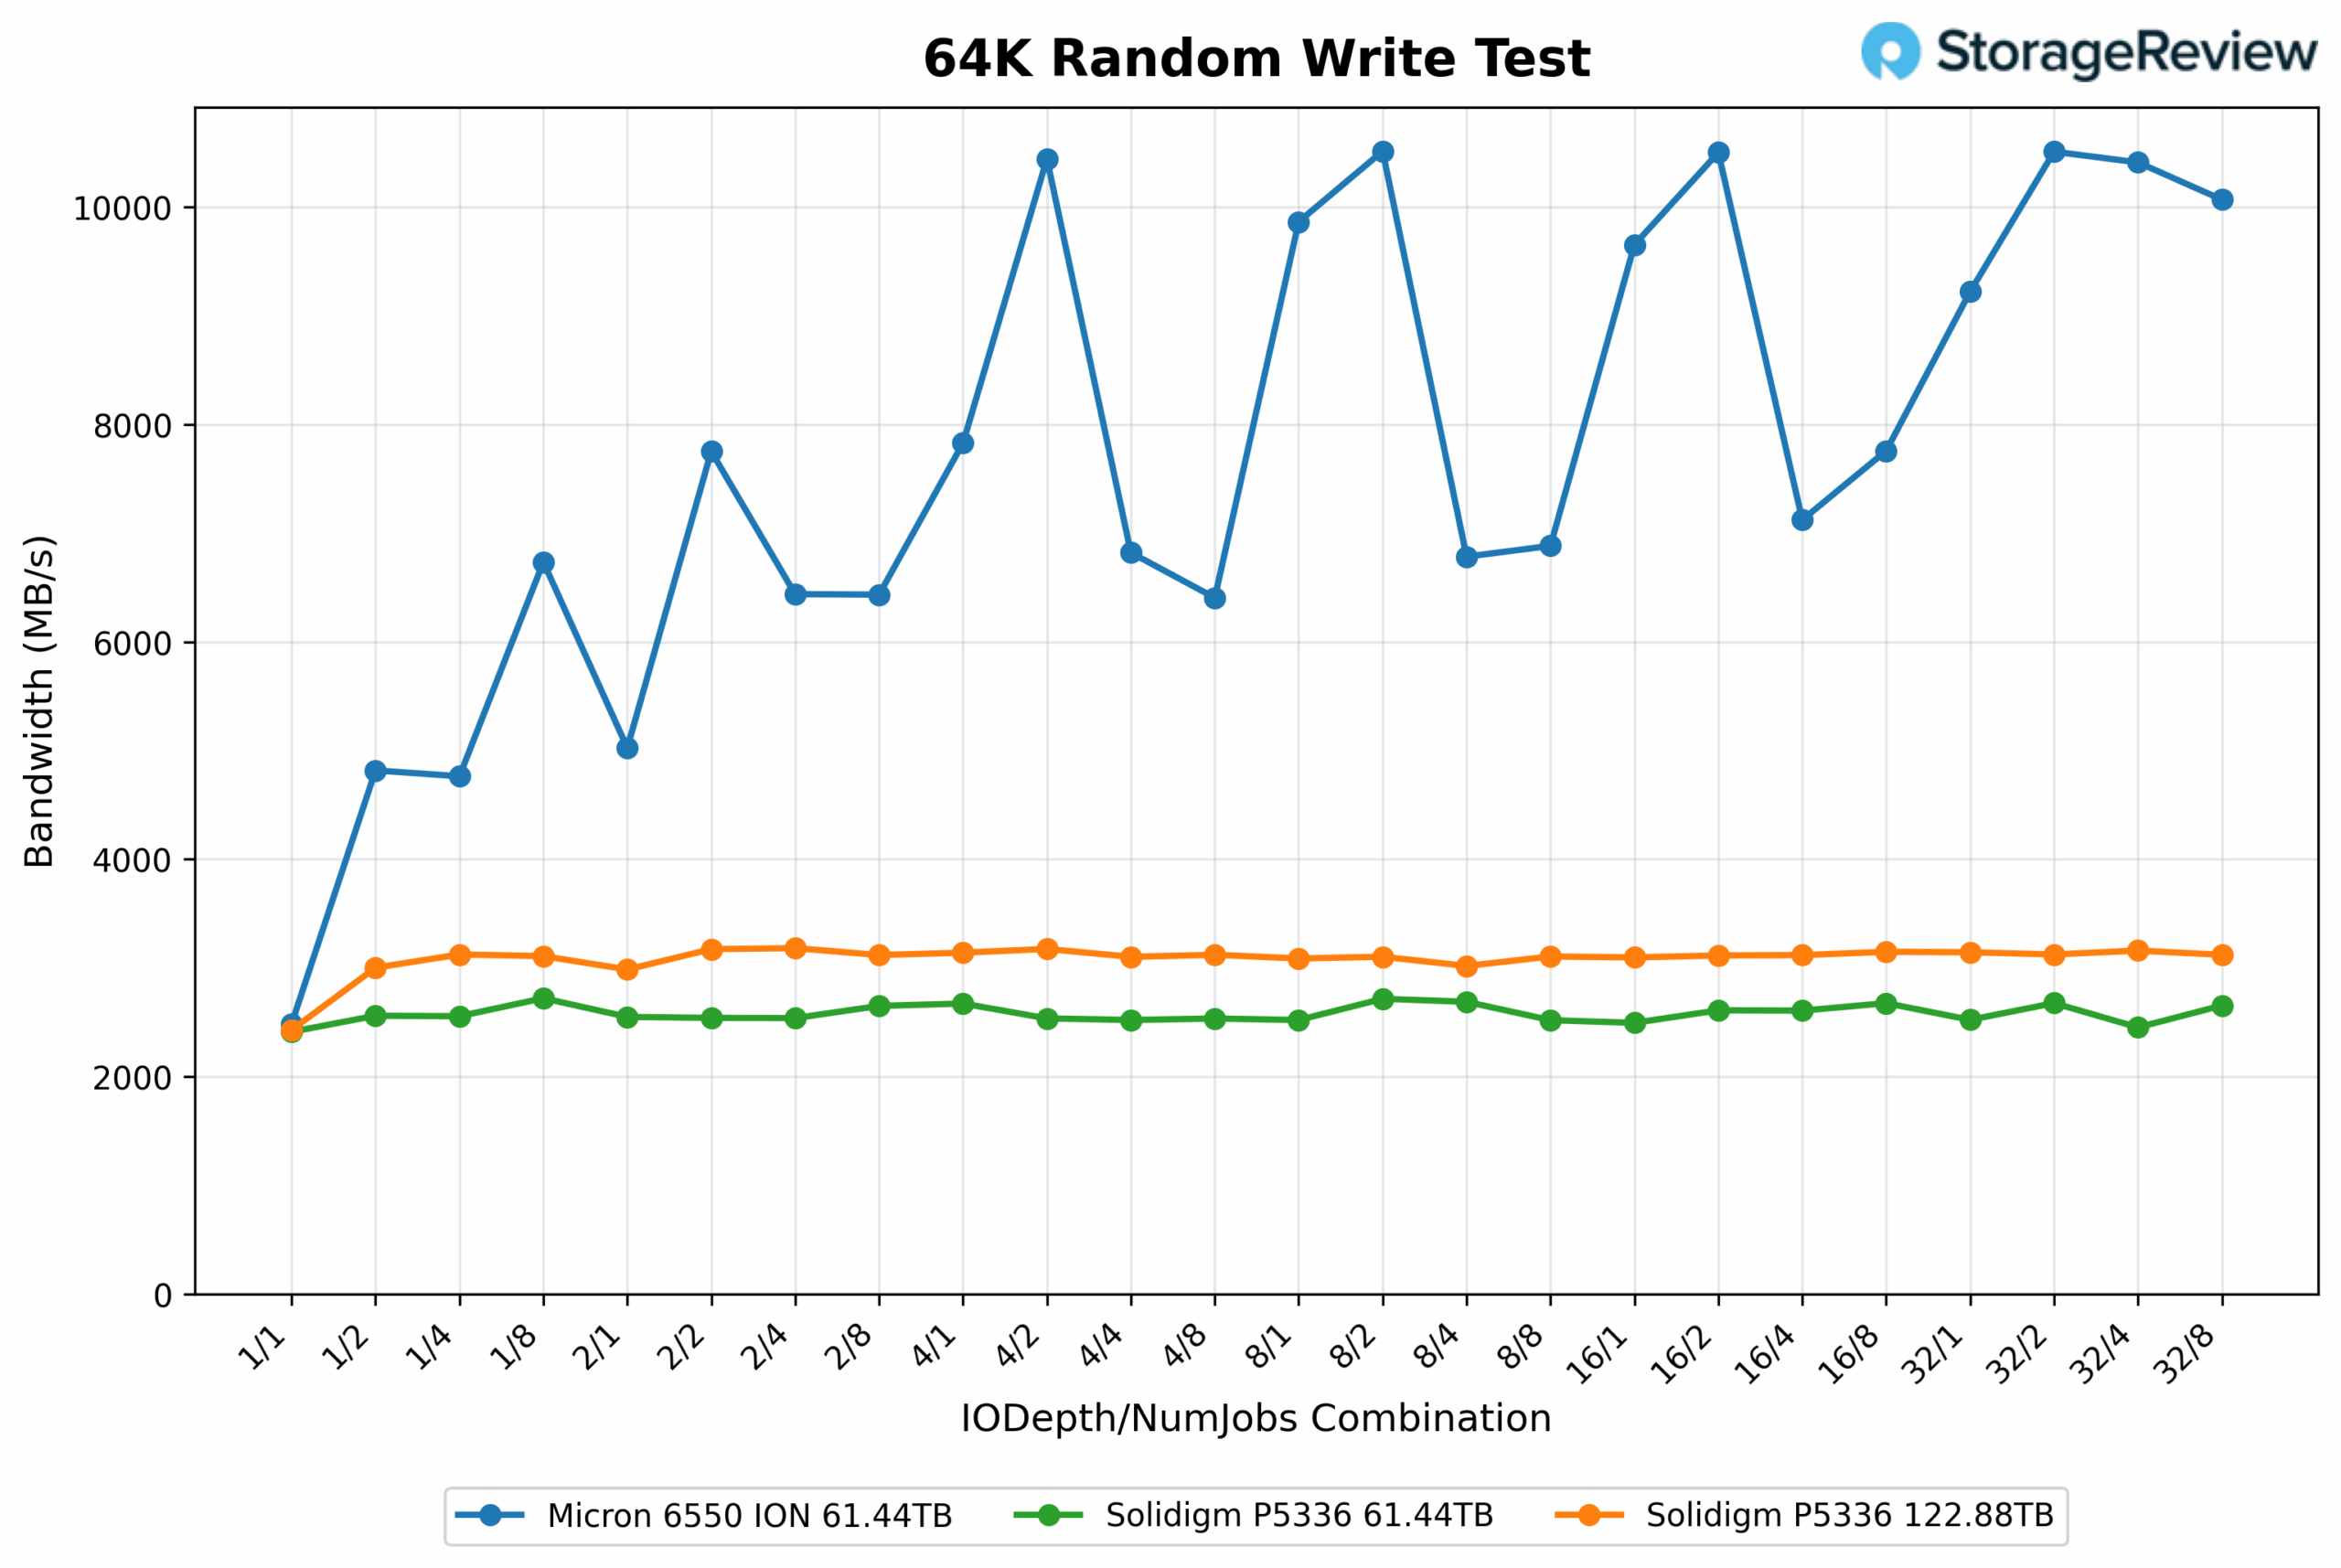
In the 64K random write test at low concurrency (1-1), all three drives perform closely. The Micron 6550 delivers 2,485.97MB/s and 39,780 IOPS. The Solidigm P5336 122.88TB follows with 2,429.93MB/s and 38,880 IOPS, while the P5336 61.44TB trails slightly at 2,412.90MB/s and 38,610 IOPS.
As the workload scales to higher concurrency (32-8), the differences become more apparent. The 122.88TB model achieves 3,121.54MB/s and 49,950 IOPS, outperforming the 61.44TB model, which tops out at 2,654.46MB/s and 42,470 IOPS. This marks a 17.6% increase in throughput for the higher-capacity 122TB drive, showing more effective scaling under heavier random write pressure. The Micron 6550 moves well ahead at 10,070.71MB/s and 161,130 IOPS.
64K Random Write Latency
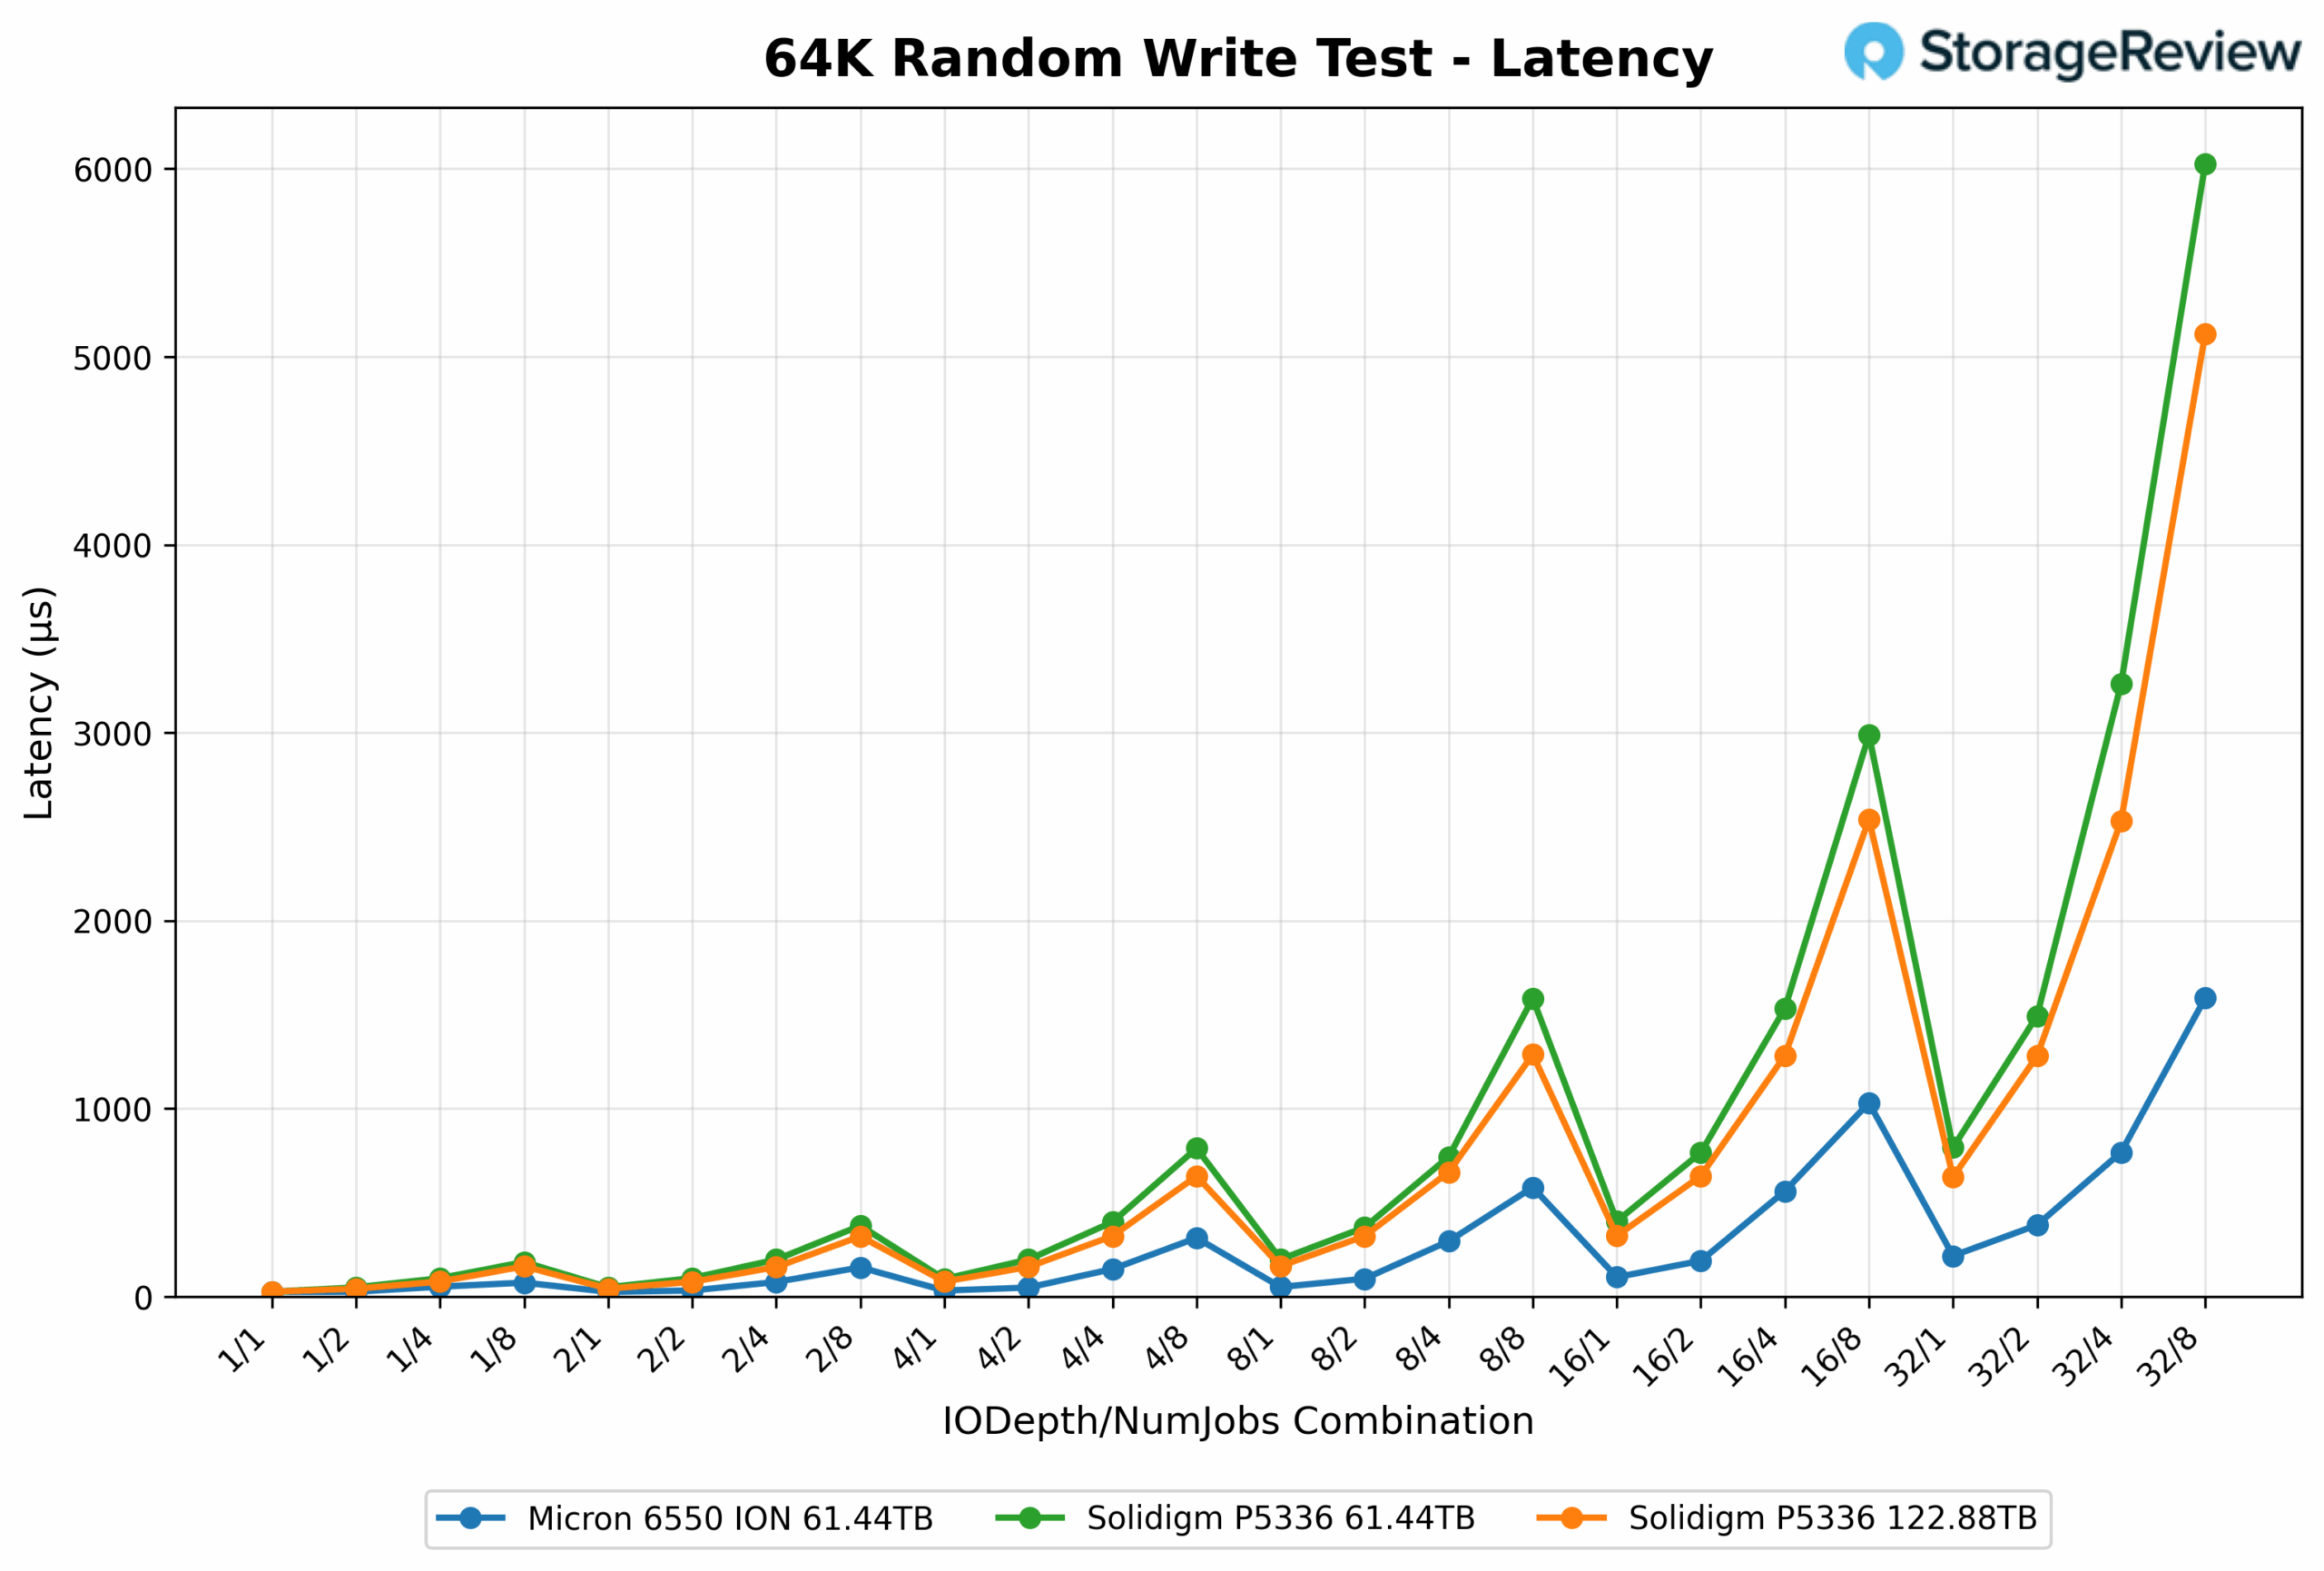 At low load (1-1), all three drives report identical latency of 0.025ms. Under the (32-8) workload, the Solidigm P5336 122.88TB records 5.121ms, compared to 6.026ms on the P5336 61.44TB. This results in a 15% reduction in latency for the higher-capacity 122TB model. The Micron 6550 maintains significantly lower latency at 1.588ms, showing stronger responsiveness under heavy random write concurrency.
64K Random Read
In the 64K random read test at minimal load (1-1), the Micron 6550 reaches 482.09MB/s and 7,710 IOPS. The Solidigm P5336 61.44TB follows at 299.40MB/s and 4,790 IOPS, while the P5336 122.88TB comes in at 274.04MB/s and 4,390 IOPS, an 8.5% decrease in performance compared to the 61.44TB model at this depth.
Under heavy concurrency (32-8), the P5336 122.88TB delivers 7,124.69MB/s and 113,995 IOPS, while the 61.44TB matches closely at 7,125MB/s and roughly 114,000 IOPS. There is no meaningful performance difference between the two capacities at this level. The Micron 6550 continues to scale higher, hitting 13,153.64MB/s and 210,460 IOPS.
64K Random Read Latency
 At (1-1) depth and job count, the Micron 6550 posts the lowest latency at 0.129ms. The Solidigm P5336 61.44TB follows at 0.208ms, while the P5336 122.88TB measures slightly higher at 0.228ms, resulting in a 9.6% increase for the larger capacity. Under heavier load (32-8), both Solidigm models report identical latency at 2.245ms, showing no benefit from the increased capacity. The Micron 6550 maintains much lower latency at 1.217ms for this run.
16K Random Write
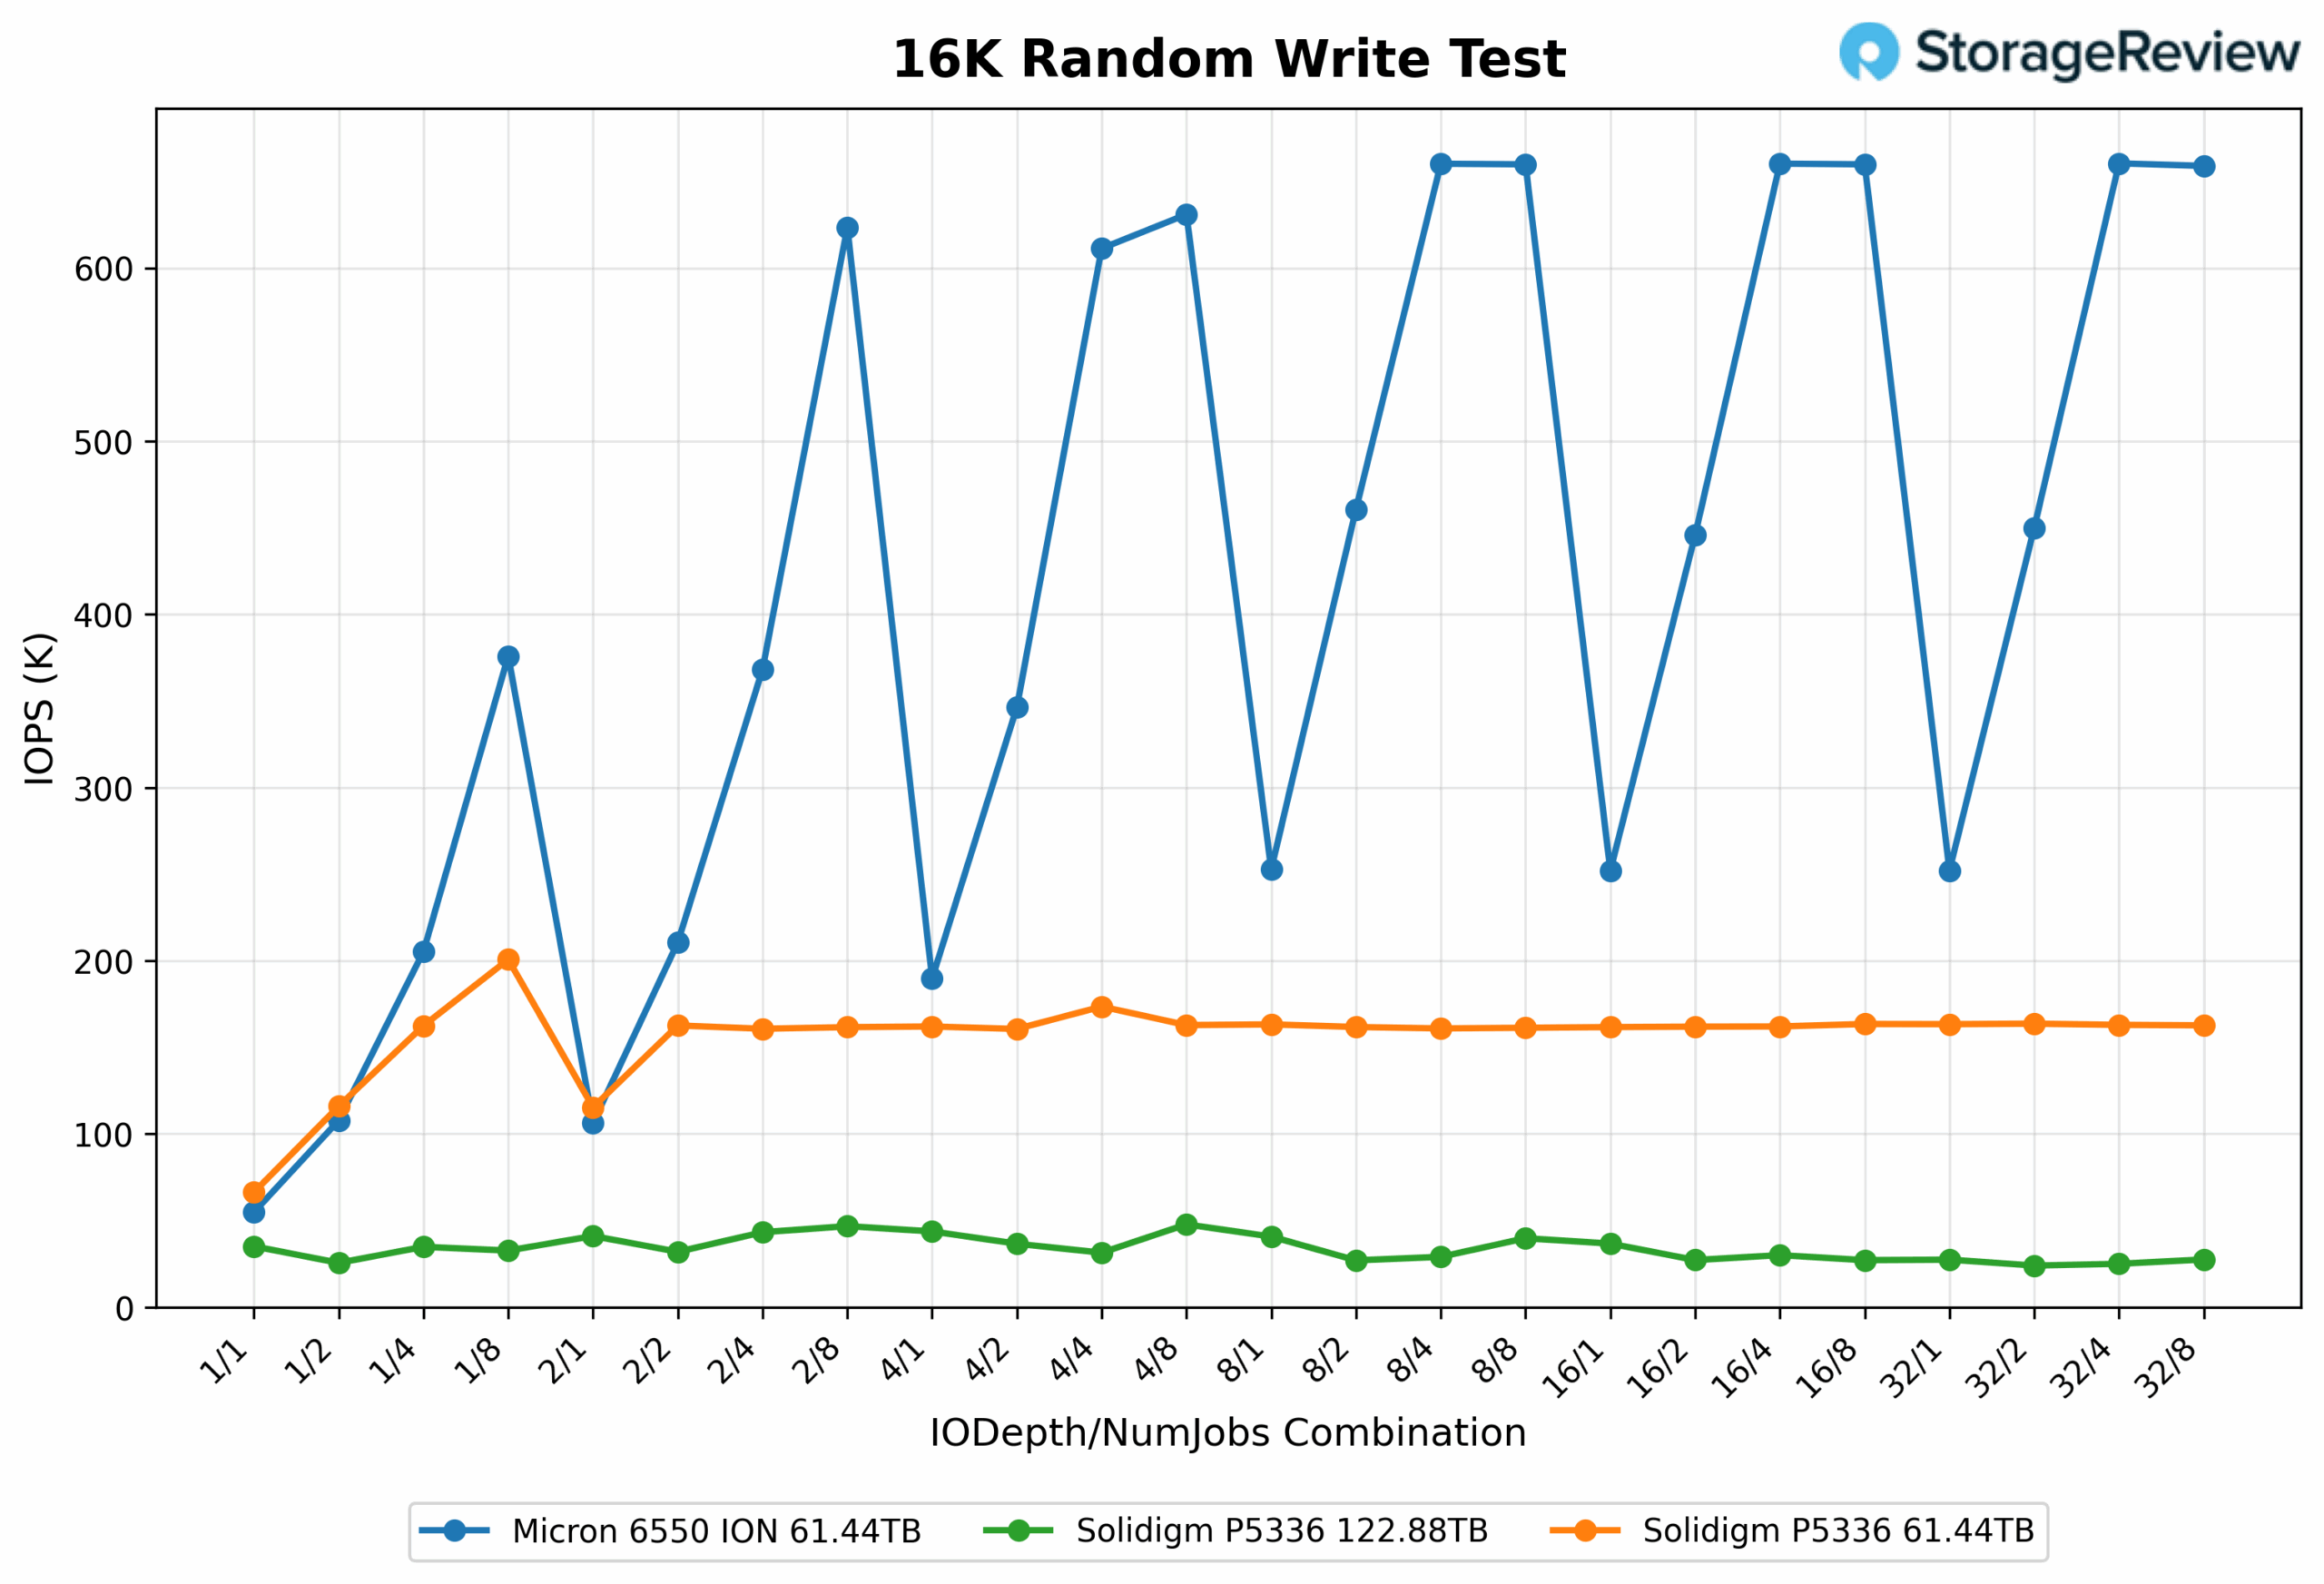
At low load (1-1), the Solidigm P5336 122.88TB delivers 549.14MB/s and 35,145 IOPS. The P5336 61.44TB performs significantly better at 1,036.53MB/s and 66,338 IOPS. This puts the 122.88TB model approximately 47% lower in both bandwidth and IOPS compared to the 61.44TB. The Micron 6550 sits between the two Solidigm drives, achieving 856.61MB/s and 54,823 IOPS.
At high concurrency (32-8), the 122.88TB model maintains a throughput of 549.14MB/s and 35,145 IOPS, demonstrating no scaling from its 1-1 performance. Meanwhile, the 61.44TB version scales to 2,542.36MB/s and 162,711 IOPS, resulting in a 363% increase in throughput over the 122TB drive. The Micron 6550 leads overall, reaching 10,295.66MB/s and 658,922 IOPS.
16K Random Write Latency
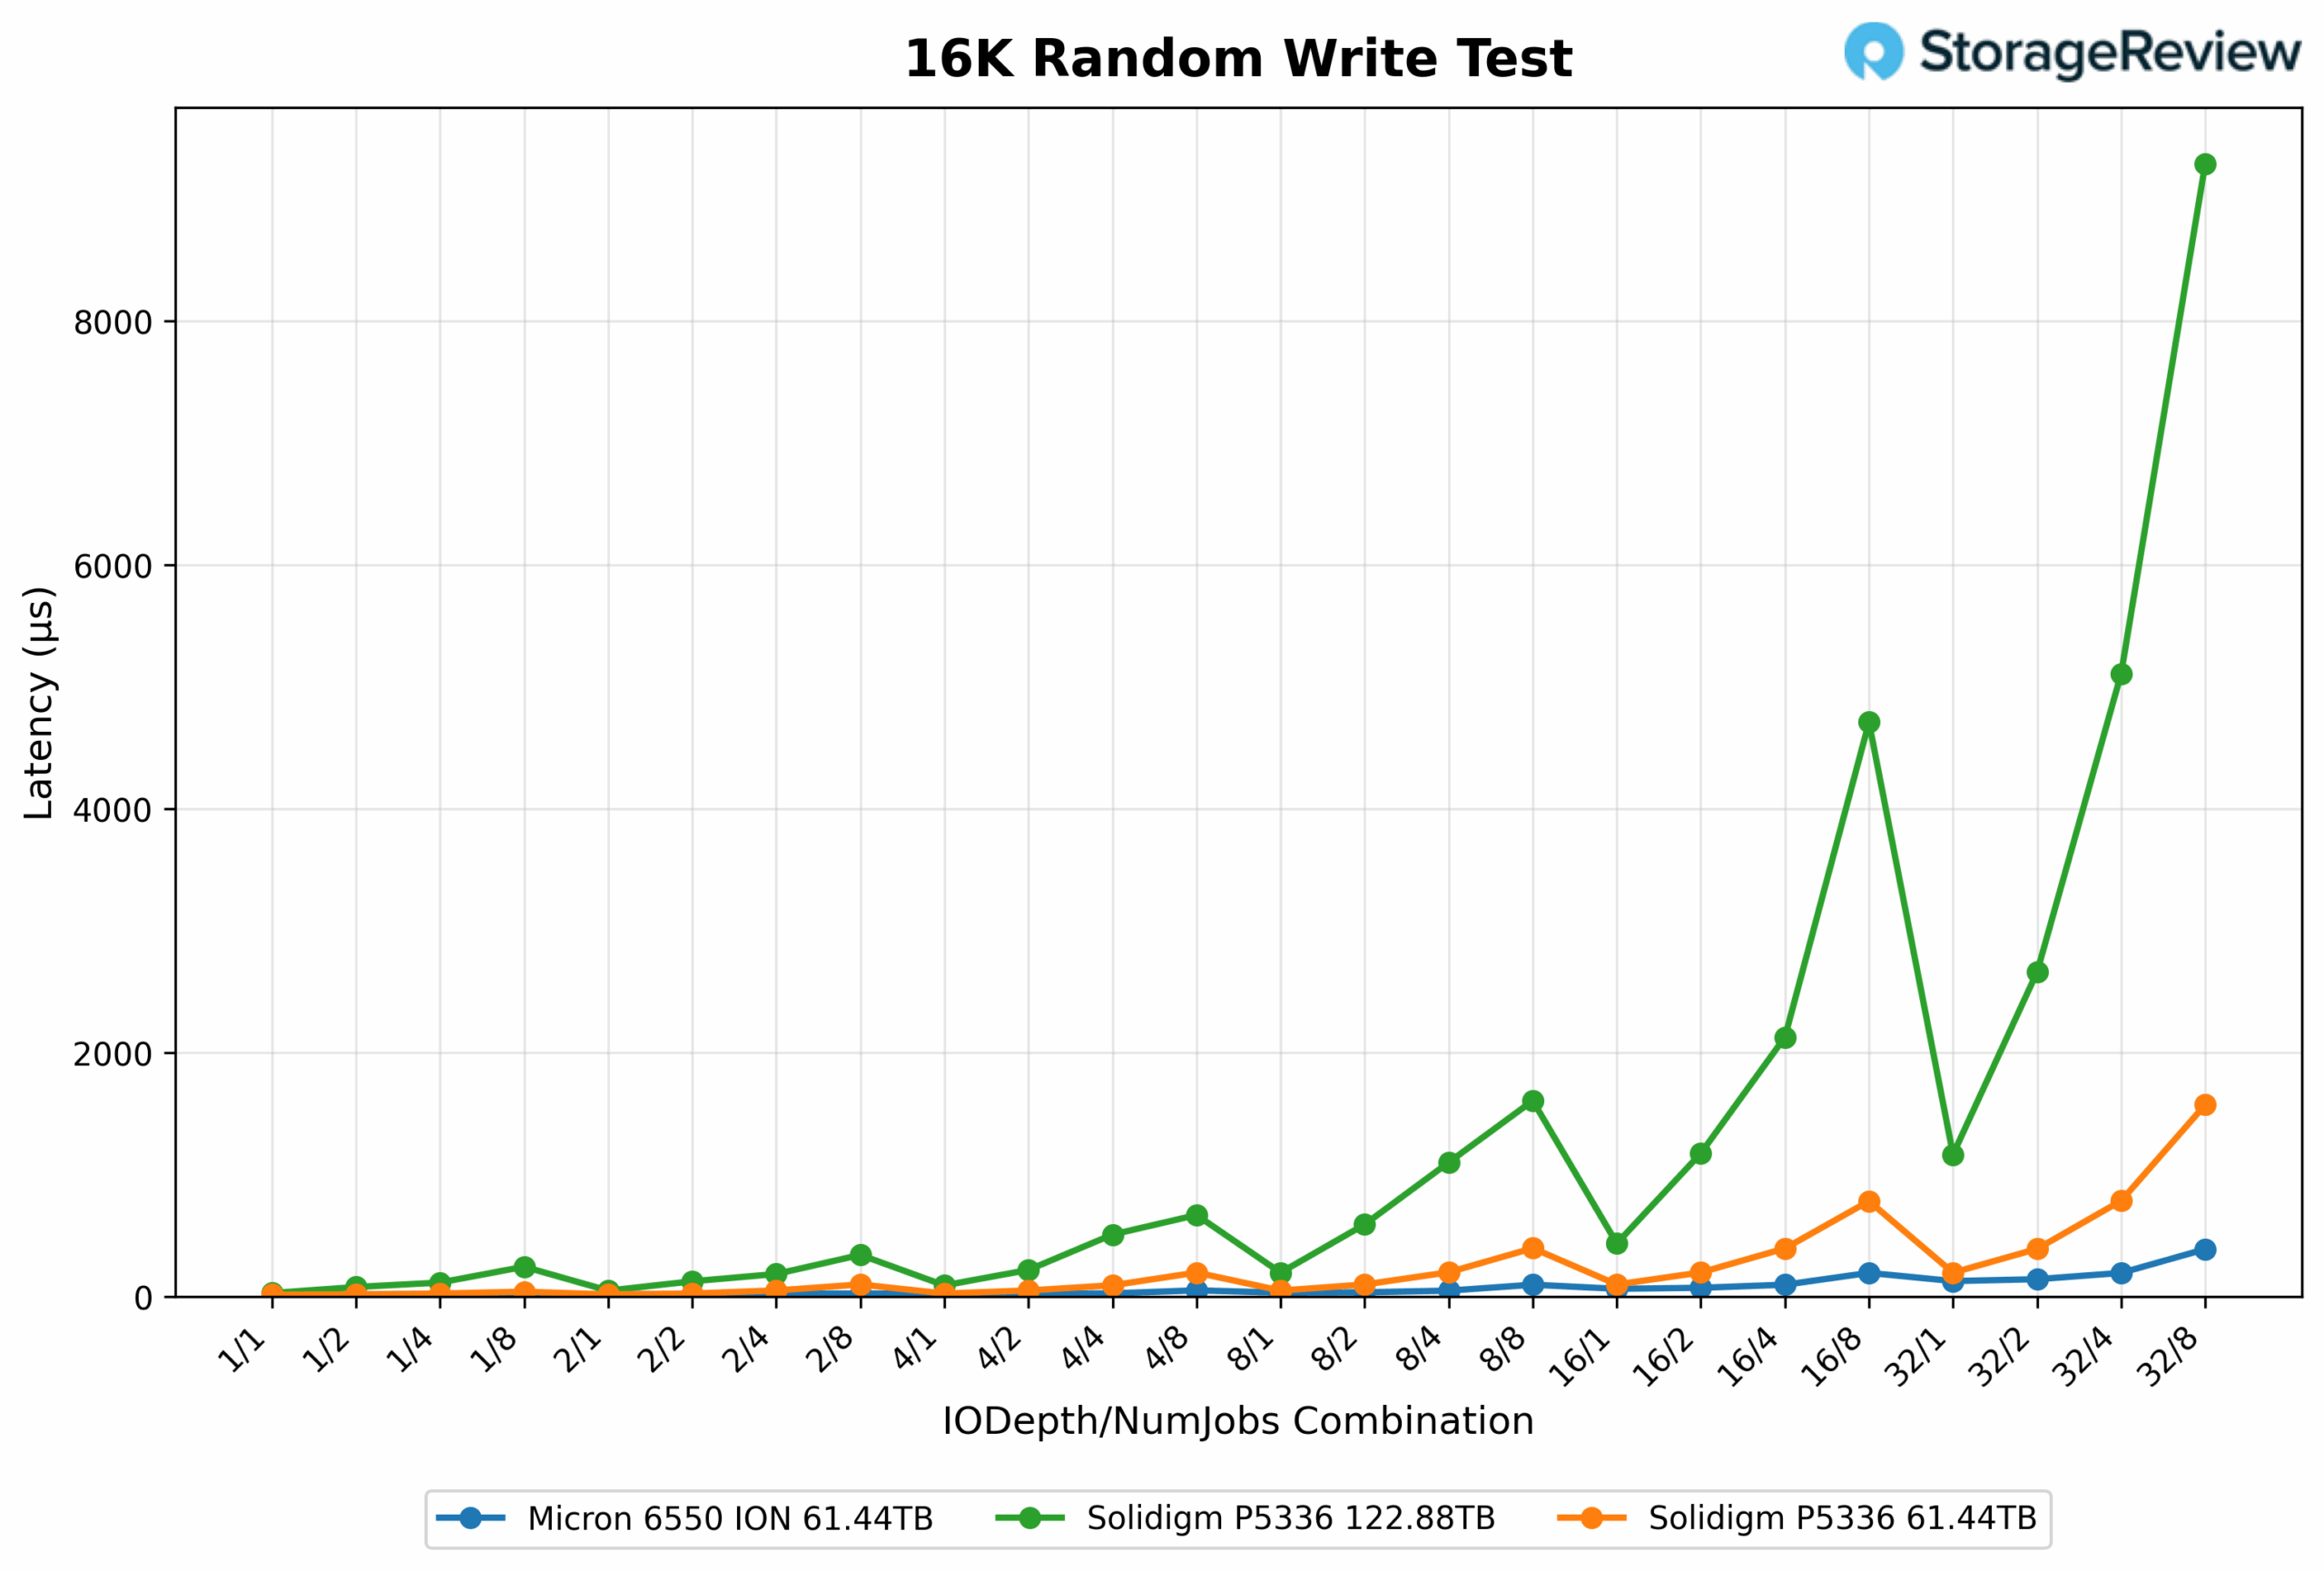
At (1-1), the Solidigm P5336 122.88TB shows a latency of 0.028ms, while the P5336 61.44TB performs faster at 0.015ms. The Micron 6550 falls between them at 0.018ms. This results in an 86% higher latency for the 122TB model compared to the 61TB Solidigm at minimal load. Under a heavy load (32-8), the 122.88TB model maintains a steady response time of 0.028ms, indicating no scaling. The 61.44TB rises to 1.572ms, reflecting increased pressure under concurrency but also a significant throughput gain. The Micron 6550 remains efficient at 0.388ms, showing stronger responsiveness under peak random write stress.
16K Random Read
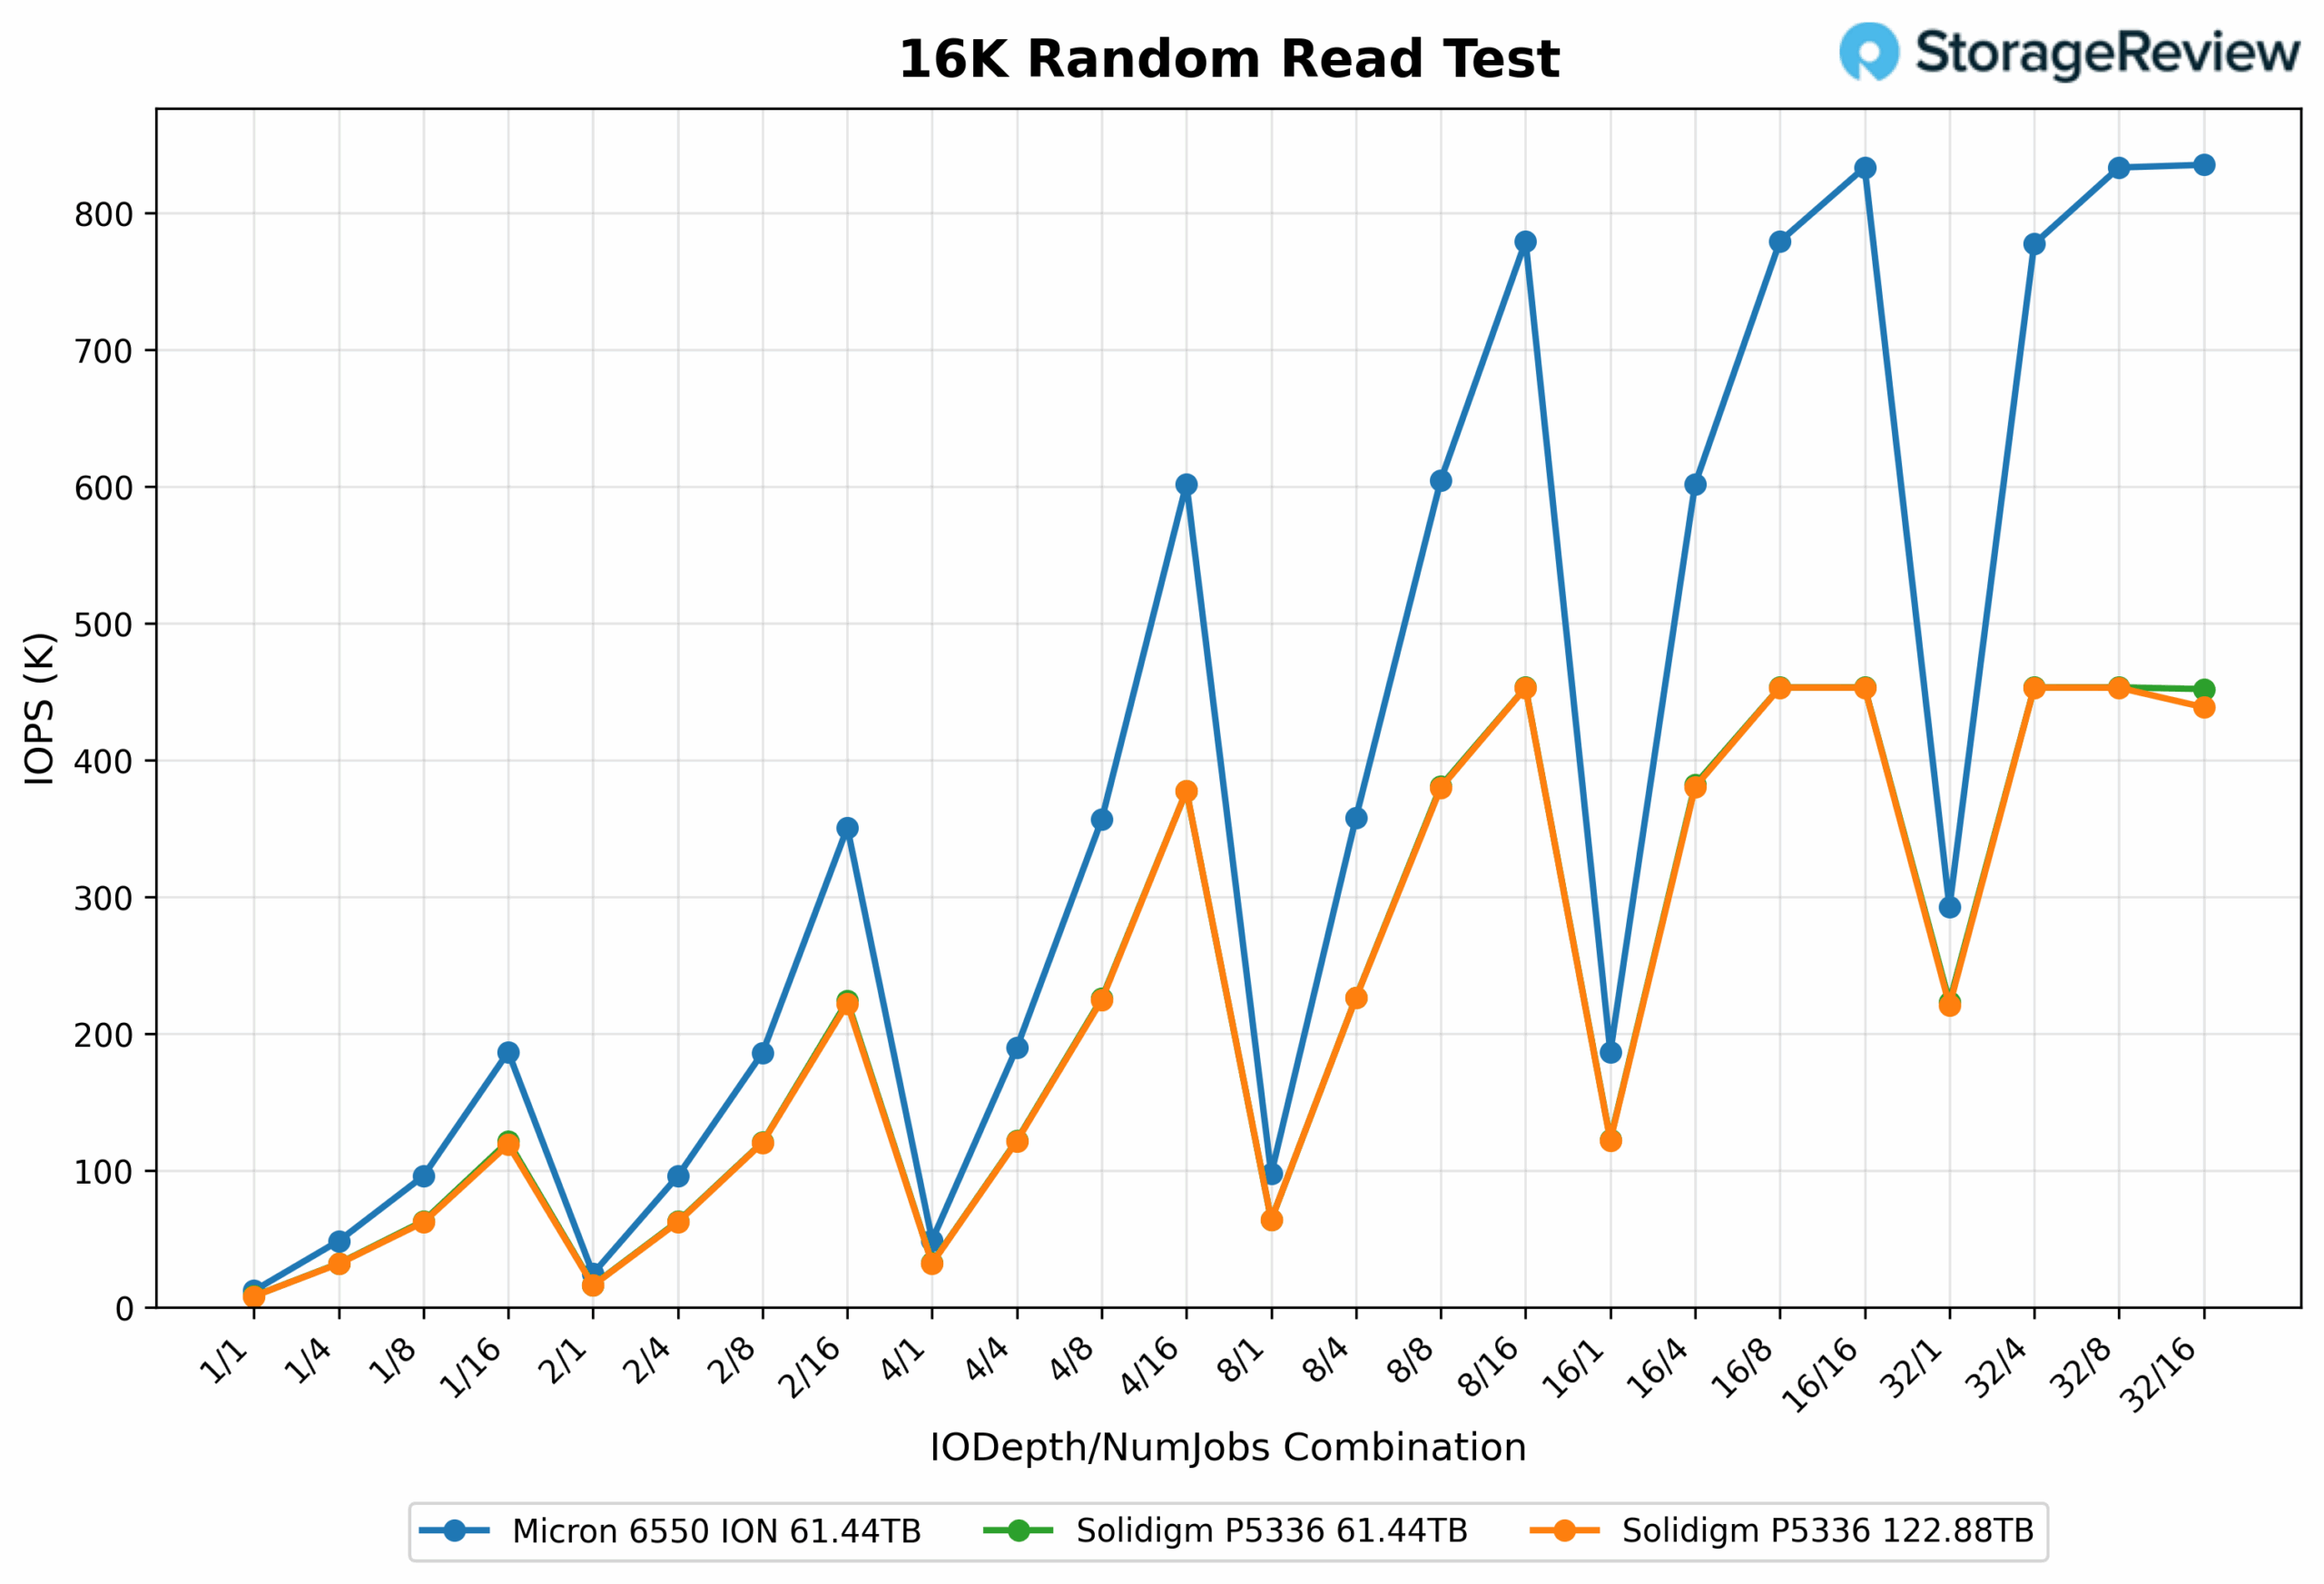
At minimal load (1-1), the Micron 6550 reaches 188.80MB/s and 12,083K IOPS. The Solidigm P5336 61.44TB follows at 126.55MB/s and 8,100 IOPS, while the P5336 122.88TB records 125.87MB/s and 8,060 IOPS. The two Solidigm drives perform nearly identically, with a difference of less than 0.5%, indicating no capacity-based benefit at this depth.
At higher concurrency (32-16), the Micron 6550 pushes to 13,053.35MB/s and 835,420 IOPS. The Solidigm 61.44TB reaches 7,063.02MB/s and 452,030 IOPS, slightly ahead of the 122.88TB model at 6,855.59MB/s and 438,760 IOPS. This represents a 2.9% drop in throughput for the larger Solidigm drive under this workload.
16K Random Read Latency
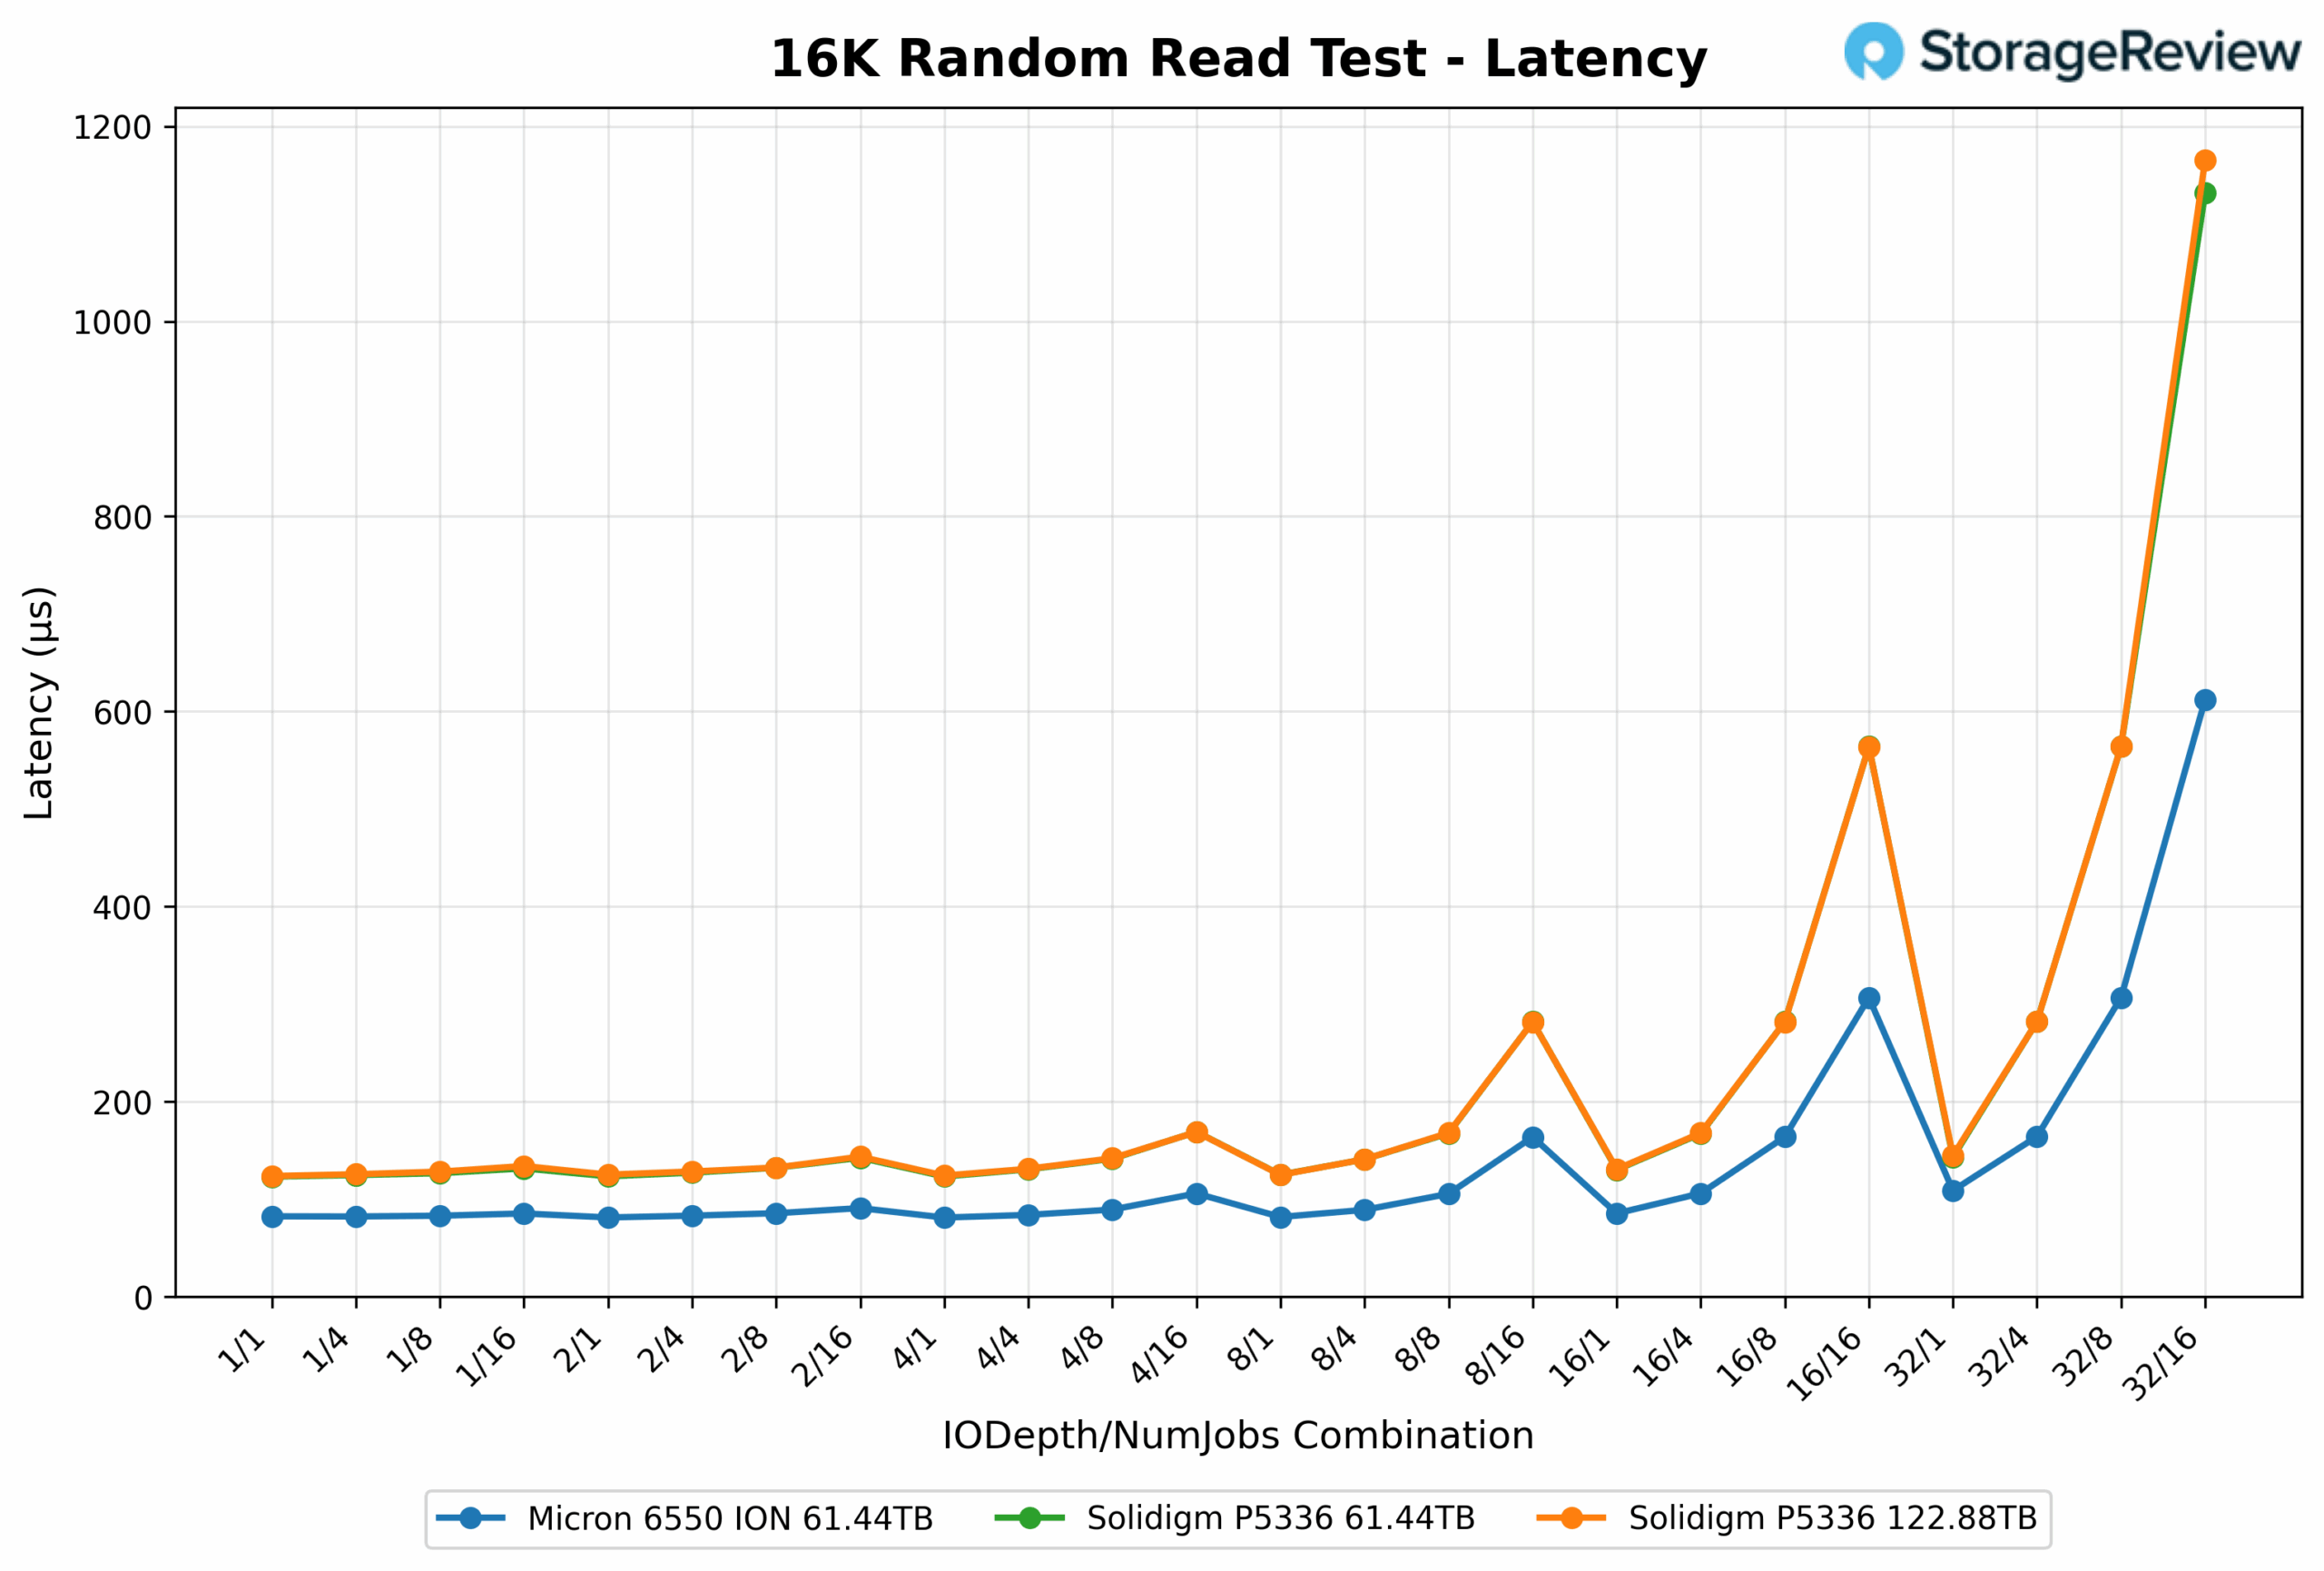
At (1-1), the Micron 6550 records the lowest latency at 0.082ms. The two Solidigm P5336 models follow at 0.123ms and 0.124ms, respectively, with a difference of less than 1% between them. Under heavy load (32-16), the Micron maintains efficient scaling at 0.612ms, while the Solidigm 61.44TB increases to 1.132ms and the 122.88TB reaches 1.165ms. This marks a 2.9% increase in latency for the higher-capacity Solidigm drive compared to the 61TB model, indicating a minor efficiency drop under maximum concurrency.
4K Random Read
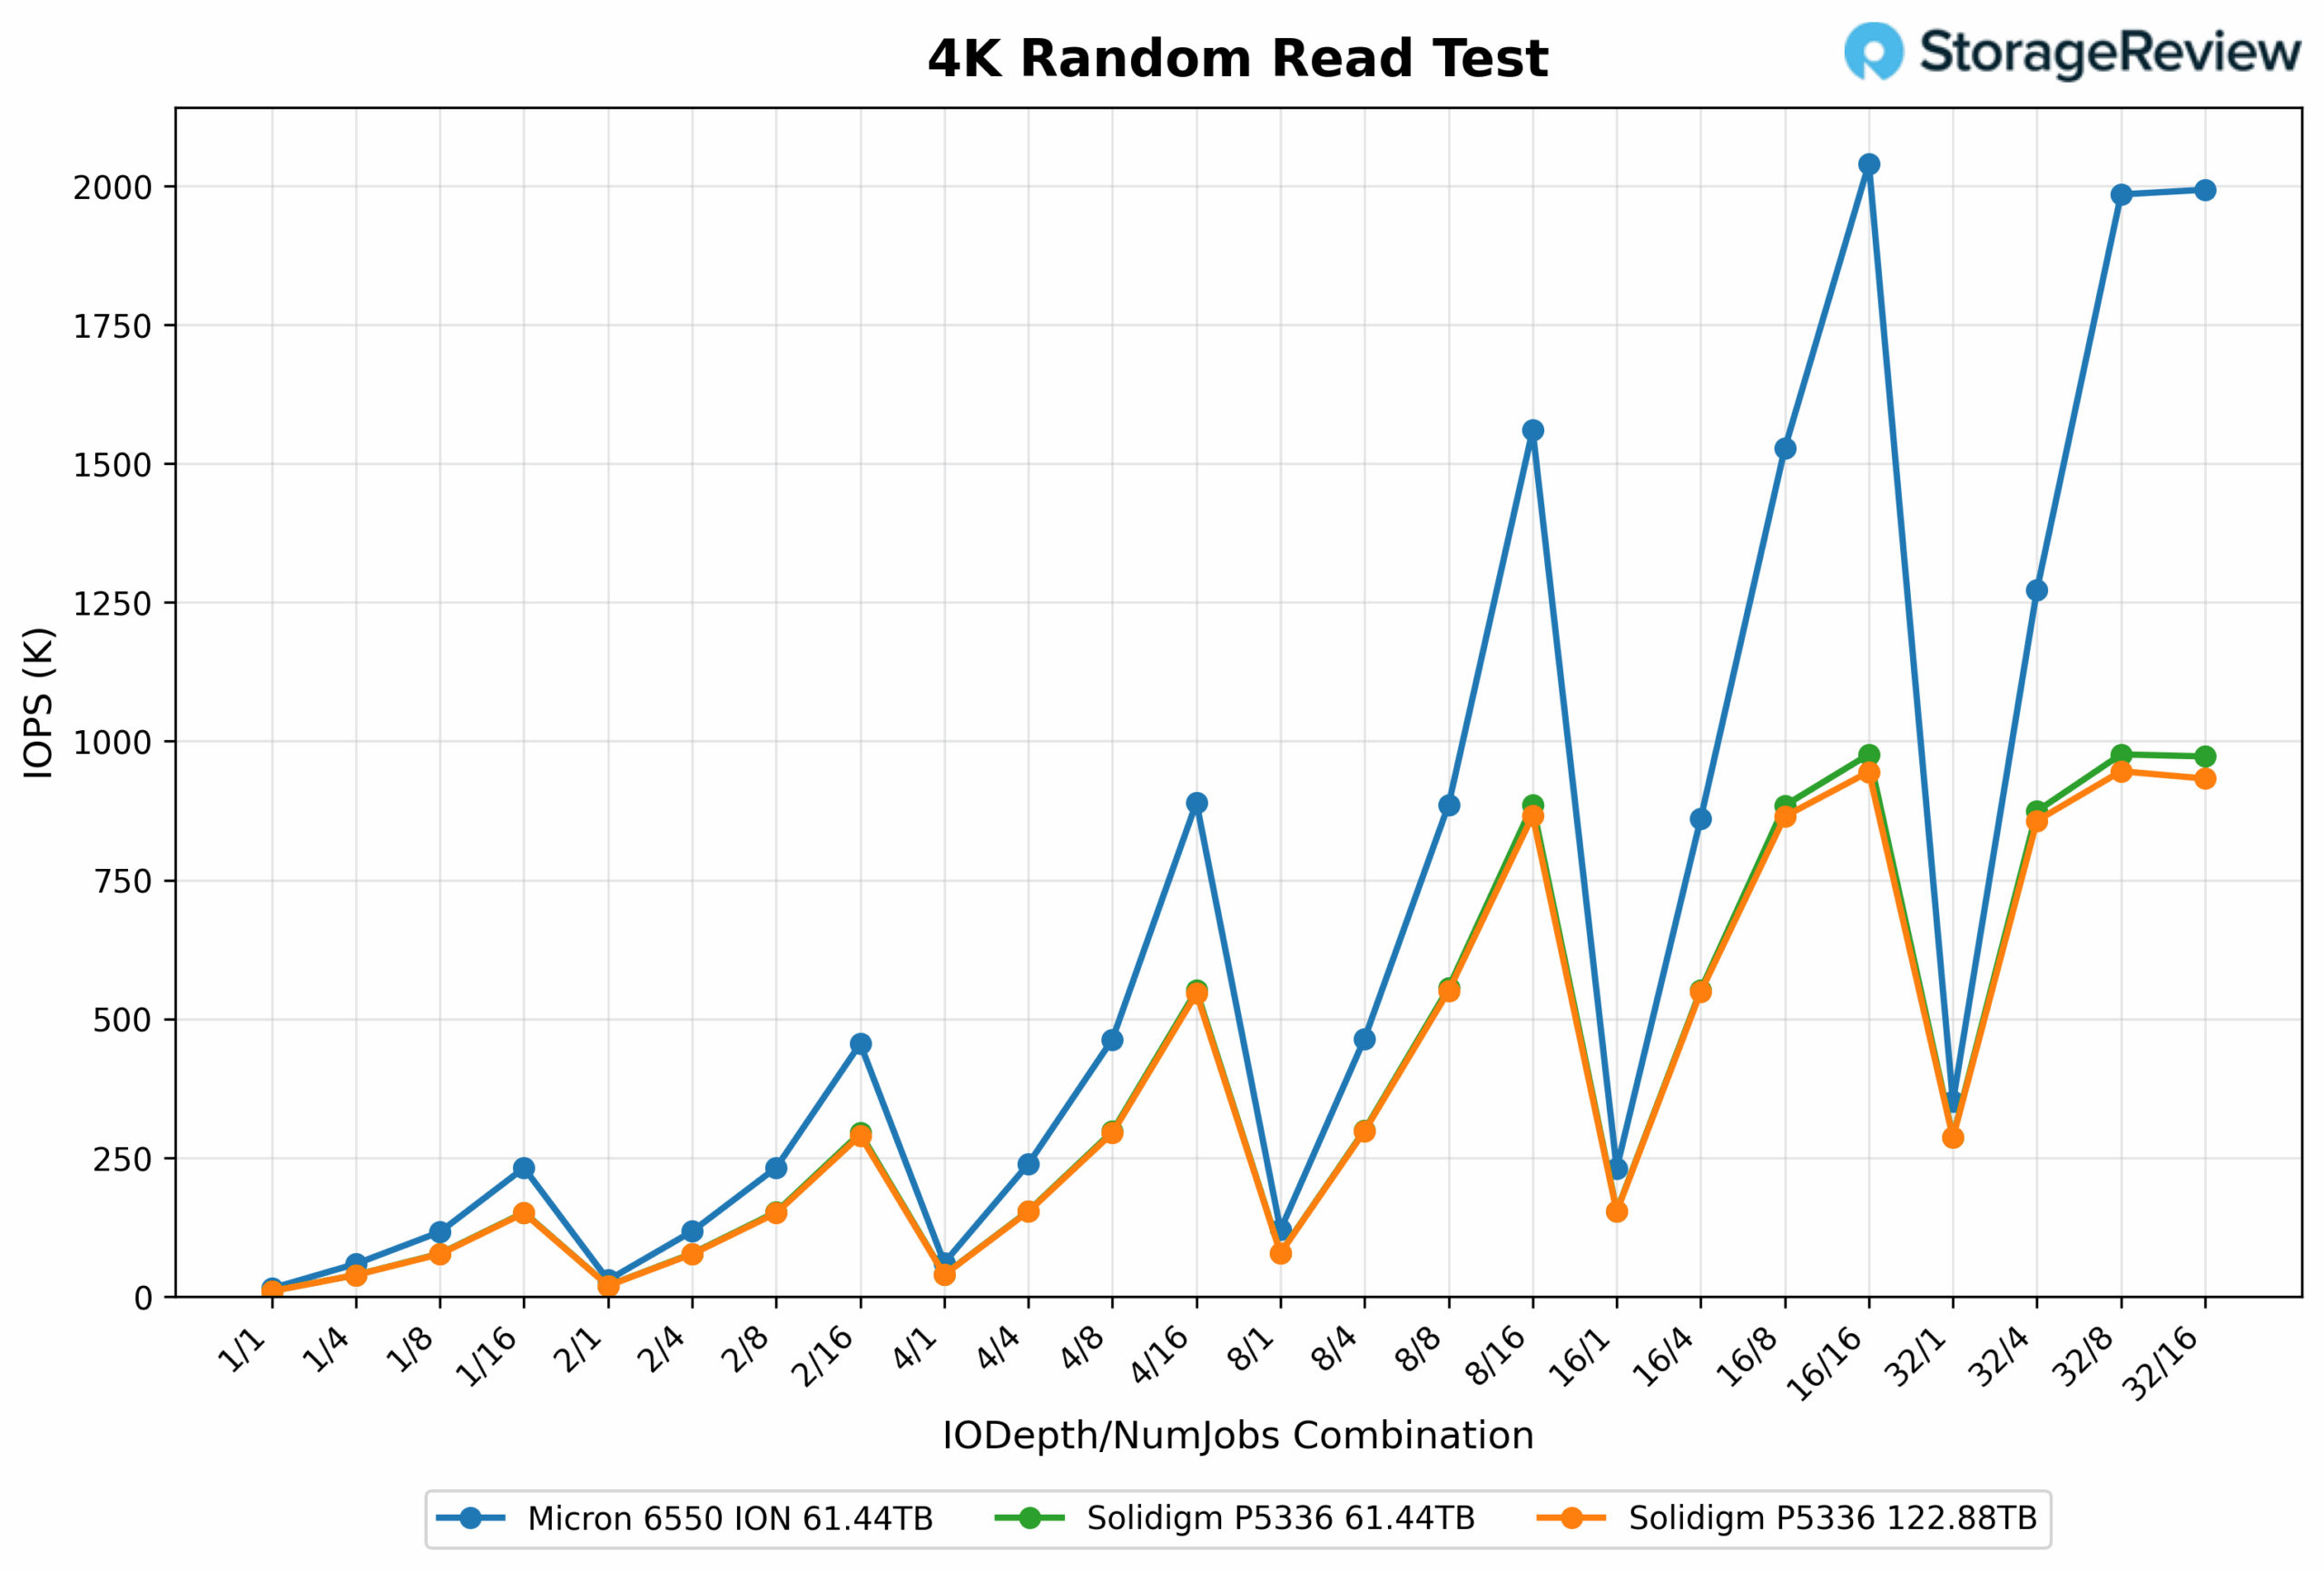
At minimal load (1-1), the Micron 6550 delivers 57.71MB/s and 14,770 IOPS. The Solidigm P5336 61.44TB follows at 38.21MB/s and 9,782 IOPS, while the P5336 122.88TB trails slightly at 37.93MB/s and 9,710 IOPS. The difference between the two Solidigm models is under 1%, showing no advantage from the increased capacity at low depth.
With higher concurrency (32-16), the Micron 6550 reaches 7,787.27MB/s and 1.99 million IOPS. The Solidigm 61.44TB scales to 3,799.77MB/s and 972,743 IOPS, slightly ahead of the 122.88TB, which comes in at 3,643.64MB/s and 932,770 IOPS. This represents a 4.1% drop in throughput and a 4.1% drop in IOPS for the larger capacity model under peak random read load.
4K Random Read Latency
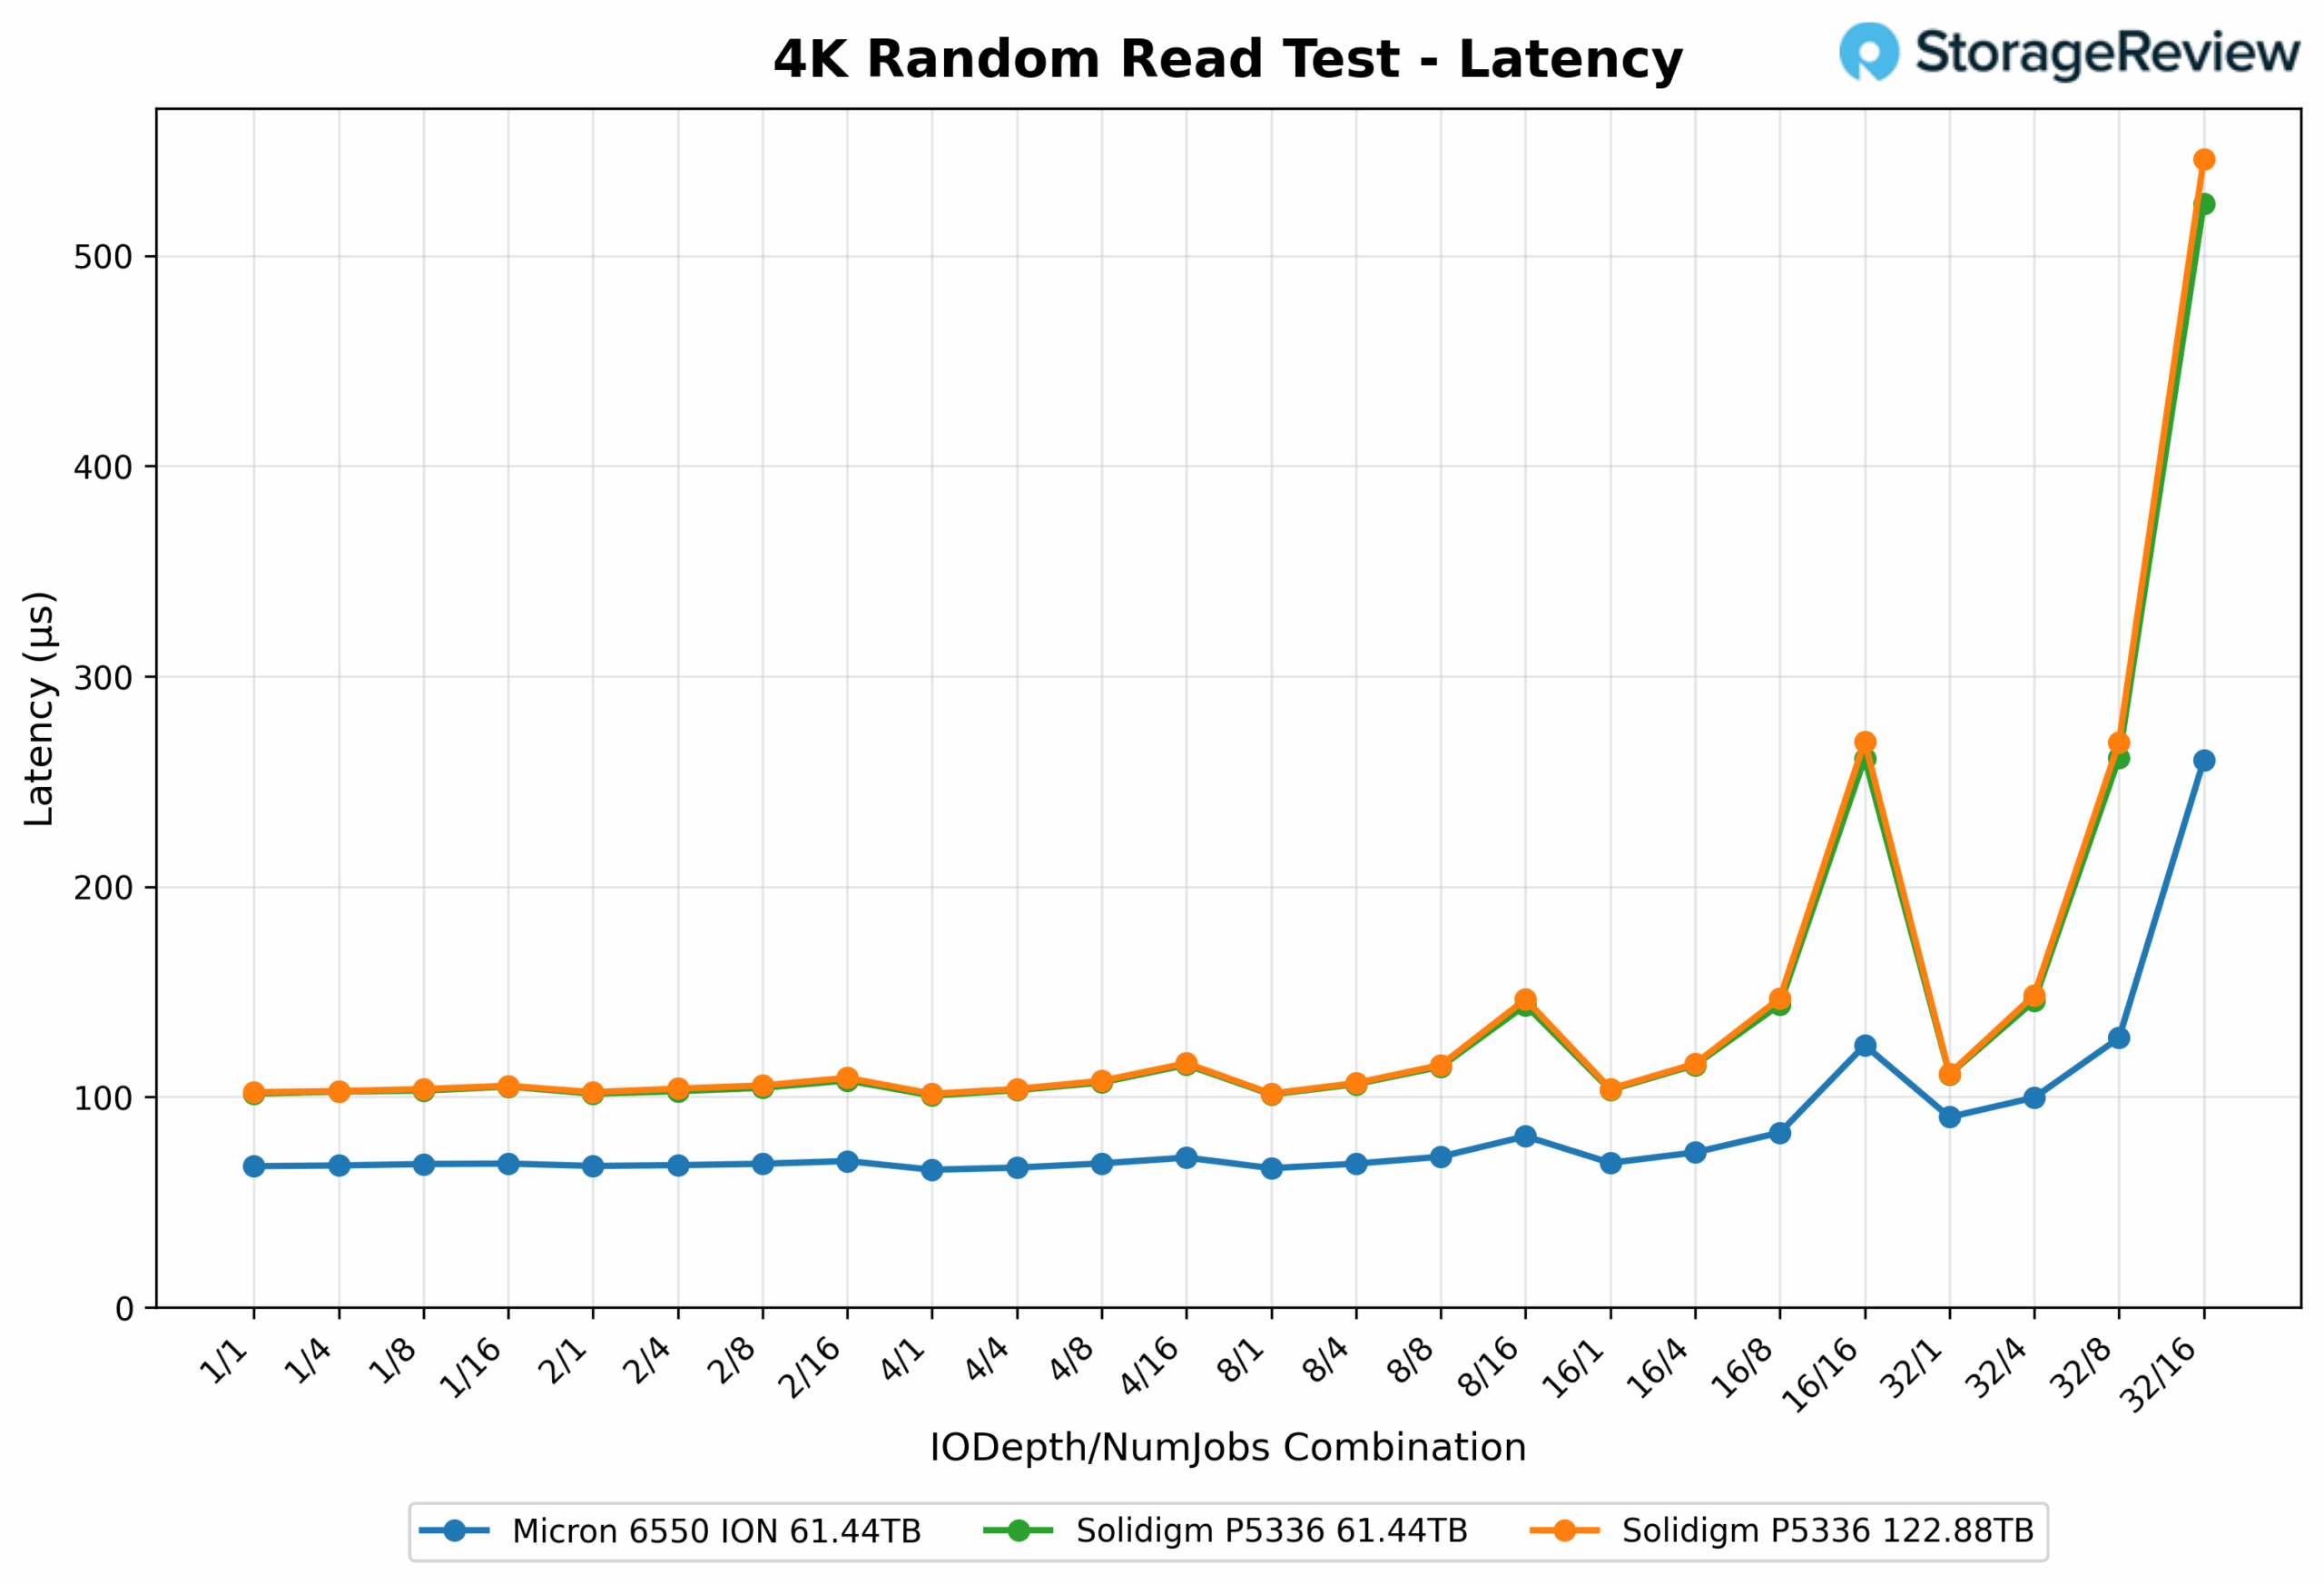
At (1-1), the Micron 6550 posts the lowest latency at 0.067ms. Both Solidigm P5336 models measure 0.102ms, showing no improvement in latency with the increased capacity. Under heavy load (32-16), the Micron maintains strong efficiency at 0.260ms. The P5336 61.44TB records 0.525ms, while the 122.88TB model increases slightly to 0.546ms, a 4% rise in latency that reflects a very minimal decline in efficiency for the higher-capacity drive under peak random read conditions.
GPU Direct Storage
One of the tests we conducted on this testbench was the Magnum IO GPU Direct Storage (GDS) test. GDS is a feature developed by NVIDIA that allows GPUs to bypass the CPU when accessing data stored on NVMe drives or other high-speed storage devices. Instead of routing data through the CPU and system memory, GDS enables direct communication between the GPU and the storage device, significantly reducing latency and improving data throughput.
How GPU Direct Storage Works
Traditionally, when a GPU processes data stored on an NVMe drive, the data must first travel through the CPU and system memory before reaching the GPU. This process introduces bottlenecks, as the CPU becomes a middleman, adding latency and consuming valuable system resources. GPU Direct Storage eliminates this inefficiency by enabling the GPU to access data directly from the storage device via the PCIe bus. This direct path reduces the overhead associated with data movement, allowing faster and more efficient data transfers.
AI workloads, especially those involving deep learning, are highly data-intensive. Training large neural networks requires processing terabytes of data, and any delay in data transfer can lead to underutilized GPUs and longer training times. GPU Direct Storage addresses this challenge by ensuring that data is delivered to the GPU as quickly as possible, minimizing idle time and maximizing computational efficiency.
In addition, GDS is particularly beneficial for workloads that involve streaming large datasets, such as video processing, natural language processing, or real-time inference. By reducing the reliance on the CPU, GDS accelerates data movement and frees up CPU resources for other tasks, further enhancing overall system performance.
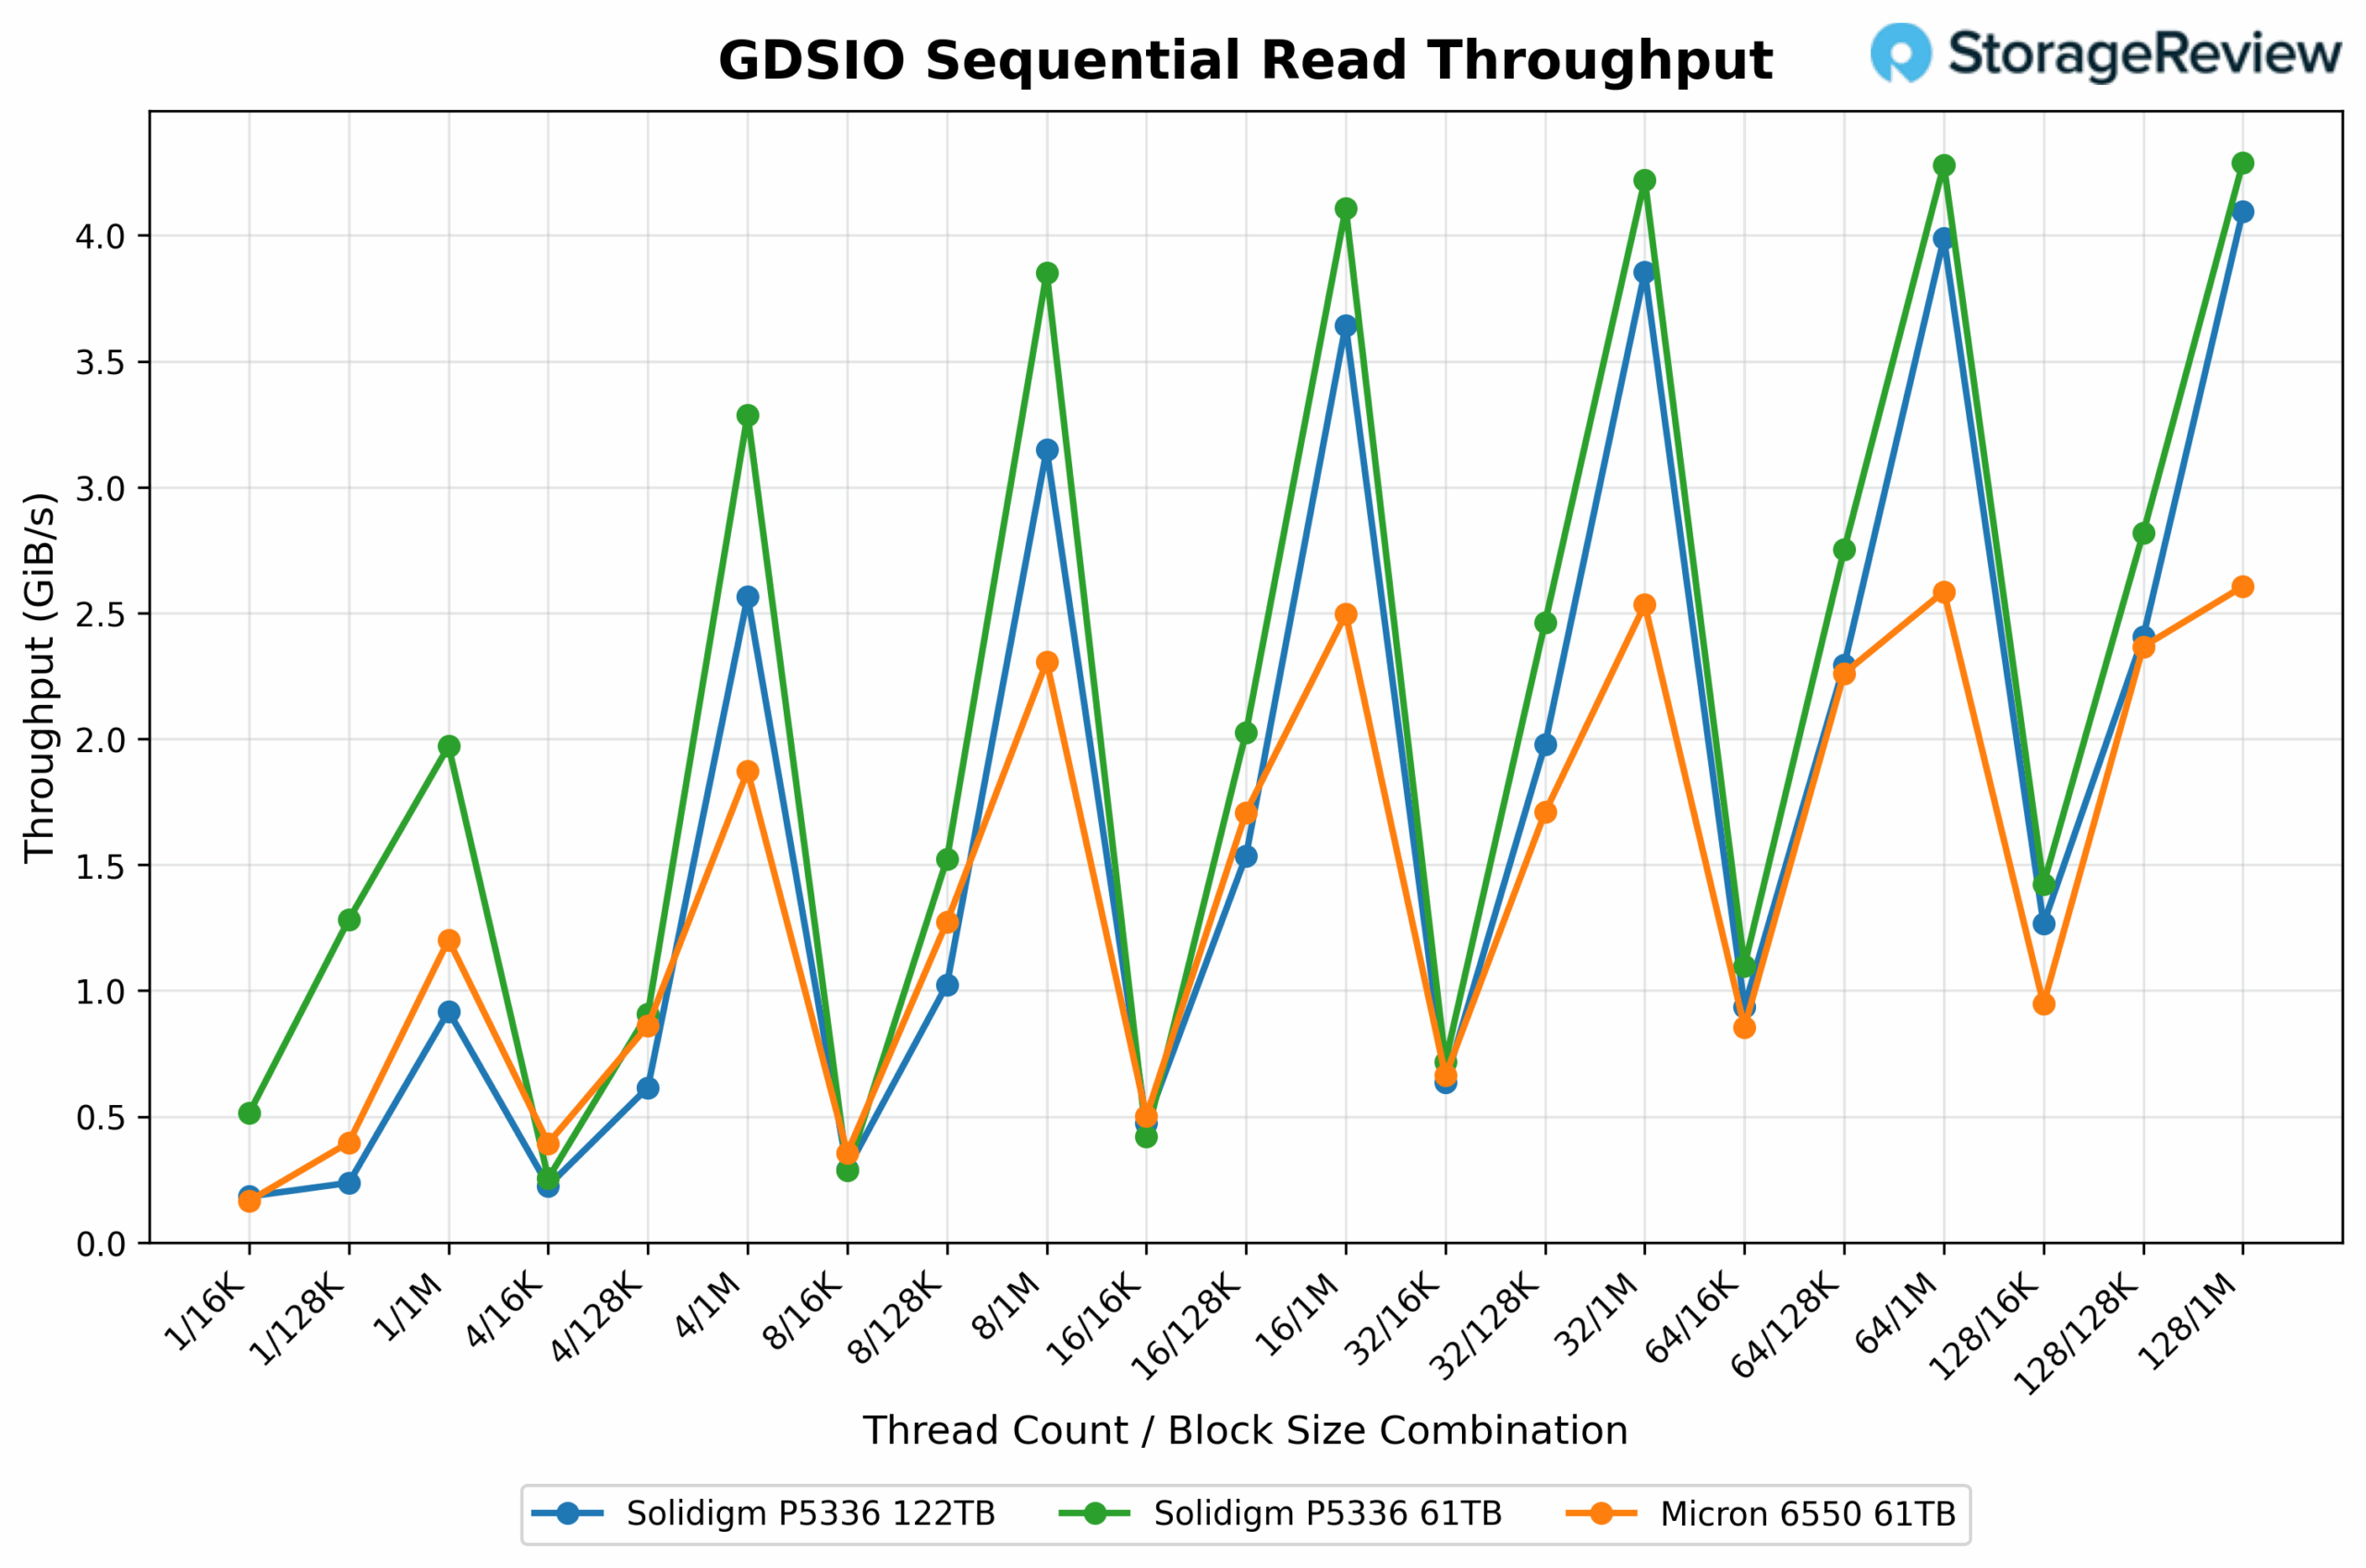
For 16K random reads at single-thread, the Solidigm P5336 61.44TB delivers 526.40MB/s, outperforming the 122.88TB model at 187.21MB/s by a margin of 181%. The Micron 6550 lands between them at 169.15MB/s. Here, the higher-capacity Solidigm model underperforms relative to its smaller counterpart.
Moving into 128 Thread Count 1M sequential reads under high concurrency, the Solidigm P5336 61.44TB leads with 4,391.68MB/s, followed closely by the 122.88TB model at 4,193.56MB/s. The Micron 6550 comes in lower at 2,667.99MB/s. The 122.88TB drive trails its smaller sibling by about 4.5%, while outperforming the Micron by 57%.
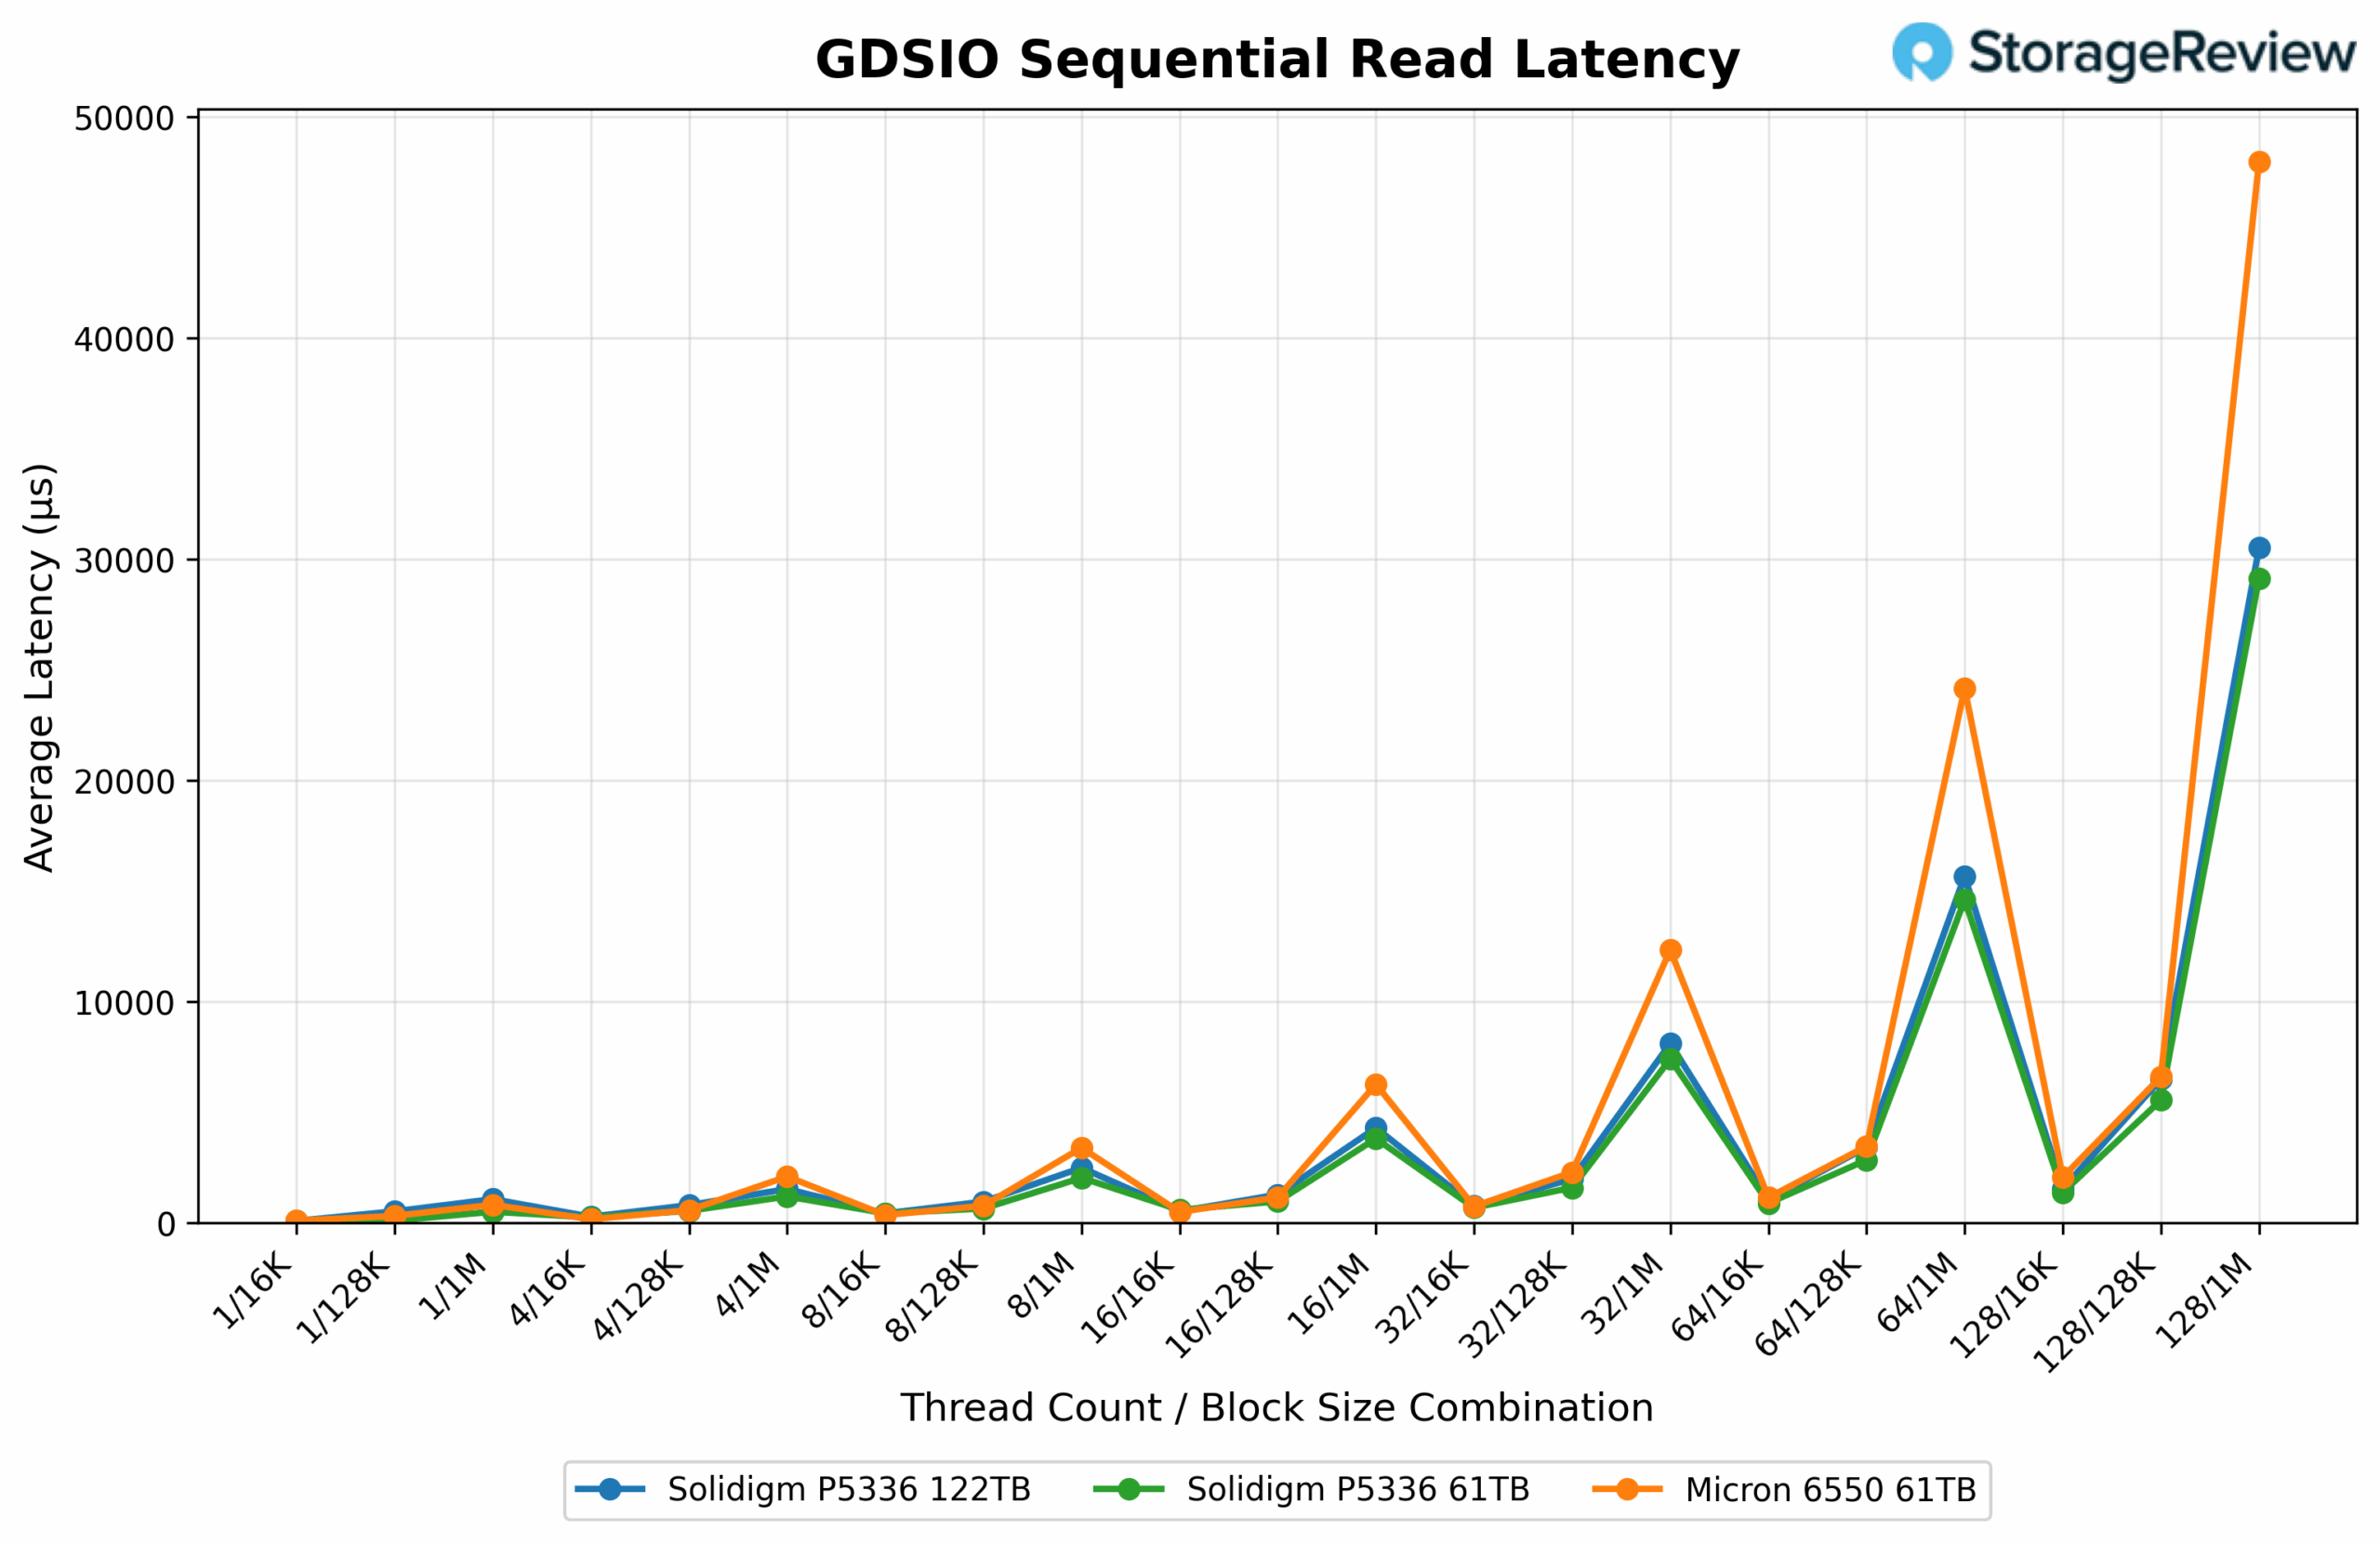
The Solidigm P5336 61.44TB delivers the lowest latency at 0.048ms, followed by the 122.88TB model at 0.082ms, which is approximately 70.8% higher than its smaller sibling. The Micron 6550 trails both, with the highest latency of 0.090ms in this configuration.
Under high thread count, the Solidigm 61.44TB latency measured 0.291ms, followed by the 122.88TB at 0.305ms, a 4.8% increase. The Micron 6550 comes in last at 0.479ms, showing significantly higher latency under heavy write load.
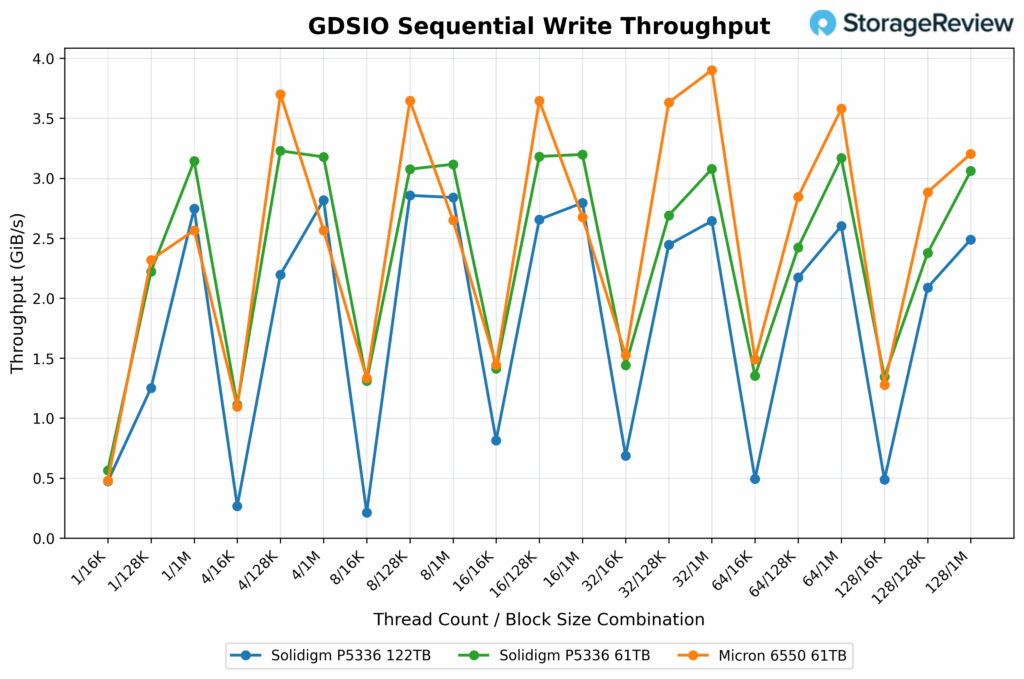 TBAt a single thread with 16K block size, the Solidigm P5336 61.44TB begins with 592.34MB/s, followed by the Micron 6550 at 502.97MB/s. The Solidigm P5336 122.88TB trails slightly at 496.59MB/s, showing a 16.1% performance gap between the two Solidigm models at this low-load setting.
Under maximum concurrency 128T and 1M block size, the Micron 6550 starts with 3,281.49MB/s, just ahead of the Solidigm 61.44TB, which records 3,134.03MB/s. The Solidigm 122.88TB comes in at 2,549.28MB/s, making it roughly 18.6% slower than the 61TB model. Despite its higher capacity, the 122TB variant shows reduced throughput scaling under this heavy write load.
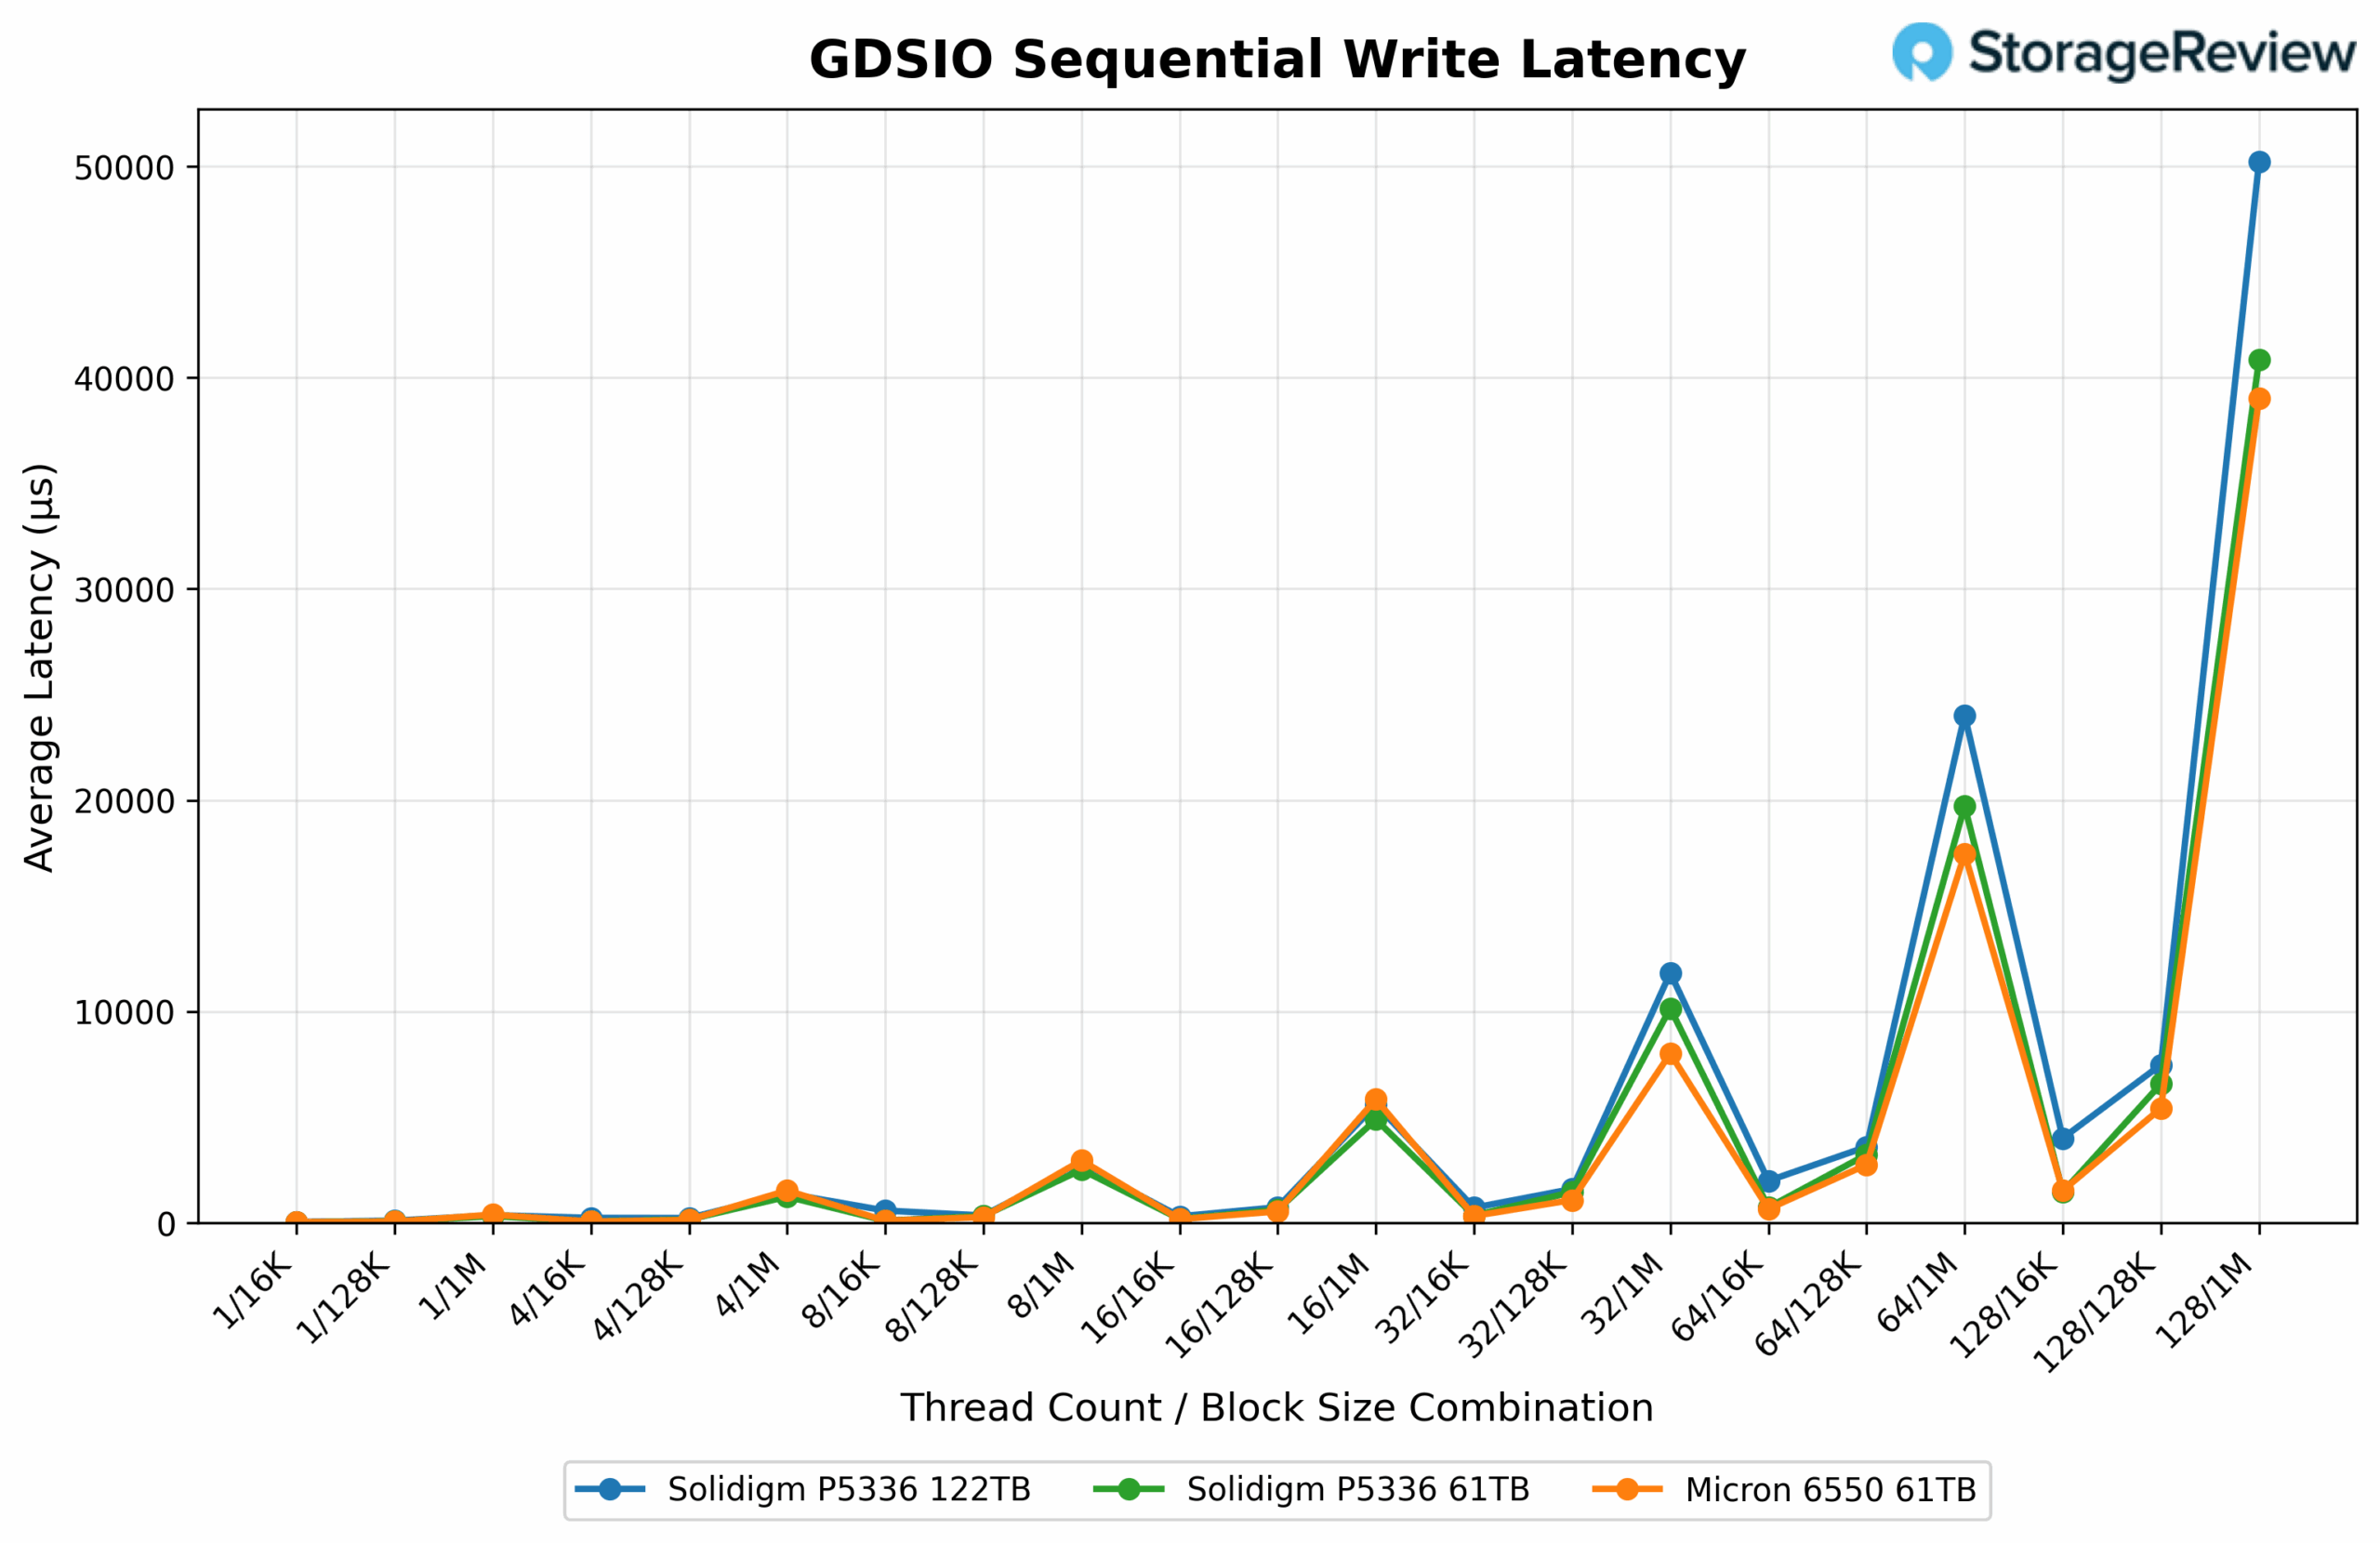
At 1T 16K sequential writes, the Micron 6550 again posts the lowest latency at 0.030ms, just a tad ahead of the Solidigm P5336 122.88TB at 0.031ms, a negligible difference. The Solidigm P5336, at 61.44TB, actually leads the group here at 0.026ms, edging out both drives by a small margin.
In 128T 1M sequential writes under heavy concurrency, the Micron 6550 achieves a latency of 0.390 ms. The Solidigm 61.44TB follows at 0.408ms, while the 122.88TB model trails at 0.502ms, reflecting a 23% increase in latency compared to the 61TB Solidigm model.
Conclusion
Solidigm’s D5-P5336 122.88TB SSD delivers unmatched storage density, robust power efficiency per TB, and impressive scalability, addressing critical enterprise needs for space reduction, energy conservation, and simplified infrastructure management. By dramatically increasing the capacity per drive without expanding the physical footprint, Solidigm enables data centers to consolidate storage racks significantly, directly benefiting operational costs and environmental sustainability while being ready for the increasing demands of emerging workloads driven by the surge in AI.
In CDN workload testing, the SSD delivered consistent sequential read throughput, reaching approximately 7.5GB/s at higher queue depths, while maintaining stability even under increased concurrency. For random reads within CDN scenarios, it closely matched its smaller 61.44TB counterpart, demonstrating near-identical performance, highlighting Solidigm’s effective architecture consistency. In FIO benchmarks, the D5-P5336 122.88TB notably outperformed the prior 61TB model in sequential writes by up to 25%, achieving 3,152.5MB/s at a queue depth of 16, with a latency improvement of approximately 20% (0.634ms versus 0.798ms). However, random write scenarios indicated some trade-offs, as the larger drive recorded lower throughput at 16K block sizes, reflecting its design optimization for sequential and read-intensive workloads.
Under GPU Direct Storage (GDSIO) conditions, the drive maintained competitive sequential read speeds of approximately 4,193MB/s at 1MB block sizes with high concurrency, only marginally trailing its smaller variant by 4.5%. Overall, the Solidigm D5-P5336 122.88TB SSD delivers compelling density, predictable performance, and effective scaling capabilities tailored for modern, demanding enterprise data environments.
As the unending appetite for data continues to escalate, storage solutions that maximize density and minimize power consumption become increasingly essential. Drives like the D5-P5336 clearly illustrate how innovation in NAND technology and intelligent design can help data centers sustainably handle future growth. Looking ahead, we anticipate that Solidigm will further push the boundaries of capacity and efficiency, potentially doubling up again to deliver a groundbreaking 245.76TB SSD before the end of this year.


 Amazon