

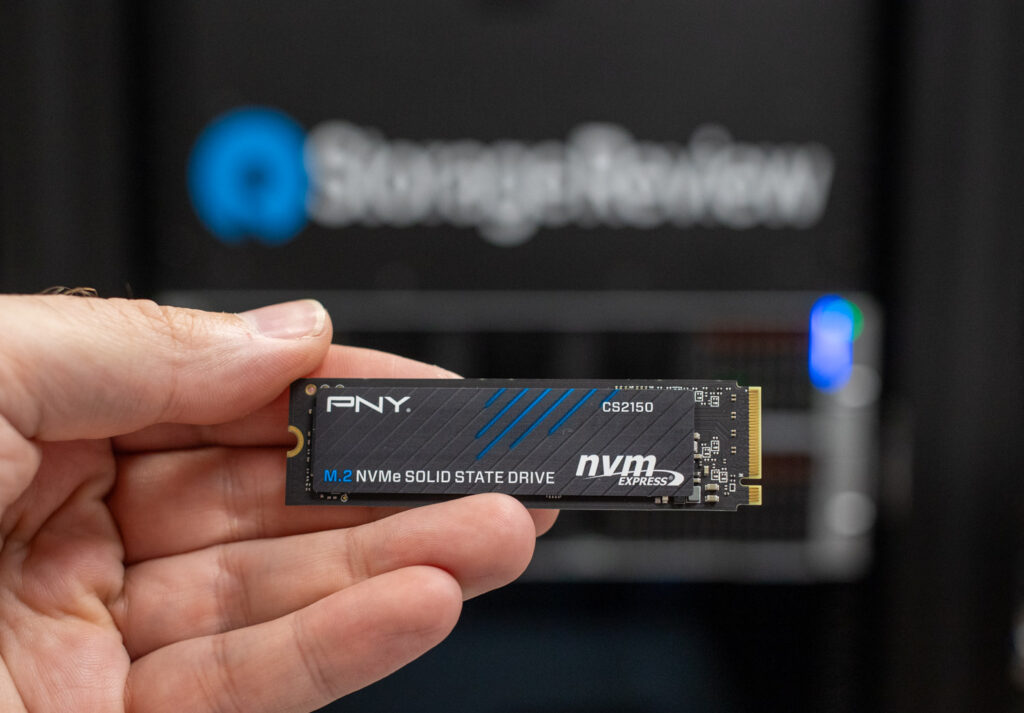
The PNY CS2150 is positioned as an entry-level PCIe Gen5 SSD, making no promises of competing with the fastest drives on the market. Available in 1TB and 2TB capacities, it’s one of the more affordable ways to step into Gen5 territory. As we’ve seen with the recent surge of Gen5 releases, performance margins at the top are razor-thin, but budget-oriented models like the CS2150 aim to stand out through aggressive pricing rather than benchmark wins.
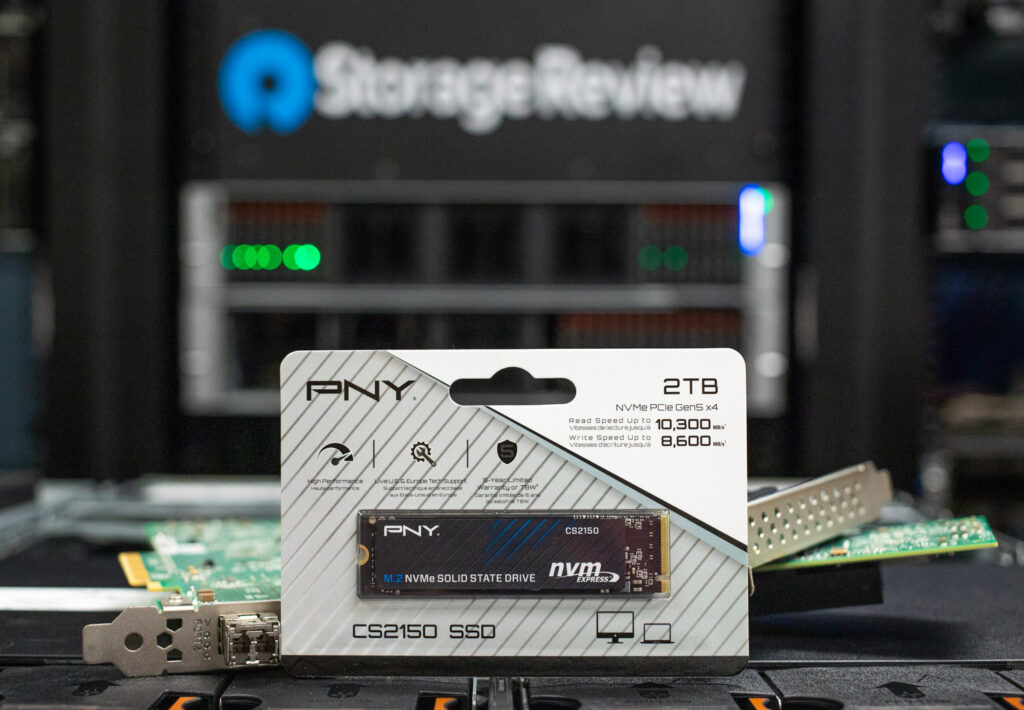
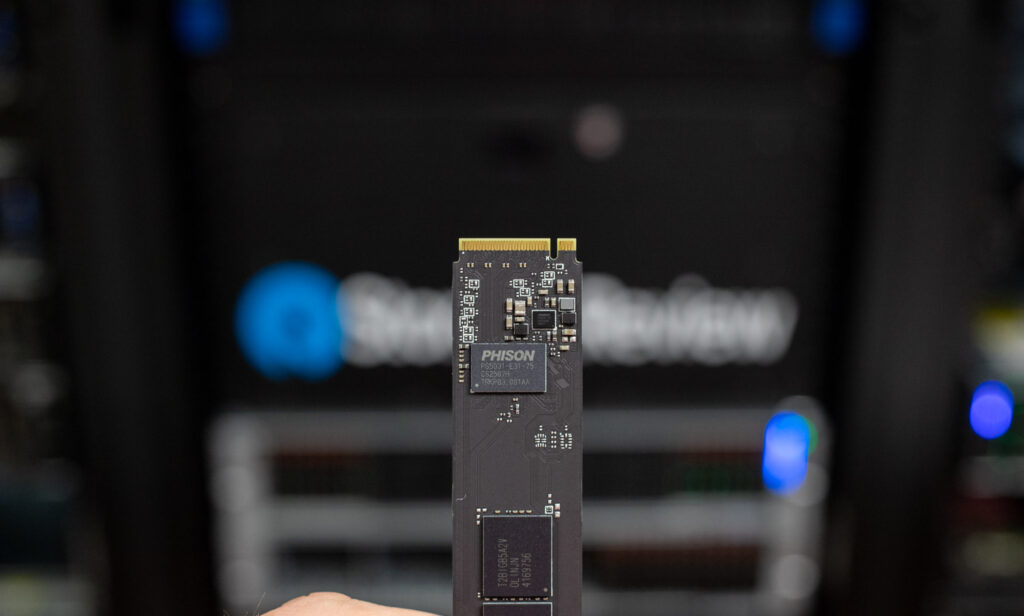
The CS2150 is powered by the Phison E31 controller, a low-cost, DRAM-less design that’s been appearing in many of the more budget-focused Gen5 drives. Technically, it supports PCIe Gen5 x4 and quotes speeds of up to a modest 10,300MB/s read and 8,600MB/s write, which is still significantly lower than the speeds of the other Gen5 drives we tested. Therefore, users should temper their expectations if they plan to go this route.
Still, the CS2150 does include a few features that add value at this price point. Microsoft DirectStorage support is onboard, promising smoother asset streaming in supported games. Additionally, TCG Opal 2.0 hardware encryption offers basic data security, a feature not often found in drives at this price point. Endurance figures and TBW ratings aren’t specified up front, but the drive is backed by a 5-year limited warranty, which at least provides some long-term assurance. It’s also good to see live US-based tech support included, which remains a strength for PNY.
As a Gen5 offering, the CS2150 won’t break new ground in performance, but it does set a baseline for what the low end of this interface tier looks like. If it can remain consistent under moderate workloads and avoid thermal or throttling issues, it may still prove to be a decent Gen5 entry point for budget-conscious buyers. So, let’s see how it holds up under our full test suite.
PNY CS2150 Specifications
| Specification | Detail |
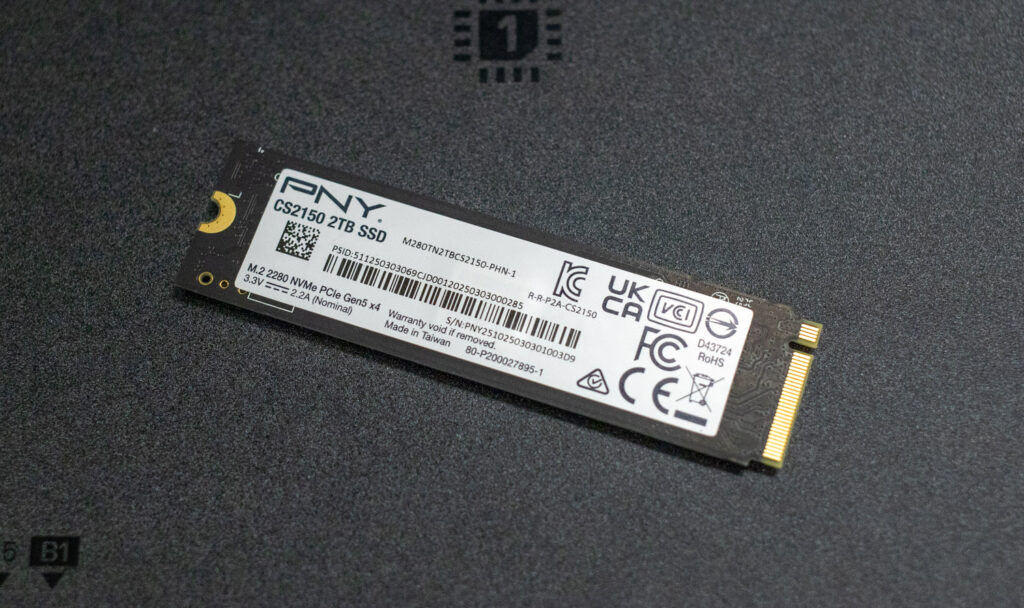
| Model | PNY CS2150 |
| Form Factor | M.2 2280 |
| Interface | PCIe Gen5 x4, NVMe |
| Controller | Phison E31 |
| NAND | 3D Flash Memory |
| Sequential Read (Max) | Up to 10,300MB/s |
| Sequential Write (Max) | Up to 8,600MB/s |
| Capacities | 1TB, 2TB |
| Encryption | TCG Opal 2.0 Hardware Encryption |
| Software Features | Microsoft DirectStorage Support |
| Warranty | 5-Year Limited Warranty or TBW |
| MSRP | $98.99 (1TB), $181.99 (2TB) |
PNY CS2150 Performance
Comparables
Before diving into the benchmarks, here’s a list of comparable drives tested alongside the PNY CS2150 and their respective PCIe generation:
- Lexar Professional NM1090 PRO (PCIe Gen5)
- SK hynix Platinum P51 (PCIe Gen5)
- Kingston FURY Renegade G5 (PCIe Gen5)
- SanDisk WD_BLACK SN8100 (PCIe Gen5)
- Crucial T705 (PCIe Gen5)
- Crucial P510 (PCIe Gen5)
- Samsung 9100 Pro 4TB (PCIe Gen5)
- Samsung 990 Pro (PCIe Gen4)
- WD SN850X (PCIe Gen4)
For this review, we’ll focus on the 2TB model of the PNY CS2150.
We subjected these drives to various tests to evaluate their real-world and synthetic performance. This includes LLM load times to measure how quickly they handle large AI models, DirectStorage tests to assess how fast they load game assets and process in-game data, and Blackmagic Design tests to evaluate read and write speeds for high-resolution video editing. We’ll also run PCMark 10 to gauge overall system responsiveness, 3DMark Storage to test gaming performance, and FIO tests to measure peak sequential and random read/write speeds under heavy workloads.
Here’s the high-performance test rig we used for benchmarking:
- CPU: AMD Ryzen 7 9800X3D
- Motherboard: Asus ROG Crosshair X870E Hero
- RAM: G.SKILL Trident Z5 Royal Series DDR5-6000 (2x16GB)
- GPU: NVIDIA GeForce RTX 4090
- OS: Windows 11 Pro, Ubuntu 24.10 Desktop
Peak Synthetic Performance
The FIO test is a flexible and powerful benchmarking tool used to measure the performance of storage devices, including SSDs and HDDs. It evaluates metrics such as bandwidth, IOPS (Input/Output Operations Per Second), and latency under different workloads, like sequential and random read/write operations. This test helps to assess the peak performance of storage systems, making it useful for comparing different devices or configurations. We measured the peak burst performance for this test, limiting the workload to a 10GB footprint on both SSDs.
Here, the PNY CS2150 lands squarely in entry-level Gen5 territory. Its sequential read of 10,400MB/s and write of 8,801MB/s fall well below the 13–15GB/s ceiling achieved by top-tier drives like the SN8100 or T705, but still mark a noticeable bump over Gen4 SSDs. Random 4K results are more middling, with 1.379M read IOPS and 1.623M write IOPS, and slightly elevated latency across the board. These numbers reflect the limits of the Phison E31 controller, which, as we indicated above, prioritizes cost over raw performance. For everyday users or general-purpose workloads, these speeds are more than sufficient; however, for high-end prosumer or workstation use, it lags well behind faster Gen5 alternatives.
| FIO Test (higher MB/s/IOPS is better) | Sequential 128K Read (1T/64Q) | Sequential 128K Write (1T/64Q) | Random 4K Read (16T/32Q) | Random 4K Write (16T/32Q) |
| SanDisk SN8100 | 15,000 MB/s (0.56ms avg latency) | 14,100 MB/s (0.59ms avg latency) | 2.312M IOPS (0.22ms avg latency) | 2.144M IOPS (0.24ms avg latency) |
| Kingston FURY Renegade G5 | 14,600 MB/s (0.57ms avg latency) | 14,100 MB/s (0.59ms avg latency) | 2.028M IOPS (0.25ms avg latency) | 2.028M IOPS (0.25ms avg latency) |
| Samsung 9100 Pro | 14,600 MB/s (0.57ms avg latency) | 13,300 MB/s (0.63ms avg latency) | 2.734M IOPS (0.18ms avg latency) | 2.734M IOPS (0.19ms avg latency) |
| SK hynix Platinum P51 | 14,500 MB/s (0.58ms avg latency) | 13,500 MB/s (0.62ms avg latency) | 2.369M IOPS (0.22ms avg latency) | 2.669M IOPS (0.19ms avg latency) |
| Crucial T705 | 14,400 MB/s (0.58ms avg latency) | 12,300 MB/s (0.68ms avg latency) | 1.585M IOPS (0.32ms avg latency) | 2.703M IOPS (0.19ms avg latency) |
| Lexar Professional NM1090 PRO | 13,800GB/s (0.61ms avg latency) | 13,600 MB/s (0.62ms avg latency) | 2.073M IOPS (0.32ms avg latency) | 2.215M IOPS (0.23ms avg latency) |
| PNY CS2150 | 10,400GB/s (0.80ms avg latency) | 8,801MB/s (0.95ms avg latency) | 1.379M IOPS (0.371ms avg latency) | 1.623 IOPS (0.32ms avg latency) |
| Crucial P510 | 8,835 MiB/s (0.90 ms avg latency) | 9,961 MB/s (0.80 ms avg latency) | 1.163M IOPS (0.44ms avg latency) | 1.196M IOPS (0.51ms avg latency) |
| Samsung 990 Pro | 7,483 MB/s (1.12ms avg latency) | 7,197 MB/s (1.16ms avg latency) | 1.400M IOPS (0.36ms avg latency) | 1.403M IOPS (0.36ms avg latency) |
| WD SN850X 2TB | 6,632 MB/s (0.76ms avg latency) | 7,235 MB/s (0.92ms avg latency) | 1.2M IOPS (0.43ms avg latency) | 825K IOPS (0.62ms avg latency) |
Average LLM Load Time
The Average LLM Load Time test evaluated the load times of three different LLMs: DeepSeek R1 7B, Meta Llama 3.2 11B, and DeepSeek R1 32B. Each model was tested 10 times, and the average load time was calculated. This test measures the drive’s ability to load large language models (LLMs) into memory quickly. LLM load times are critical for AI-related tasks, especially for real-time inference and extensive dataset processing. Faster loading enables the model to process data quickly, thereby improving AI responsiveness and reducing waiting time.
When it comes to AI readiness, the PNY CS2150 is competent. In our LLM loading test, it clocked in at 2.81s for the 7B model and nearly 4.9s on the 32B test. Although they are solid results that outperform some Gen4 drives, once again, they fall short of what faster Gen5 drives deliver. Compared to leaders like the Platinum P51 or SN8100, the CS2150 shows signs of I/O bottlenecking under large model loading. This won’t matter for casual inference tasks, but for developers frequently cycling large models, these delays can add up.
| Average LLM Load Time (lower is better) | DeepSeek R1 7B | Meta Llama 3.2 11B Vision | DeepSeek R1 32B |
| SK hynix Platinum P51 | 2.5481s | 3.5809s | 4.1790s |
| SanDisk SN8100 | 2.5702s | 3.5856s | 4.2870s |
| Samsung 9100 Pro 4TB | 2.6173s | 3.6017s | 4.3735s |
| PNY CS2150 | 2.8107s | 3.6820s | 4.8962s |
| Crucial T705 2TB | 2.8758s | 3.6312s | 5.1080s |
| Samsung 990 Pro 2TB | 2.8758s | 3.6312s | 5.1080s |
| Crucial P510 1TB | 2.8817s | 3.6631s | 5.0594s |
| WD SN850X 2TB | 3.0082s | 3.6543s | 5.4844s |
| Kingston FURY Renegade G5 | 3.1843s | 4.8009s | 4.6523s |
| Lexar Professional NM1090 PRO | 3.2135s | 4.9504s | 7.2108s |
3DMark Direct Storage
The 3DMark DirectStorage Feature Test evaluates how Microsoft’s DirectStorage optimizes game asset loading on PCIe SSDs. By reducing CPU overhead and improving data transfer speeds, DirectStorage enhances loading times, especially when paired with GDeflate compression and Windows 11’s BypassIO. This test isolates storage performance to highlight the potential bandwidth improvements when DirectStorage is enabled.
With 19.49GB/s on compressed asset loading and 8.6GB/s on uncompressed DirectStorage transfers, it’s well behind the top group, which often approaches 25–26GB/s compressed and 11–13GB/s uncompressed. RAM-bound transfers also trend low, with sub-10GB/s figures across the board.
| 3DMark Direct Storage, (GB/s, higher is better) | Storage to VRAM (GDeflate Compression) | Storage to VRAM (DirectStorage on, Uncompressed) | Storage to VRAM (DirectStorage off, Uncompressed) | Storage to RAM (DirectStorage on, Uncompressed) | Storage to RAM (DirectStorage off, Uncompressed) | GDeflate Decompression Bandwidth |
| SK hynix Platinum P51 | 26.32 | 11.20 | 7.75 | 12.85 | 9.46 | 64.68 |
| SanDisk SN8100 | 26.11 | 12.94 | 7.63 | 12.94 | 9.78 | 64.51 |
| Crucial T705 2TB | 25.75 | 10.71 | 8.79 | 12.03 | 8.83 | 66.36 |
| Lexar Professional NM1090 PRO | 24.03 | 11.23 | 7.57 | 12.18 | 8.72 | 63.15 |
| Samsung 9100 Pro 4TB | 23.77 | 11.26 | 8.92 | 11.62 | 9.48 | 66.61 |
| Kingston FURY Renegade G5 | 23.29 | 10.03 | 7.44 | 11.81 | 9.63 | 65.79 |
| PNY CS2150 | 19.49 | 8.60 | 6.98 | 9.22 | 7.70 | 62.43 |
| WD SN850X 2TB | 15.28 | 11.11 | 8.93 | 6.78 | 6.27 | 64.96 |
| Samsung 990 Pro 2TB | 14.18 | 11.28 | 8.84 | 6.57 | 6.20 | 65.71 |
| Crucial P510 1TB | 19.63 | 8.33 | 6.92 | 9.06 | 7.49 | 66.22 |
Blackmagic Disk Speed Test
The Blackmagic Disk Speed Test benchmarks a drive’s read and write speeds, estimating its performance, especially for video editing tasks. It helps users ensure their storage is fast enough for high-resolution content, like 4K or 8K video.
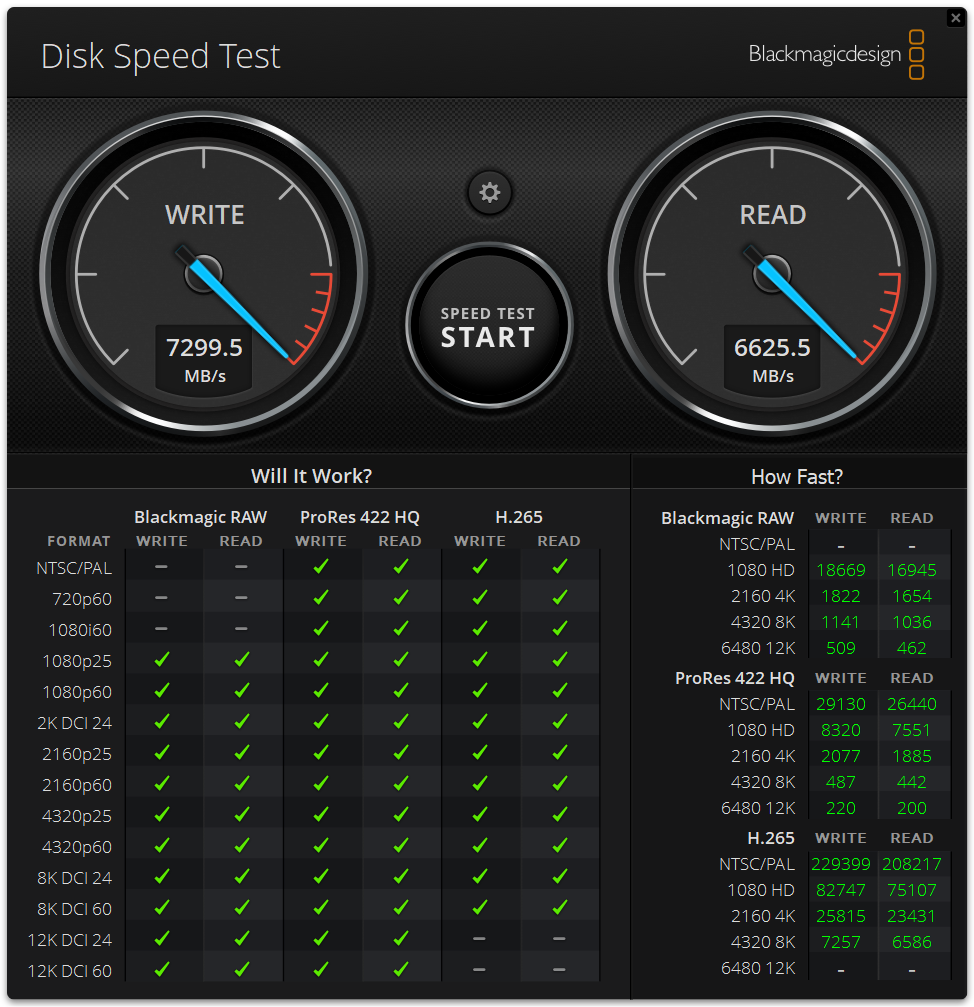
With 6,625MB/s read and 7,299MB/s write speeds, it sits below nearly every other Gen5 drive tested and is only modestly ahead of high-end Gen4 models. These speeds are sufficient for 4K video workflows and most general media editing, but 8K or high-bitrate raw footage might push the drive’s limits. Creatives on a budget will still find it usable, though it doesn’t bring the headroom or consistency that professionals may expect from Gen5 hardware.
Here’s our current Blackmagic disk speed leaderboard:
| Blackmagic Disk Speed (MB/s, higher is better) | Read MB/s | Write MB/s |
| SanDisk SN8100 | 10,005.2 | 10,581.0 |
| Kingston FURY Renegade G5 | 9,665.0 | 10,831.0 |
| Samsung 9100 Pro 4TB | 9,542.3 | 9,907.9 |
| SK hynix Platinum P51 | 9,241.0 | 9,109.0 |
| Lexar Professional NM1090 PRO | 9,149.2 | 10,466.6 |
| Crucial T705 2TB | 8,464.2 | 10,256.4 |
| Crucial P510 1TB | 7,853.9 | 7,939.6 |
| PNY CS2150 | 6,625.5 | 7,299.5 |
| WD SN850X 2TB | 5,862.6 | 5,894.8 |
| Samsung 990 Pro 2TB | 5,769.5 | 5,842.9 |
PCMark10 Storage
PCMark 10 Storage Benchmarks evaluate real-world storage performance using application-based traces. They test system and data drives, measuring bandwidth, access times, and consistency under load. These benchmarks offer practical insights beyond synthetic tests, enabling users to compare modern storage solutions effectively.
The CS2150 posts a very moderate score of 6,070, which puts it behind even the Gen4 Crucial P310 SSD. This means it trails by a significant margin compared to more capable Gen5 drives, such as the T705 (8,783) or P51 (8,665). The gap is large enough to matter for heavier multitasking or content creation, where bandwidth and latency compound over time, making it crucial to address. That said, for office use, light gaming, and general desktop tasks, the CS2150 still performs adequately.
| PCMark 10 Data Drive (higher is better) | Overall Score |
| Crucial T705 2TB | 8,783 |
| SK hynix Platinum P51 | 8,665 |
| SanDisk SN8100 | 8,644 |
| Lexar Professional NM1090 PRO | 8,247 |
| Kingston FURY Renegade G5 | 8,062 |
| Samsung 9100 Pro 4TB | 7,552 |
| Samsung 990 Pro 2TB | 7,173 |
| Crucial P310 2TB | 6,436 |
| PNY CS2150 | 6,070 |
| WD SN850X 2TB | 4,988 |
3DMark Storage
The 3DMark Storage Benchmark tests your SSD’s gaming performance by measuring tasks like loading games, saving progress, installing game files, and recording gameplay. It evaluates how well your storage handles real-world gaming activities and supports the latest storage technologies for accurate performance insights.
In this gaming-focused workload, the CS2150 scores 4,193, slightly edging out Gen4 competitors like the 990 Pro and SN850X. While it remains behind most Gen5 drives, which cross the 5,000–6,000 range, the difference here is unlikely to be felt in actual gameplay. CS2150 once again serves as a “good enough” solution.
| 3DMark Storage benchmark (higher is better) | Overall Score |
| SanDisk SN8100 | 6,047 |
| Kingston FURY Renegade G5 | 5,670 |
| Crucial T705 2TB | 5,100 |
| SK hynix Platinum P51 | 5,082 |
| Lexar Professional NM1090 PRO | 4,828 |
| Samsung 9100 Pro 4TB | 4,779 |
| Crucial P510 1TB | 4,148 |
| PNY CS2150 | 4,193 |
| Samsung 990 Pro 2TB | 4,128 |
| WD SN850X 2TB | 3,962 |
| Crucial P310 2TB | 3,848 |
GPU Direct Storage
One of the tests we conducted on this testbench was the Magnum IO GPU Direct Storage (GDS) test. GDS is a feature developed by NVIDIA that allows GPUs to bypass the CPU when accessing data stored on NVMe drives or other high-speed storage devices. Instead of routing data through the CPU and system memory, GDS enables direct communication between the GPU and the storage device, significantly reducing latency and improving data throughput.
How GPU Direct Storage Works
Traditionally, when a GPU processes data stored on an NVMe drive, the data must first travel through the CPU and system memory before reaching the GPU. This process introduces bottlenecks, as the CPU becomes a middleman, adding latency and consuming valuable system resources. GPU Direct Storage eliminates this inefficiency by enabling the GPU to access data directly from the storage device via the PCIe bus. This direct path reduces the overhead associated with data movement, allowing faster and more efficient data transfers.
AI workloads, especially those involving deep learning, are highly data-intensive. Training large neural networks requires processing terabytes of data, and any delay in data transfer can lead to underutilized GPUs and longer training times. GPU Direct Storage addresses this challenge by ensuring that data is delivered to the GPU as quickly as possible, minimizing idle time and maximizing computational efficiency.
In addition, GDS is particularly beneficial for workloads that involve streaming large datasets, such as video processing, natural language processing, or real-time inference. By reducing the reliance on the CPU, GDS accelerates data movement and frees up CPU resources for other tasks, further enhancing overall system performance.
Results
At the 16K block size, it delivered 2.5 GiB/s reads and 1.8 GiB/s writes, which is serviceable but noticeably (yet again) behind faster Gen5 drives like the Kingston FURY Renegade G5 (3.7/2.4 GiB/s) and the Lexar NM1090 PRO (3.6/2.3 GiB/s). Its mid-size (128K) throughput of 4.5 GiB/s read and 4.7 GiB/s write is roughly in line with upper-end Gen4 drives, while 1M block results showed some bottlenecking, with a ceiling of 4.9 GiB/s writes and 4.6 GiB/s reads.
Latency figures at larger block sizes were noticeably higher, which can restrict their usefulness for streaming data-intensive AI or real-time GPU workloads. Ultimately, while it gets the job done, it doesn’t fully capitalize on the low-latency, high-bandwidth advantages Gen5 is capable of delivering, primarily due to the budget Phison E31 controller.
Here’s a full run-down:
| GDSIO Chart (16K,128K,1M Block Size Averages) | (16K Block Size 128 IO Depth) Average Read | (16K Block Size 128 IO Depth) Average Write | (128K Block Size 128 IO Depth) Average Read | (128K Block Size 128 IO Depth) Average Write | (1M Block Size 128 IO Depth) Average Read | (1M Block Size 128 IO Depth) Average Write |
| Kingston FURY Renegade G5 | 3.7 GiB/s (0.526ms) IOPS: 242.1K | 2.4 GiB/s (0.824ms) IOPS: 154.7K | 5.9 GiB/s (2.704ms) IOPS: 48.5K | 5.8 GiB/s (0.564ms) IOPS: 47.3K | 6.5 GiB/s (19.356ms) IOPS: 6.6K | 6.3 GiB/s (19.690ms) IOPS: 6.5K |
| Lexar Professional NM1090 PRO | 3.6 GiB/s (0.533ms) IOPS: 238.7K | 2.3 GiB/s (0.845ms) IOPS: 150.8K | 5.9 GiB/s (2.639ms) IOPS: 48.4K | 4.2 GiB/s (3.714ms) IOPS: 34.4K | 6.5 GiB/s (19.274ms) IOPS: 6.6K | 6.2 GiB/s (20.127ms) IOPS: 6.4K |
| SanDisk SN8100 | 3.4 GiB/s (0.564ms) IOPS: 225.9K | 2.1 GiB/s (0.907ms) IOPS: 140.6K | 5.9 GiB/s (2.626ms) IOPS: 48.7K | 5.8 GiB/s (2.668ms) IOPS: 47.9K | 6.5 GiB/s (19.264ms) IOPS: 6.6K | 5.9 GiB/s (21.063ms) IOPS: 6.1K |
| Samsung 9100 Pro 4TB | 3.4 GiB/s (0.565ms) IOPS: 226.4K | 2.3 GiB/s (0.839ms) IOPS: 161.7K | 5.2 GiB/s (3.001ms) IOPS: 44.9K | 5.9 GiB/s (2.662ms) IOPS: 47.3K | 6.3 GiB/s (19.877ms) IOPS: 6.4K | 6.1 GiB/s (20.579ms) IOPS: 6.2K |
| Crucial T705 2TB | 3.3 GiB/s (0.587ms) IOPS: 217.0K | 2.3 GiB/s (0.836ms) IOPS: 152.6K | 5.5 GiB/s (2.863ms) IOPS: 44.7K | 5.6 GiB/s (2.799ms) IOPS: 45.7K | 6.0 GiB/s (20.738ms) IOPS: 6.2K | 6.0 GiB/s (20.855ms) IOPS: 6.1K |
| SK hynix Platinum P51 | 3.1 GiB/s (0.634ms) IOPS: 200.9K | 1.5 GiB/s (1.314ms) IOPS: 97.2K | 5.6 GiB/s (2.781ms) IOPS: 46.0K | 3.9 GiB/s (4.014ms) IOPS: 31.9K | 6.2 GiB/s (20.126ms) IOPS: 6.4K | 4.2 GiB/s (29.576ms) IOPS: 4.3K |
| Samsung 990 Pro 2TB | 2.7 GiB/s (0.731ms) IOPS: 174.4K | 2.2 GiB/s (0.903ms) IOPS: 141.2K | 4.0 GiB/s (3.944ms) IOPS: 32.4K | 4.1 GiB/s (3.849ms) IOPS: 33.2K | 3.9 GiB/s (32.415ms) IOPS: 3.9K | 4.2 GiB/s (29.520ms) IOPS: 4.3K |
| PNY CS2150 | 2.5 GiB/s (0.779ms) IOPS: 163.5K | 1.8 GiB/s 1.107ms) IOPS: 115.3K | 4.5 GiB/s (3.473ms) IOPS: 36.8K | 4.7 GiB/s (3.357ms) IOPS: 38.1K | 4.6 GiB/s (27.157ms) IOPS: 174.4K | 4.9 GiB/s (25.682ms) IOPS: 5.0K |
| Crucial P510 | 2.3 GiB/s (0.837ms) IOPS: 152.2K | 2.3 GiB/s (0.842ms) IOPS: 151.5K | 4.5 GiB/s (3.450ms) IOPS: 37.1K | 4.8 GiB/s (3.262ms) IOPS: 39.2K | 4.8 GiB/s (26.2181ms) IOPS: 4.9K | 5.0 GiB/s (25.121ms) IOPS: 5.1K |
| WD SN850X | 2.3 GiB/s (0.736ms) IOPS: 173.2K | 2.0 GiB/s (0.989ms) IOPS: 129.0K | 4.1 GiB/s (3.878ms) IOPS: 33.3K | 4.0 GiB/s (3.958ms) IOPS: 33.0K | 4.4 GiB/s (30.501ms) IOPS: 4.5K | 4.1 GiB/s (30.782ms) IOPS: 4.2K |
Conclusion
The PNY CS2150 is one of the most affordable PCIe Gen5 SSDs on the market, making it a tempting option for users looking to upgrade without spending a premium. At a price of under $175 for the 2TB model (affiliate link), this is a low-cost entry point into the Gen5 landscape. That low cost, however, comes with pretty significant compromises.
Powered by the entry-tier Phison E31 controller and using a DRAM-less design, the CS2150 lands well below the performance ceiling of faster Gen5 drives, often trailing by several gigabytes per second in sequential workloads and thousands of IOPS in random operations. Ultimately, it performs more like a high-end Gen4 SSD across many real-world scenarios, including gaming (DirectStorage), video production (Blackmagic), and AI tasks (LLM load times).
Despite this, the CS2150 does offer some nice-to-haves. Features like Microsoft DirectStorage support and TCG Opal 2.0 encryption help elevate it, and the 5-year warranty adds some peace of mind. However, users seeking maximum performance for demanding tasks (especially content creation, large AI model inference, or production-heavy pipelines) will quickly find the architectural limitations of the drive holding it back.
Ultimately, the PNY CS2150 is best viewed as a stepping stone: an affordable entry into Gen5 storage that makes sense for general use, light gaming, or budget-conscious builds where capacity and price are more important than high-end performance.


 Amazon