

Supermicro’s JumpStart program takes a very different approach to hardware evaluation. Instead of a short, scripted demo in a shared lab environment, JumpStart gives qualified customers free, time-boxed, bare-metal access to a catalog of real production servers. From new X14 platforms with Intel Xeon 6 to H14 systems with 5th Gen AMD EPYC and large HGX GPU configurations, customers reserve systems, log in remotely, and run their own workloads as if the hardware were sitting in their own rack.
The business value becomes clear when making quick, informed platform decisions. Standing up a realistic proof of concept for AI or high-performance computing usually means waiting on evaluation hardware, coordinating with multiple vendors, and hoping the test configuration is close enough to what you plan to deploy. JumpStart removes that friction. Teams can validate performance, check software compatibility, explore power and thermal behavior, and compare architectures without burning internal lab cycles or shipping a pallet of servers across the country. For most organizations, a focused week on the correct configuration is enough to confirm that a platform fits their needs or to rule it out before it becomes a commitment.
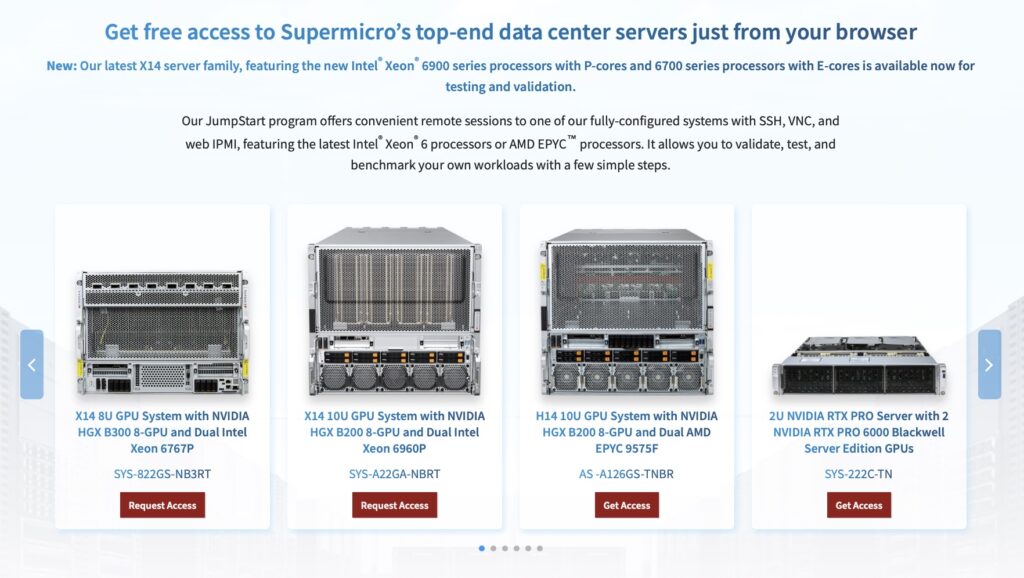
Supermicro JumpStart Launch Page
What makes JumpStart particularly compelling is not just the number of systems online, but also the depth of the technology Supermicro is willing to expose. Popular choices include X14 GPU servers featuring Intel Xeon 6 and NVIDIA accelerators, H14 platforms optimized for dense CPU compute with 5th Gen AMD EPYC, and storage-focused systems that combine modern CPUs with all NVMe backends. On the high end, Supermicro is already offering access to HGX B200- and B300-class systems for AI training and inference, and it uses JumpStart to give early, NDA-based looks at next-generation platforms that are not yet broadly shipping. We haven’t seen any other OEM this aggressive about turning pre-GA infrastructure into a structured, repeatable remote lab experience.
Most vendor demo environments stop at guided solution labs or narrow product sandboxes. Those are useful for learning about management tools and orchestration workflows, but they rarely provide root access to a top-tier server or the freedom to install and run your own stack. JumpStart behaves much more like a loaner rack in a remote data center. When you book a specific system, you receive complete control via SSH, VNC, and IPMI for the duration of the reservation, and Supermicro wipes and rebuilds the environment before the next customer uses it. In practice, that feels less like a marketing demo and more like a short, focused engagement in a well-run remote lab.
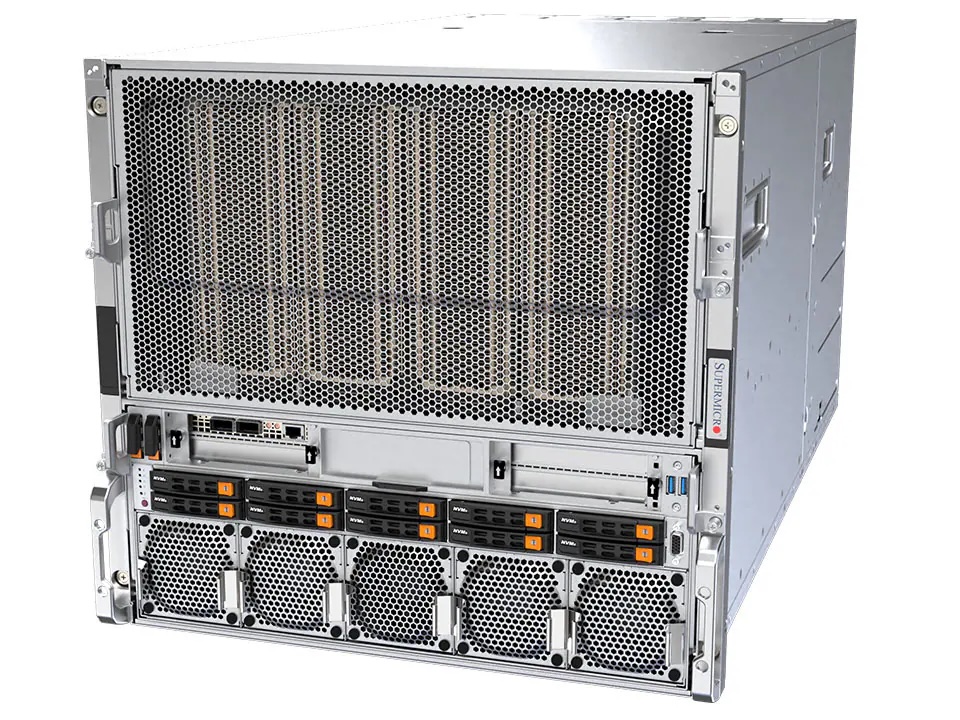
Supermicro JumpStart X14 B200 System
For this analysis, Supermicro provided StorageReview with access to JumpStart exactly as a customer would experience it. We scheduled time on an X14 10U GPU system populated with an NVIDIA HGX B200 8-GPU baseboard and dual 6th Gen Intel Xeon Platinum 6960P processors. The server was configured with 3TB of DDR5-6400 ECC memory, a mix of M.2 and U.2 NVMe SSDs for local storage, and eight B200 GPUs, each with 180GB of HBM3e. Over the course of a week, we used that platform to spot-check AI workloads and system behavior, focusing on the kind of questions actual buyers want answered before they commit to a new generation of infrastructure.
Our Week in the Supermicro JumpStart Program
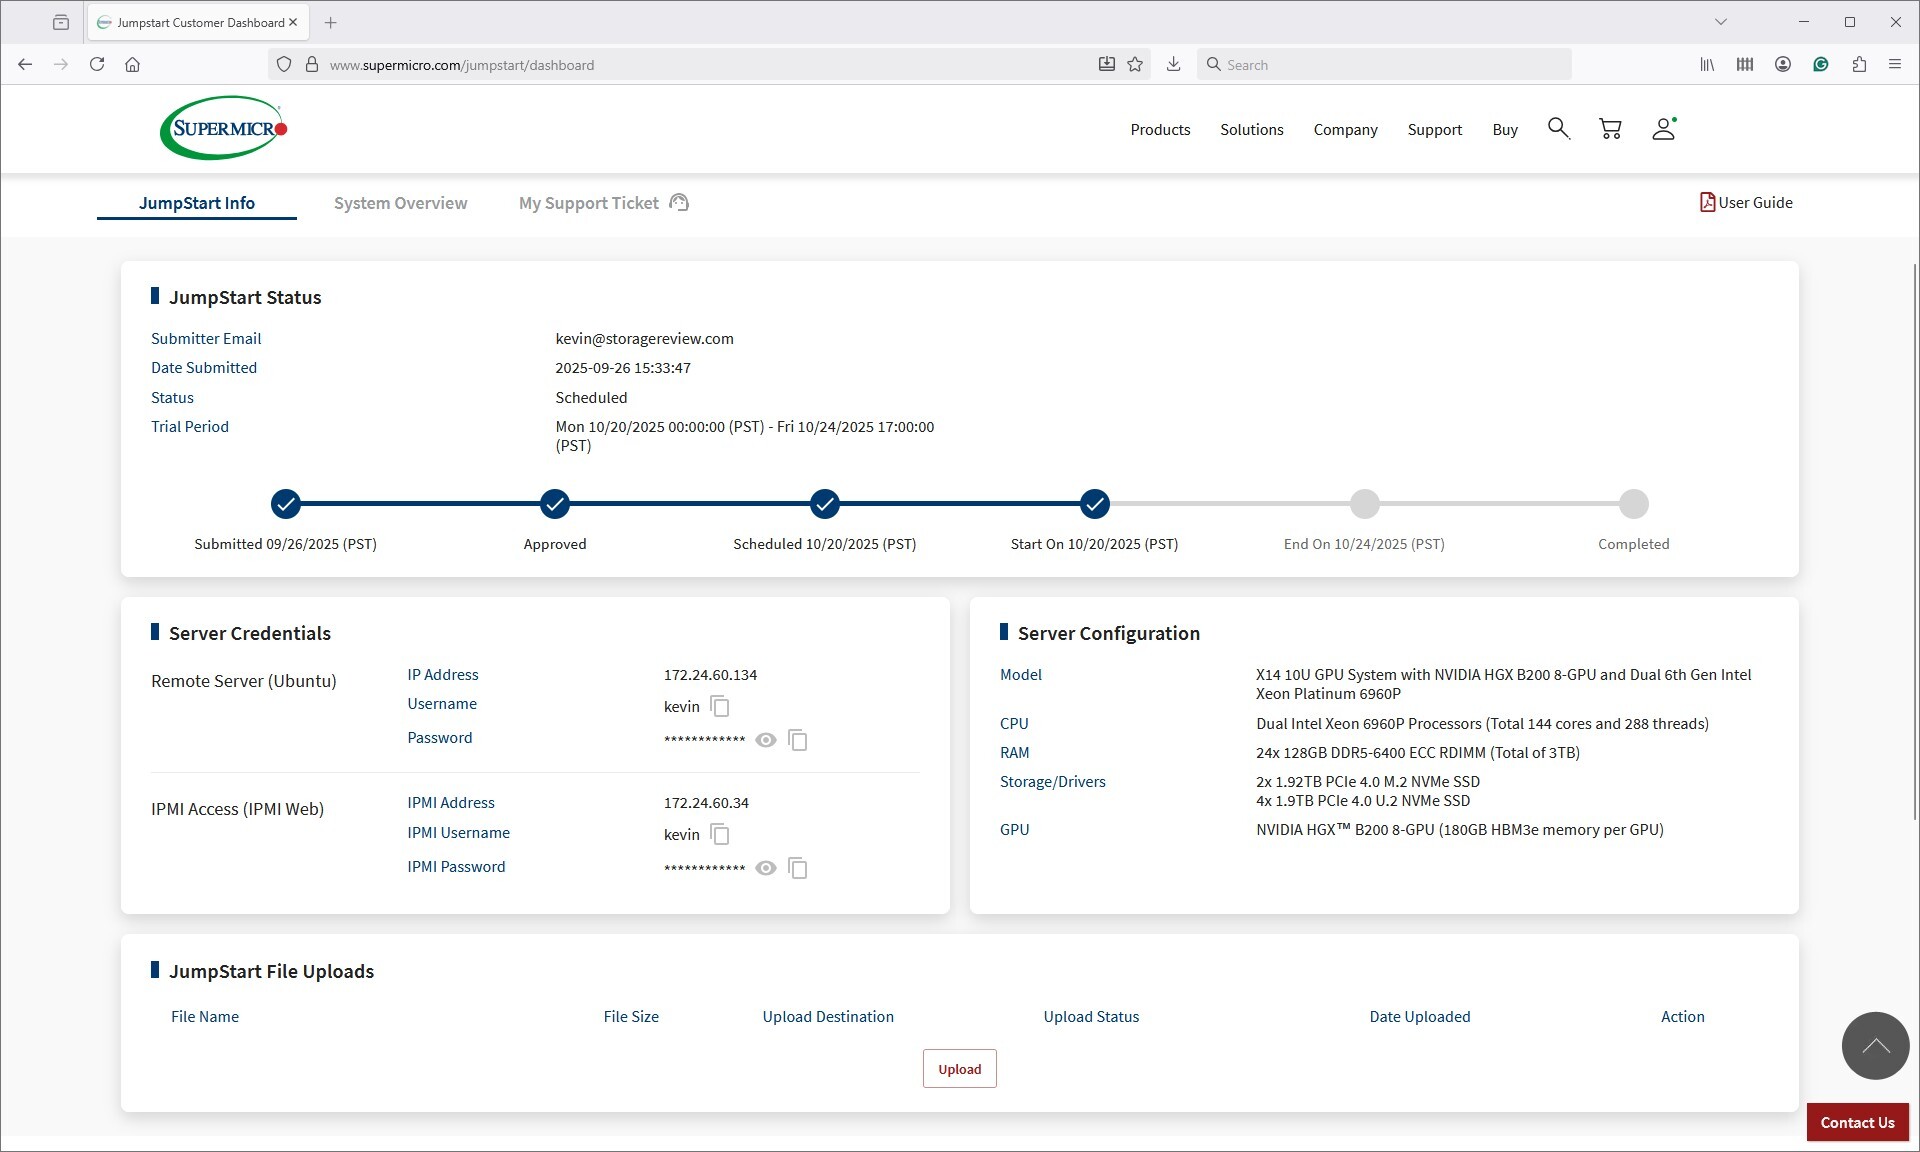
Once our reservation window opened, the JumpStart portal became the central hub for our testing. The initial dashboard, shown below, laid out the reservation timeline and provided everything needed to get started, including SSH credentials for the remote Ubuntu environment and full IPMI access. Having both interfaces available immediately meant we could begin validating the system within minutes, rather than waiting for provisioning or support intervention.
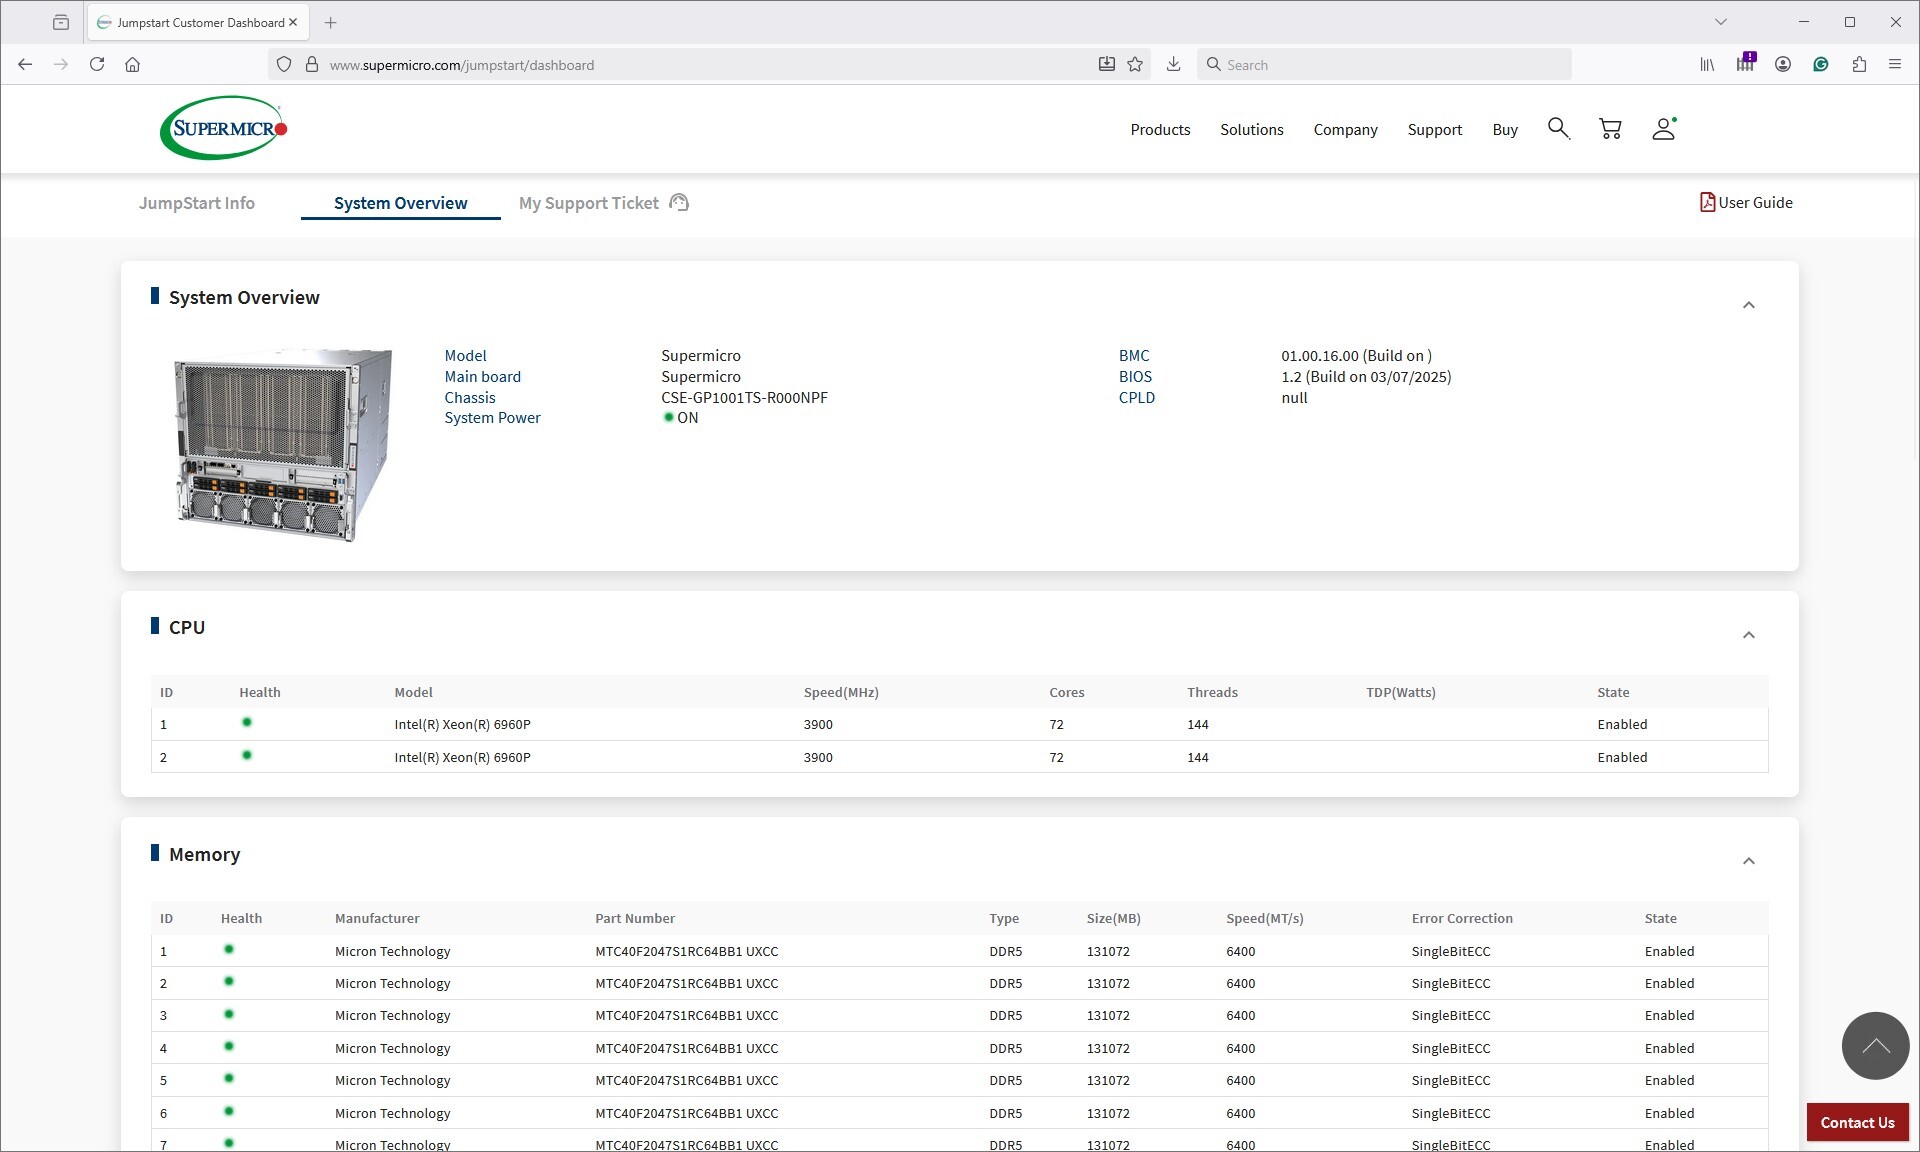
The first step in our workflow was confirming that the hardware was ready. Using the System Overview page in the portal (see screenshot below), we verified that the chassis was powered on, that both CPUs were detected, that memory was fully populated, and that the BMC reported green system health. This quick check has become a standard practice in our lab evaluations, and having remote visibility through the portal streamlined that process.
With the system validated, we transitioned into hands-on work. File uploads for test assets were handled directly through the JumpStart interface, which removed the usual friction of staging datasets on a remote platform. From there, we connected through SSH for workload deployment and used the remote console via IPMI when we needed low-level access or to observe boot behavior.
The workflow throughout the week felt very similar to operating equipment in our own lab. We were able to start, stop, and iterate on workloads quickly, reboot the platform when needed, and monitor hardware behavior without involving Supermicro support. The combination of OS-level access and total out-of-band control made the environment predictable and efficient for short testing cycles.
At the end of the reservation, the system was automatically reclaimed and reset, cleanly closing out the engagement. This predictable structure allowed us to focus on testing rather than logistics and ensured we made full use of the limited access window.
GPUDirect Storage Performance
One of the tests we conducted on the Supermicro X14 platform was the Magnum IO GPUDirect Storage (GDS) test. GDS is a feature developed by NVIDIA that allows GPUs to bypass the CPU when accessing data stored on NVMe drives or other high-speed storage devices. Instead of routing data through the CPU and system memory, GDS enables direct communication between the GPU and the storage device, significantly reducing latency and improving data throughput.
How GPUDirect Storage Works
Traditionally, when a GPU processes data stored on an NVMe drive, the data must first travel through the CPU and system memory before reaching the GPU. This process introduces bottlenecks, as the CPU becomes a middleman, adding latency and consuming valuable system resources. GPUDirect Storage eliminates this inefficiency by enabling the GPU to access data directly from the storage device via the PCIe bus. This direct path reduces data movement overhead, enabling faster, more efficient data transfers.
AI workloads, especially those involving deep learning, are highly data-intensive. Training large neural networks requires processing terabytes of data, and any delay in data transfer can lead to underutilized GPUs and longer training times. GPUDirect Storage addresses this challenge by ensuring that data is delivered to the GPU as quickly as possible, minimizing idle time and maximizing computational efficiency.
In addition, GDS is particularly beneficial for workloads that involve streaming large datasets, such as video processing, natural language processing, or real-time inference. By reducing the reliance on the CPU, GDS accelerates data movement and frees up CPU resources for other tasks, further enhancing overall system performance.
Beyond raw bandwidth, GPUDirect with NVMe-oF (TCP/RDMA) also delivers ultra-low-latency I/O. This ensures GPUs are never starved for data, making the system ideal for real-time AI inferencing, analytics pipelines, and video replay.
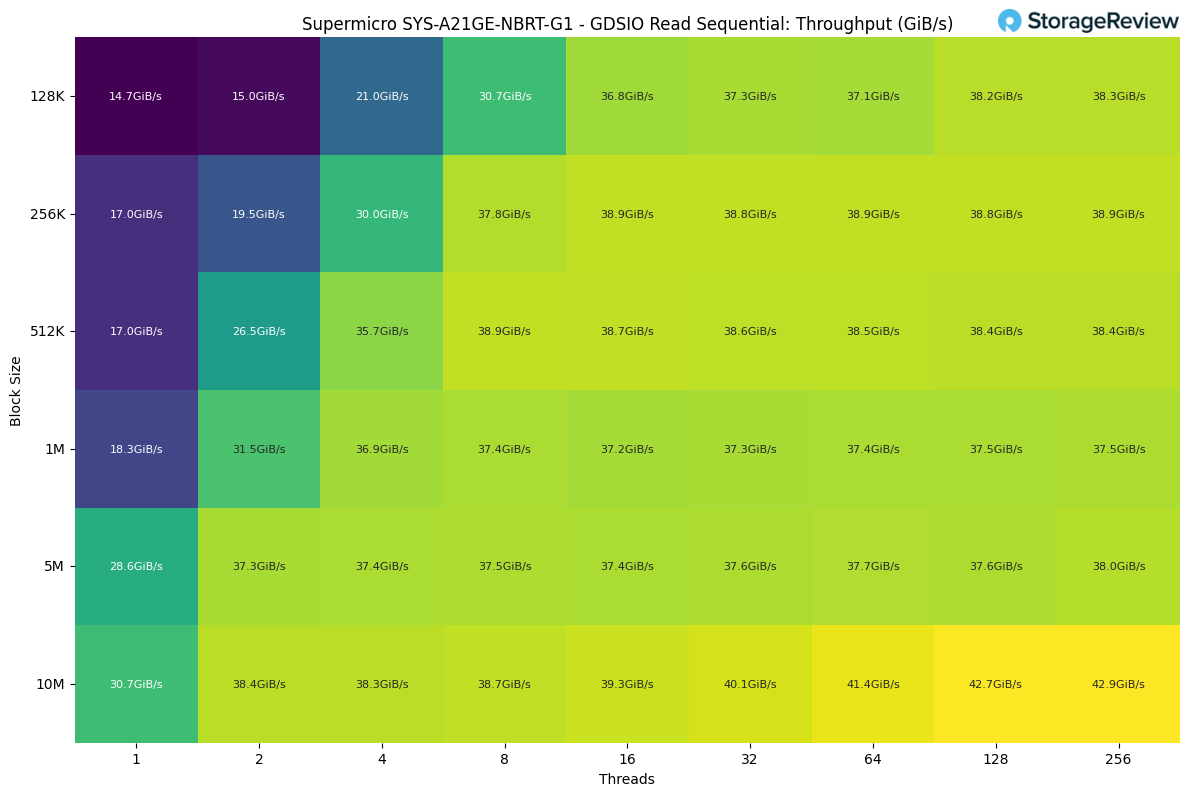
GDSIO Read Sequential Throughput
For our GDSIO sequential read testing on the B200 platform, the workload started modestly with a single thread hitting around 14 to 15GiB/s, depending on block size. As soon as we increased both the thread count and the block size, performance improved quickly. Moving to 2 and 4 threads pushed throughput into the 20 to 36GiB/s range, showing how well the system scales once parallelism is introduced.
The real acceleration occurred once we reached eight or more threads, at which point most workloads settled into the high 30 GiB/s range. Larger blocks benefited the most, with 5M and 10M sizes consistently delivering strong numbers across all thread counts.
Throughput eventually maxed out at roughly 43GiB/s with a 10M block size at 256 threads, representing the highest sustained sequential read rate we observed in this test.
GDSIO Read Sequential Latency
On the latency side, the workload started very responsive, with single-thread reads landing in the 0.06–0.1ms range for smaller blocks. As threads increased, latency scaled gradually, staying under 1ms through the 8-thread point for most workloads.
Once we moved past 16 threads, larger block sizes began pushing into multi-millisecond territory as the storage path became more saturated. The highest latency occurred at the end of the test, where a 10M block size with 256 threads peaked at just over 1.2 seconds (around 1200ms), reflecting a worst-case load designed to overwhelm the system.

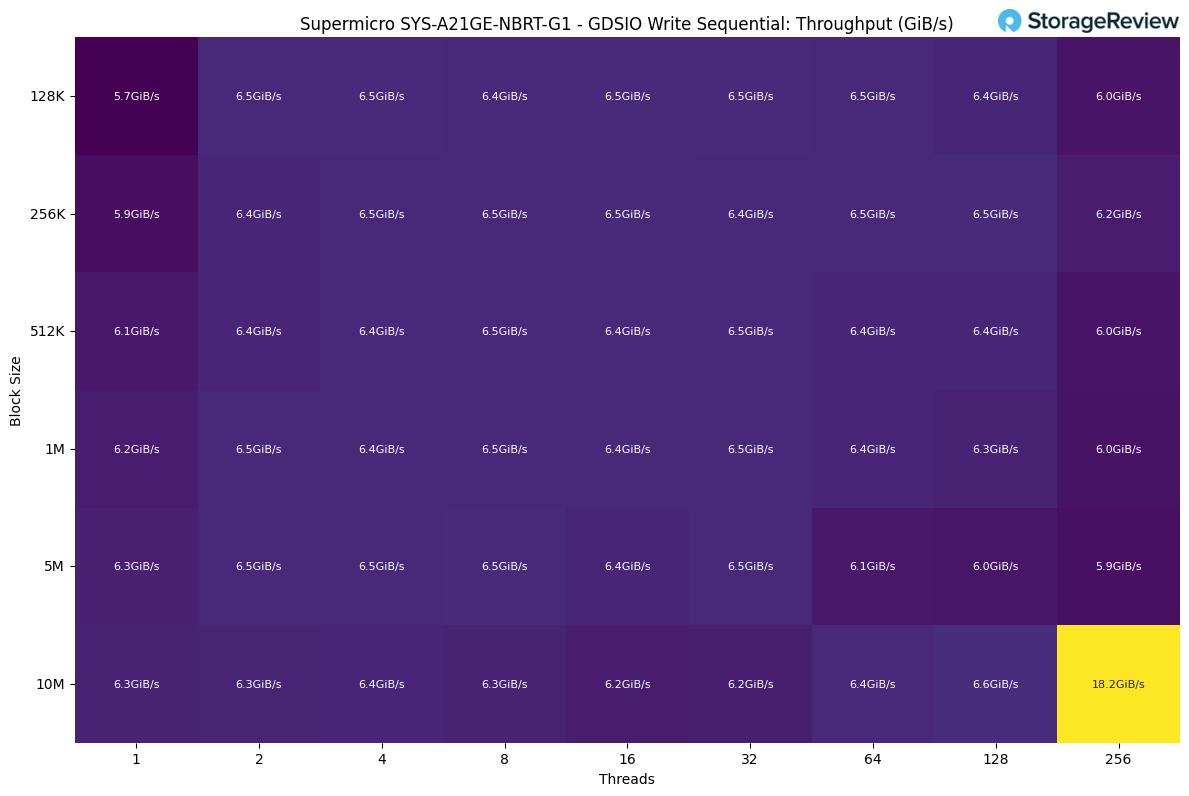
GDSIO Write Sequential Throughput
For sequential writes, performance was much flatter compared to reads. The workload settled in quickly, with most thread- and block-size combinations landing around 6.3–6.5 GiB/s. This indicates the write path hits a consistent ceiling early on, likely tied to storage media and buffering rather than GPU or PCIe limits.
Scaling the thread count didn’t have a significant impact, as throughput remained essentially unchanged from 2 to 128 threads. The only standout result came at the end, where a 10M block size at 256 threads spiked to 18.2GiB/s, showing a brief advantage when the system can fully leverage deep queues and write aggregation.
GDSIO Write Sequential Latency
Write latency started relatively low, with single-thread workloads landing around 0.15–0.5ms on smaller block sizes. As threads increased, latency scaled much more aggressively than on the read side, moving into the 1–4ms range by four threads and 4–9ms by eight threads.
Once we reached 32 threads with larger block sizes, latency increased sharply, with 5M and 10M blocks jumping into the 170–350ms range. The most extreme case was the 10M block size at 256 threads, which peaked at just under 3 seconds (around 2900ms), clearly showing how quickly the write path becomes saturated under heavy parallel load.

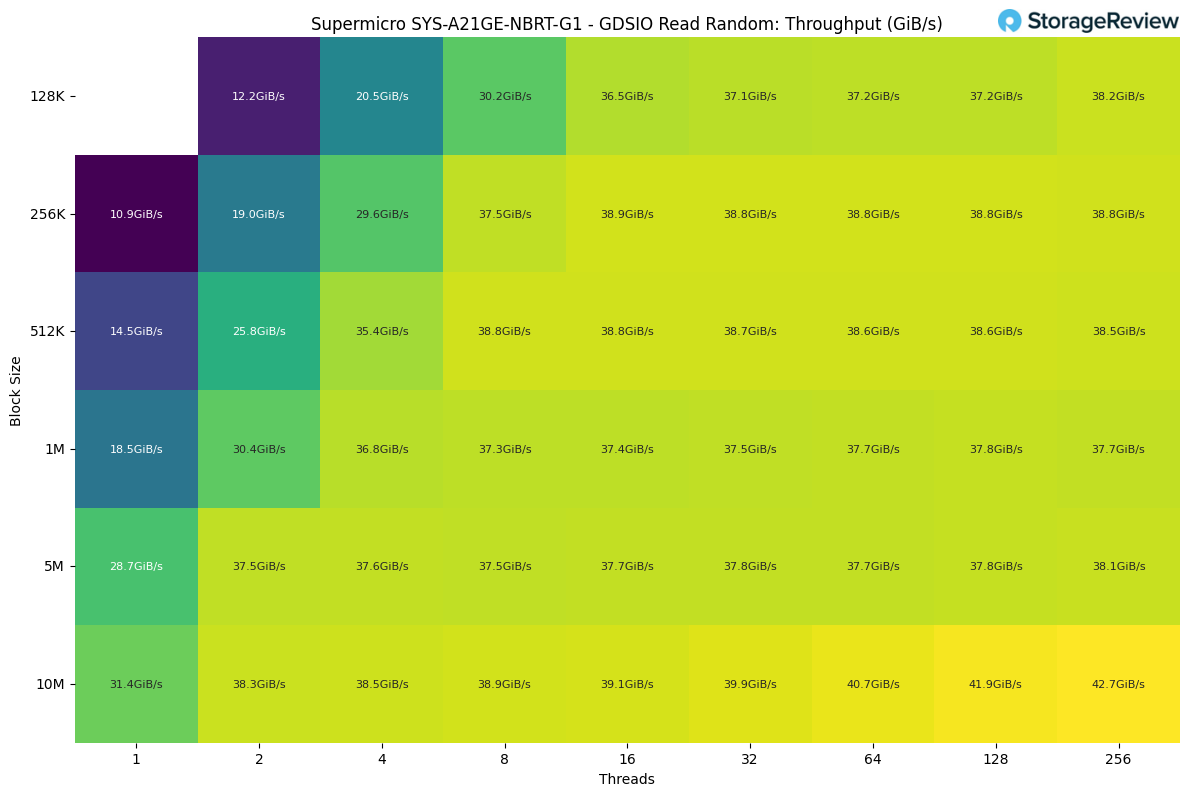
GDSIO Random Read Throughput
For random reads, the workload ramped up quickly. Single-thread performance ranged from roughly 11–31GiB/s, depending on the block size, with larger blocks immediately benefiting from higher bandwidth. Once we moved to two and four threads, throughput climbed into the 20–36GiB/s range, showing strong scaling early on.
From 8 threads and up, the system settled into a steady plateau in the high 30GiB/s range, very similar to what we saw in the sequential read test. The highest result was achieved with a 10M block size and 256 threads, peaking at about 42.7GiB/s.
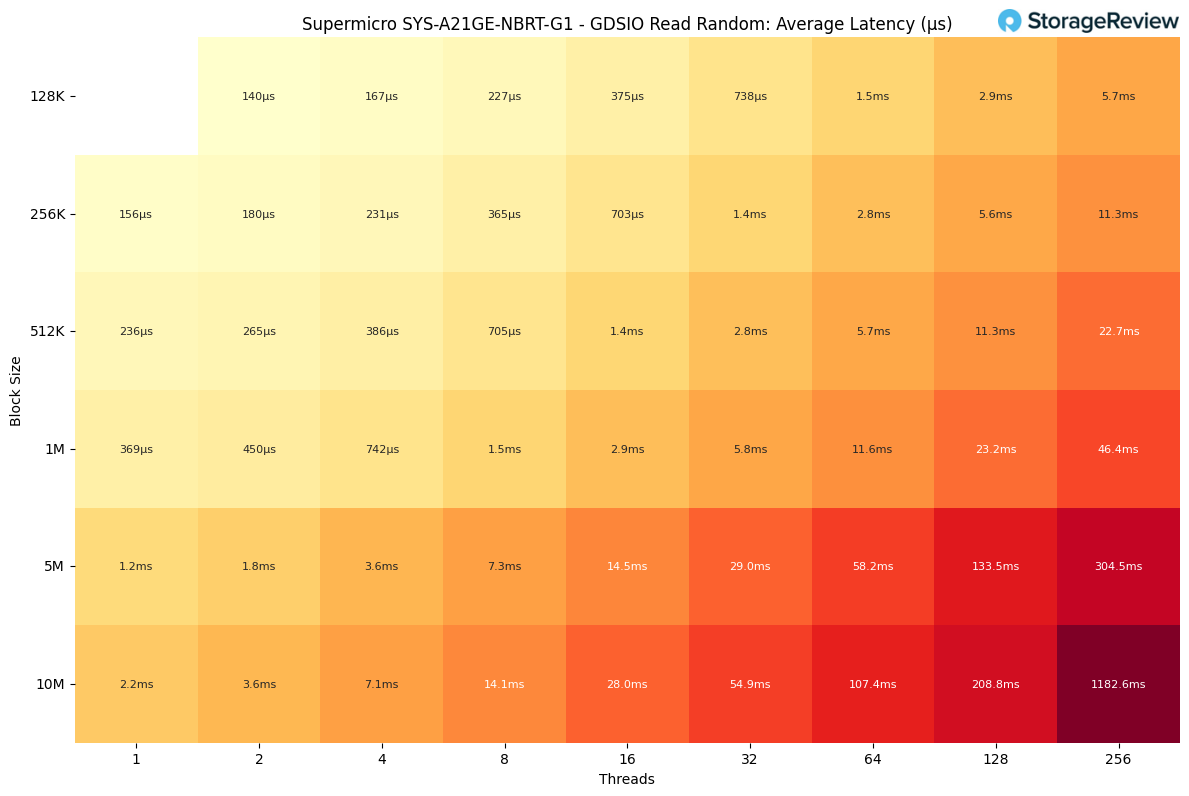
GDSIO Random Read Latency
Random read latency started very low, with single-thread workloads landing around 0.15–0.4ms on smaller block sizes. As threads increased, latency rose gradually, staying under 1ms through the 4-thread point and reaching roughly 1–3ms by eight threads.
Once we moved to 32 threads and larger blocks, latency increased more sharply, with 5M and 10M transfers pushing into the 30–55ms range. The most extreme case appeared at 256 threads with a 10M block size, where latency peaked at just over 1.1 seconds (around 1180ms).
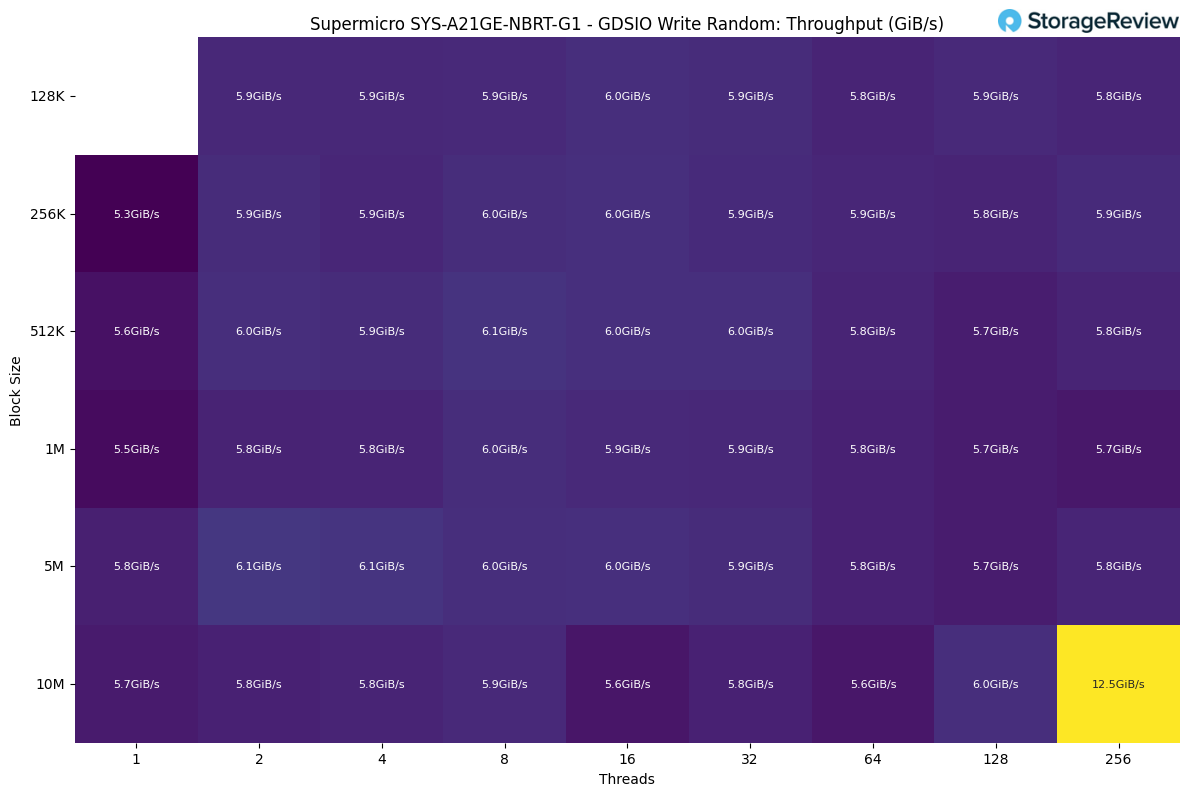
GDSIO Random Write Throughput
Random write performance was very consistent across the board, with most block sizes and thread counts landing around 5.8–6.1GiB/s. The workload reached this level almost immediately and showed minimal scaling as additional threads were introduced, indicating the write path hits its limit early.
The only notable outlier came at the end of the test, where a 10M block size at 256 threads briefly spiked to 12.5GiB/s, likely benefiting from deep queueing and write aggregation under heavy parallel load.
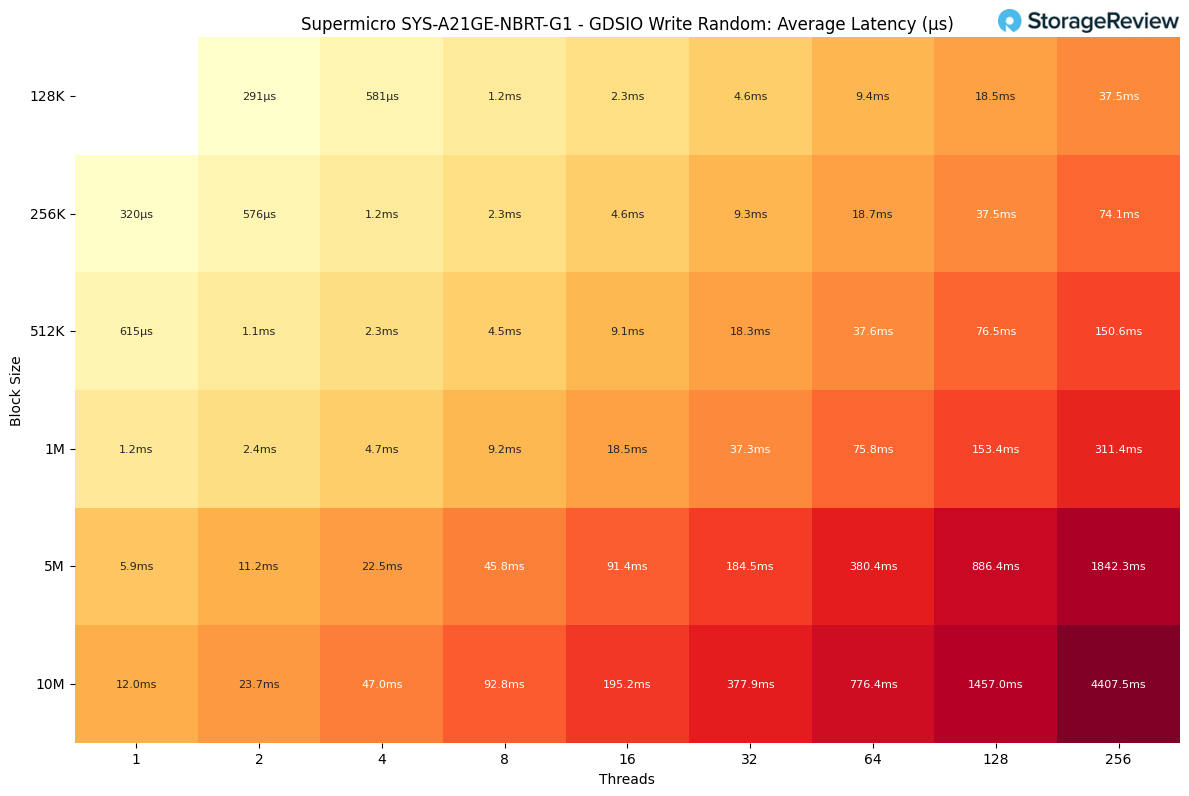
GDSIO Random Write Latency
Random write latency started relatively low, with single-thread performance ranging from about 0.6–1.2ms for smaller block sizes and 5–12ms for the largest transfers. As concurrency increased, latency scaled quickly, reaching 4–9ms by eight threads and 18–38ms by 32 threads.
Beyond that point, the write path became saturated. Larger block sizes jumped into the 150–380ms range at 64 threads, and continued scaling pushed latency sharply higher. The worst case was the 10M block size at 256 threads, topping out at roughly 4.4 seconds.
vLLM Online Serving – LLM Inference Performance
vLLM is the most popular high-throughput inference and serving engine for LLMs. The vLLM online serving benchmark is a performance evaluation tool that measures the real-world serving capabilities of this inference engine under concurrent requests. It simulates production workloads by sending requests to a running vLLM server with configurable parameters, including request rate, input/output lengths, and the number of concurrent clients. The benchmark measures key metrics, including throughput (tokens per second), time to first token, and time per output token (TPOT), helping users understand how vLLM performs under different load conditions.
We tested inference performance across a comprehensive suite of models spanning various architectures, parameter scales, and quantization strategies to evaluate throughput under different concurrency profiles.
Dense Model Performance
Dense models follow the conventional LLM architecture, where all parameters and activations are engaged during inference, resulting in more computationally intensive processing than their sparse counterparts. To comprehensively evaluate performance characteristics across model scales and quantization strategies, we benchmarked multiple dense model configurations from the Llama 3.1 8B family.
Our test suite included Meta Llama 3.1 8B evaluations across three precision formats: the stock configuration, plus FP8 and FP4 quantized versions utilizing NVIDIA’s NVFP4 format. It’s important to note that vLLM currently uses the Marlin kernel for NVFP4 quantized models, and the full performance benefits of this quantization format are not yet realized in these benchmarks. Future vLLM optimizations targeting native NVFP4 tensor core operations may yield additional performance improvements. This model selection strategy enables direct performance comparison while isolating the impact of progressive quantization on inference throughput.
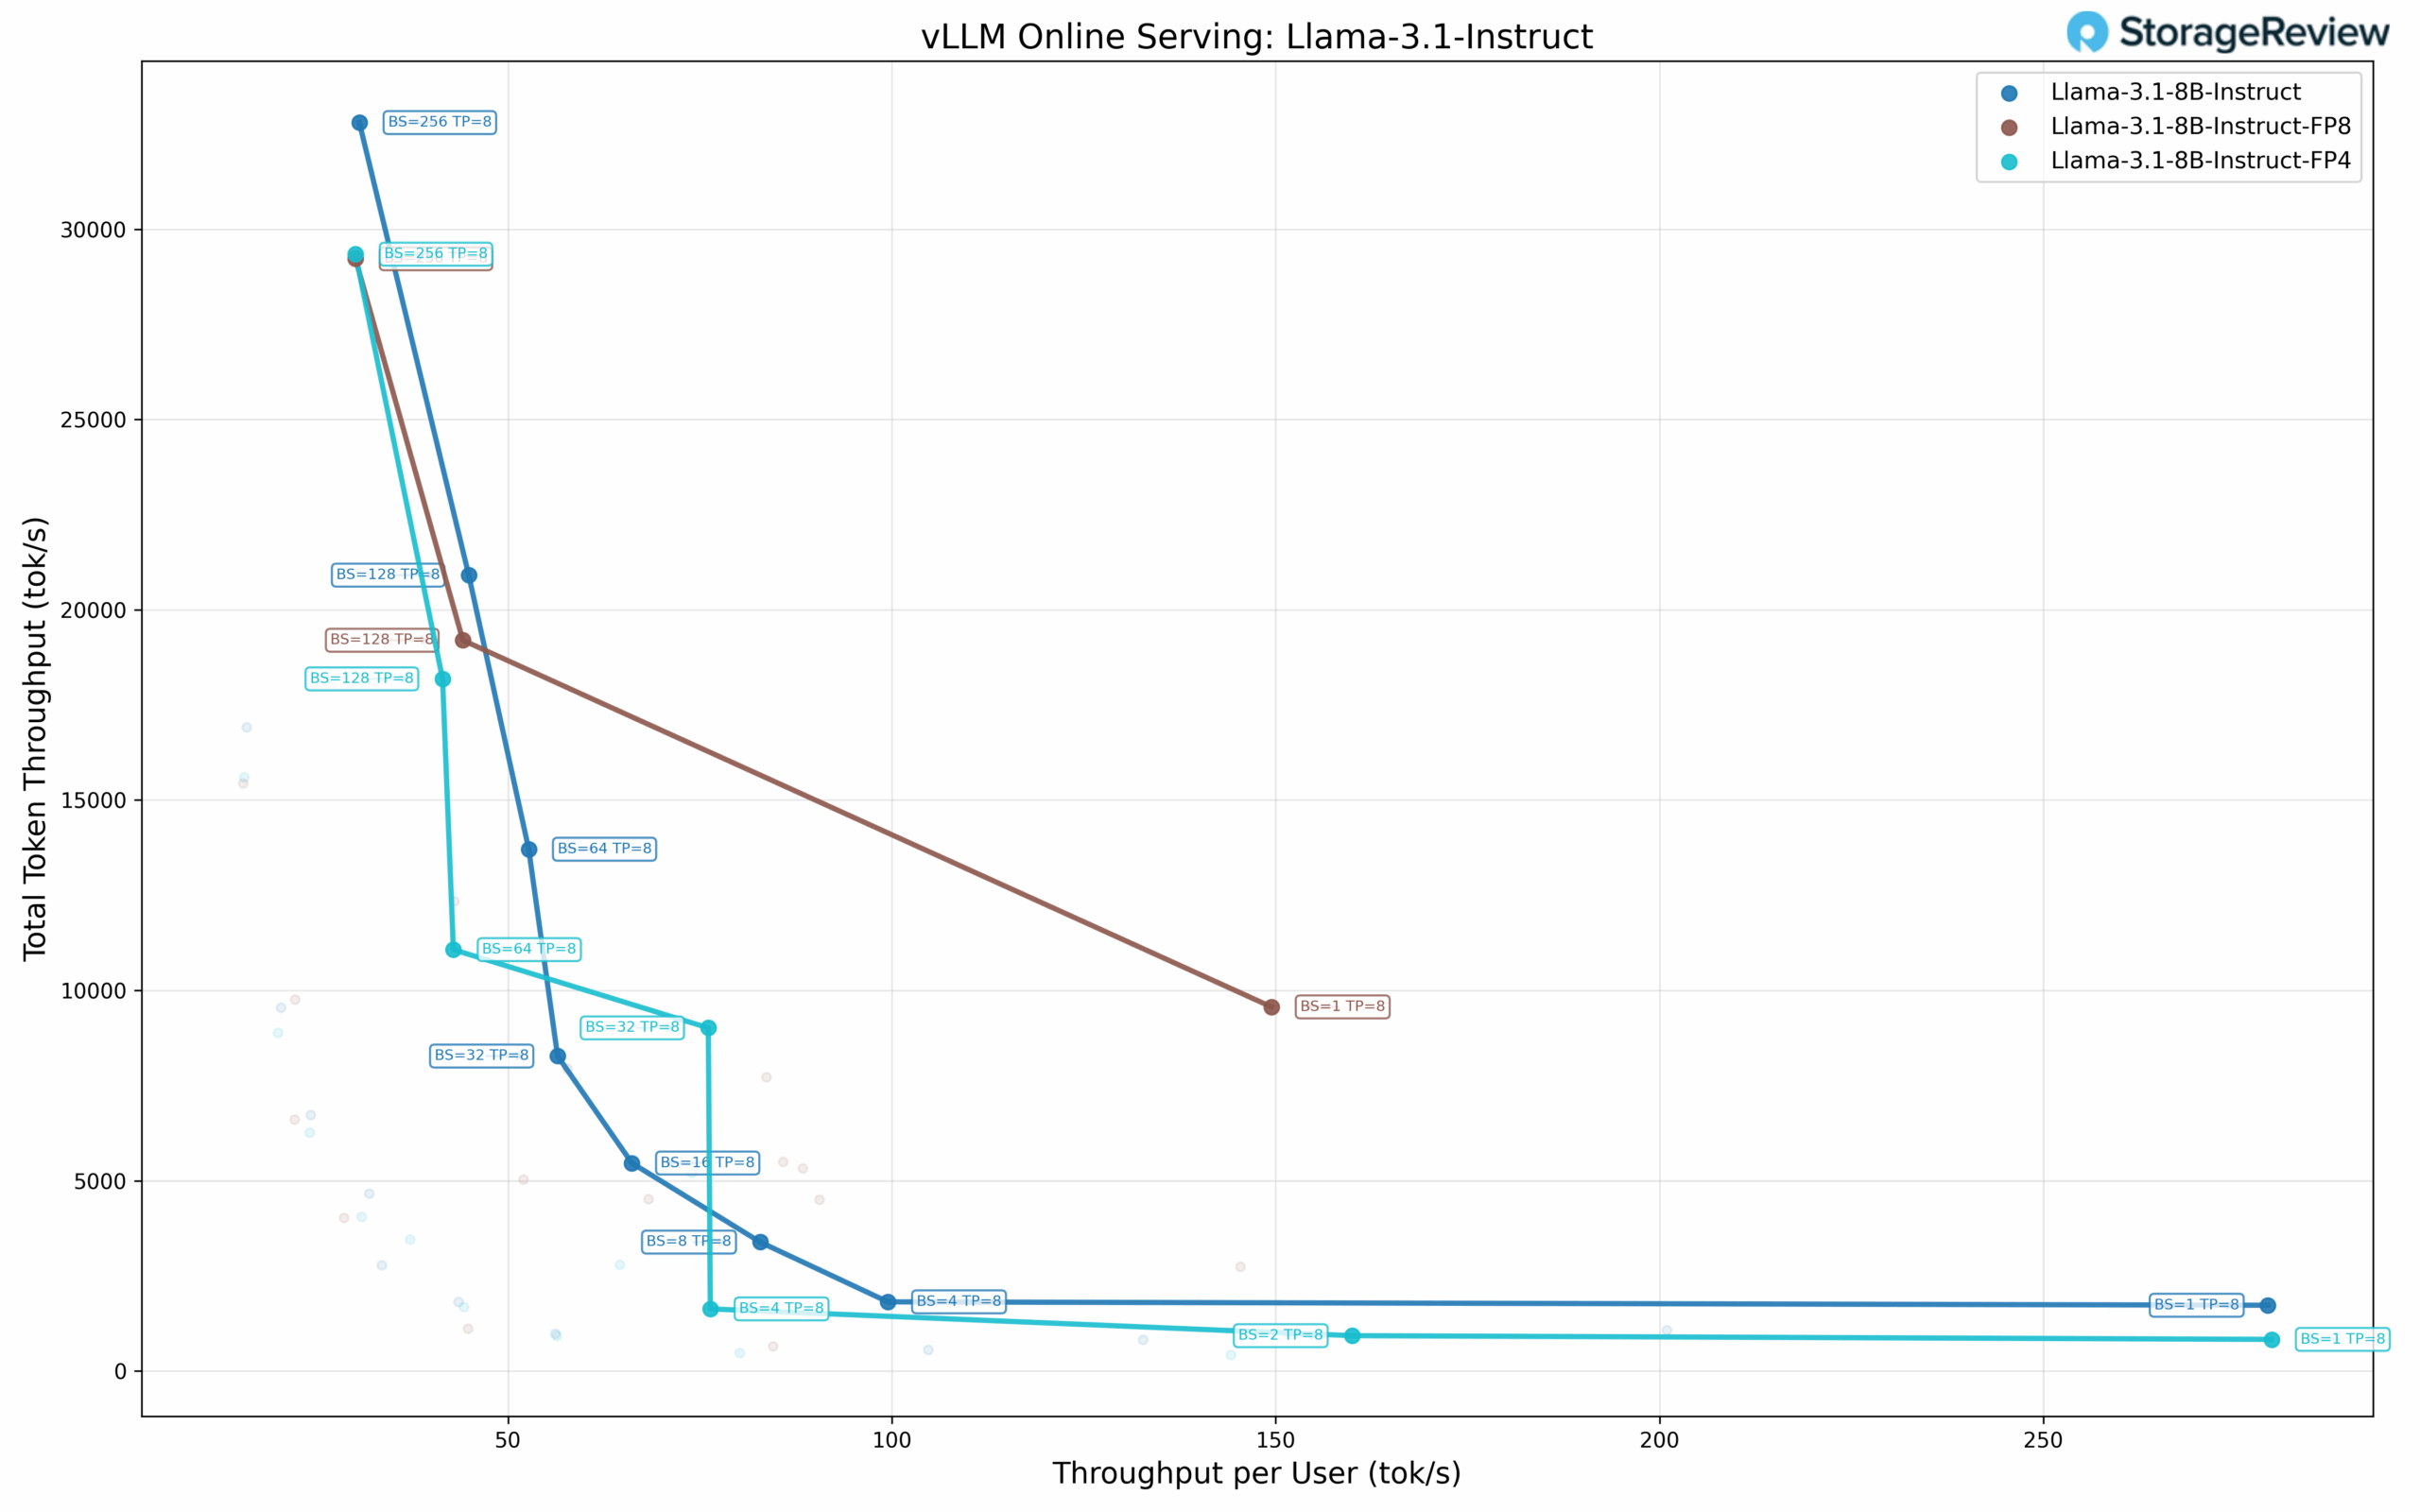
Llama 3.1 8B Performance
The Llama 3.1 8B at standard precision demonstrates the following scaling characteristics across concurrency levels. At single-user concurrency (BS=1), the model delivers 279.27 tok/s per user, with a total throughput of 1,727.62 tok/s and a TPOT of 3.37 ms. As batch size increases, per-user throughput decreases while total throughput expands. At BS=8, the model achieves 82.85 tok/s per user with 3,386.48 tok/s total and 3.28 ms TPOT. Performance continues scaling through BS=32 (56.46 tok/s per user, 8,274.66 tok/s total) and BS=64 (52.70 tok/s per user, 13,707.66 tok/s total).
The model reaches its maximum total throughput at BS=256, delivering 32,797.67 tok/s, with 30.64 tok/s per user and a TPOT of 16.13 ms. This represents a 19× increase in total throughput compared to single-user performance. The TPOT values remain in the 3-4 ms range through BS=64, increasing to 16.13 ms at BS=256.
Llama 3.1 8B FP8 Performance
The FP8 quantized variant shows different characteristics. At BS=1, it achieves 149.46 tok/s per user, with a total throughput of 9,565.20 tok/s and a TPOT of 3.44 ms. The Pareto frontier analysis reveals three optimal points (BS=1, BS=128, BS=256).
At BS=128, the model delivers 44.12 tok/s per user with 19,198.40 tok/s total and 11.04 ms
TPOT. Maximum total throughput occurs at BS=256 with 29,219.67 tok/s total, 30.13 tok/s per user, and 13.26 ms TPOT. The FP8 variant achieves lower maximum total throughput compared to standard precision (29.2K vs 32.8K tok/s).
Llama 3.1 8B FP4 Performance
The FP4 quantized configuration shows the following results. At single-user concurrency (BS=1), it achieves 279.73 tok/s per user, 830.46 tok/s total throughput, and 3.43 ms TPOT.
The FP4 model shows seven Pareto frontier points. At BS=2, it delivers 159.95 tok/s per user, 928.60 tok/s total, and 3.43 ms TPOT. Performance continues scaling through BS=4 (76.36 tok/s per user, 1,631.69 tok/s total) and BS=32 (76.09 tok/s per user, 9,014.29 tok/s total). The model reaches maximum total throughput at BS=256 with 29,340.89 tok/s total, 30.13 tok/s per user, and 16.18 ms TPOT.
Sparse Model Performance
Sparse models, particularly Mixture of Experts (MoE) architectures, are an emerging approach to efficiently scaling language models. These architectures maintain high total parameter counts while activating only a subset of parameters per token, potentially offering improved performance per active parameter.
We evaluated two MoE architectures: DeepSeek-R1, a reasoning-focused model, and Qwen3 Coder 30B-A3B, a sparse architecture specialized for code generation. DeepSeek-R1 is the most popular reasoning-focused model, demonstrating distinct performance characteristics compared to traditional language models. The Qwen3 Coder model maintains a full size of 30B parameters while activating only 3B parameters per generated token. We benchmarked the Qwen3 Coder in both stock and FP8-quantized variants to understand performance characteristics across quantization strategies.
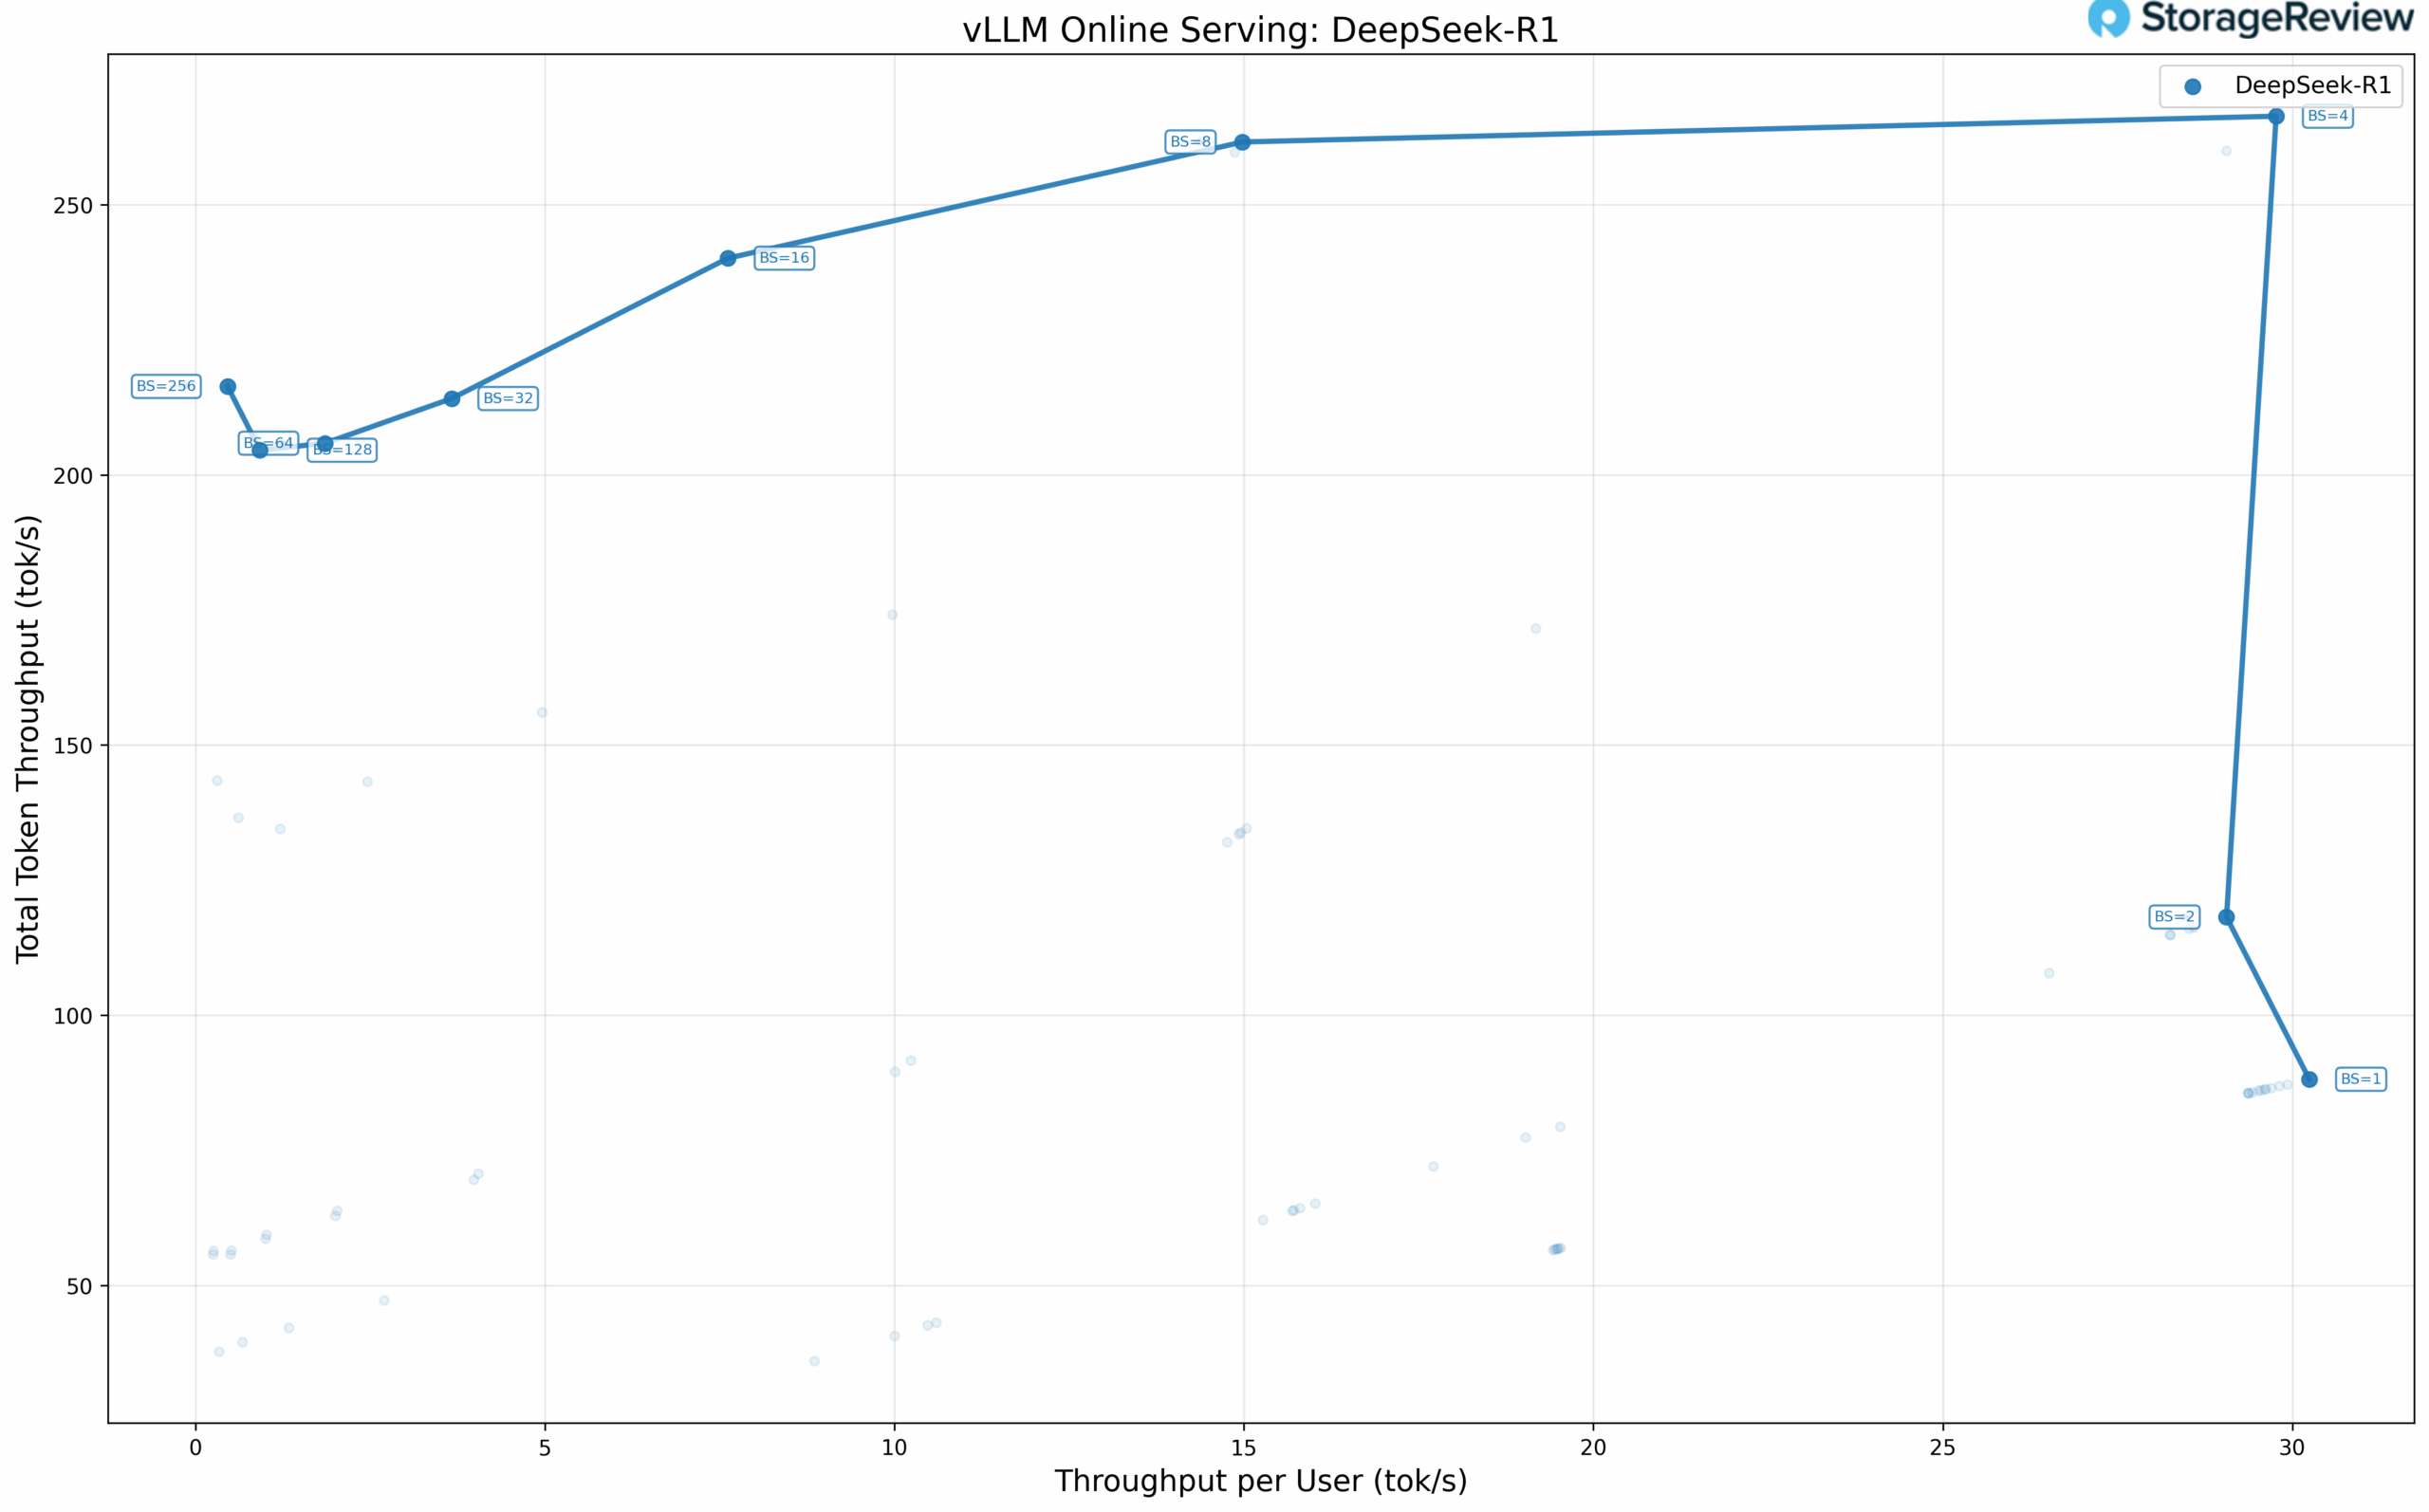
DeepSeek-R1 Performance
The DeepSeek-R1 model exhibits interesting scaling behavior across batch sizes. At single-user concurrency (BS=1), the model achieves 30.24 tok/s per user, 88.13 tok/s total throughput, and 29.85 ms TPOT. Scaling to BS=4, performance reaches 29.77 tok/s per user while delivering 266.40 tok/s total throughput with 32.04 ms TPOT, representing the maximum total throughput achieved across all configurations.
DeepSeek-R1 performance plateaus beyond BS=4. At BS=8, throughput per user drops sharply to 14.98 tok/s, and the decline continues at higher batch sizes, reaching just 0.46 tok/s per user at BS=256. Total throughput remains relatively stable between 200 and 260 tok/s across BS=4 through BS=256, because the model cannot scale with additional concurrent requests on a single node, leading to increased latency without meaningful throughput gains. An important thing to note here is that the B200 DGX is one of the only single-server solutions that can run this massive model.
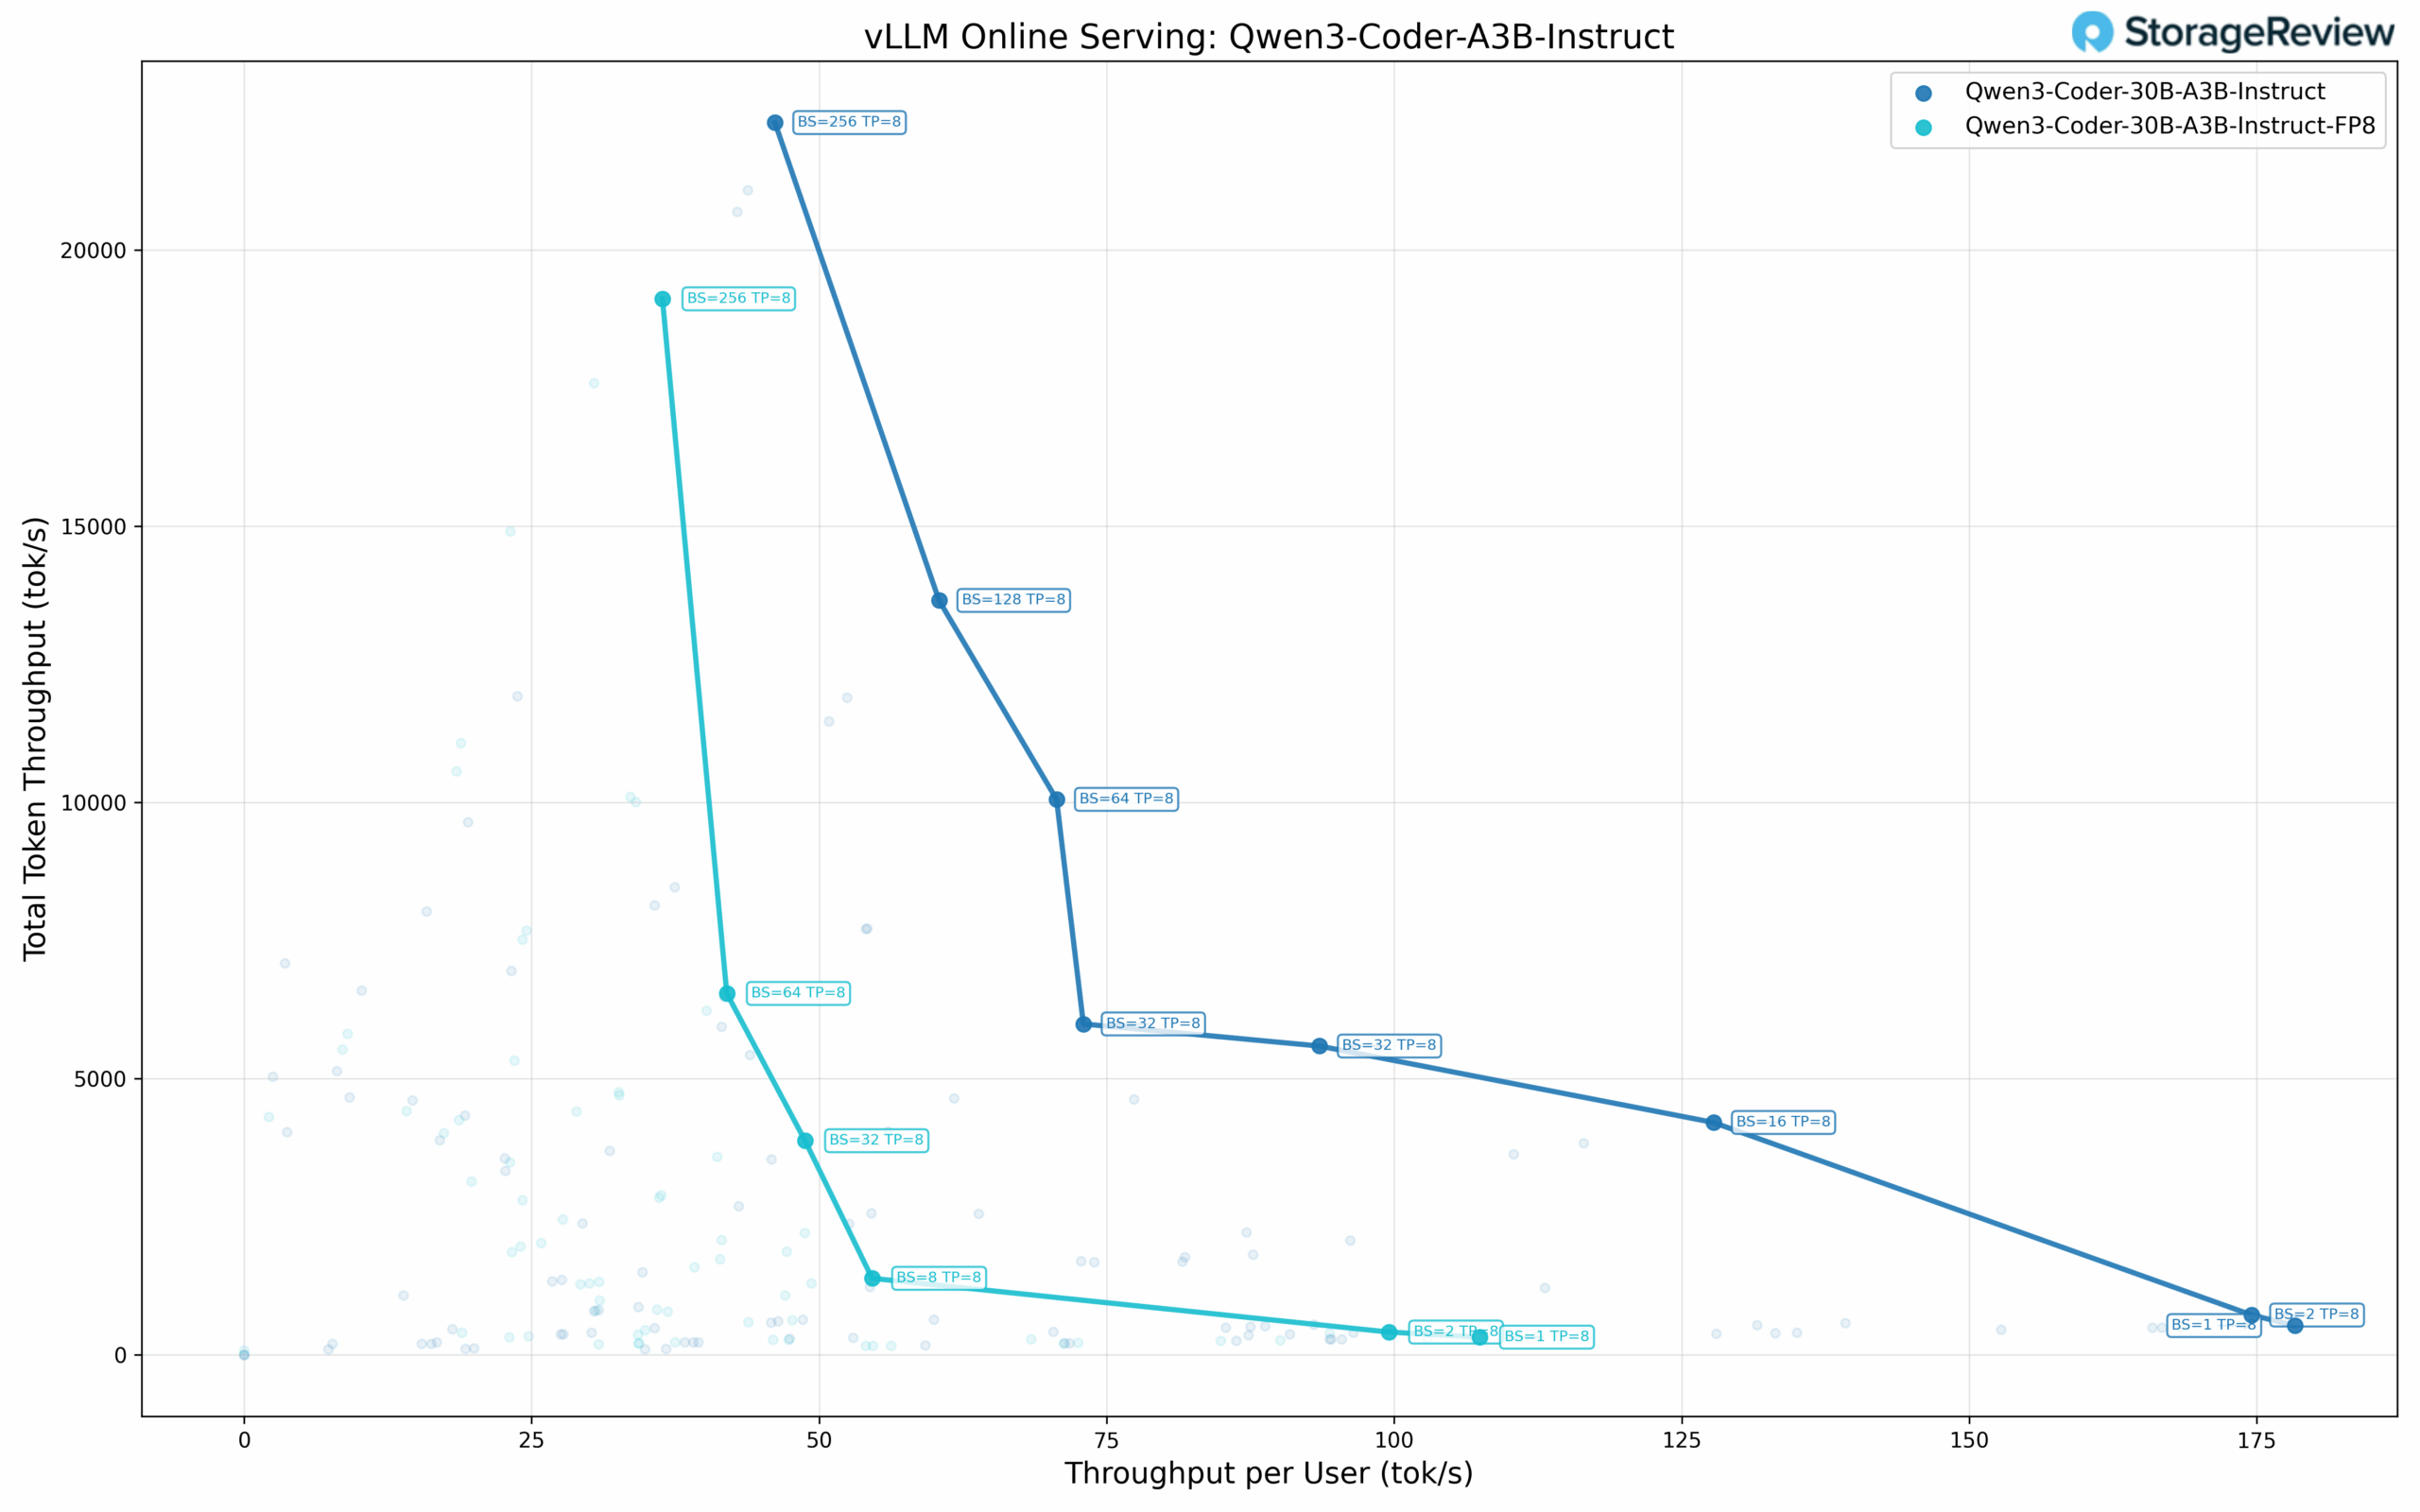
Qwen3 Coder 30B-A3B Performance
The standard precision Qwen3 Coder shows the following scaling across concurrency levels. At single-user concurrency (BS=1), the model achieves 178.30 tok/s per user, 527.25 tok/s total throughput, and 5.46 ms TPOT. At BS=2, performance reaches 174.56 tok/s per user with 718.70 tok/s total and 5.60 ms TPOT. As batch size increases, per-user throughput decreases while total throughput continues to scale: BS=16 delivers 127.76 tok/s per user, 4,204.40 tok/s total, and 6.93 ms TPOT.
The model reaches its maximum total throughput at BS=256, achieving 22,305.88 tok/s total with 46.16 tok/s per user and 17.64 ms TPOT. The Pareto frontier includes eight distinct points, with a duplicate entry at BS=32 (72.97 tok/s and 93.50 tok/s per user, likely representing different configurations). TPOT values remain in the 5-9 ms range through BS=64.
Qwen3 Coder 30B-A3B FP8 Performance
The FP8 quantized variant shows the following performance characteristics. At single-user concurrency (BS=1), it delivers 107.46 tok/s per user, 317.75 tok/s total throughput, and 9.16 ms TPOT. At BS=2, the model achieves 99.55 tok/s per user with 409.87 tok/s total and 9.86 ms TPOT.
Scaling to higher batch sizes: BS=8 delivers 54.60 tok/s per user with 1,383.13 tok/s total and 10.24 ms TPOT, while BS=32 reaches 48.78 tok/s per user with 3,874.21 tok/s total and 10.67 ms TPOT. Maximum total throughput occurs at BS=256 with 19,114.86 tok/s total, 36.38 tok/s per user, and 20.00 ms TPOT. This represents approximately 86% of the standard precision maximum throughput.
Microscaling Datatype Performance
Microscaling represents an advanced quantization approach that applies fine-grained scaling factors to small blocks of weights rather than uniform quantization across large parameter groups. NVIDIA’s NVFP4 format implements this technique through a blocked floating-point representation where each microscale block of 8-32 values shares a common exponent as a scaling factor. This granular approach preserves numerical precision while achieving 4-bit representation, maintaining the dynamic range critical for transformer architectures. The format integrates with NVIDIA’s Tensor Core architecture, enabling efficient mixed-precision computation with on-the-fly decompression during matrix operations.
We evaluated OpenAI’s GPT OSS models at two parameter scales using NVFP4 quantization: the 20B variant and the larger 120B variant. These benchmarks demonstrate how microscaling quantization performs across different model sizes.
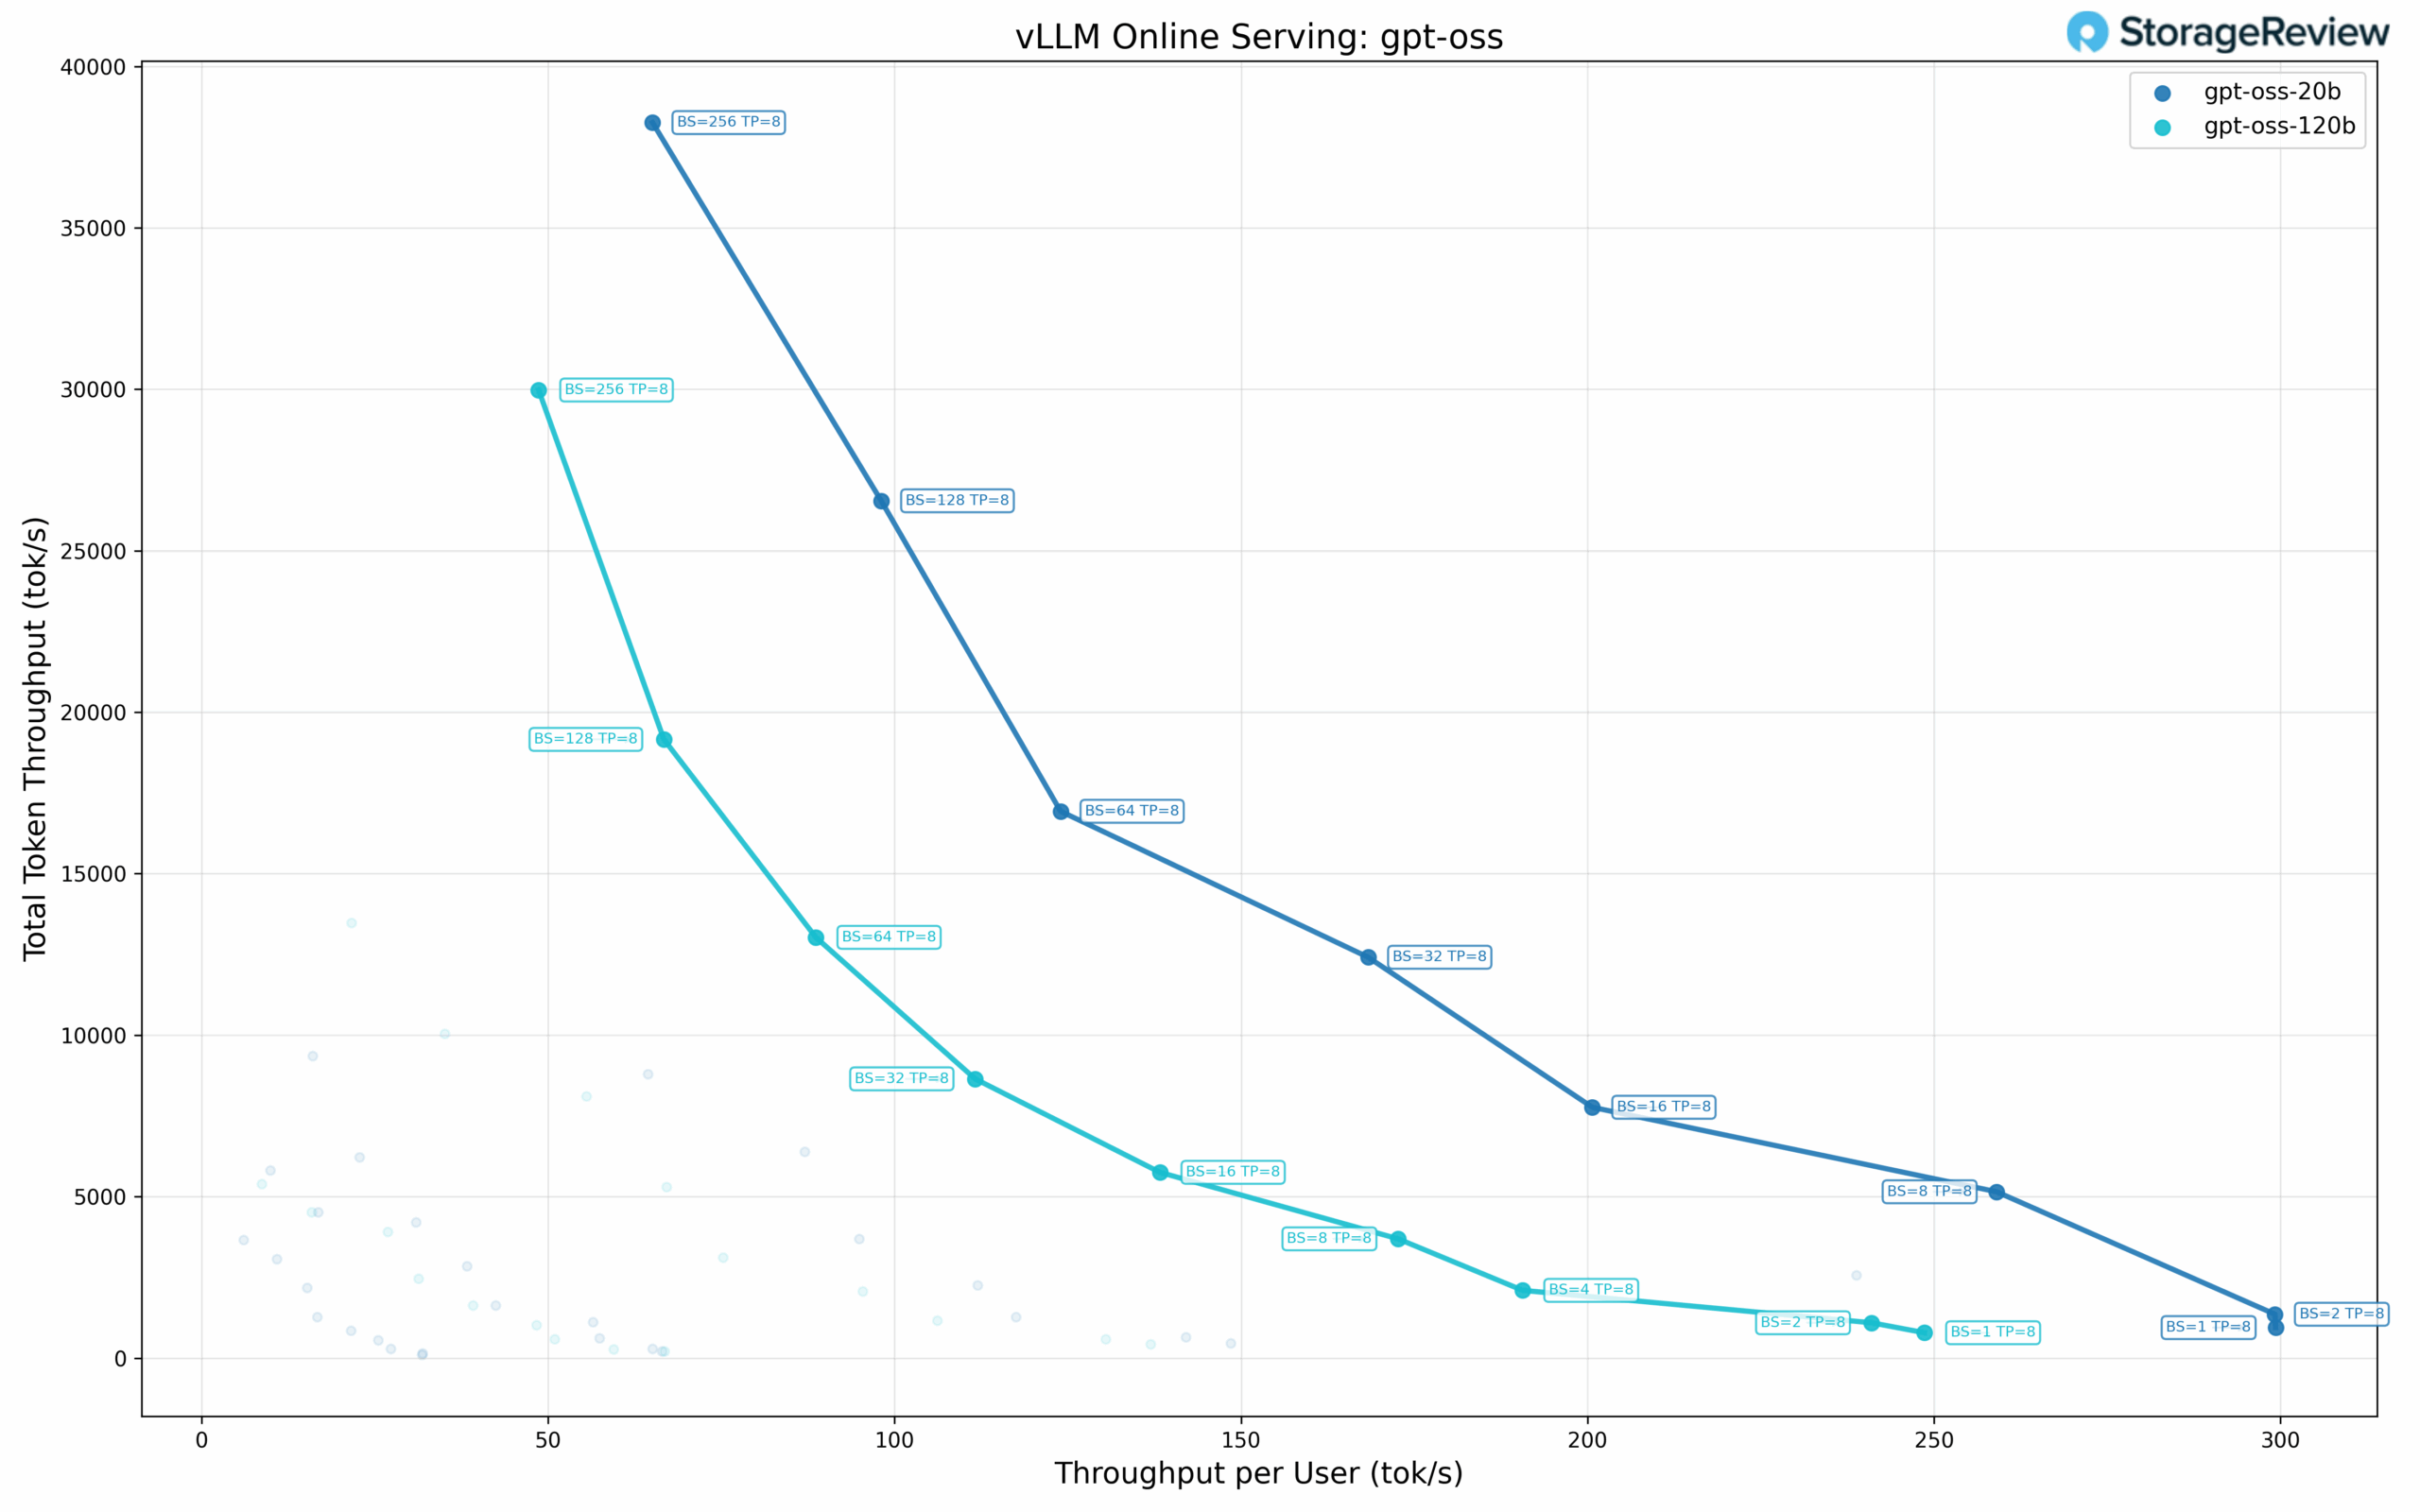
GPT-OSS-20B Performance
The 20B parameter model achieves the following performance across batch sizes. At single-user concurrency (BS=1), it delivers 299.28 tok/s per user, 943.43 tok/s total throughput, and 3.23 ms TPOT. At BS=2, the model maintains 299.19 tok/s per user with 1,356.87 tok/s total and 3.19 ms TPOT.
Scaling to higher batch sizes: BS=8 achieves 259.02 tok/s per user with 5,149.59 tok/s total and 3.42 ms TPOT, while BS=16 delivers 200.69 tok/s per user with 7,765.73 tok/s total and 3.77 ms TPOT. The model continues scaling through BS=32 (168.34 tok/s per user, 12,411.72 tok/s total) and BS=64 (123.96 tok/s per user, 16,931.47 tok/s total).
Total throughput occurs at BS=256, achieving 38,258.50 tok/s total with 65.08 tok/s per user and 9.39 ms TPOT. This represents a 40.5× increase in total throughput compared to single-user performance. TPOT values remain in the 3-5 ms range through BS=32. The Pareto frontier includes eight distinct points.
GPT-OSS-120B Performance
The larger 120B parameter model maintains the following performance despite its increased parameter count. At single-user concurrency (BS=1), it achieves 248.62 tok/s per user, 783.73 tok/s total throughput, and 3.89 ms TPOT. At BS=2, the model delivers 240.99 tok/s per user, 1,092.91 tok/s total, and 3.99 ms TPOT.
Performance continues to scale with higher batch sizes: BS=4 achieves 190.63 tok/s per user with 2,096.73 tok/s total and 4.22 ms TPOT, while BS=8 delivers 172.66 tok/s per user with 3,692.10 tok/s total and 4.54 ms TPOT. Scaling through BS=16 (138.28 tok/s per user, 5,751.41 tok/s total), BS=32 (111.63 tok/s per user, 8,646.05 tok/s total), and BS=64 (88.64 tok/s per user, 13,027.97 tok/s total) shows consistent throughput expansion.
The model reaches its maximum total throughput at BS=256, delivering 29,976.99 tok/s, with 48.64 tok/s per user and a TPOT of 12.53 ms. This represents a 38.2× increase in total throughput compared to single-user performance. The maximum total throughput is approximately 78% of the 20B model’s peak. The Pareto frontier includes nine distinct points, the most of any model tested.
Unexpected Quantized Model Performance
The quantized model results were unexpected and warrant further investigation. In several cases, the NVFP4 and FP8 quantized versions of the models did not achieve the expected performance improvements over their native-precision counterparts. For instance, the Llama 3.1 8B FP4 model achieved only 830.46 tok/s total throughput at BS=1, compared to 1,727.62 tok/s for the standard-precision variant, despite similar per-user throughput. At higher batch sizes, while the quantized models approached the standard precision throughput (29.2K-29.3K tok/s vs 32.8K tok/s at BS=256), the overall results suggest that vLLM’s current implementation may not be fully optimized for Blackwell.
We plan to conduct additional testing on vLLM and also compare it with TensorRT-LLM to see what performance end users can expect today.
Supermicro JumpStart Changes the AI PoC Game
Supermicro’s JumpStart program delivers what it promises: real, unrestricted access to production-class hardware without the logistics, shipping delays, or lab overhead of a traditional PoC. Our JumpStart week on the X14 HGX B200 platform got off to a quick start, ran smoothly, and let us evaluate performance the same way we would with gear in our own racks.
For organizations making fast AI infrastructure decisions, this kind of platform access can compress weeks of planning into days. If the goal is to validate GPU throughput, storage behavior, model performance, or simply confirm stack compatibility, JumpStart gets you to answers with minimal friction. It’s a confidence-forward approach to hardware evaluation, and we’d like to see more vendors adopt it.


 Amazon