

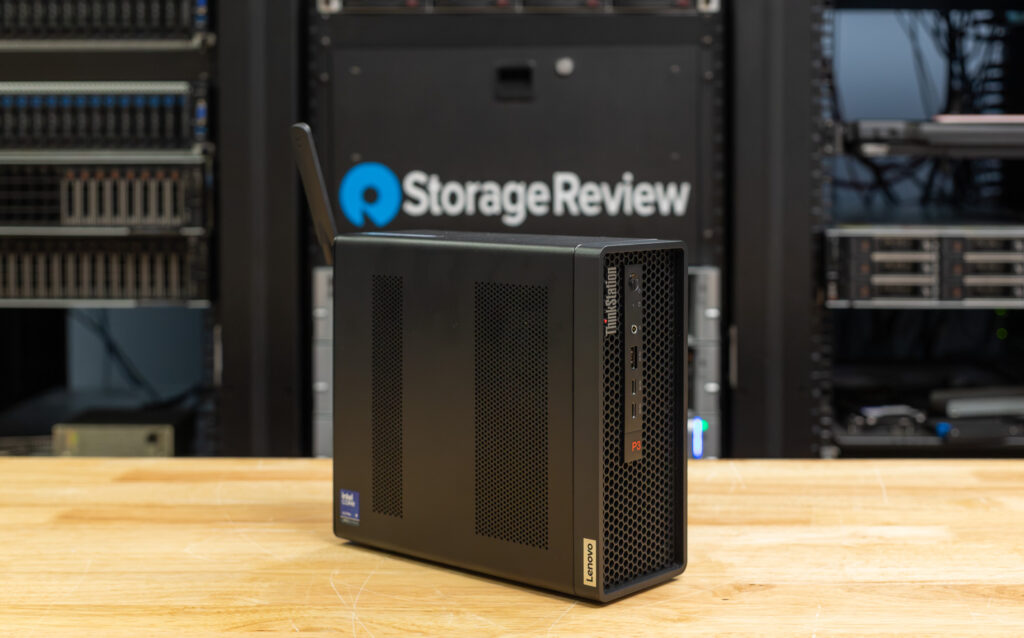
The Lenovo ThinkStation P3 Ultra SFF Gen 2 provides powerful workstation capabilities without occupying excessive desk space. If you’re working in architecture, engineering, design, data analysis, or anything that leans on ISV-certified apps, this system fits nicely into that space. It’s built to handle demanding work without taking over your desk, making it a good fit for teams that need power in a small footprint.
Lenovo ThinkStation P3 Ultra SFF Gen 2: CPU Options
The ThinkStation P3 Ultra Gen 2 offers a wide range of Intel CPU options, so you can align it with your workflow and budget.
Entry configurations start with Intel’s Core Ultra 5 processors. These CPUs use Intel’s hybrid core layout and have more than enough power for day-to-day work, multitasking, and light creative tasks. Depending on the specific Ultra 5 model, core counts reach up to 14, with boost clocks up to 5.2 GHz. All Ultra 5 options include Intel’s integrated graphics, which are suitable for general visual tasks and light content work.
| Processor Name | Cores | Threads | Base Frequency | Max Frequency | Cache | Memory Support | Processor Graphics |
|---|---|---|---|---|---|---|---|
| Core Ultra 5 225 | 10 (6 P-core + 4 E-core) | 10 | P-core 3.3GHz / E-core 2.7GHz | Max Turbo up to 4.9GHz / P-core 4.9GHz / E-core 4.4GHz | 20MB Intel Smart Cache | DDR5-6400 | Intel Graphics |
| Core Ultra 5 225T | 10 (6 P-core + 4 E-core) | 10 | P-core 2.5GHz / E-core 1.9GHz | Max Turbo up to 4.9GHz / P-core 4.9GHz / E-core 4.4GHz | 20MB Intel Smart Cache | DDR5-6400 | Intel Graphics |
| Core Ultra 5 235 | 14 (6 P-core + 8 E-core) | 14 | P-core 3.4GHz / E-core 2.9GHz | Max Turbo up to 5.2GHz / P-core 5.2GHz / E-core 4.6GHz | 24MB Intel Smart Cache | DDR5-6400 | Intel Graphics |
| Core Ultra 5 245K | 14 (6 P-core + 8 E-core) | 14 | P-core 3.7GHz / E-core 3.6GHz | Max Turbo up to 5.2GHz / P-core 5.2GHz / E-core 4.6GHz | 24MB Intel Smart Cache | DDR5-6400 | Intel Graphics |
| Core Ultra 7 265 | 20 (8 P-core + 12 E-core) | 20 | P-core 3.2GHz / E-core 1.8GHz | Max Turbo up to 5.3GHz / P-core 5.2GHz / E-core 4.6GHz | 30MB Intel Smart Cache | DDR5-6400 | Intel Graphics |
| Core Ultra 7 265K | 20 (8 P-core + 12 E-core) | 20 | P-core 3.9GHz / E-core 2.7GHz | Max Turbo up to 5.5GHz / P-core 5.4GHz / E-core 4.6GHz | 30MB Intel Smart Cache | DDR5-6400 | Intel Graphics |
| Core Ultra 7 265T | 20 (8 P-core + 12 E-core) | 20 | P-core 1.5GHz / E-core 1.2GHz | Max Turbo up to 5.3GHz / P-core 5.2GHz / E-core 4.6GHz | 30MB Intel Smart Cache | DDR5-6400 | Intel Graphics |
| Core Ultra 9 285 | 24 (8 P-core + 16 E-core) | 24 | P-core 3.8GHz / E-core 2.5GHz | Max Turbo up to 5.7GHz / P-core 5.5GHz / E-core 4.6GHz | 36MB Intel Smart Cache | DDR5-6400 | Intel Graphics |
| Core Ultra 9 285K | 24 (8 P-core + 16 E-core) | 24 | P-core 3.7GHz / E-core 2.9GHz | Max Turbo up to 5.7GHz / P-core 5.5GHz / E-core 4.6GHz | 36MB Intel Smart Cache | DDR5-6400 | Intel Graphics |
| Core Ultra 9 285T | 24 (8 P-core + 16 E-core) | 24 | P-core 1.4GHz / E-core 1.2GHz | Max Turbo up to 5.4GHz / P-core 5.3GHz / E-core 4.6GHz | 36MB Intel Smart Cache | DDR5-6400 | Intel Graphics |
For more demanding workflows, the system can be configured with Core Ultra 7 processors. These CPUs increase the core count to as high as 20 (8 P + 12 E) and deliver higher sustained performance for tasks such as code compilation, media creation, and CAD work. Boost clocks hit up to 5.5 GHz on K-series models, giving you faster turnaround during heavy workloads and large datasets.

At the top end, Lenovo offers Core Ultra 9 configurations with up to 24 cores, providing plenty of power for tasks like rendering, simulation, and data analysis. Ultra 9 models can reach 5.7 GHz and support DDR5-5600 or DDR5-6400, helping the system stay responsive when you’re pushing it harder. Despite all that power, the Ultra 9 options still fit comfortably within the P3 Ultra SFF Gen2’s compact cooling design, making it a powerful setup in a small footprint.
GPU Options
Lenovo offers a focused set of GPU options for the ThinkStation P3 Ultra SFF Gen 2, ranging from the integrated Intel graphics built into the Core Ultra processors to several professional NVIDIA cards. These options cover everything from light office and creative work to heavier 3D, CAD, and AI jobs.
The integrated Intel GPU is fine for general productivity, light media work, and multi-display setups. It keeps the power draw low and is enough for users who aren’t relying on GPU-accelerated applications.
| Graphics | Memory | Power | Connector | Form Factor | SLI / NVLink |
|---|---|---|---|---|---|
| NVIDIA RTX A400 | 4GB GDDR6 | 50W | 4× miniDP 1.4a | Single slot | None |
| NVIDIA RTX A1000 | 8GB GDDR6 | 50W | 4× miniDP 1.4a | Single slot | None |
| NVIDIA RTX 4000 SFF Ada Generation | 20GB GDDR6 with ECC | 70W | 4× miniDP 1.4a | Dual slot | None |
| NVIDIA RTX 2000 Ada Generation | 16GB GDDR6 with ECC | 70W | 4× miniDP 1.4a | Dual slot | None |
For those who need real workstation graphics, Lenovo supports three NVIDIA discrete GPUs in the Gen 2 chassis. The entry option is the NVIDIA RTX A1000 with 8GB of GDDR6, which is a solid starting point for CAD, design, and GPU-assisted workflows. Moving up, the RTX 2000 Ada brings faster CUDA, RT, and Tensor performance with 8GB of GDDR6, making it much better suited for real-time modeling, visualization, and heavier raster work.
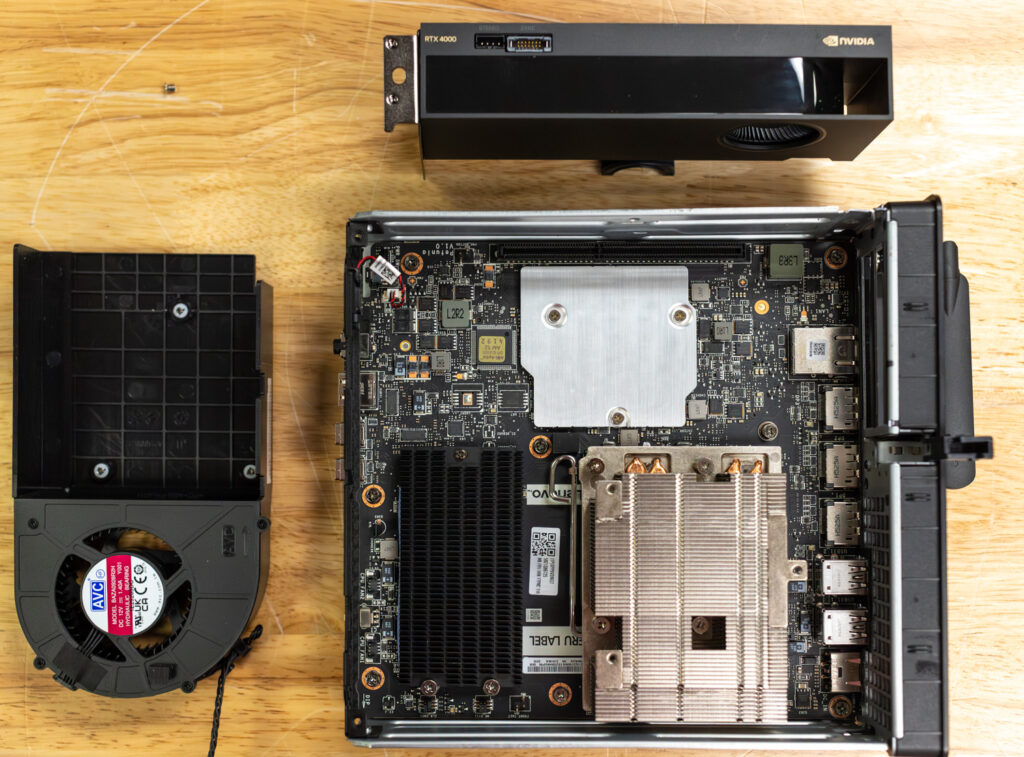
At the top end, the system can be outfitted with the RTX 4000 SFF Ada Generation, a compact 70W card with 20GB of GDDR6 that offers strong performance for rendering, AI work, simulations, and larger design projects. It’s the most capable GPU available for the Gen2 Ultra, and it provides a clear step up for users who need strong CUDA performance in a small workstation footprint.
Memory and Storage
Lenovo gives the ThinkStation P3 Ultra Gen 2 SFF plenty of flexibility with memory and storage, which is a big part of why it works so well across different professions. It can handle up to 128GB of DDR5 SO-DIMM memory across two slots, with supported speeds up to DDR5-5600 or DDR5-6400, depending on the processor and configuration. You can choose standard non-ECC memory for typical productivity and creative workloads, or ECC memory for greater reliability in applications such as simulation, engineering, or financial modelling. ECC can detect and correct small memory errors, helping keep long-running or sensitive workloads stable. Depending on the configuration and CPU support, the system will automatically adjust memory speed for stability.
For storage, the P3 Ultra SFF Gen2 uses an M.2-only layout and supports up to four M.2 PCIe SSDs, depending on the configuration and adapter card. The exact slot mix varies, but configurations may include three onboard slots plus additional M.2 slots through an expansion card. Lenovo offers both Gen 4 and Gen 5 performance SSDs ranging from 256GB to 4TB, and each slot supports Opal 2.0 for drive-level security.
RAID support is available through the integrated NVMe controller, allowing RAID 0, RAID 1, or RAID 5 depending on the configuration. This layout makes it easy to pair a fast-boot drive with additional SSDs for active projects, large datasets, or temporary storage.
The system is built around the Intel W880 chipset, which provides PCIe Gen 4 connectivity for the GPU slot and M.2 storage, with Gen 5 support available on certain storage configurations. For power, Lenovo offers 170W, 230W, 245W, and 330W external adapters, all rated at 90% efficiency. The 245W unit is an autosensing model, while the others support universal 100V to 240V input.
The system also supports remote management through an optional Aspeed BMC, allowing IT teams to check system health and push updates without being on-site. On the security side, Lenovo’s ThinkShield adds several layers of protection, including TPM 2.0, a self-healing BIOS, and Smart USB Protection to keep data and hardware secure.
Lenovo ThinkStation P3 Ultra Gen 2 Specifications
| Specification | Detail |
|---|---|
| Processor Options | Intel Core Ultra 5 / Ultra 7 / Ultra 9 processors, up to 24 cores. Supported models include: Ultra 5 225, 225T, 235, 245K Ultra 7 265, 265K, 265T Ultra 9 285, 285K, 285T Boost clocks up to 5.7 GHz. |
| Chipset | Intel W880 |
| Integrated Graphics | Intel Graphics (integrated in all Core Ultra CPUs) |
| Discrete GPU Options | NVIDIA RTX A400: 4GB GDDR6, 50W, single slot NVIDIA RTX A1000: 8GB GDDR6, 50W, single slot NVIDIA RTX 2000 Ada Generation: 16GB GDDR6 with ECC, 70W, dual slot NVIDIA RTX 4000 SFF Ada Generation: 20GB GDDR6 with ECC, 70W, dual slot |
| Memory Support | Up to 128GB DDR5 |
| Memory Slots | 4 × DDR5 SODIMM slots |
| Memory Speeds | DDR5-5600 and DDR5-6400 |
| ECC Support | Yes (ECC SODIMM supported) |
| Storage Support | M.2 NVMe only (no 2.5-inch bay) Support for up to 4 × M.2 slots depending on configuration. PCIe Gen 4 and Gen 5 compatible. RAID 0 and RAID 1 supported on M.2 drives. |
| Expansion Slots | Up to 3 PCIe slots depending on riser: PCIe 4.0 x16, PCIe 4.0 x8, plus optional serial card or Thunderbolt 4 card. |
| Front Ports | 2 × USB-C 20Gbps 1 × USB-A 10Gbps 1 × 3.5mm audio jack |
| Rear Ports | 4 × USB-A 10Gbps 3 × DisplayPort 1.2 1 × Gigabit Ethernet (RJ-45) Optional: 1 × Thunderbolt 4 Optional: Serial port (1-port or 4-port versions) |
| Ethernet | 1 × Gigabit Ethernet (I219-LM) |
| Wireless | Intel Wi-Fi 7 BE200 + Bluetooth 5.4 |
| Audio | Realtek ALC888Q with line-out and microphone support |
| Power Supply Options | 170W (90%) 230W (90%) 245W (90%, autosensing) 330W (90%) |
| Security | TPM 2.0 Self-healing BIOS Smart USB Protection Kensington lock slot |
| Manageability | Optional Aspeed BMC for remote monitoring and management. |
| Operating Systems | Windows 11 Pro Ubuntu Linux Red Hat Enterprise Linux |
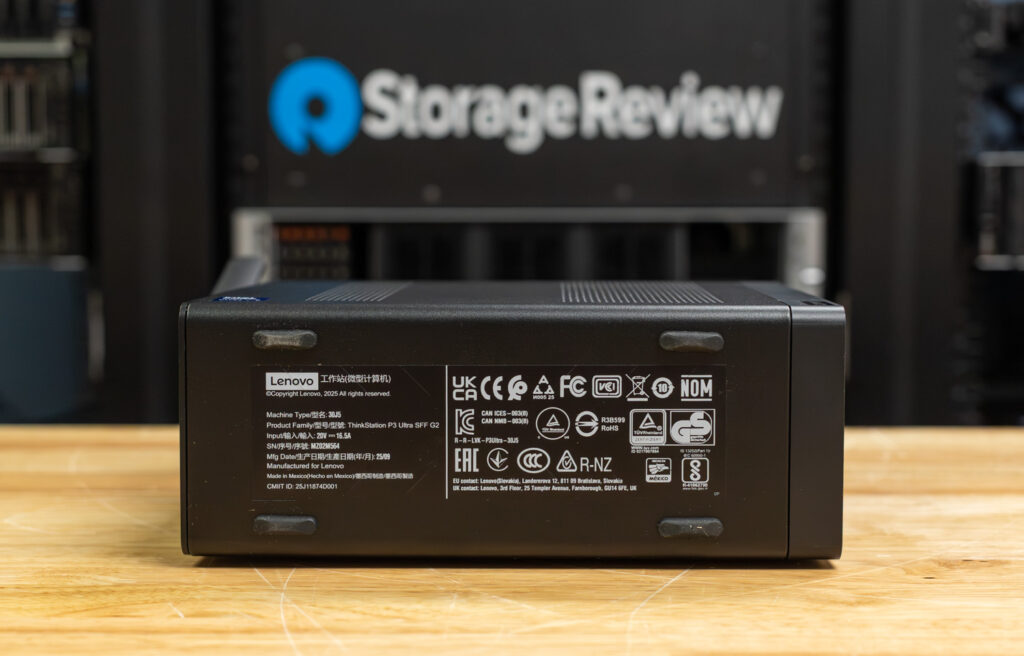
| Dimensions | 87 × 223 × 202 mm |
| Weight | Approx. 3.6 kg (7.9 lbs) |
| Durability | MIL-STD-810H certified |
Lenovo ThinkStation P3 Ultra SFF Gen 2: Design and Build
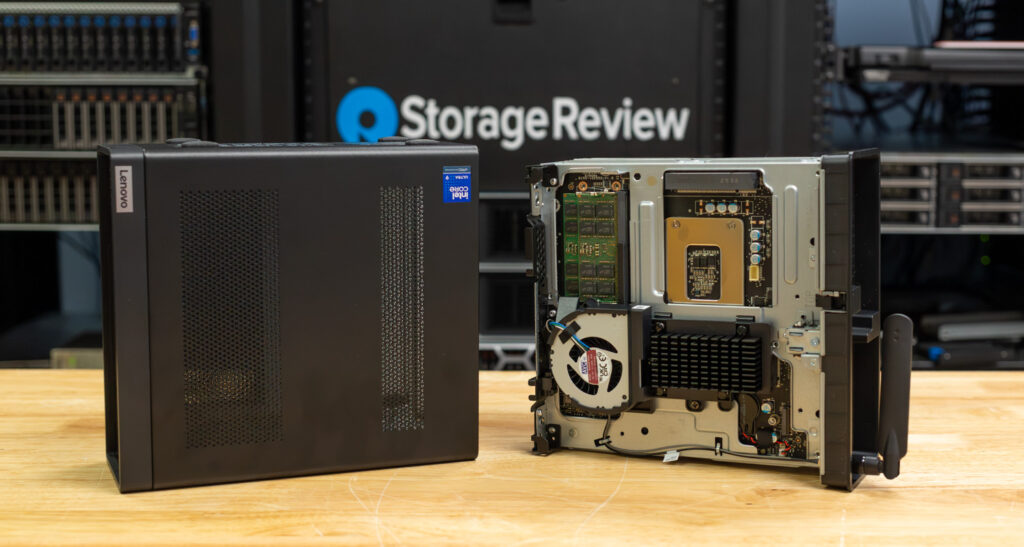
The ThinkStation P3 Ultra Gen 2 SFF features an innovative, dense design, packing workstation-grade power into a compact chassis that still measures 87 x 223 x 202 mm. Weighing around 3.6 kg (7.9 lbs), the system feels solid, with a honeycomb-style front panel that helps with airflow and gives it a distinctive, rugged look suited to studio or lab environments. The chassis passes MIL-STD-810H testing, so it can handle vibration, heat, and dust without issue.
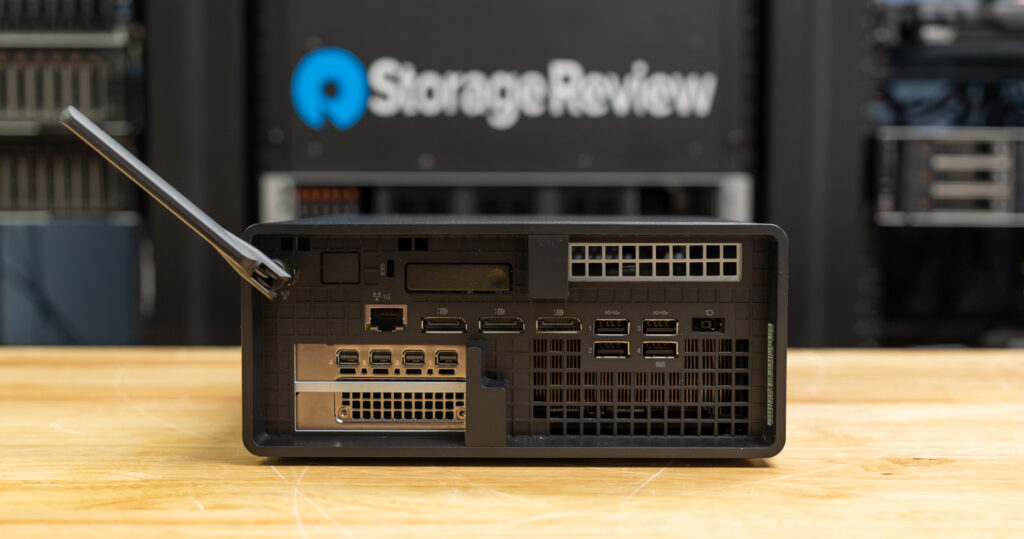
The front panel layout includes two USB-C 20 Gbps ports, a USB-A 10 Gbps port, and a headphone/mic combo jack for quick access to frequently used connections. Thunderbolt 4 is available only through an optional rear expansion card. Around back, Lenovo includes four USB-A 10 Gbps ports, three DisplayPort 1.2 outputs, and a single Gigabit Ethernet jack. Optional expansion cards can add a rear Thunderbolt 4 port or serial connectivity, allowing the system to be customized for specific professional setups.

To access the interior, push the chassis latches into the open position, and it should slide out.
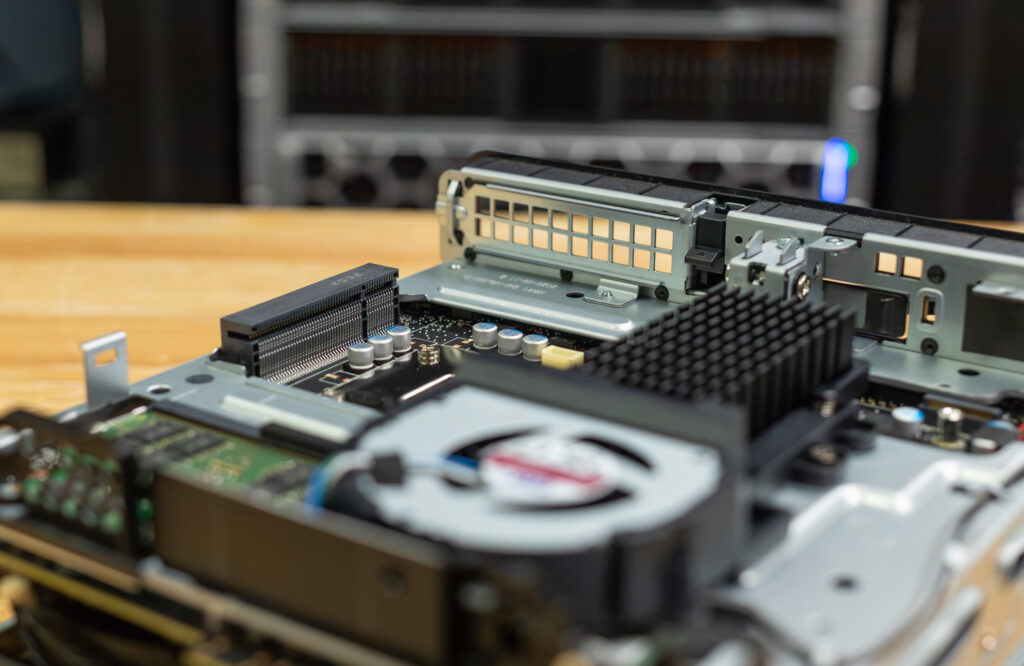
When you open the system, you’ll see Lenovo’s dual-zone cooling layout. The P3 Ultra Gen 2 uses moulded airflow ducts that separate the GPU and CPU areas, guiding fresh air directly across each component and out through the rear exhaust. This layout keeps the CPU and GPU from overheating and helps the system remain consistent under load.
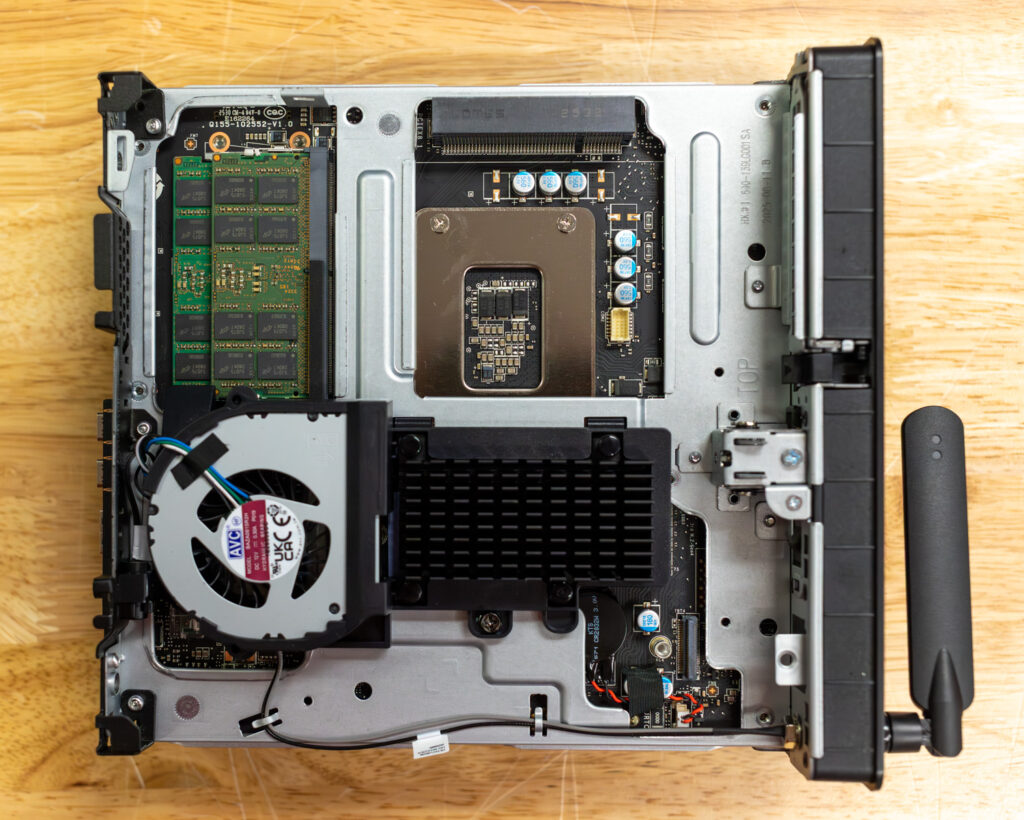
Here, you get two DDR5 SO-DIMM slots lined along the left edge, while the CPU backplate and a system fan blower fill the center area. This side also houses the Wi-Fi module’s wiring. It’s worth noting that the CPU is user-replaceable.
Lenovo ThinkStation P3 Ultra Gen 2 Performance
We will be comparing the benchmark results to the following systems:
The P3 Tower and P3 Tiny serve as valid comparison points for the P3 Ultra because they show how this platform scales at both ends. The Tower represents what the Ultra 9 285 can do with a larger chassis and a higher-tier GPU (NVIDIA RTX 5000 Ada). At the same time, the P3 Tiny shows how performance changes when cooling and GPU power (NVIDIA RTX A1000) are more limited.
Specifications:
- Processor: Intel Core Ultra 9 285, 24 (8 P-core + 16 E-core) 24 Threads, Max Turbo up to 5.1GHz
- Operating System: Windows 11 Pro 64-bit
- Graphics: NVIDIA RTX 4000 Ada
- Memory: 2 x 32GB SO-DIMM DDR5 Non-ECC
- Storage: 1x 1TB Samsung PM9E1 PCIe 5.0 SSD
At the time of this review, BHPhoto lists this exact build for $4,128.
UL Procyon AI Inference Benchmark
The Procyon AI Inference Benchmark delivers reliable and efficient performance testing by streamlining AI inference evaluation across diverse platforms. Developed in collaboration with leading AI hardware vendors, it minimizes complexity from variable models and system configurations to enable consistent, repeatable benchmarking. Optimized to measure CPU, GPU, or AI accelerators, it offers meaningful insights into how well different systems handle real-world AI tasks.
The P3 Ultra delivers steady CPU inference performance, with MobileNet at 0.99 ms and heavier models like ResNet 50 at 8.52 ms. Workloads such as Inception V4 (25.57 ms) and DeepLab V3 (31.42 ms) show the expected rise in latency as model size increases. REAL-ESRGAN hit 2,565 ms, which is normal given its complexity. The Ultra trails both the Tower and the Tiny across most CPU models, though the gaps are modest.
| CPU Results (Average Time in ms) | Lenovo ThinkStation P3 Ultra SFF Gen 2 (Intel Core Ultra 9 285) (NVIDIA RTX 4000 Ada) | Lenovo ThinkStation P3 Tower Gen 2 (Intel Core Ultra 9 285)(NVIDIA RTX 5000 Ada Generation) | Lenovo ThinkStation P3 Tiny Gen 2 (Intel Core Ultra 9 285)(NVIDIA RTX A1000) |
| AI Computer Vision Overall Score | 157 | 196 | 184 |
| MobileNet V3 | 0.99 ms | 0.94 ms | 0.98 ms |
| ResNet 50 | 8.52 ms | 6.83 ms | 7.47 ms |
| Inception V4 | 25.57 ms | 19.66 ms | 18.94 ms |
| DeepLab V3 | 31.42 ms | 24.89 ms | 24.97 ms |
| YOLO V3 | 58.88 ms | 43.43 ms | 44.46 ms |
| REAL-ESRGAN | 2,565.34 ms | 2,019.39 ms | 2,586.87 ms |
With the RTX 4000 Ada at work, the Ultra posts solid GPU times such as 0.56 ms for MobileNet, 2.26 ms for ResNet 50, and 6.04 ms for Inception V4. YOLO V3 completes in 9.17 ms, and REAL-ESRGAN lands at 246.78 ms. These are strong results for a compact system and comfortably ahead of the Tiny. The Tower, with its more powerful GPU, naturally finishes each model much faster, especially on heavier networks.
| GPU Results (Average Time in ms) | Lenovo ThinkStation P3 Ultra SFF Gen 2 (Intel Core Ultra 9 285) (NVIDIA RTX 4000 Ada) | Lenovo ThinkStation P3 Tower Gen 2 (Intel Core Ultra 9 285)(NVIDIA RTX 5000 Ada Generation) | Lenovo ThinkStation P3 Tiny Gen 2 (Intel Core Ultra 9 285)(NVIDIA RTX A1000) |
| AI Computer Vision Overall Score | 627 | 1,168 | 294 |
| MobileNet V3 | 0.56 ms | 0.46 ms | 1.11 ms |
| ResNet 50 | 2.26 ms | 1.07 ms | 4.99 ms |
| Inception V4 | 6.04 ms | 2.71 ms | 14.49 ms |
| DeepLab V3 | 14.73 ms | 12.27 ms | 23.79 ms |
| YOLO V3 | 9.17 ms | 4.63 ms | 23.02 ms |
| REAL-ESRGAN | 246.78 ms | 81.82 ms | 538.75 ms |
TensorRT boosts the Ultra’s acceleration nicely, dropping MobileNet to 0.31 ms, ResNet 50 to 1.42 ms, and Inception V4 to 4.41 ms. DeepLab V3 completes in 4.52 ms, and YOLO V3 follows at 5.22 ms. REAL-ESRGAN sees a noticeable decrease to 278 ms. The Ultra lands between the Tower and Tiny, offering a potent blend of speed and efficiency for its size, while the Tower extends a much broader lead due to its equipped RTX 5000 Ada.
| TensorRT Results (Average Time in ms) | Lenovo ThinkStation P3 Ultra SFF Gen 2 (Intel Core Ultra 9 285) (NVIDIA RTX 4000 Ada) | Lenovo ThinkStation P3 Tower Gen 2 (Intel Core Ultra 9 285)(NVIDIA RTX 5000 Ada Generation) | Lenovo ThinkStation P3 Tiny Gen 2 (Intel Core Ultra 9 285)(NVIDIA RTX A1000) |
| AI Computer Vision Overall Score | 1,031 | 1,706 | 532 |
| MobileNet V3 | 0.31 ms | 0.24 ms | 0.55 ms |
| ResNet 50 | 1.42 ms | 0.94 ms | 2.45 ms |
| Inception V4 | 4.41 ms | 2.76 ms | 7.43 ms |
| DeepLab V3 | 4.52 ms | 3.92 ms | 9.44 ms |
| YOLO V3 | 5.22 ms | 3.09 ms | 12.01 ms |
| REAL-ESRGAN | 278.46 ms | 84.04 ms | 602.72 ms |
UL Procyon: AI Text Generation
The Procyon AI Text Generation Benchmark streamlines AI LLM performance testing by providing a concise and consistent evaluation method. It allows repeated testing across multiple LLM models while minimizing the complexity of large models and variable factors. Developed with AI hardware leaders, it optimizes the use of local AI accelerators to deliver more reliable, efficient performance assessments. The results measured below were tested using TensorRT.
During the text-generation tests, the Ultra’s RTX 4000 Ada delivered solid throughput across models. Phi outputs its first token in 0.395 s and averages about 82 tokens/s. Mistral has a slightly slower start at 0.666 s and produces around 57 tokens/s, while Llama3 outputs at roughly 48 tokens/s. Llama2 takes longer to start at 1.1 s and runs at about 26 tokens per second. The Ultra consistently sits between the Tower and the Tiny, leaning closer to the Tower in responsiveness.
| UL Procyon: AI Text Generation | Lenovo ThinkStation P3 Ultra SFF Gen 2 (Intel Core Ultra 9 285) (NVIDIA RTX 4000 Ada) | Lenovo ThinkStation P3 Tower Gen 2 (Intel Core Ultra 9 285)(NVIDIA RTX 5000 Ada Generation) | Lenovo ThinkStation P3 Tiny Gen 2 (Intel Core Ultra 9 285)(NVIDIA RTX A1000) |
| Phi Overall Score | 2,303 | 4,344 | 1,117 |
| Phi Output Time To First Token | 0.395 s | 0.218 s | 0.808 s |
| Phi Output Tokens Per Second | 81.784 tokens/s | 160.757 tokens/s | 39.379 tokens/s |
| Phi Overall Duration | 35.869 s | 18.356 s | 27.734 s |
| Mistral Overall Score | 1,977 | 4,136 | 3,045 |
| Mistral Output Time To First Token | 0.666 s | 0.314 s | 1.398 s |
| Mistral Output Tokens Per Second | 57.102 tokens/s | 117.784 tokens/s | 27.734 tokens/s |
| Mistral Overall Duration | 51.942 s | 25.142 s | 107.361 s |
| Llama3 Overall Score | 1,759 | 3,611 | 837 |
| Llama3 Output Time To First Token | 0.628 s | 0.301 s | 1.412 s |
| Llama3 Output Tokens Per Second | 47.884 tokens/s | 96.565 tokens/s | 24.323 tokens/s |
| Llama3 Overall Duration | 61.189 s | 30.285 s | 121.980 s |
| Llama2 Overall Score | 1,770 | 3,942 | – |
| Llama2 Output Time To First Token | 1.106 s | 0.502 s | – |
| Llama2 Output Tokens Per Second | 25.617 tokens/s | 57.623 tokens/s | – |
| Llama2 Overall Duration | 112.746 s | 50.269 s | – |
UL Procyon: AI Image Generation
The Procyon AI Image Generation Benchmark provides a consistent and accurate method for measuring AI inference performance across a range of hardware, from low-power NPUs to high-end GPUs. It includes three tests: Stable Diffusion XL (FP16) for high-end GPUs, Stable Diffusion 1.5 (FP16) for moderately powerful GPUs, and Stable Diffusion 1.5 (INT8) for low-power devices. The benchmark uses the optimal inference engine for each system, ensuring fair and comparable results.
The P3 Ultra handles FP16 Stable Diffusion 1.5 at 4.75 s per image and completes the whole run in about 76 seconds. INT8 inference is much faster, dropping to 1.81 s per image for a total of 14.48 seconds. Stable Diffusion XL is heavier, taking 35.31 s per image and 565 seconds overall. These speeds place the Ultra well above the Tiny, while the Tower remains much quicker, again thanks to the more powerful GPU.
| UL Procyon: AI Image Generation | Lenovo ThinkStation P3 Ultra SFF Gen 2 (Intel Core Ultra 9 285) (NVIDIA RTX 4000 Ada) | Lenovo ThinkStation P3 Tower Gen 2 (Intel Core Ultra 9 285)(NVIDIA RTX 5000 Ada Generation) | Lenovo ThinkStation P3 Tiny Gen 2 (Intel Core Ultra 9 285)(NVIDIA RTX A1000) |
| Stable Diffusion 1.5 (FP16) – Overall Score | 1,316 | 3,734 | 558 |
| Stable Diffusion 1.5 (FP16) – Overall Time | 75.986 s | 26.779 s | 179.144 s |
| Stable Diffusion 1.5 (FP16) – Image Generation Speed | 4.749 s/image | 1.674 s/image | 11.196 s/image |
| Stable Diffusion 1.5 (INT8) – Overall Score | 17,263 | 45,881 | 6,793 |
| Stable Diffusion 1.5 (INT8) – Overall Time | 14.482 s | 5.449 s | 36.798 s |
| Stable Diffusion 1.5 (INT8) – Image Generation Speed | 1.810 s/image | 0.681 s/image | 4.600 s/image |
| Stable Diffusion XL (FP16) – Overall Score | 1,061 | 3,293 | – |
| Stable Diffusion XL (FP16) – Overall Time | 565.015 | 182.179 s | – |
| Stable Diffusion XL (FP16) – Image Generation Speed | 35.313 s/image | 11.386 s/image | – |
SPECworkstation 4
The SPECworkstation 4.0 benchmark is a comprehensive tool for evaluating all key aspects of workstation performance. It provides a real-world measure of CPU, graphics, accelerator, and disk performance, enabling professionals to make informed decisions about their hardware investments. The benchmark includes a dedicated set of tests focused on AI/ML workloads, including data science tasks and ONNX runtime-based inference tests, reflecting the growing importance of AI/ML in workstation environments. It encompasses seven industry verticals and four hardware subsystems, providing a detailed and relevant measure of the performance of today’s workstations.
Across SPECworkstation’s categories, the Ultra posts strong scores, including 2.11 in Energy, 2.51 in Life Sciences, and 2.28 in Media and Entertainment. Product Design comes in at 2.28. While the Tower leads in every category and the Tiny trails behind, the Ultra holds a comfortable middle ground as usual.
| SPECworkstation 4.0.0 (Higher is better) | Lenovo ThinkStation P3 Ultra SFF Gen 2 (Intel Core Ultra 9 285) (NVIDIA RTX 4000 Ada) | Lenovo ThinkStation P3 Tower Gen 2 (Intel Core Ultra 9 285)(NVIDIA RTX 5000 Ada Generation) | Lenovo ThinkStation P3 Tiny Gen 2 (Intel Core Ultra 9 285)(NVIDIA RTX A1000) |
| Energy | 2.11 | 2.49 | 1.33 |
| Financial Services | 1.52 | 2.44 | 1.62 |
| Life Sciences | 2.51 | 2.84 | 1.80 |
| Media & Entertainment | 2.28 | 2.69 | 1.89 |
| Product Design | 2.28 | 2.46 | 1.77 |
| Productivity & Development | 1.29 | 1.50 | 1.29 |
Luxmark
Luxmark is a GPU benchmark that uses LuxRender, an open-source ray-tracing renderer, to evaluate a system’s performance with highly detailed 3D scenes. This benchmark is relevant for assessing the graphical rendering capabilities of servers and workstations, especially for visual effects and architectural visualization applications, where accurate light simulation is crucial.
The P3 Ultra’s RTX 4000 Ada turns in solid Luxmark results, scoring 15,054 in Hallbench and 5,612 in the Food scene. These numbers indicate that the Ultra can handle ray-traced workloads with decent efficiency for a compact workstation. Its performance sits well above the Tiny’s lower-tier GPU, while the Tower naturally pulls ahead.
Overall, the Ultra delivers enough ray-tracing throughput for visualization, lighting previews, and GPU-accelerated rendering in everyday professional workflows.
| Luxmark (Higher is better) | Lenovo ThinkStation P3 Ultra SFF Gen 2 (Intel Core Ultra 9 285) (NVIDIA RTX 4000 Ada) | Lenovo ThinkStation P3 Tower Gen 2 (Intel Core Ultra 9 285) (NVIDIA RTX 5000 Ada Generation) | Lenovo ThinkStation P3 Tiny Gen 2 (Intel Core Ultra 9 285)(NVIDIA RTX A1000) |
| Hallbench | 15,054 | 26,792 | 7,423 |
| Food | 5,612 | 12,562 | 2,860 |
7-Zip Compression
The 7-Zip Compression Benchmark evaluates CPU performance during compression and decompression, measuring GIPS (Giga Instructions Per Second) and CPU usage. Higher GIPS and efficient CPU usage indicate superior performance.
The Ultra delivers strong compression performance with a total rating of 162.530 GIPS and CPU usage at around 2,179%. Individual compression passes reach roughly 161-162 GIPS, and decompression lands at about 162.5 GIPS. These numbers edge out the Tiny and stay pretty close to the Tower despite the size difference. For CPU-heavy compression workloads, the Ultra performs as expected from the Ultra 9 285 processor.
| 7-Zip Compression Benchmark (Higher is Better) | Lenovo ThinkStation P3 Ultra SFF Gen 2 (Intel Core Ultra 9 285) (NVIDIA RTX 4000 Ada) | Lenovo ThinkStation P3 Tower Gen 2 (Intel Core Ultra 9 285) (NVIDIA RTX 5000 Ada Generation) | Lenovo ThinkStation P3 Tiny Gen 2 (Intel Core Ultra 9 285)(NVIDIA RTX A1000) | ||
| Compression | |||||
| Current CPU Usage | 2,129% | 1,899% | 2,030% | ||
| Current Rating/Usage | 7.590 GIPS | 6.970 GIPS | 5.369 GIPS | ||
| Current Rating | 161.558 GIPS | 132.461 GIPS | 109.008 GIPS | ||
| Resulting CPU Usage | 2,116% | 1,894% | 2,007% | ||
| Resulting Rating/Usage | 7.689 GIPS | 7.115 GIPS | 5,492 GIPS | ||
| Resulting Rating | 162.405 GIPS | 134.748 GIPS | 110.189 GIPS | ||
| Decompression | |||||
| Current CPU Usage | 2,263% | 2,191% | 2,243% | ||
| Current Rating/Usage | 7.184 GIPS | 6.937 GIPS | 6.049 GIPS | ||
| Current Rating | 162.532 GIPS | 152.009 GIPS | 135.698 GIPS | ||
| Resulting CPU Usage | 2,243% | 1,979% | 2,232% | ||
| Resulting Rating/Usage | 7.239 GIPS | 7,209 GIPS | 6.479 GIPS | ||
| Resulting Rating | 162.405 GIPS | 142.655 GIPS | 144.454 GIPS | ||
| Total Rating | |||||
| Total CPU Usage | 2,179% | 1,937% | 2,120% | ||
| Total Rating/Usage | 7.464 GIPS | 7.162 GIPS | 5.985 GIPS | ||
| Total Rating | 162.530 GIPS | 138.701 GIPS | 127.322 GIPS | ||
Blackmagic RAW Speed Test
The Blackmagic RAW Speed Test is a performance benchmarking tool that measures a system’s capabilities for handling video playback and editing using the Blackmagic RAW codec. It evaluates how well a system decodes and plays back high-resolution video files, reporting frame rates for CPU- and GPU-based processing.
In the RAW test, the Ultra decodes 8K CPU footage at 114 fps and handles 8K OpenCL at 129 fps. These numbers place it between the Tower and Tiny, providing a mid-class experience for those working with demanding 8K material.
| Blackmagic RAW Speed Test | Lenovo ThinkStation P3 Ultra SFF Gen 2 (Intel Core Ultra 9 285) (NVIDIA RTX 4000 Ada) | Lenovo ThinkStation P3 Tower Gen 2 (Intel Core Ultra 9 285) (NVIDIA RTX 5000 Ada Generation) | Lenovo ThinkStation P3 Tiny Gen 2 (Intel Core Ultra 9 285)(NVIDIA RTX A1000) |
|---|---|---|---|
| 8K CPU | 114 | 125 | 86 |
| 8K OPENCL | 129 | 179 | 61 |
Blackmagic Disk Speed Test
The Blackmagic Disk Speed Test evaluates storage performance by measuring read and write speeds, providing insights into a system’s ability to handle data-intensive tasks, such as video editing and large file transfers.
Storage performance on the Ultra lands at 7,229MB/s read and 6,094MB/s write, which is competitive with high-end PCIe Gen 4 SSD setups. The Tower posts slightly higher numbers, while the Tiny falls behind.
The Ultra’s results show it can support large file transfers and high-bandwidth media work.
| Disk Speed Test (higher is better) | Lenovo ThinkStation P3 Ultra SFF Gen 2 (Intel Core Ultra 9 285) (NVIDIA RTX 4000 Ada) | Lenovo ThinkStation P3 Tower Gen 2 (Intel Core Ultra 9 285) (NVIDIA RTX 5000 Ada Generation) | Lenovo ThinkStation P3 Tiny Gen 2 (Intel Core Ultra 9 285)(NVIDIA RTX A1000) |
| Read | 7,229.8 MB/s | 7304.2 MB/s | 6,742.0 MB/s |
| Write | 6,094.6 MB/s | 7006.2 MB/s | 5,781.6 MB/s |
Blender 4.3
Blender is an open-source 3D modeling application. This benchmark was run using the Blender Benchmark utility. The score is measured in samples per minute, with higher values indicating better performance.
The Ultra performs very well in Blender’s CPU scenes. It scores 202.9 samples per minute in Monster, 133.4 in Junkshop, and 100 in Classroom, outpacing both the Tower and Tiny.
| Blender CPU (Samples per minute, Higher is better) | Lenovo ThinkStation P3 Ultra SFF Gen 2 (Intel Core Ultra 9 285)(NVIDIA RTX 4000 Ada) | Lenovo ThinkStation P3 Tower Gen 2 (Intel Core Ultra 9 285) (NVIDIA RTX 5000 Ada Generation) | Lenovo ThinkStation P3 Tiny Gen 2 (Intel Core Ultra 9 285)(NVIDIA RTX A1000) |
| Monster | 202.9 | 163.7 | 179.31 |
| Junkshop | 133.4 | 106.8 | 110.79 |
| Classroom | 100.0 | 80.9 | 77.45 |
For GPU rendering, the Ultra delivers 1,763 samples per minute in Monster, 889 in Junkshop, and 906 in Classroom. These scores put it far ahead of the Tiny but well behind the Tower, where the larger RTX 5000 Ada produces more than double the throughput. The Ultra still offers strong performance for its class and footprint.
| Blender GPU (Samples per minute, Higher is better) | Lenovo ThinkStation P3 Ultra SFF Gen 2 (Intel Core Ultra 9 285)(NVIDIA RTX 4000 Ada) | Lenovo ThinkStation P3 Tower Gen 2 (Intel Core Ultra 9 285)(NVIDIA RTX 5000 Ada Generation) | Lenovo ThinkStation P3 Tiny Gen 2 (Intel Core Ultra 9 285)(NVIDIA RTX A1000) |
| Monster | 1,763.2 | 3,884.68 | 581.75 |
| Junkshop | 888.7 | 1,743.56 | 363.47 |
| Classroom | 906.0 | 1,876.89 | 323.37 |
y-cruncher
y-cruncher is a multithreaded and scalable program that can compute Pi and other mathematical constants to trillions of digits. Since its launch in 2009, it has become a popular benchmarking and stress-testing application for overclockers and hardware enthusiasts.
The P3 Ultra shows excellent sustained compute performance, completing the 1-billion-digit run in 19.524 seconds and the 10-billion-digit run in 273.9 seconds. These results are faster than both the Tower and Tiny, indicating that the Ultra maintains higher clock stability during long, multi-stage workloads.
| Y-Cruncher (Total Computation Time) | Lenovo ThinkStation P3 Ultra SFF Gen 2 (Intel Core Ultra 9 285) (NVIDIA RTX 4000 Ada) | Lenovo ThinkStation P3 Tower Gen 2 (Intel Core Ultra 9 285)(NVIDIA RTX 5000 Ada Generation) | Lenovo ThinkStation P3 Tiny Gen 2 (Intel Core Ultra 9 285)(NVIDIA RTX A1000) |
|---|---|---|---|
| 1 Billion | 19.524 s | 22.112 s | 24.063 s |
| 2.5 Billion | 55.207 s | 68.345 s | 67.223 s |
| 5 Billion | 122.528 s | 146.977 s | 154.892 s |
| 10 Billion | 273.903 s | 340.904 s | – |
| 25 Billion | – | – | – |
| 50 Billion | – | – | – |
Geekbench 6
Geekbench 6 is a cross-platform benchmark that measures overall system performance.
The Ultra scores 3,155 in single-core and 20,334 in multi-core, keeping it close to the Tower but ahead of the Tiny in overall multithreaded performance. Its OpenCL score of 122,981 shows the expected improvement from the RTX 4000 Ada, landing well above the Tiny’s smaller GPU. Overall, the Ultra delivers balanced performance.
| Geekbench 6 (Higher is better) | Lenovo ThinkStation P3 Ultra SFF Gen 2 (Intel Core Ultra 9 285) (NVIDIA RTX 4000 Ada) | Lenovo ThinkStation P3 Tower Gen 2 (Intel Core Ultra 9 285)(NVIDIA RTX 5000 Ada Generation) | Lenovo ThinkStation P3 Tiny Gen 2 (Intel Core Ultra 9 285)(NVIDIA RTX A1000) |
|---|---|---|---|
| CPU Single-Core | 3,155 | 3,175 | 3,194 |
| CPU Multi-Core | 20,334 | 21,033 | 17,572 |
| GPU OpenCL | 122,981 | 244,185 | 55,345 |
Cinebench 2024
Cinebench 2024 extends R23’s benchmark capabilities by adding GPU performance evaluation. It continues to test CPU performance but also includes tests that measure the GPU’s ability to handle rendering tasks.
Here, the Ultra posts 1,727 in multi-core and 139 in single-core. Its GPU score reaches 12,222 with the RTX 4000 Ada. For mixed CPU-plus-GPU rendering work, the Ultra offers decent, mid-tier output.
| Cinebench 2024 (Higher is better) | Lenovo ThinkStation P3 Ultra SFF Gen 2 (Intel Core Ultra 9 285) (NVIDIA RTX 4000 Ada) | Lenovo ThinkStation P3 Tower Gen 2 (Intel Core Ultra 9 285)(NVIDIA RTX 5000 Ada Generation) | Lenovo ThinkStation P3 Tiny Gen 2 (Intel Core Ultra 9 285)(NVIDIA RTX A1000) |
|---|---|---|---|
| Multi-Core | 1,727 | 1,851 | 1,511 |
| Single-Core | 139 | 142 | 138 |
| GPU | 12,222 | 23,746 | 4,399 |
Conclusion
The Lenovo ThinkStation P3 Ultra Gen 2 SFF fits into an interesting spot in Lenovo’s workstation lineup, especially after spending time with the ThinkStation P3 Tiny from the same line. Both systems deliver more power than their size would suggest, and in many CPU-heavy tests, the two machines felt very close. Where the Ultra pulls ahead is in GPU-accelerated workloads like 3D work, AI inference, and anything that leans on VRAM. During testing, I found that specific jobs finished noticeably faster on the Ultra simply because the GPU had some extra headroom.
The Ultra’s compact chassis offers professionals all the valuable benefits of a small workstation, including flexible placement, a clean footprint, and ample connectivity. The Ultra offers the same level of versatility as the Tiny, thanks to its support for up to 128GB of DDR5 across two SODIMM slots and a wide range of Intel Core Ultra processors. Despite having an external power adapter and a more modest GPU ceiling than Lenovo’s larger tower models, the Ultra delivers strong CPU and GPU performance for its size.
What stands out most is how well the Ultra handles GPU-heavy work. Tasks such as running local-language models benefit immediately from the additional VRAM, making the Ultra an ideal choice for users who heavily rely on such acceleration. Although it may not match the performance of Lenovo’s larger setups, the RTX 4000 Ada configuration provides sufficient power to make the Ultra a legitimate workstation for production environments.
For professionals seeking a compact system with ample power, the P3 Ultra SFF Gen 2 is an excellent choice. It delivers workstation-class performance in a smaller box and fits easily into most setups. If your workloads scale heavily with GPU power, the tower class is still the better long-term solution. Still, for mixed tasks, CPU-driven projects, and everyday professional work, the Ultra offers an appealing balance of size, speed, and capability.


 Amazon