

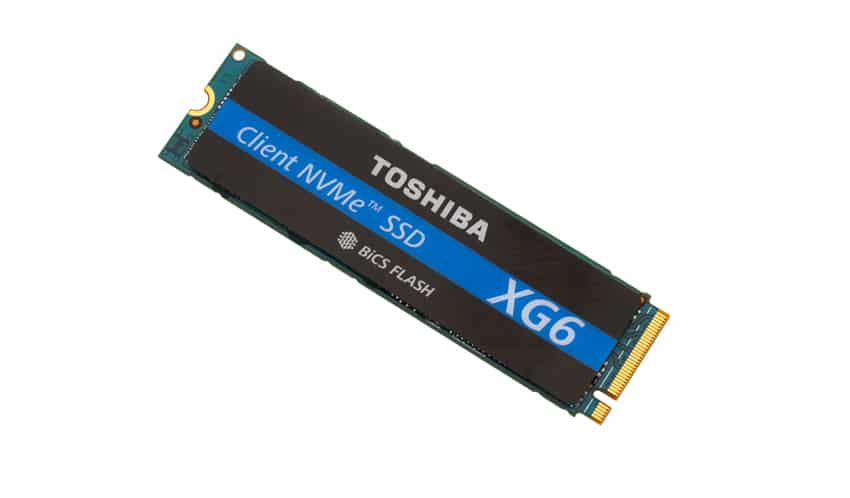
The Toshiba XG6 is the market’s first SSD built on 96-layer 3D TLC BiCS FLASH memory, joining the company`s impressive mid-range client portfolio as their newest mainstream NVMe drive. Announced back in July, the XG6 replaces the highly-impressive XG5, a drive we really liked that would work well inside client PCs, high-performance mobile devices, gaming segments and embedded applications. Though the XG6 is certainly built for these use cases as well, it is also ideal for data center environments as boot drives in servers, caching and logging, in-situ processing and commodity storage.
Toshiba’s also states that their new XG6 SSD enjoys an hefty 40% increase in per unit chip size compared to the 64-later 3D flash memory, while its performance-to-power ratio is quoted at 4.5W and 5.7W, respectively. The Gen BiCS FLASH will also support Toggle 3.0 speeds (667-800MT/s) and 1.2V I/O.
As far as performance goes, the Toshiba quotes some of the best numbers we’ve seen in this class of SSDs. Specifically, the XG6 is expected to hit 3,180MB/s read and 2,960MB/s write in sequential speeds, while random reads and writes are quoted at 355,000 IOPS and 365,000 IOPS, respectively.
Toshiba XG6 Client NVMe SSD Specifications
| User Capacity (GB): | 256, 512, 1024 |
| Flash Memory Technology: | 96-layer 3D BiCS FLASHTM (TLC) |
| Interface: | PCIe Rev. 3.1a Gen3 x 4L / NVMe Rev. 1.3a |
| Form Factors: | M.2 2280 (22mm X 80mm) single sided |
| Performance: | |
| Sequential Read: | Up to 3,180MB/s |
| Sequential Write: | Up to 2,960MB/s |
| Random Read: | Up to 355,000 IOPS |
| Random Write: | Up to 365,000 IOPS |
| Power: | |
| Consumption: | Active Read: < 4.5 W typ. Active Write: < 4.7 W typ. L1.2 mode: < 3 mW typ. |
| Security TCG Pyrite standard and OPAL 2.01 as an option | |
| MTTF: | 1,500,000 hours |
| Temperature: | |
Operating:
|
|
| Non-op: -40 to 85 Ta ℃ | |
| Limited Warranty: | Approximately 5 years |
Performance
Testbed
The test platform leveraged in these tests is a Dell PowerEdge R740xd server. We measure SATA performance through a Dell H730P RAID card inside this server, although we set the card in HBA mode only to disable the impact of RAID card cache. NVMe is tested natively through an M.2 to PCIe adapter card. The methodology used better reflects end-user workflow with the consistency, scalability and flexibility testing within virtualized server offers. A large focus is put on drive latency across the entire load range of the drive, not just at the smallest QD1 (Queue-Depth 1) levels. We do this because many of the common consumer benchmarks don’t adequately capture end-user workload profiles.
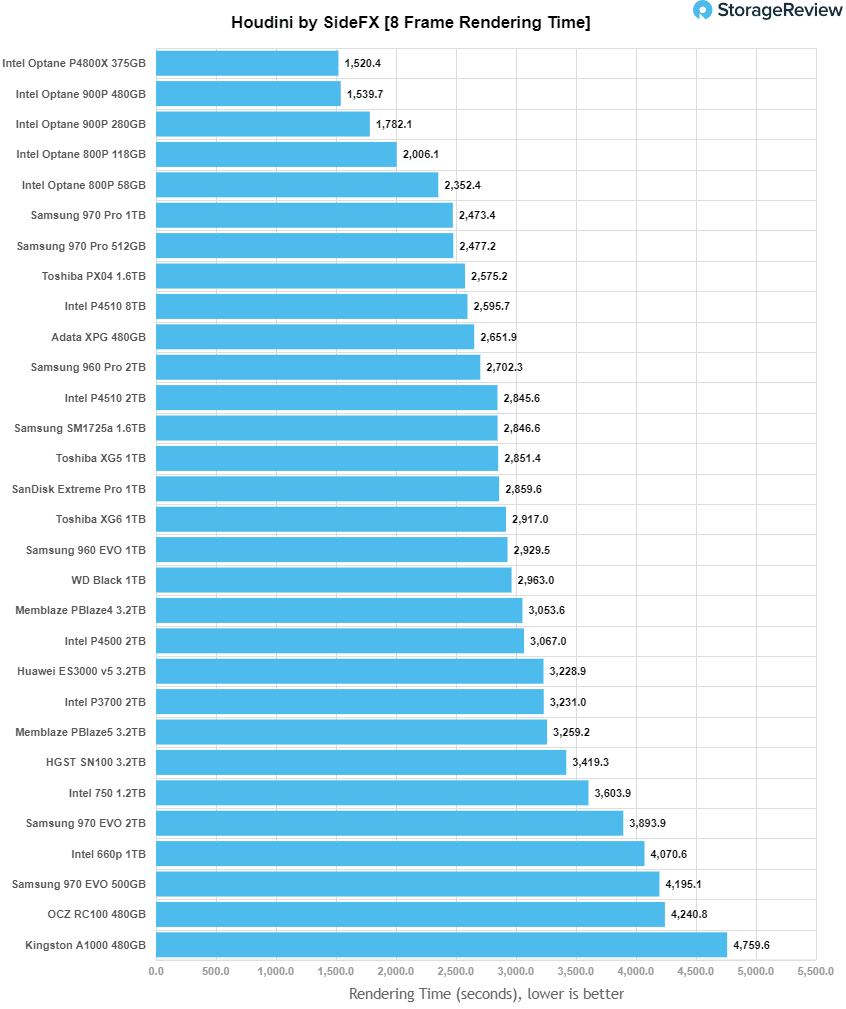
Houdini by SideFX
The Houdini test is specifically designed to evaluate storage performance as it relates to CGI rendering. The test bed for this application is a variant of the core Dell PowerEdge R740xd server type we use in the lab with dual Intel 6130 CPUs and 64GB DRAM. In this case we installed Ubuntu Desktop (ubuntu-16.04.3-desktop-amd64) running bare metal. Output of the benchmark is measured in seconds to complete, with fewer being better.
The Maelstrom demo represents a section of the rendering pipeline that highlights the performance capabilities of storage by demonstrating its ability to effectively use the swap file as a form of extended memory. The test does not write out the result data or process the points in order to isolate the wall-time effect of the latency impact to the underlying storage component. The test itself is composed of five phases, three of which we run as part of the benchmark, which are as follows:
- Loads packed points from disk. This is the time to read from disk. This is single threaded, which may limit overall throughput.
- Unpacks the points into a single flat array in order to allow them to be processed. If the points do not have dependency on other points, the working set could be adjusted to stay in-core. This step is multi-threaded.
- (Not Run) Process the points.
- Repacks them into bucketed blocks suitable for storing back to disk. This step is multi-threaded.
- (Not Run) Write the bucketed blocks back out to disk.
The Toshiba XG6 1TB posted a score of 2,917 seconds, placing it right in the middle of the leaderboard.
SQL Server Performance
We use a lightweight virtualized SQL Server instance to appropriately represent what an application developer would use on a local workstation. The test is similar to what we run on storage arrays and enterprise drives, just scaled back to be a better approximation for behaviors employed by the end user. The workload employs the current draft of the Transaction Processing Performance Council’s Benchmark C (TPC-C), an online transaction processing benchmark that simulates the activities found in complex application environments.
The lightweight SQL Server VM is configured with three vDisks: 100GB volume for boot, a 350GB volume for the database and log files, and a 150GB volume used for the database backup we recover after each run. From a system resource perspective, we configure each VM with 16 vCPUs, 32GB of DRAM and leverage the LSI Logic SAS SCSI controller. This test uses SQL Server 2014 running on Windows Server 2012 R2 guest VMs and is stressed by Dell’s Benchmark Factory for Databases.
SQL Server Testing Configuration (per VM)
- Windows Server 2012 R2
- Storage Footprint: 600GB allocated, 500GB used
- SQL Server 2014
- Database Size: 1,500 scale
- Virtual Client Load: 15,000
- RAM Buffer: 24GB
- Test Length: 3 hours
- 2.5 hours preconditioning
- 30 minutes sample period
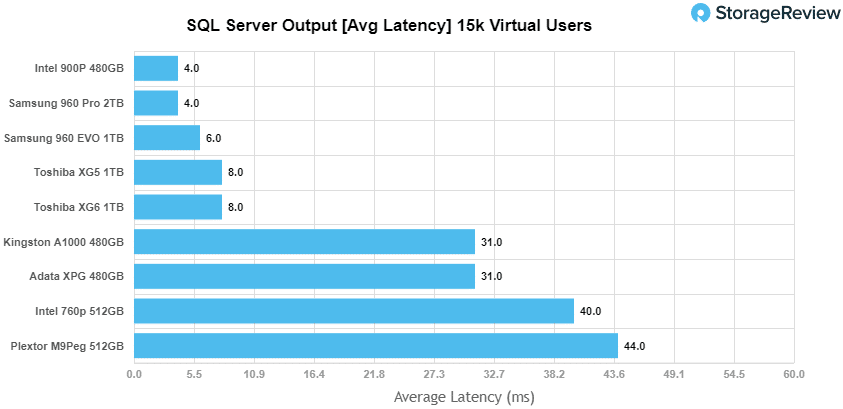
When looking at SQL Server Output, the Toshiba XG6 1TB placed in the middle of the pack (though not far behind the leader) with a score of 3,157.2 TPS.
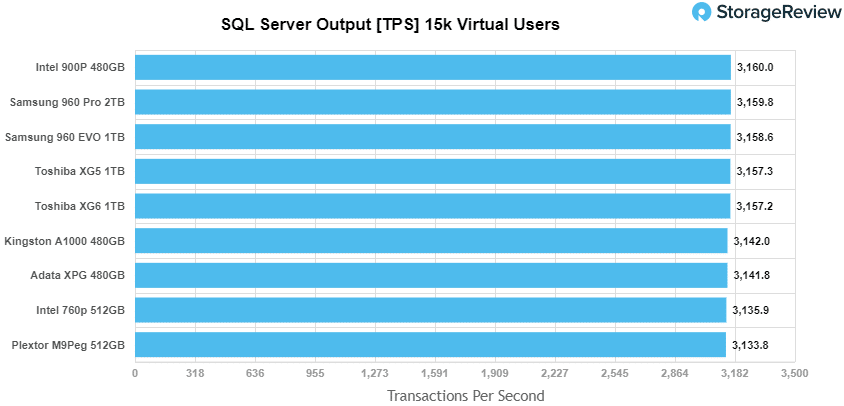
In average latency, the XG6 posted an impressive 8ms in latency, which was the same as its predecessor.
VDBench Workload Analysis
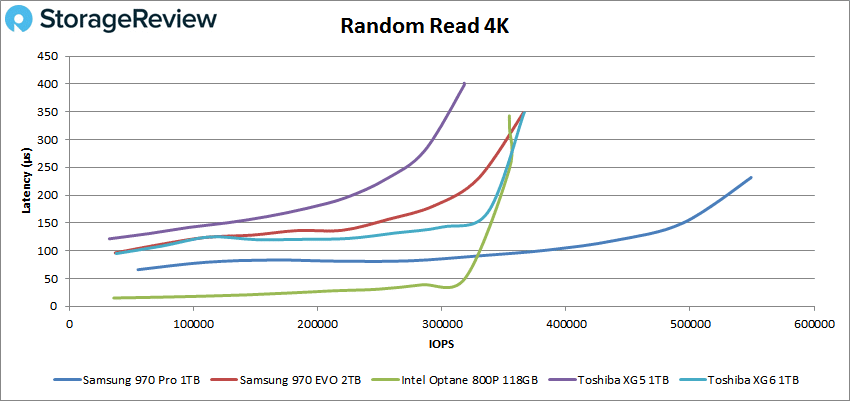
The peak 4K performance of the Toshiba XG6 drive showed 366,208 IOPS in reads with a latency of 348.4μs, placing it behind the Samsung 970 PRO for second place.
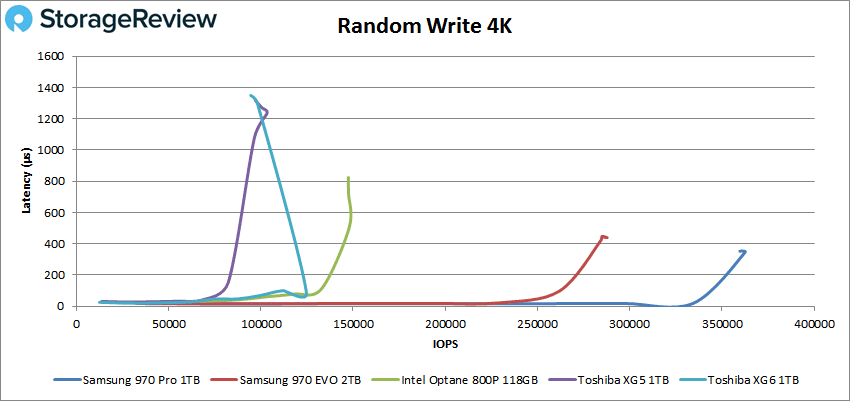
Write performance unfortunately showed poor results, as the drive peaked at just 94,516 IOPS with a latency of 1,349.2ms. This wasn’t too much of a surprise as the XG5 posted similar results.
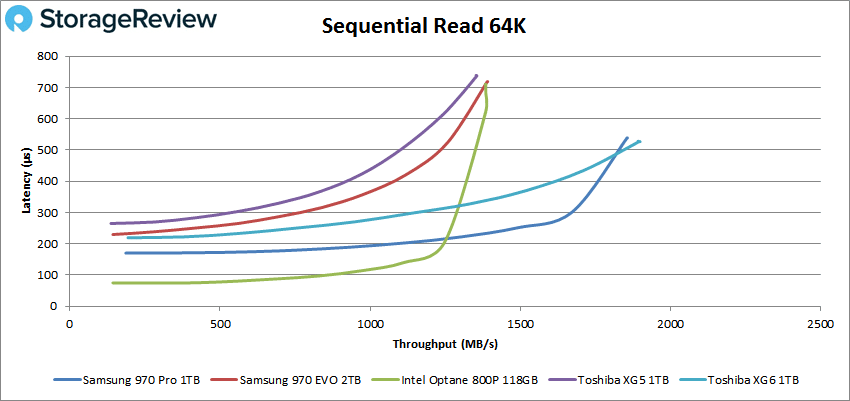
Switching over to sequential work with 64K tests showed impressive performance posting an impressive 30,371 IOPS or 1,898MB/s with a latency of 526.8ms.
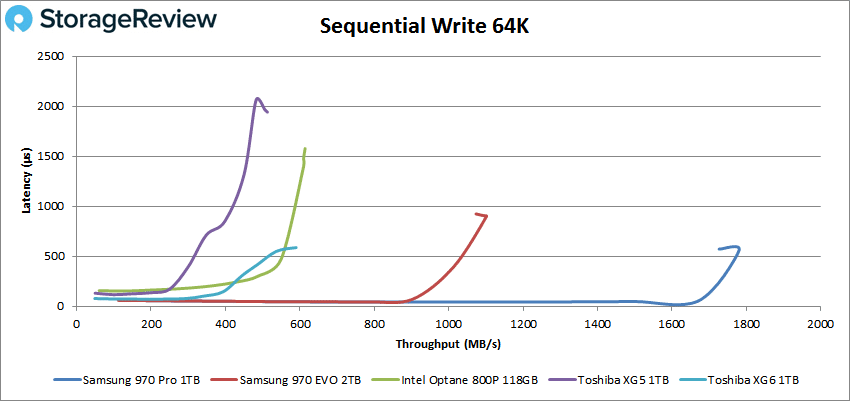
Looking at sequential 64K writes showed a noticeable improvement in latency and IOPS over the XG5, posting a peak performance of 9,443 IOPS or 590MB/s with a latency of 587.8ms.
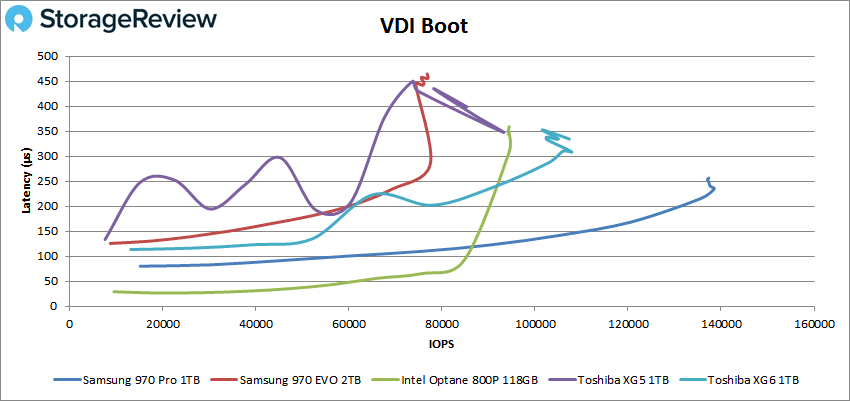
Next, we looked at our VDI benchmarks, which are designed to tax the drives even further. These tests include Boot, Initial Login, and Monday Login. Looking at the Boot test, the Toshiba XG6 had an impressive peak performance of 107,390 IOPS with a latency of 334μs, which was good enough for 2nd place among the tested drives. Again, the XG6 showed solid improvements over the XG5.
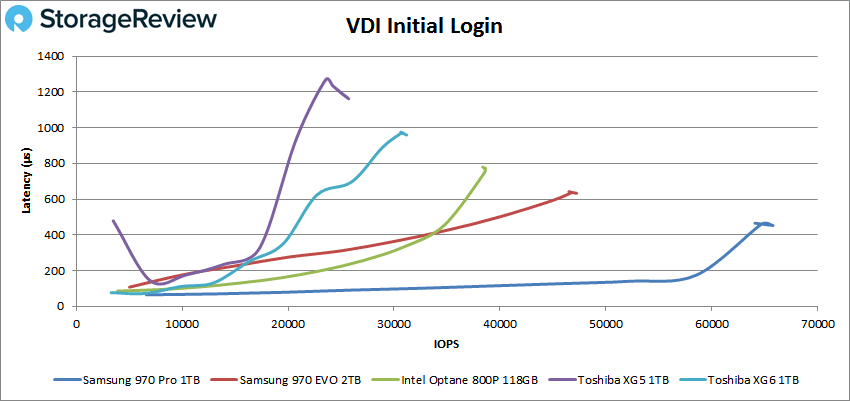
In our VDI Initial Login the XG6 fell behind a bit, peaking at just 31,183 IOPS and 958.9μs in latency.
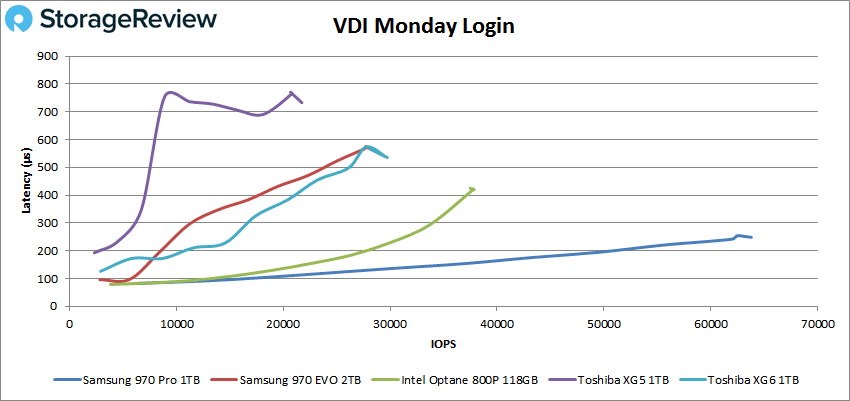
In our last test, VDI Monday Login, the XG6 showed a peak performance of 29,734 IOPS and a latency of 535.3μs.
Conclusion
The Toshiba XG6 is a single-sided NVMe M.2 SSD designed for client PCs, high-performance mobile devices, gaming and embedded applications. While the XG5 was the first Toshiba drive to leverage the company’s 64-layer BiCS 3D flash memory, the XG6 is the market’s first SSD built on the new 96-layer BiCS 3D flash memory. And like its predecessor, the XG6 also made good use of its new flash technology by making an impact on our performance charts.
This, however, came as no surprise, as its predecessor was impressive performer as well. In the Houdini test the drive posted 2,917 seconds, placing right in the middle of the pack. In the SQL Server test, the Toshiba drive posted 3,157.2 TPS and an average latency of just 8ms, placing among the leaders. Our VDI workload analyses showed the same solid performance results. It was able to hit 4K peaks of 366,208 IOPS read though writes were fairly poor with 94,516 IOPS. In addition, 64K results hit 1,898MB/s read and 590MB/s write. In our VDI tests the drive hit 107,390 IOPS boot, 31,183 IOPS initial login, and 29,734 IOPS Monday login
Overall, the Toshiba XG6 is an impressive drive and showed noticeable improvements over the XG5, an SSD we really liked. Like its predecessor, the XG6 gives OEMs an even more viable alternative for those who a good combination of speedy performance, battery efficiency and cost.


 Amazon