
 The Virident FlashMAX II is a half-height, half-length PCIe application accelerator (AA) that's available with MLC flash media. The FlashMAX II is available in capacities up to 2.2TB, making it the largest available AA in this form factor. As with any product in this class however, density may be nice but ultimately performance is a substantial driver of adoption. The FlashMAX II offers mixed 4K IOPS (75% read, 25% write) of up to 200,000, along with 325,000 4K read IOPS.
The Virident FlashMAX II is a half-height, half-length PCIe application accelerator (AA) that's available with MLC flash media. The FlashMAX II is available in capacities up to 2.2TB, making it the largest available AA in this form factor. As with any product in this class however, density may be nice but ultimately performance is a substantial driver of adoption. The FlashMAX II offers mixed 4K IOPS (75% read, 25% write) of up to 200,000, along with 325,000 4K read IOPS.
Like other application accelerators, the FlashMAX II is focused on the datacenter space, where mission critical applications demand, and can take advantage of, a high-performance flash tier either as primary storage or as a large cache in front of a spindle tier. Virident's architecture is ideally designed for such use, leveraging a purpose-built interface and reliance on the host system CPUs for the high-level control logic. This is similar to the high performing application accelerators from Fusion-io and markedly divergent from the PCIe storage players like Intel, LSI, Micron and OCZ who instead rely on ASIC controllers and/or RAID together several smaller SSDs onto a single PCIe PCB.
While the FlashMAX II may look like other drives, after some architectural similarities, Virident differentiates on the software side. Primary amongst these technologies is Virident Flash-management with Adaptive Scheduling (vFAS). The primary duty of vFAS is to present the flash media as a block device, without having to use additional storage protocols, controllers or interconnects. While the applications that access the FlashMAX II see the flash as storage, vFAS works behind the scenes to manage the flash in a 7+1 RAID configuration, which protects against individual NAND die failures. vFAS is also what handles additional optimizations like wear leveling, garbage collection, data path protection, ECC and the like. This efficiency in design and the ability to leverage the host CPU is a large driver behind the low quoted access latencies for the FlashMAX II of under 20µs.
The Virident FlashMAX II in MLC ships in a single module 550GB and 1.1TB capacity, and as a dual module configuration in 1.1TB and 2.2TB capacities. The drives carry endurance figures of 10PB written, 16PB and 33PB respectively, and a three year warranty. Our review model is the 2.2TB drive.
Virident FlashMAX II Specifications
- Capacities
- 550GB (Single)
- Sequential Read: 1,600 MB/s (64KB)
- Sequential Write: 540 MB/s (64KB)
- Random Read: 175,000 IOPS (4KB)
- Random Write: 48,000 IOPS (4KB, steady state)
- 1,100GB (Single)
- Sequential Read: 1,600 MB/s (64KB)
- Sequential Write: 540 MB/s (64KB)
- Random Read: 175,000 IOPS (4KB)
- Random Write: 48,000 IOPS (4KB, steady state)
- 1,100GB (Dual)
- Sequential Read: 2,700 MB/s (64KB)
- Sequential Write: 1,000 MB/s (64KB)
- Random Read: 350,000 IOPS (4KB)
- Random Write: 103,000 IOPS (4KB, steady state)
- 2,200GB (Dual)
- Sequential Read: 2,700 MB/s (64KB)
- Sequential Write: 1,000 MB/s (64KB)
- Random Read: 350,000 IOPS (4KB)
- Random Write: 103,000 IOPS (4KB, steady state)
- 550GB (Single)
- 20nm Intel NAND Flash Memory Multi-Level Cell (MLC)
- Read Latency: < 76-78μs (512b)
- Write Latency: < 16-18μs (512b)
- Interface: PCI Express 2.0 x8
- Form Factor: HHHL
- Lifetime Endurance (550GB / 1,100GB (single and dual) / 2,200GB): 10PB, 16PB, and 33PB
- Operating Temperature: 0°C to 45°C with 200 LFM (linear feet per minute) airflow
- OS Compatibility
- Microsoft: Windows Server 2008 R2 SP1 and Windows 7 SP1
- Linux: RHEL 5/6, SLES 10/11, CentOS 5/6, Oracle EL 5/6, Debian 4/5/6, Ubuntu 8/9/10/11/12, Fedora Core 12/13/14/15/16, OpenSUSE 11
- VMWare: ESXi 5.x
- Warranty: 3 years
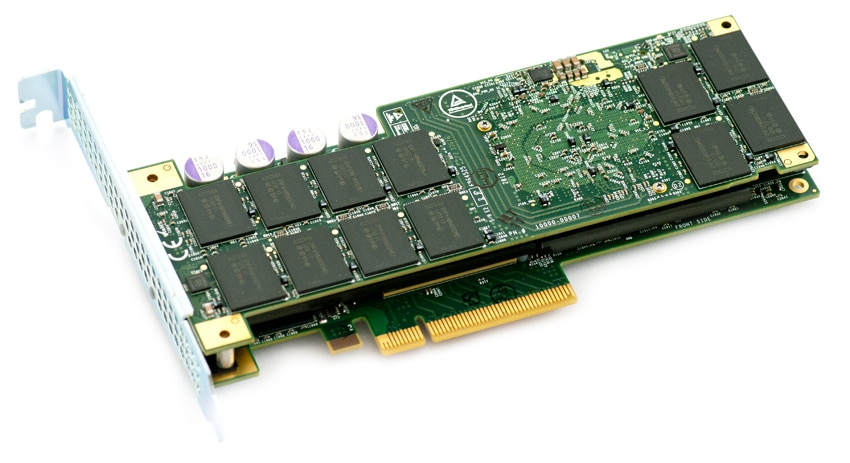
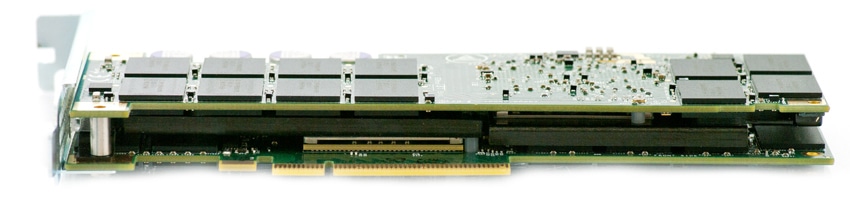
Design and Build
The Virident FlashMAX II is a half-height half-length PCIe 2.0 Application Accelerator with a x8 connection. Its super-compact design fits 3TB of NAND in a space which competitors can fit half that or less. The alternative way of fitting that much NAND is going to either a full-height half-length card, or full-height full-length card; which gets excluded from low-profile slots found in densely-packed servers. Some competitors that require larger designs include Fusion-io with utilizes a FHHL form-factor for their ioDrive2 Duos and OCZ which uses a FHFL form-factor for the Z-Drive R4.
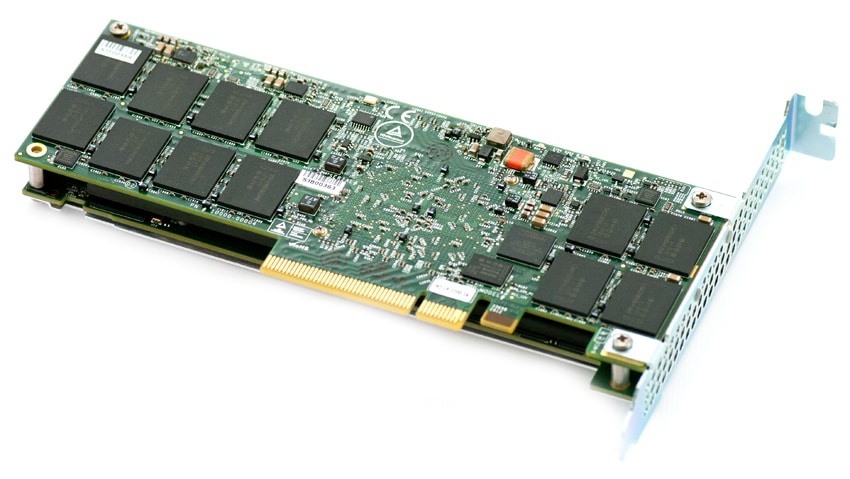
The FlashMAX II uses a unique design with two FPGA controllers, similar to Fusion's ioDrive and ioDrive2 Duo cards, but different in that the device appears as a single LUN instead of two. This has the advantage of skipping Windows or Linux software RAID to present the card to the system as one large volume, making it easier for some users to manage. Another advantage is the internal link allows the Virident management software to globally manage NAND wear leveling and other reliability features, which isn't possible on the ioDrive2 Duo between individual cards. Virident also gives you the option of formatting the card in a way that presents the FlashMAX II as two devices, although in our review we measured performance of it configured in one large pool.
The Virident, as well as the Fusion-io, are set apart from other manufacturers in the PCIe Application Accelerator market in the way they present their storage to the host system. The traditional design forces data to flow through software or hardware RAID, SATA/SAS drivers, and then most likely a third-party flash controller before finally reaching the NAND. The Virident and Fusion method take a different approach, allowing the host to act as the device controller through a native software stack, interfacing with the NAND in a single step. This has the benefit of in theory allowing lower latency by skipping all of the overhead steps, but also the downside of introducing system overhead into the equation as the host has to manage the flash itself. By putting the system closer to the NAND, Virident also forces the system to manage it, whereas others with hardware flash controllers off-load those activities.
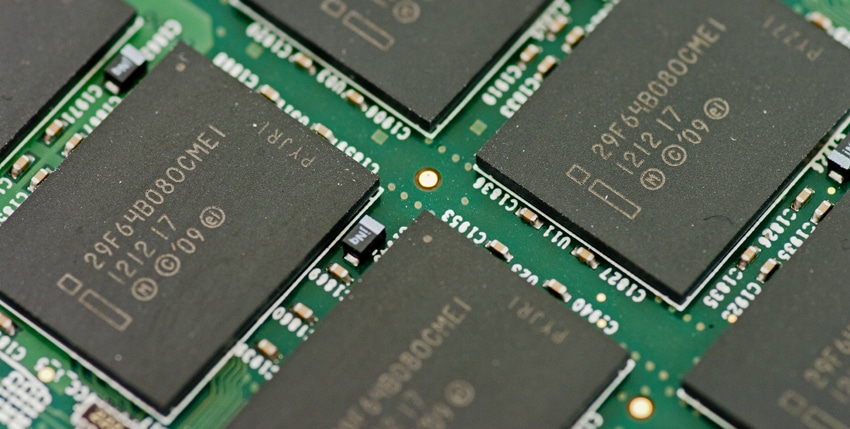
Virident uses 2xnm 2-bit Intel MLC NAND on the FlashMAX II, although the architecture supports different NAND manufacturers and densities with firmware updates. The raw capacity of the 2.2TB FlashMAX II is 3,072GB, with 2,222GB usable in stock configuration or 1,847GB in high-performance mode. That works out to an over-provisioning level of 38% stock and increases to 66.3% in high-performance mode.
Management Software
Virident includes both GUI and console-based management software with the FlashMAX II. In terms of ease of use and features, the FlashMAX II Manager is on par with the Micron RealSSD Manager included with the P320h, minus the real-time performance information Micron can stream from the card. Through the management software, users can update the FlashMAX II firmware, view endurance information, format the card into different performance modes, split the card into two volumes, as well as enable a beacon to quickly identify the card (and server) in an environment with multiple devices.
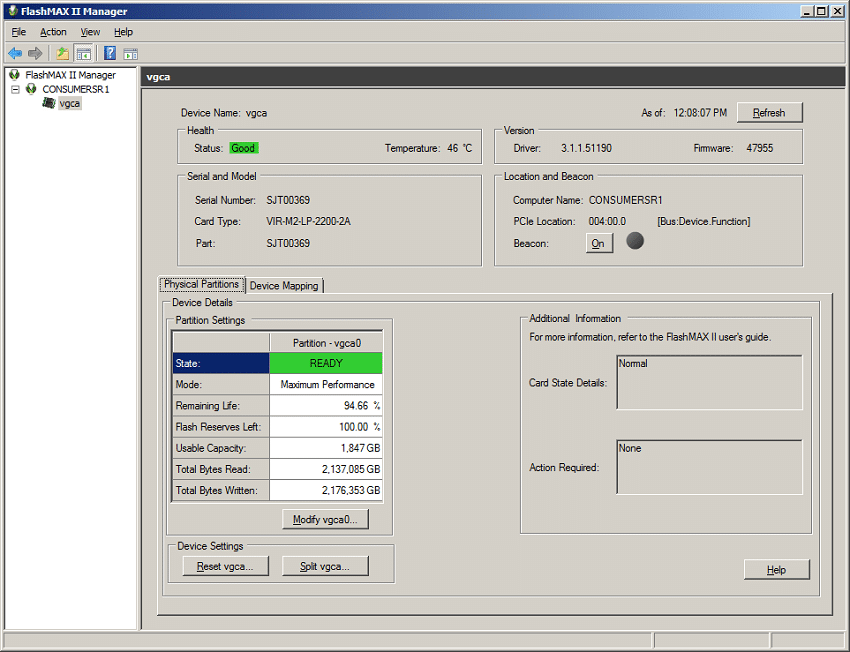
In terms of items we like to see listed through management software, Virident hits on most points, although lacks on providing in-depth health information, real-time performance data, or detailed stats on the devices electrical behavior. This still puts them ahead of others in the PCIe space including Intel or LSI with very minimalistic console-only information, or OCZ with provides their OCZ Toolbox to erase the card, update software, or poll SMART information. The front-runner in management and monitoring capabilities by far is Fusion-io, which offers an extensive amount of information through a very polished interface in their ioSphere package.
Testing Background and Comparables
All PCIe Application Accelerators compared in this review are tested on our second-generation enterprise testing platform consisting of an Intel Romley-based Lenovo ThinkServer RD630. This new platform is configured with both Windows Server 2008 R2 SP1 as well as Linux CentOS 6.3 to allow us to effectively test the performance of different AAs in the various environments their drivers support. Each operating system is optimized for highest performance, including having the Windows power profile set to high-performance as well as cpuspeed disabled in CentOS 6.3 to lock the processor at its highest clock speed. For synthetic benchmarks, we utilize FIO version 2.0.10 for Linux and version 2.0.12.2 for Windows, with the same test parameters used in each OS where permitted.
StorageReview Lenovo ThinkServer RD630 Configuration:
- 2 x Intel Xeon E5-2620 (2.0GHz, 15MB Cache, 6-cores)
- Intel C602 Chipset
- Memory – 16GB (2 x 8GB) 1333Mhz DDR3 Registered RDIMMs
- Windows Server 2008 R2 SP1 64-bit, Windows Server 2012 Standard, CentOS 6.3 64-Bit
- 100GB Micron RealSSD P400e Boot SSD
- LSI 9211-4i SAS/SATA 6.0Gb/s HBA (For boot SSDs)
- LSI 9207-8i SAS/SATA 6.0Gb/s HBA (For benchmarking SSDs or HDDs)
When it came to choosing comparables for this review, we chose the newest top-performing SLC Application Accelerators. These were picked based on performance characteristics of each product, as well as price-range. Where applicable, we include both stock and high-performance benchmark results if the manufacturer includes that level of configuration through software to target different product use cases. In the case of the FlashMAX II, we include both full capacity and high-performance benchmarks.
200GB LSI Nytro WarpDrive WLP4-200
- Released: 1H2012
- NAND Type: SLC
- Controller: 4 x LSI SandForce SF-2500 through LSI SAS2008 PCIe to SAS Bridge
- Device Visibility: Fixed Hardware RAID0
- LSI Windows: 2.10.51.0
- LSI Linux: Native CentOS 6.3 driver
- Preconditioning Time: 6 hours
700GB Micron RealSSD P320h
- Released: 2H2011
- NAND Type: SLC
- Controller: 1 x Proprietary ASIC
- Device Visibility: Single Device
- Micron Windows: 8.01.4471.00
- Micron Linux: 2.4.2-1
- Preconditioning Time: 6 hours
2.2TB Virident FlashMAX II
- Released: 2H2012
- NAND Type: MLC
- Controller: 2 x Proprietary FPGA
- Device Visibility: Single or Dual Device depending on formatting
- Virident Windows: Version 3.0
- Virident Linux: Version 3.0
- Preconditioning Time: 12 hours
Enterprise Synthetic Workload Analysis
The way we look at PCIe storage solutions dives deeper than just looking at traditional burst or steady-state performance. When looking at averaged performance over a long period of time, you lose sight of the details behind how the device performs over that entire period. Since flash performance varies greatly as time goes on, our benchmarking process analyzes the performance in areas including total throughput, average latency, peak latency, and standard deviation over the entire preconditioning phase of each device. With high-end enterprise products, latency is often more important than throughput. For this reason we go to great lengths to show the full performance characteristics of each device we put through our Enterprise Test Lab.
We also include performance comparisons to show how each device performs under a different driver set across both Windows and Linux operating systems. For Windows, we use the latest drivers at the time of original review, which each device is then tested under a 64-bit Windows Server 2008 R2 environment. For Linux, we use 64-bit CentOS 6.3 environment, which each Enterprise PCIe Application Accelerator supports. Our main goal with this testing is to show how OS performance differs, since having an operating system listed as compatible on a product sheet doesn't always mean the performance across them is equal.
Flash performance varies throughout the preconditioning phase of each storage device. With different designs and varying capacities, our preconditioning process lasts for either 6 hours or 12 hours depending on the length of time needed to reach steady-state behavior. Our main goal is to ensure each drive is fully into steady-state mode by the time we begin our primary tests. In total, each of the comparable devices are secure erased using the vendor's tools, preconditioned into steady-state with the same workload the device will be tested with under a heavy load of 16 threads with an outstanding queue of 16 per thread, and then tested in set intervals in multiple thread/queue depth profiles to show performance under both light and heavy usage.
Attributes Monitored In Preconditioning and Primary Steady-State Tests:
- Throughput (Read+Write IOPS Aggregate)
- Average Latency (Read+Write Latency Averaged Together)
- Max Latency (Peak Read or Write Latency)
- Latency Standard Deviation (Read+Write Standard Deviation Averaged Together)
Our Enterprise Synthetic Workload Analysis includes four profiles based on real-world tasks. These profiles have been developed to make it easier to compare to our past benchmarks as well as widely-published values such as max 4K read and write speed and 8K 70/30, which is commonly used for enterprise drives. We also included two legacy mixed workloads, the traditional File Server and Webserver, each offering a wide mix of transfer sizes.
- 4K
- 100% Read or 100% Write
- 100% 4K
- 8K 70/30
- 70% Read, 30% Write
- 100% 8K
- File Server
- 80% Read, 20% Write
- 10% 512b, 5% 1k, 5% 2k, 60% 4k, 2% 8k, 4% 16k, 4% 32k, 10% 64k
- Webserver
- 100% Read
- 22% 512b, 15% 1k, 8% 2k, 23% 4k, 15% 8k, 2% 16k, 6% 32k, 7% 64k, 1% 128k, 1% 512k
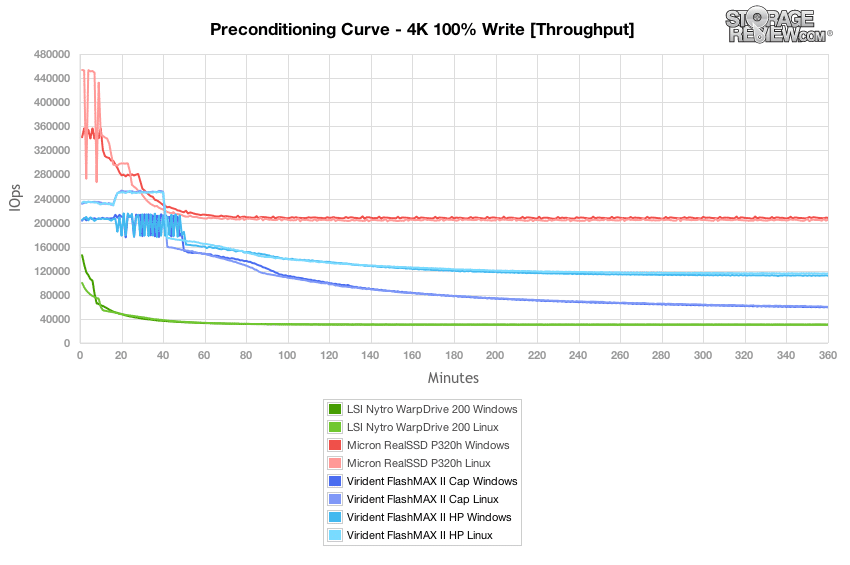
In our first workload we measure the performance of a 4K 100% random write saturation test with a load of 16T/16Q (effective queue depth of 256). Virident lists the sustained performance of the Virident FlashMAX II in this type of condition at 103,000 IOPS for our 2.2TB capacity. In stock configuration the FlashMAX II offered burst speeds as high as 210,000 IOPS, before leveling off to a steady-state speed of roughly 54,000 IOPS. When configured in high-performance mode the FlashMAX II, we saw burst speeds as high as 250,000 IOPS and steady-state performance of about 114,000 IOPS.
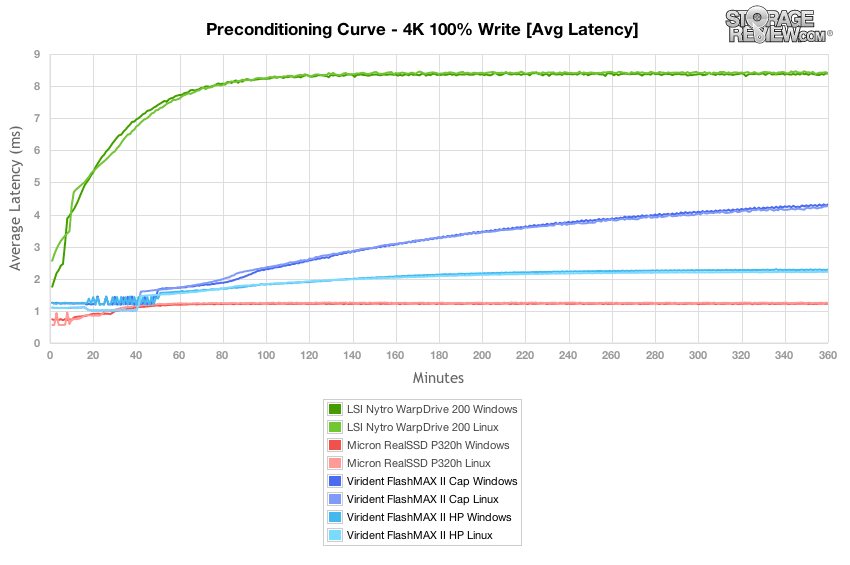
With a heavy 16T/16Q 100% 4K write-saturation load, we measured average latency of the stock-configured FlashMAX II nearing 4.5-4.7ms while the high-performance configuration leveled off between 2.2-2.3ms.
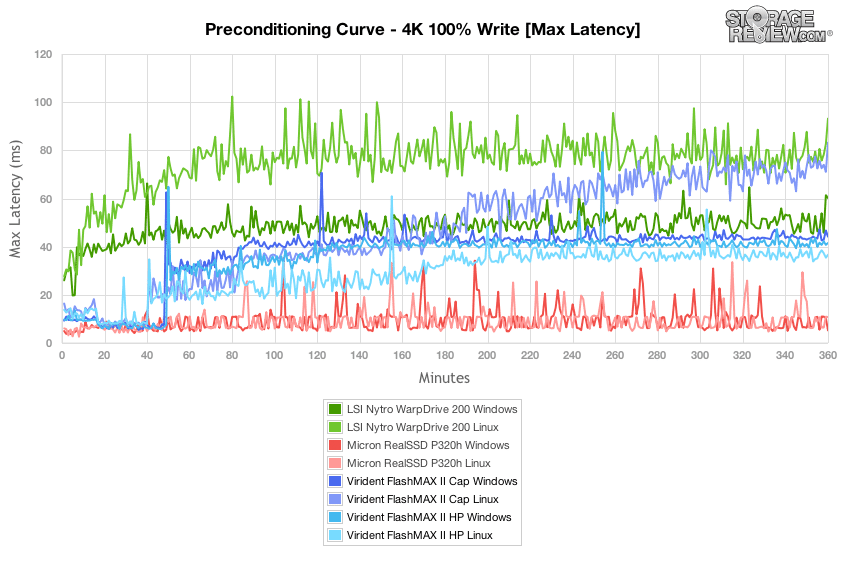
Comparing the max latency of the MLC-based Virident FlashMAX II against the SLC-based Micron P320h and Nytro WarpDrive in our 100% random 4K write preconditioning test, it slotted right in-between. Peak response times as the FlashMAX II neared steady-state measured between 30-50ms, expect for stock-capacity Linux which increased to about 80ms.
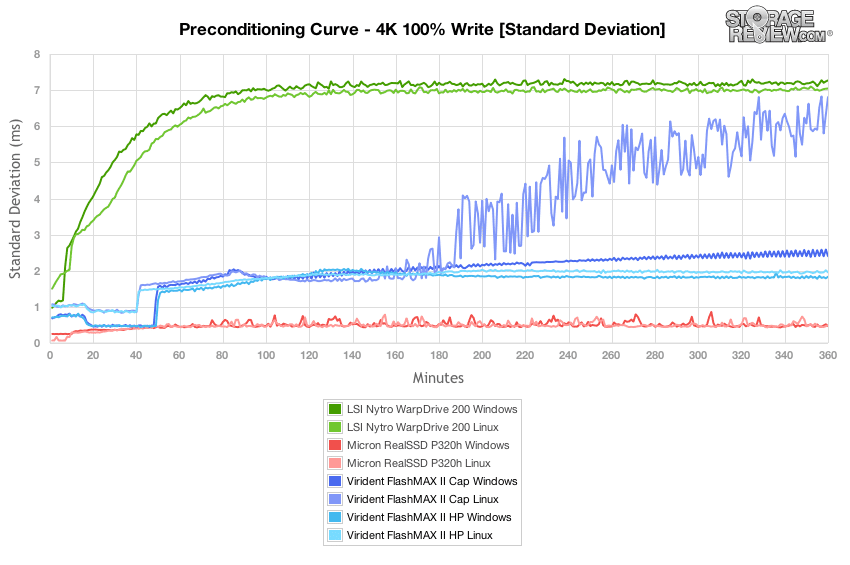
Comparing latency consistency, the FlashMAX II definitely stayed in the same ball-park as the SLC-comparables; just trailing the Micron P320h which led this pack. In high-performance configurations both Linux and Windows offered similar performance, while in stock capacity, the standard deviation of the Linux stock-capacity configuration increased a good deal as the drive neared steady-state.
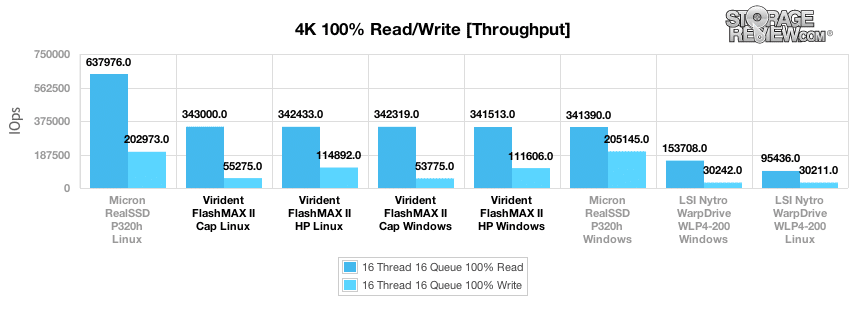
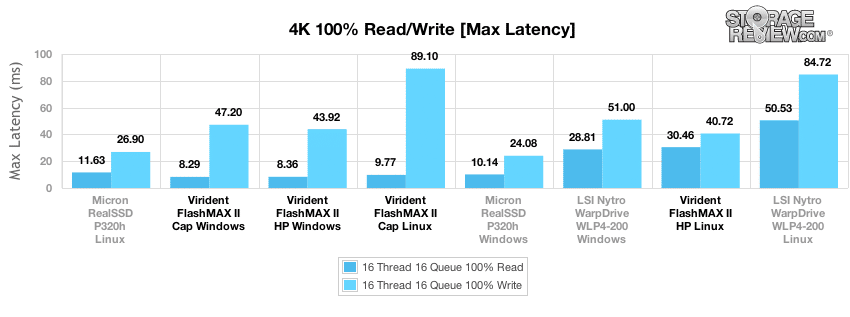
After finishing the preconditioning stage of our 100% 4K write test, we took longer samples to show the average performance of each device in steady-state. The Virident FlashMAX II came in right near the top of the pack, with 100% random 4K read speed measuring between 341.5-343K IOPS across all configurations. Looking at 100% 4K write performance, in stock capacity performance measured 53.7-55.5K IOPS while in high-performance mode it measured 111.6-114.9K IOPS.
With a heavy 16T/16Q load, average latency of the FlashMAX II measured 0.744-0.747ms with 100% 4K read transfers, and 2.224-4.756ms with 100% 4K write transfers depending on configuration.
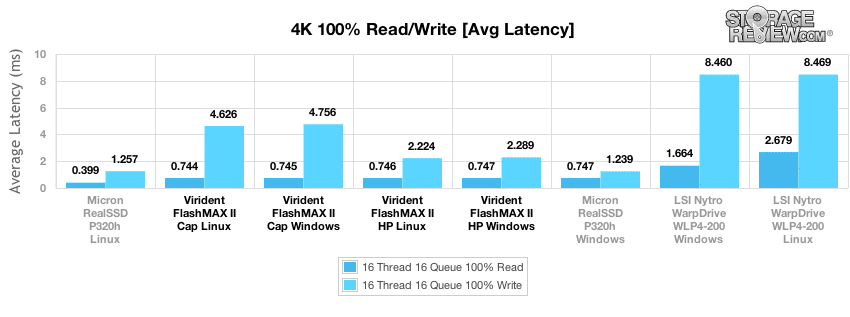
Comparing max latency across Linux and Windows in both configurations, we saw lower read response times in Windows and a lower peak write response time for 4K write latency in HP mode as well as Windows.
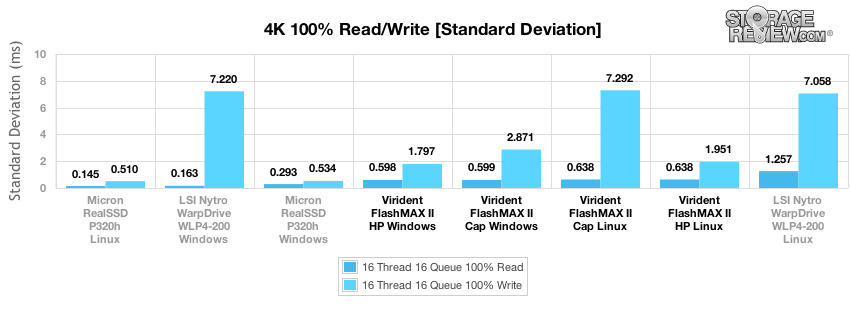
Looking at latency consistency across Windows and Linux, the FlashMAX II had lower latency standard deviation in Windows in both stock and high-performance modes. The biggest difference came when comparing write standard deviation, where it saw a large spike in stock mode in Linux.
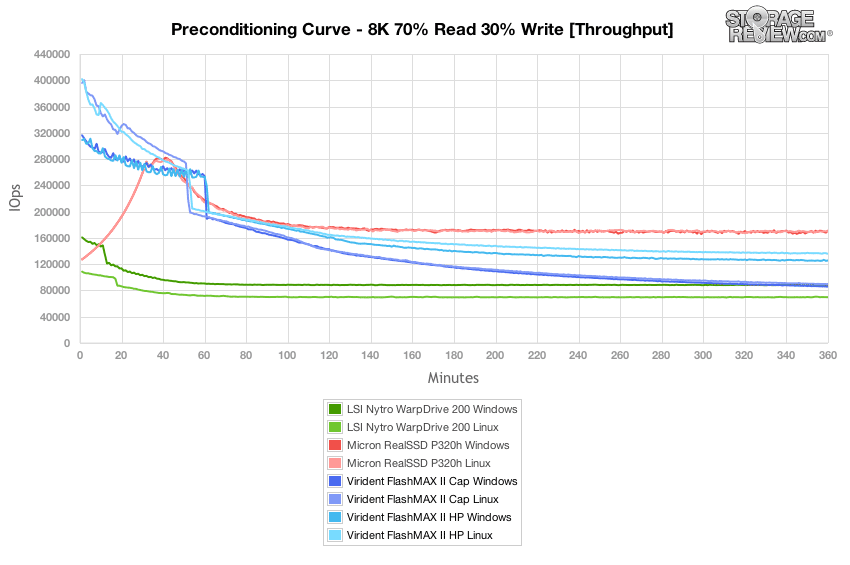
Our next test switches to an 8K 70/30 mixed workload where the Virident FlashMAX II offers the highest burst transfer speeds in the group. In a Linux environment the FlashMAX II had burst speeds measuring as high as 400,000 IOPS, while in Windows burst speeds measured up to 310,000 IOPS. Comparing steady-state performance, in stock capacity mode the drive measured 75-80K IOPS in Windows and Linux respectively. In high-performance mode steady-state speeds measured 123K in Windows and 134K in Linux.
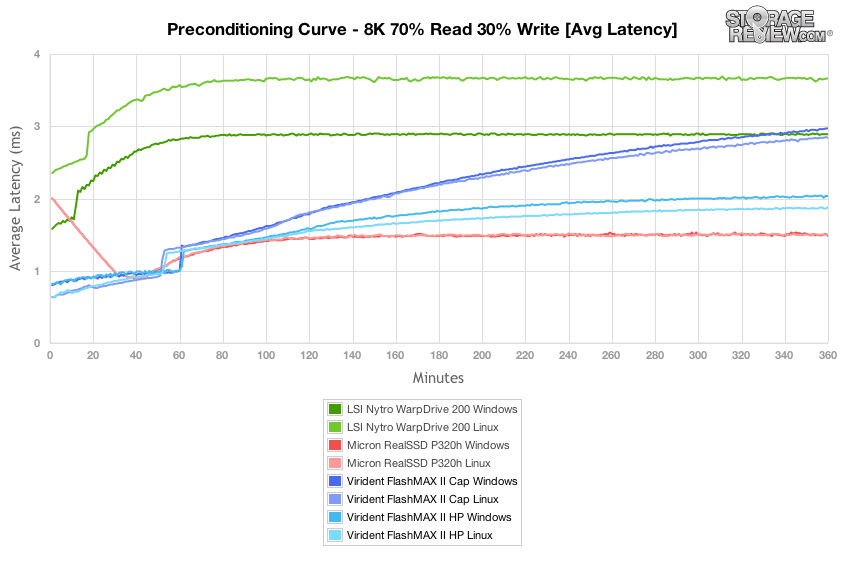
Looking at average latency in our 8K 70/30 preconditioning workload with a heavy workload of 16T/16Q, the Virident FlashMAX II had burst average latency measuring between 0.64ms to 0.80ms. Transitioning to steady-state performance, the FlashMAX II leveled off to 1.89ms to 3.41ms.
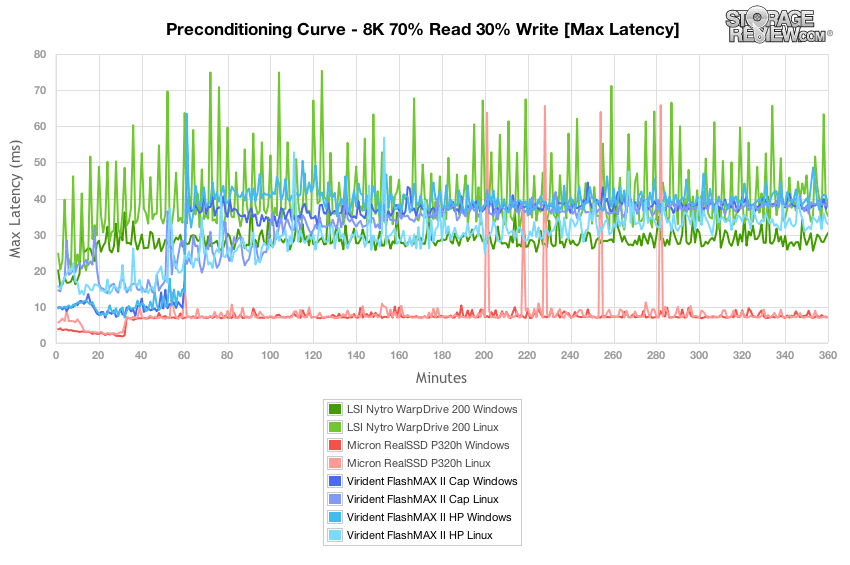
Looking at peak response times in our 8K 70/30 preconditioning stage, the Virident FlashMAX II had max latency that measured between 10-25ms in burst mode that increased to 30-45ms.
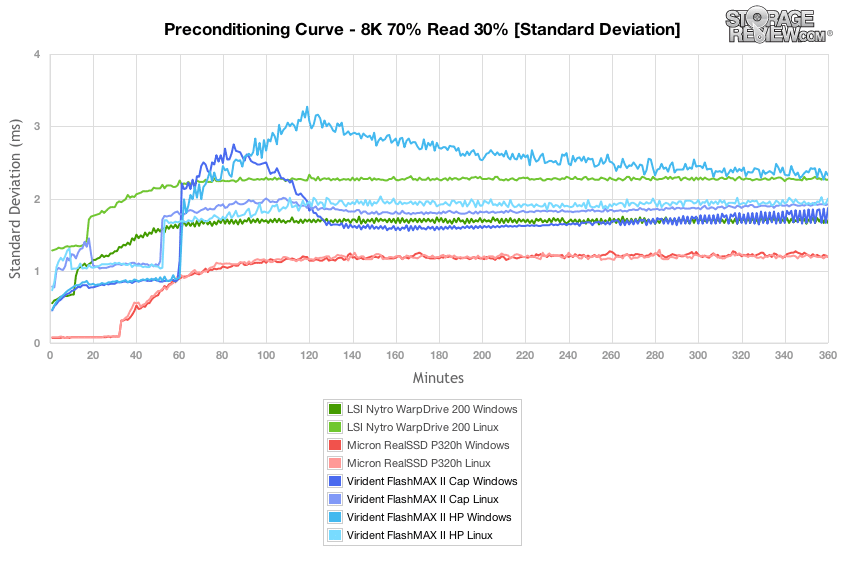
Comparing latency standard deviation between the MLC-based Virident FlashMAX II and the SLC-based 200GB Nytro WarpDrive to 700GB Micron P320h, the FlashMAX II slotted in towards the middle with the Linux-driver offering the most consistent performance.
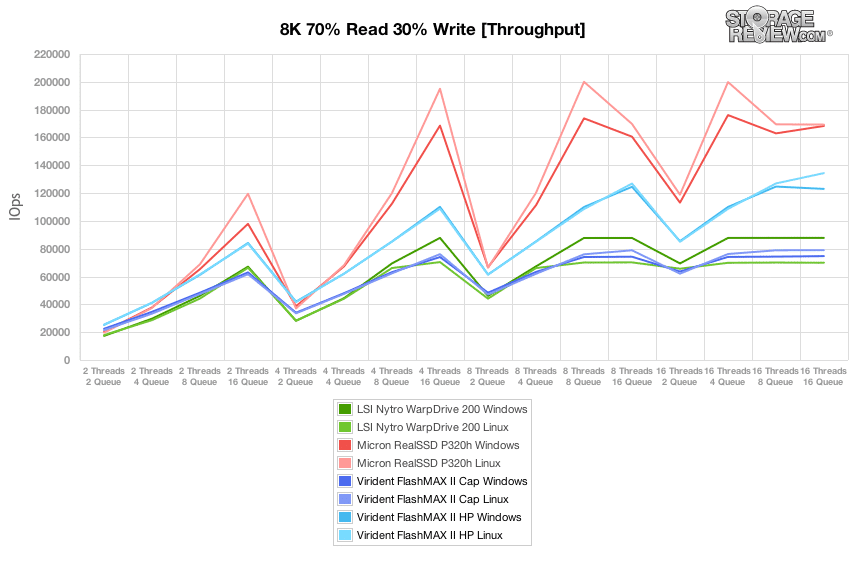
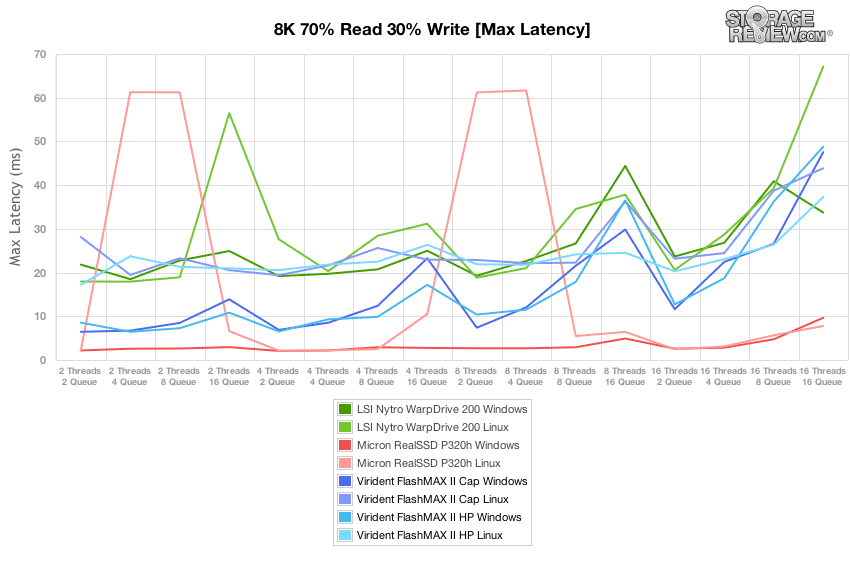
Compared to the fixed 16 thread, 16 queue max workload we performed in the 100% 4K write test, our mixed workload profiles scale the performance across a wide range of thread/queue combinations. In these tests we span our workload intensity from 2 threads and 2 queue up to 16 threads and 16 queue. In our expanded 8K 70/30 test, the Virident FlashMAX II offered the highest 2T/2Q and 2T/4Q performance in the group, measuring 25K and 41K IOPS for the HP Linux environment, compared to the Micron P320h which measured 20K and 37K in Linux. At its peak, the FlashMAX II measured 134K IOPS in Linux HP mode and 79K IOPS in stock capacity mode.
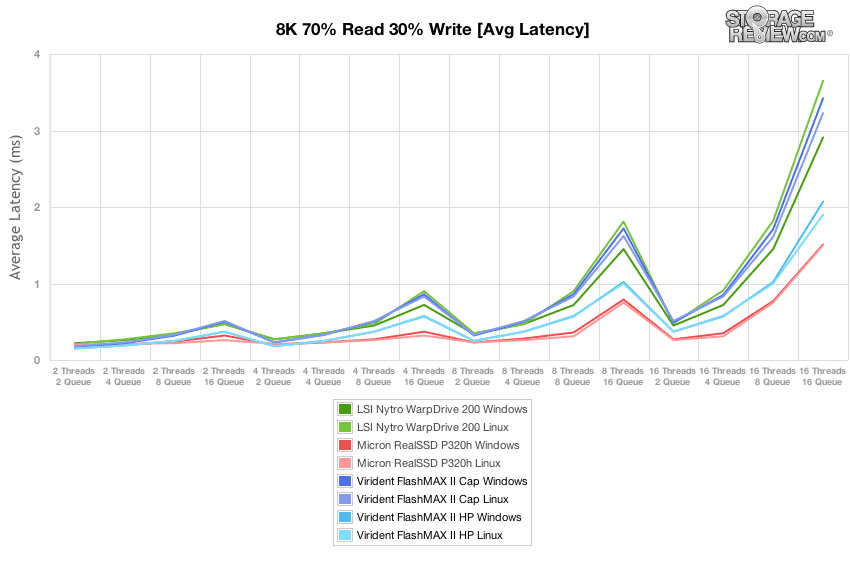
In our scaled 8K 70/30 average latency test, the FlashMAX II measured between 0.15ms in Linux HP at 2T/2Q and 1.9ms in Linux HP at 16T/16Q in steady-state mode. By comparison in stock capacity formatting, the drive measured 0.18ms at 2T/2Q and 3.23ms at 16T/16Q in steady-state mode.
The Virident FlashMAX II was very stable under load in both Linux and Windows in our 8K 70/30 test. Its peak response times measured between 7ms and 49ms from 2T/2Q to 16T/16Q with the drive having a slight edge with its Windows driver.
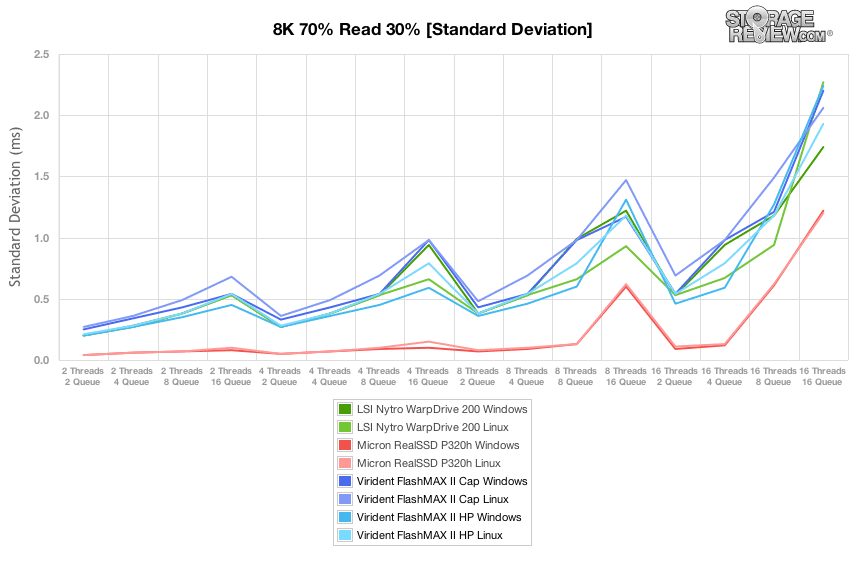
Comparing latency consistency in our 8K 70/30 test, the Virident FlashMAX II was roughly on-par with the SLC-based LSI Nytro WarpDrive, with the Micron P320h having a modest lead across the workloads.
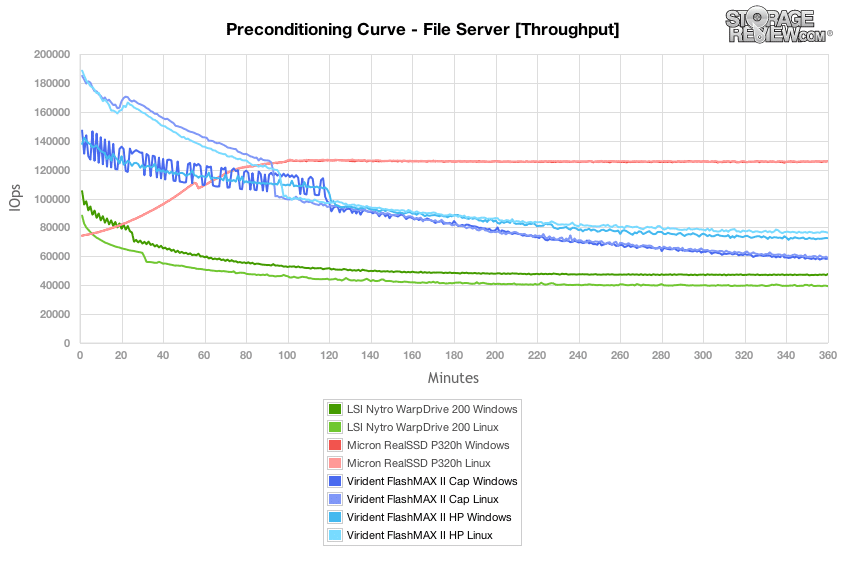
The File Server workload represents a larger transfer-size spectrum hitting each particular device, so instead of settling in for a static 4k or 8k workload, the drive must cope with requests ranging from 512b to 64K. In this workload as the Virident FlashMAX II has to start coping with a broader range of transfer sizes, the performance gap between the Windows and Linux driversets widens, with Linux taking a strong lead. In terms of performance compared to other PCIe AAs on the market, the FlashMAX II offered the highest burst speeds in both stock and high-performance formatting modes, which then leveled off to lower-middle of the pack in steady-state mode.
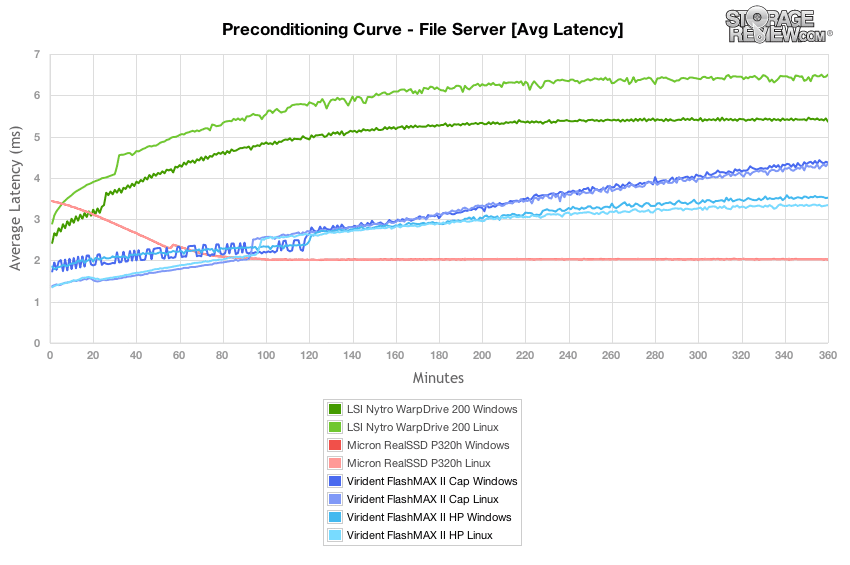
With a heavy 16T/16Q workload in our File Server preconditioning test, the Virident FlashMAX II starts with a burst latency of 1.5-1.8ms and then increases to 3.5-5.5ms average latency as the drive nears steady-state.
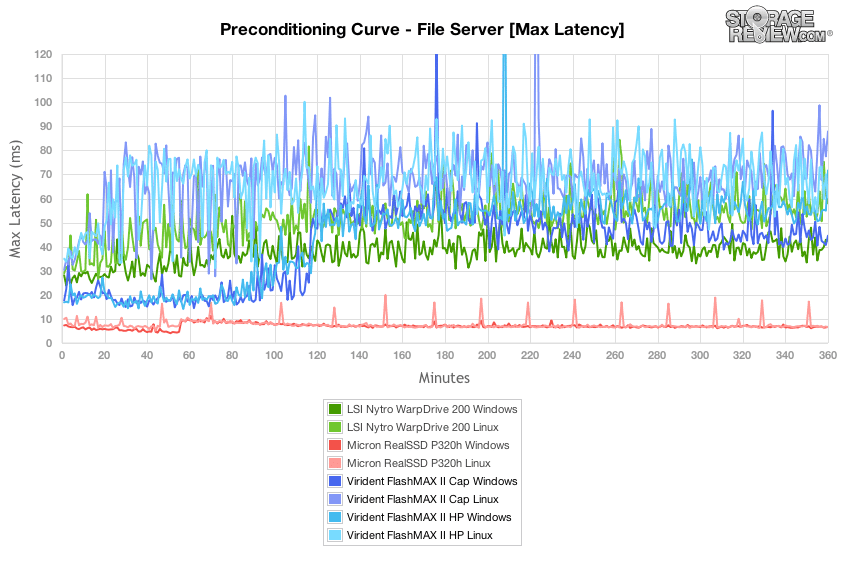
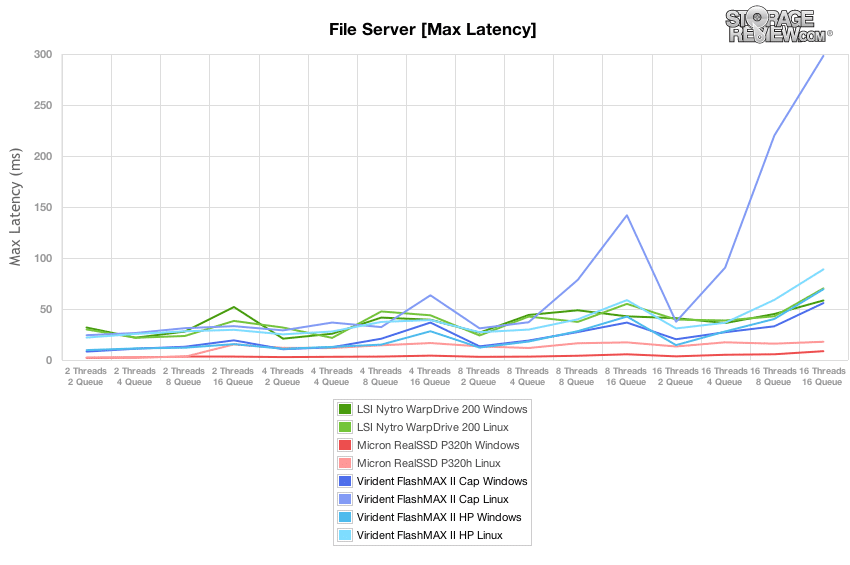
In the File Server workload with the wide spread in transfer sizes, the Virident FlashMAX II slips above the SLC-based PCIe Application Accelerators with peak response times ranging between 20-80ms in burst mode to 40-100ms as it nears steady-state.
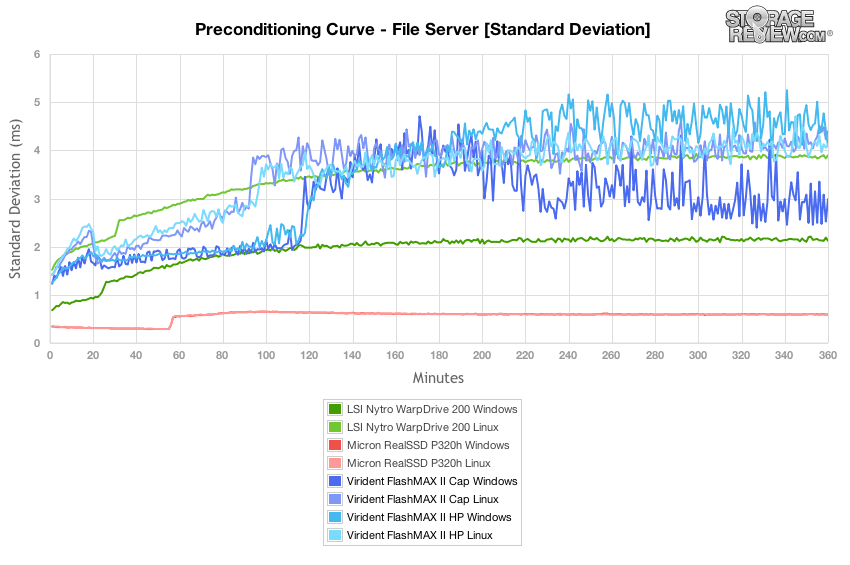
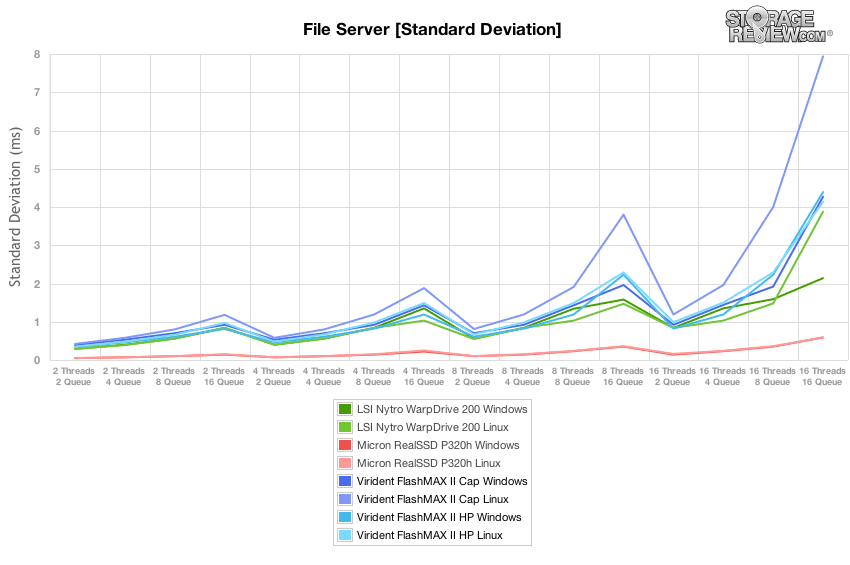
Comparing latency consistency in our File Server preconditioning process, the MLC-based Virident FlashMAX II trailed both of our SLC-comparables, although stayed fairly competitive against the LSI Nytro WarpDrive in terms of latency standard deviation.
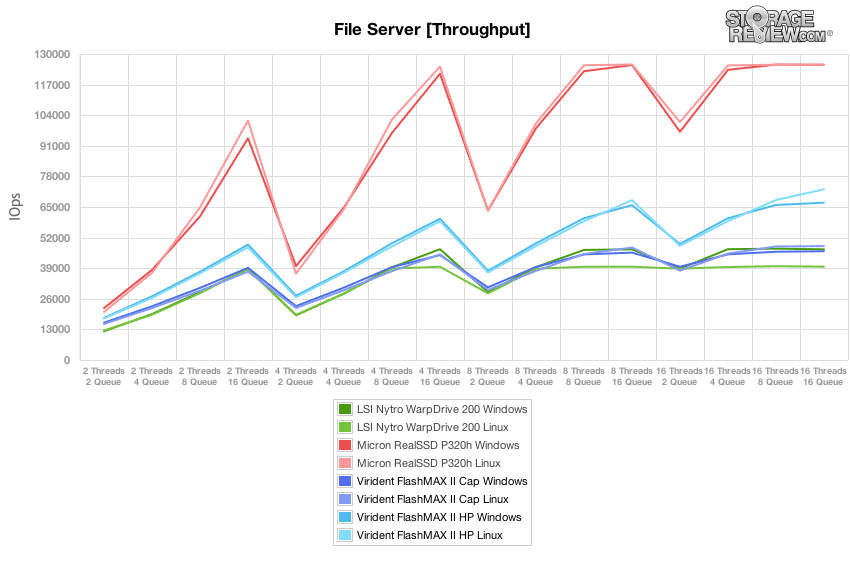
After the File Server preconditioning process had completed with a constant 16T/16Q load, we dropped into our main tests which measure performance at set levels between 2T/2Q and 16T/16Q. In our main File Server workload, the Virident FlashMAX II performed on par with the 200GB LSI Nytro WarpDrive in stock-formatting and slightly above in high-performance mode. The SLC-based Micron P320h offered the highest throughput in this test. At 16T/16Q the FlashMAX II measured 46-48K IOPS in stock mode and 66-72K IOPS in high-performance mode. This compared to the Micron P320h that peaked at 125K IOPS.
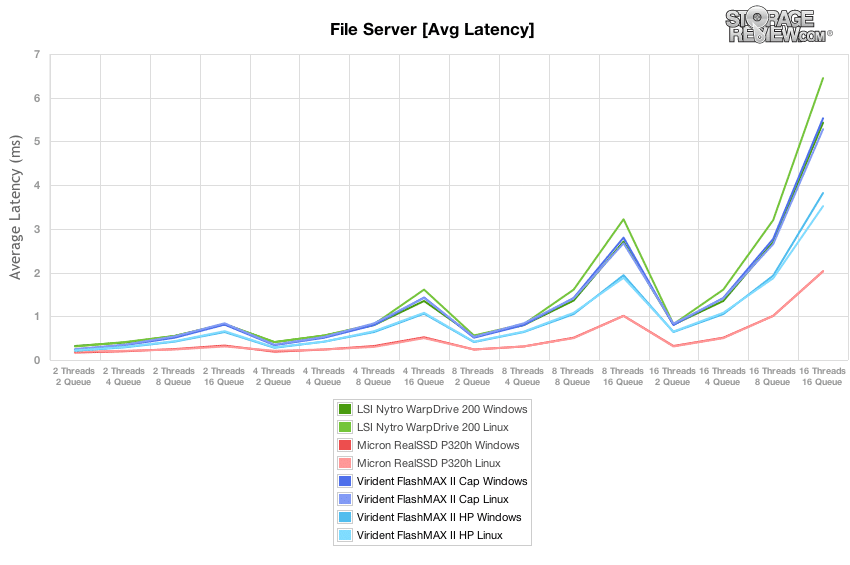
Average latency in our main File Server workload measured 0.21-0.25ms at 2T/2Q and increased to 3.52-5.53ms at 16T/16Q. The driver strength continued to be in a Linux environment versus Windows.
While throughput and average latency were better inside Linux with the FlashMAX II, max latency was better controlled in Windows. In full capacity formatting, the FlashMAX II in Linux had peak latency rise as high as 300ms under high load, whereas in Windows it stayed around 50ms.
Comparing latency consistency between each of the Application Accelerators, the FlashMAX II trailed behind the Micron P320h, although performed closely with the SLC 200GB Nytro WarpDrive.
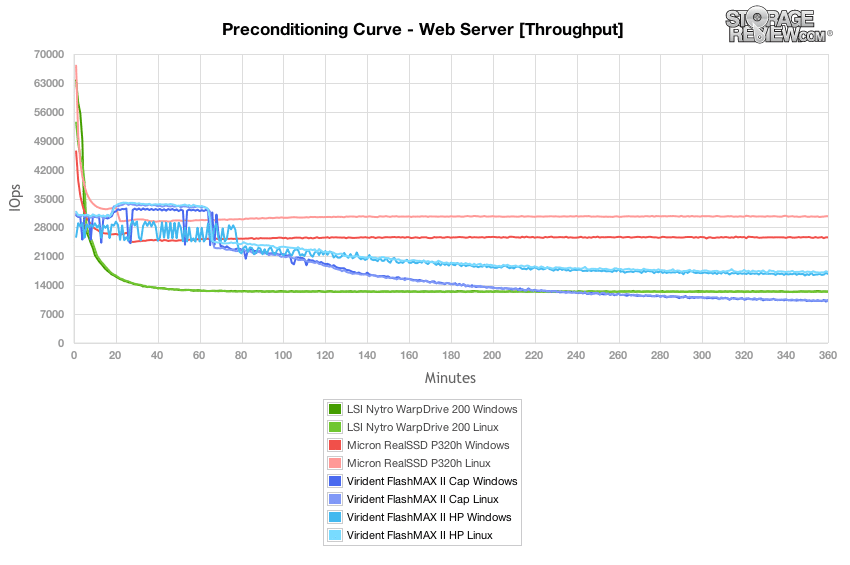
In our last synthetic workload covering a Web Server profile, which is traditionally a 100% read test, we apply 100% write activity to fully precondition each drive before our main tests. Under this stressful preconditioning test the FlashMAX II in stock formatting leveled off at 8,700 IOPS while in high-performance mode it maintained a speed of 16.2-17.2K IOPS.
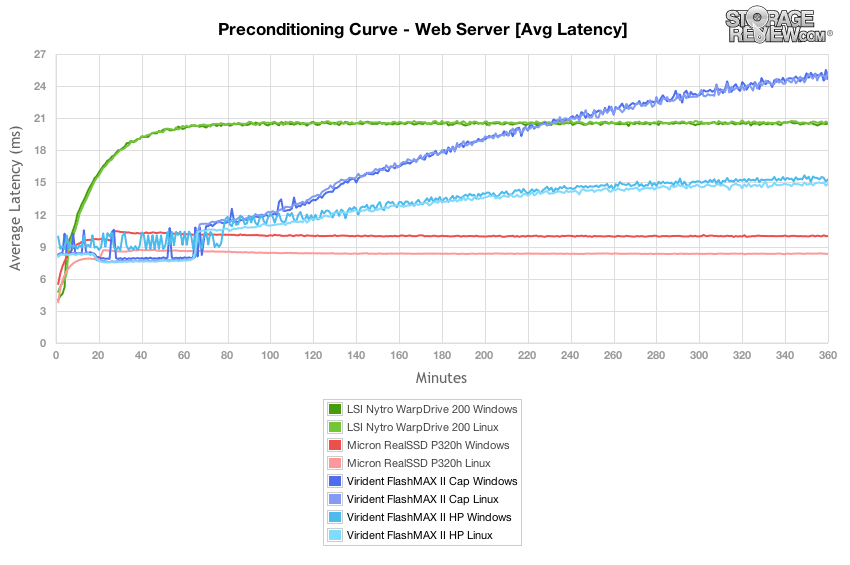
With a 100% write Web Server preconditioning workload at 16T/16Q, the FlashMAX II leveled off to about 28ms in stock mode and about 15ms in high-performance mode.
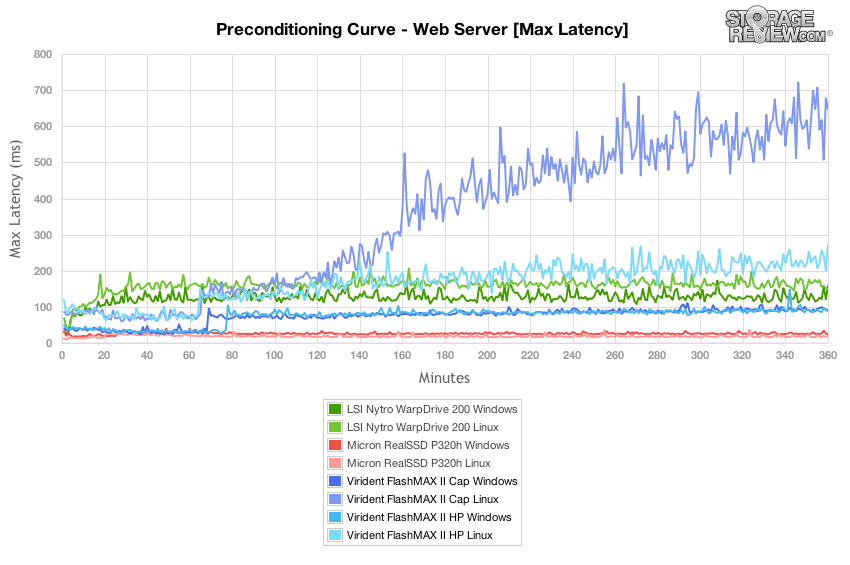
Comparing the peak response times in our Web Server preconditioning process, the FlashMAX II offered relatively low max latency in high-performance mode, although in stock formatting peak latency increased substantially in Linux.
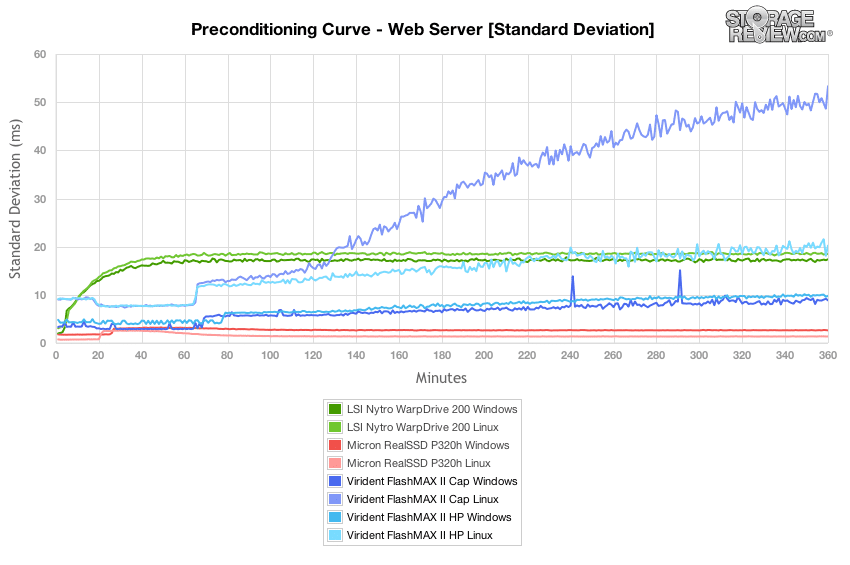
Comparing latency consistency in our Web Server preconditioning test, in stock formatting, latency standard deviation trailed both SLC-based AAs, while in high-performance mode performance stayed more in line with the SLC-based counterparts.
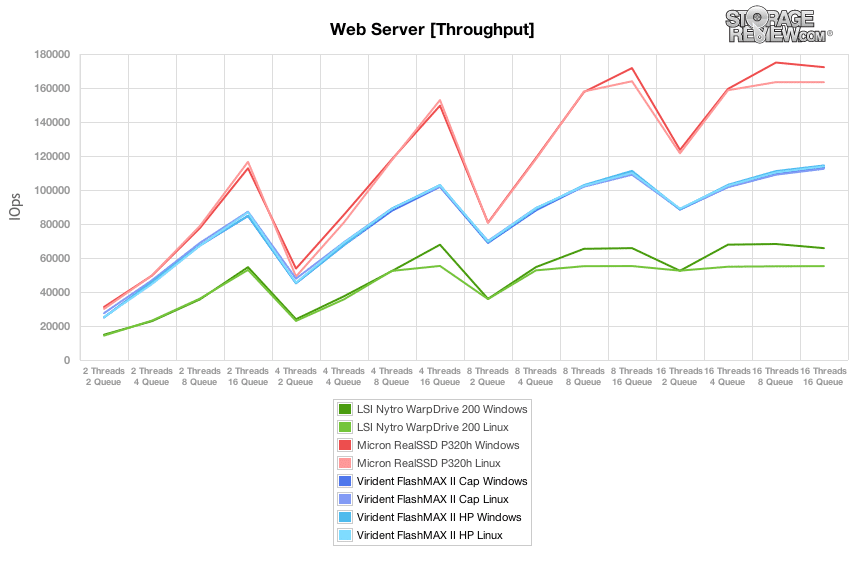
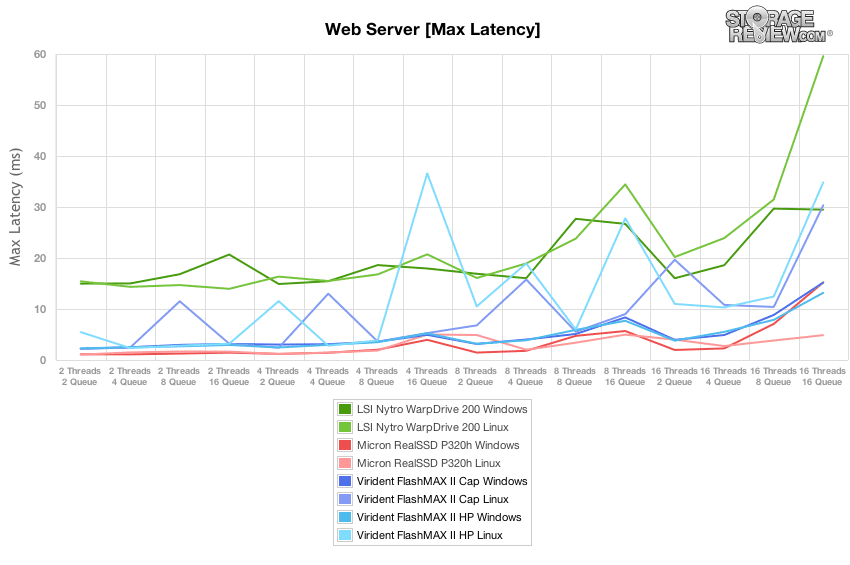
Switching to the main segment of our Web Server test with a 100% read profile, the Virident FlashMAX II had performance scaling from 25-27k IOPS at 2T/2Q which increased to a peak of 112-114k IOPS at 16T/16Q. This put it smack dab in the middle, trailing the Micron P320h, but performing higher than the 200GB SLC Nytro WarpDrive. Across all performance modes, the FlashMAX II offered near-identical performance, even across OS.
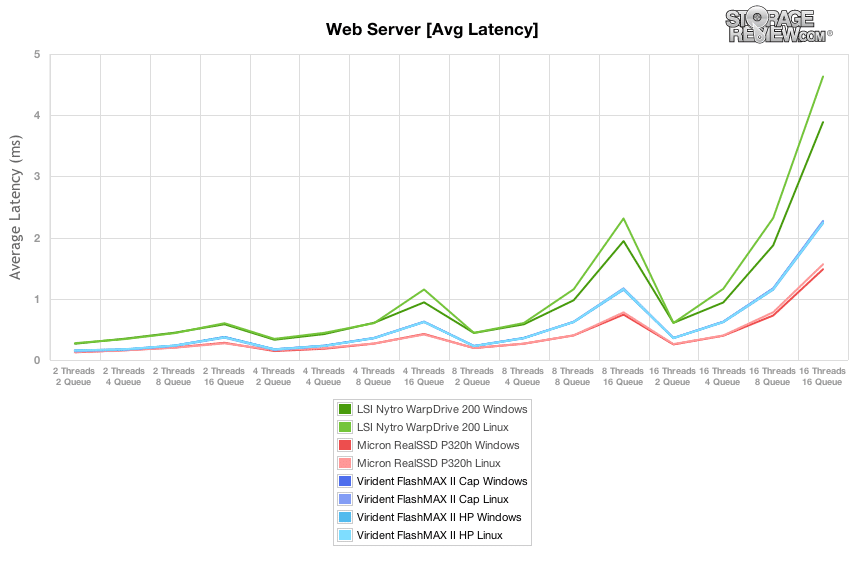
Average latency on the FlashMAX II scaled from 0.142-0.157ms at 2T/2Q which peaked at 2.235-2.274ms at 16T/16Q.
Comparing max latency between the FlashMAX II in Windows and Linux, it offered slightly lower peak response times at each workload in Windows. Overall its peak response times in our 100% read-only Web Server test ranged from 2-36ms.
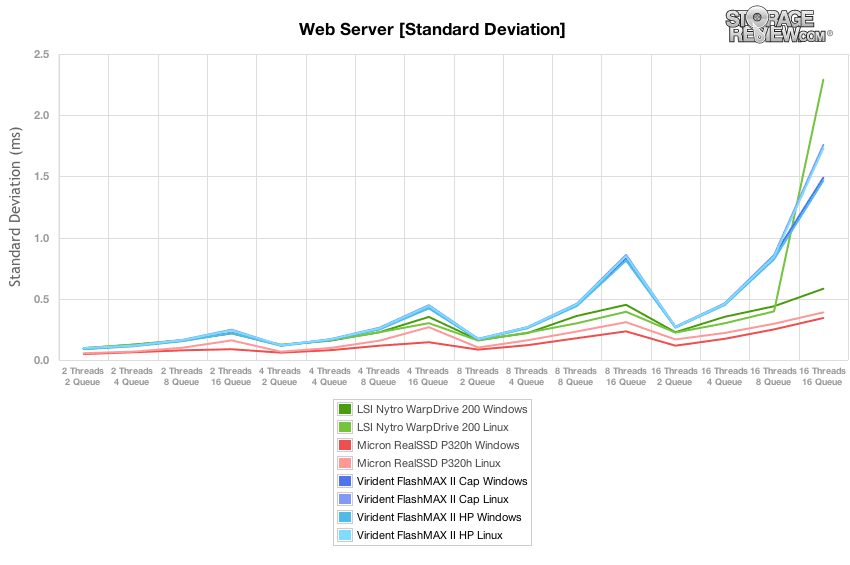
While the max latency was low overall, latency consistency of the FlashMAX II compared to the high-performance SLC-comparables had it with higher standard deviation, although not by much until the effective queue depth increased at or above 128.
Conclusion
The Virident FlashMAX II with MLC NAND provides the largest available capacity at 2.2TB in an application accelerator of this form factor, half-height half-length. The design is impressive both in its raw density but also in its architecture. With the high capacity card, Virident leverages dual FPGAs that present the NAND as a single pool directly to the software layer that runs on the host computer. The software, referred to as vFAS, uses the host CPU and system resources to manage access to and preservation of the drive's NAND pool. The simplicity of this approach has several benefits, largely highlighted by a more efficient data path that doesn't require several drives on the PCB to be combined via RAID nor does it require interface translation layers. The Virident approach is also somewhat novel in that it presents the drive as a single LUN, where Fusion-io who uses a similar drive architecture, presents as two drives that must be combined via RAID if a user desires a single volume. While some may argue that falling back on the CPU eats up needed resources, the net benefit is an application accelerator with very low latency, which is a trade-off many datacenters are quite content to make given the power of the current generation CPUs and the aggregate net benefit to application performance.
Comparing the management suite to other Application Accelerators on the market, Virident offers GUI and console software to monitor the health of the card and handle formatting needs. The one area we find somewhat lacking is the ability to monitor real-time performance data, which Micron provides in their RealSSD Manager and Fusion-io provides in their ioSphere package. With that added, Virident's FlashMAX Manager would compete on all fronts and really separate themselves from many others in the space that provide only very minimal information through software.
When peeling back to the core to evaluate drive performance, the FlashMAX II finds itself in interesting territory, with few direct line comparables. Its large pool of MLC NAND actually fares very well against the leading SLC comparable, Micron's P320h, in not only throughput but also max latency and latency standard deviation. In our 4K random write preconditioning test, we noted exceptional peak response times staying below 80ms from burst into steady-state. With write-heavy workload stability being the calling card of SLC drives to date, competing in that space and competing well helps the FlashMAX II stand out as a high-performing competitor. In our mixed workloads with a heavy read-slant, we noted robust performance in stock and high-performance configurations, across both Linux and Windows. Linux holds the lead in throughput, while if peak response times are key, Windows has the edge in that category. Overall the FlashMAX II offers excellent performance in Windows and Linux, with a strong boost available in high performance mode if the user is willing to sacrifice usable drive capacity.
Pros
- Proven third-generation drive architecture
- Excellent latency behavior under heavy workloads
- Offers SLC-like endurance and performance using MLC-NAND
- Two-drive design that interacts with the host system as a single volume
Cons
- Three year warranty is lower than the industry standard five
- Management software lacks real-time performance stats
Bottom Line
The Virident FlashMAX II provides industry leading capacity in the HHHL form factor with a robust software layer and performance in terms of throughput and latency that rivals the leading SLC-based application accelerator. Overall Virident has done a comprehensive job with the FlashMAX II offering excellent performance in both Windows and Linux environments.
Virident FlashMAX II Product Page