

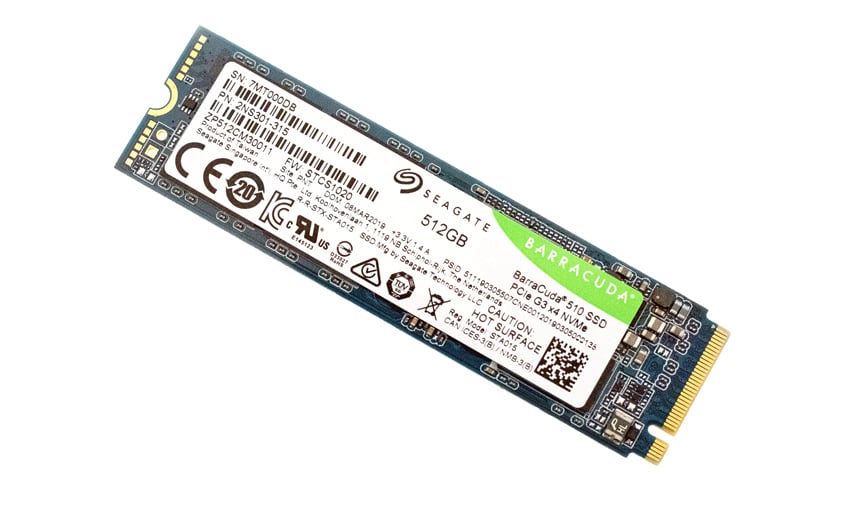
The Seagate BarraCuda 510 is a consumer drive for users looking to leverage the NVMe interface inside their ultra-thin laptops, workstations, and desktop PCs, though it’s also available in a 2.5 SATA model. First revealed during CES 2019 in January, the BarraCuda 510 features 3D cTLC NAND and capacities up to 512GB. The new Seagate drive also comes bundled with SeaTools SSD, which is the company’s free software that tests and analyzes their drives for health monitoring.
Seagate indicates that their drive is designed or a wide range of demanding applications, including 4K video processing, hardcore gaming, and multi-tasking with resource-intensive software. It is certainly specced to thrive in these conditions with its PCIe Gen3 ×4 NVMe 1.3 interface and quoted sequential read and write speeds of up to 3,400MB/s and 2,100MB/s, respectively; however, that remains to be seen.
As far as its reliability and endurance go, Seagate backs their new BarraCuda drive with a 5-year warranty while indicating 1.8M hours MTBF and up to 320 total terabytes written. Consumers also have the option to purchase a Rescue Data Recovery Services plan, which gives them access to a global team of data recovery experts if you lose your data.
The Seagate BarraCuda 510 comes with a 5-year limited warranty and an MSRP of $70 for the 256GB and $110 for the 512GB. For this review, we will be looking at the 512GB model.
Seagate BarraCuda 510 Specifications
| Interface | PCIe G3 ×4, NVMe 1.3 |
| NAND Flash Memory | 3D TLC |
| Form Factor | M.2 2280-S2 |
| Performance | |
| Sequential Read (Max, MB/s) 128KB | 3,400 (256GB) 3,100 (512GB) |
| Sequential Write (Max, MB/s), 128KB | 2,180 (256GB), 1,050 (512GB) |
| Random Read (Max, IOPS), 4KB QD32 T8 | 350,000 (256GB), 180,000 (512GB) |
| Random Write (Max, IOPS), 4KB QD32 T8 | 530,000 (256GB), 260,000 (512GB) |
| Endurance/Reliability | |
| Total Bytes Written (TB) | 320 (512GB), 160 (512GB) |
| Mean Time Between Failures (MTBF, hours) | 1,800,000 |
| Warranty, Limited (years) | 5 |
| Power Management | |
| Active Power, Average (W) | 4.2 (512GB), 3.0 (256GB) |
| Idle Power PS3, Average (mW) | 16 |
| Low Power L1.2 mode (mW) | 2 |
| Environmental | |
| Temperature, Operating Internal (°C) | 0 to 70 |
| Temperature, Nonoperating (°C) | –40 to 85 |
| Shock, Nonoperating: 0.5ms (Gs) | 1500 |
| Special Features | TRIM S.M.A.R.T. Halogen Free RoHS Compliance |
Seagate BarraCuda 510 Performance
Testbed
The test platform leveraged in these tests is a Dell PowerEdge R740xd server. We measure SATA performance through a Dell H730P RAID card inside this server, although we set the card in HBA mode only to disable the impact of RAID card cache. NVMe is tested natively through an M.2 to PCIe adapter card. The methodology used better reflects end-user workflow with the consistency, scalability and flexibility testing within virtualized server offers. A large focus is put on drive latency across the entire load range of the drive, not just at the smallest QD1 (Queue-Depth 1) levels. We do this because many of the common consumer benchmarks don’t adequately capture end-user workload profiles.
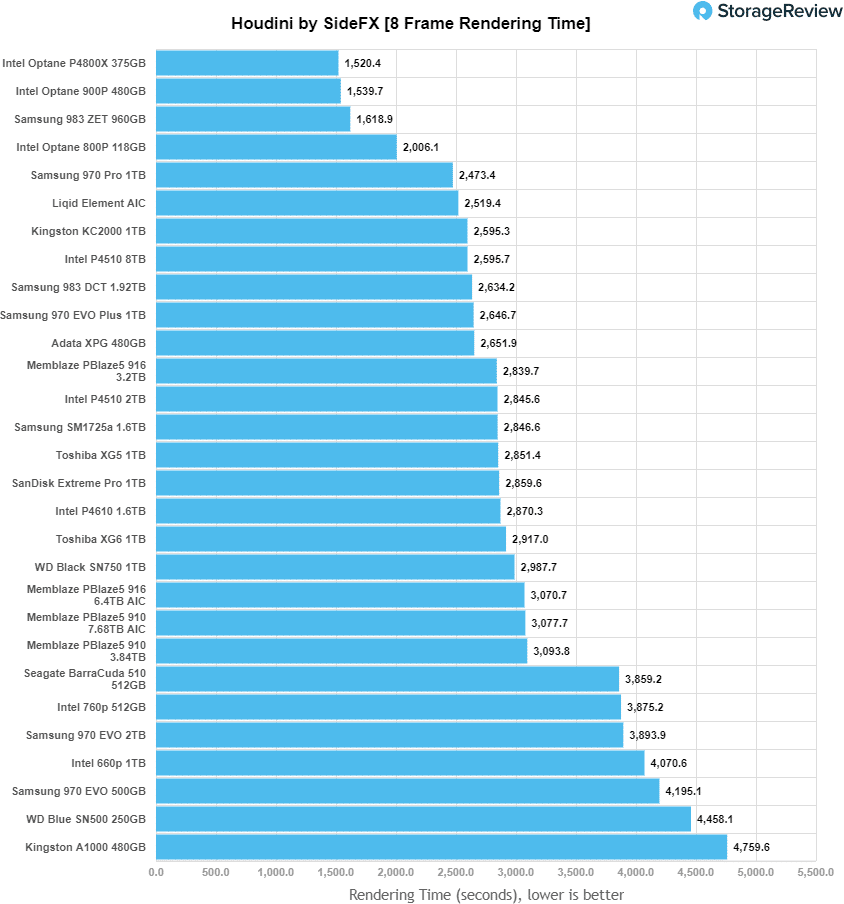
Houdini by SideFX
The Houdini test is specifically designed to evaluate storage performance as it relates to CGI rendering. The test bed for this application is a variant of the core Dell PowerEdge R740xd server type we use in the lab with dual Intel 6130 CPUs and 64GB DRAM. In this case we installed Ubuntu Desktop (ubuntu-16.04.3-desktop-amd64) running bare metal. Output of the benchmark is measured in seconds to complete, with fewer being better.
The Maelstrom demo represents a section of the rendering pipeline that highlights the performance capabilities of storage by demonstrating its ability to effectively use the swap file as a form of extended memory. The test does not write out the result data or process the points in order to isolate the wall-time effect of the latency impact to the underlying storage component. The test itself is composed of five phases, three of which we run as part of the benchmark, which are as follows:
Loads packed points from disk. This is the time to read from disk. This is single threaded, which may limit overall throughput.
Unpacks the points into a single flat array in order to allow them to be processed. If the points do not have dependency on other points, the working set could be adjusted to stay in-core. This step is multi-threaded.
(Not Run) Process the points.
Repacks them into bucketed blocks suitable for storing back to disk. This step is multi-threaded.
(Not Run) Write the bucketed blocks back out to disk.
Looking at the performance of rendering time (where less is better), the BarraCuda 510 scored 3,859.2 seconds, which was near the bottom of the pack.
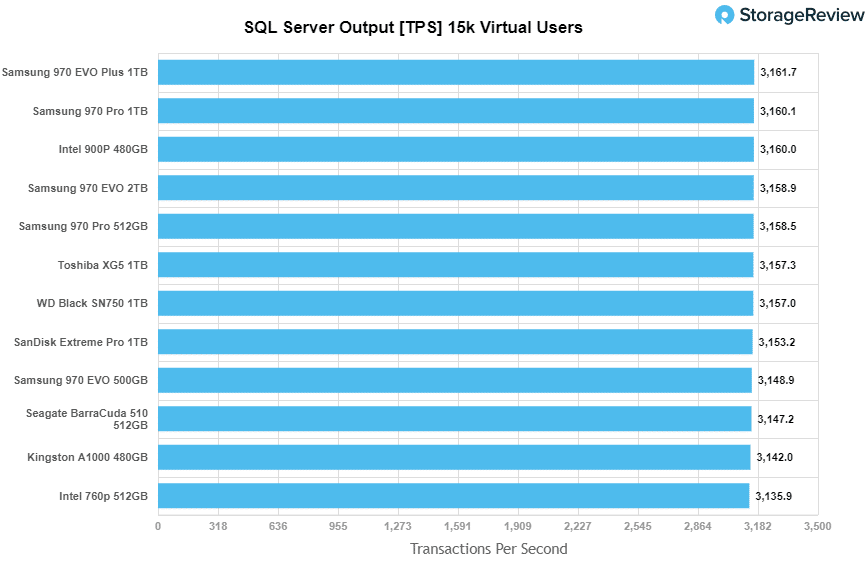
SQL Server Performance
We use a lightweight virtualized SQL Server instance to appropriately represent what an application developer would use on a local workstation. The test is similar to what we run on storage arrays and enterprise drives, just scaled back to be a better approximation for behaviors employed by the end user. The workload employs the current draft of the Transaction Processing Performance Council’s Benchmark C (TPC-C), an online transaction processing benchmark that simulates the activities found in complex application environments.
The lightweight SQL Server VM is configured with three vDisks: 100GB volume for boot, a 350GB volume for the database and log files, and a 150GB volume used for the database backup we recover after each run. From a system resource perspective, we configure each VM with 16 vCPUs, 32GB of DRAM and leverage the LSI Logic SAS SCSI controller. This test uses SQL Server 2014 running on Windows Server 2012 R2 guest VMs and is stressed by Dell’s Benchmark Factory for Databases.
SQL Server Testing Configuration (per VM)
- Windows Server 2012 R2
- Storage Footprint: 600GB allocated, 500GB used
- SQL Server 2014
- Database Size: 1,500 scale
- Virtual Client Load: 15,000
- RAM Buffer: 24GB
- Test Length: 3 hours
- 2.5 hours preconditioning
- 30 minutes sample period
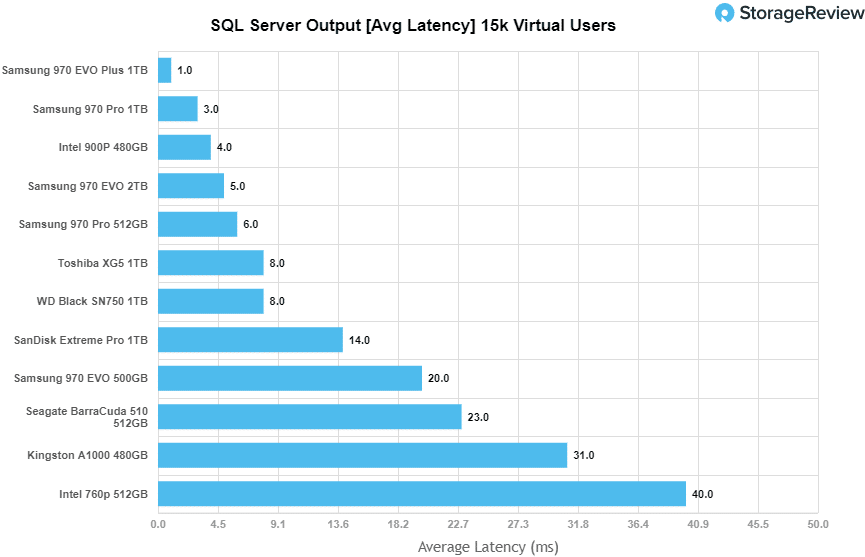
Looking at SQL Server Output shows the BarraCuda 510 with 3,147.2 TPS, which was below average among the tested drives.
For SQL Server average latency, the new Seagate recorded 23ms, again placing near the bottom of the leaderboard.
VDBench Workload Analysis
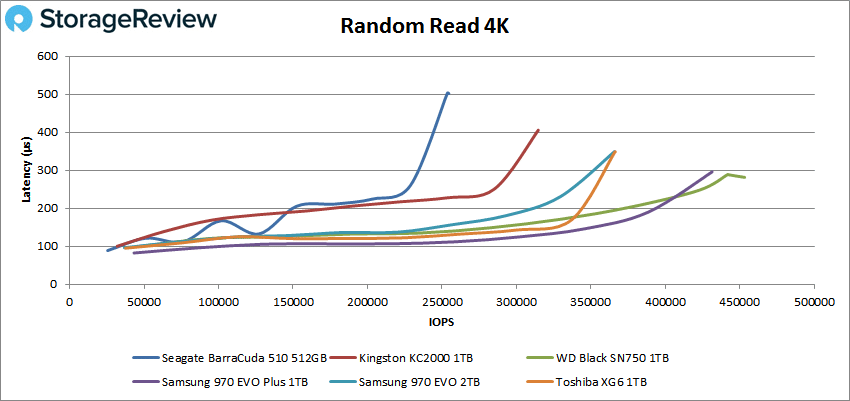
In our first VDBench Workload Analysis, we looked at random 4K read performance. Here, the BarraCuda 510 started just under 100μs, which was roughly the starting latency of all drive. As far as peak performance, the WD took second overall with 255,647 IOPS at a latency of 501μs, both of which were last place results by a significant margin.
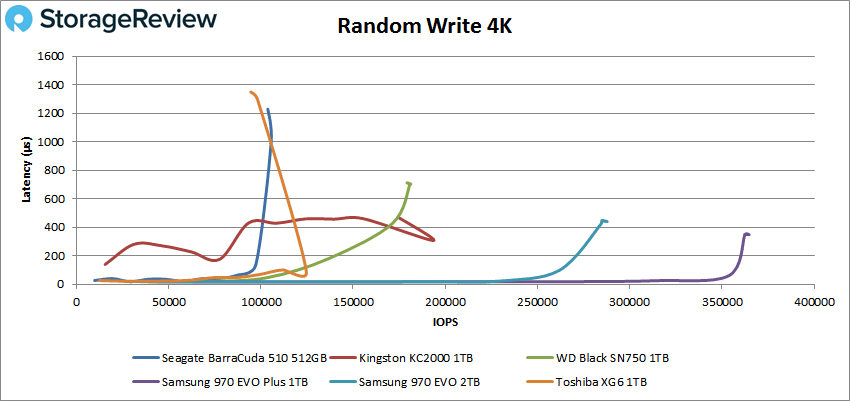
Random 4K write showed uneven results again. Starting at 26μs, showed a huge spike in latency just before the 100K IOPS mark, ending with 98,048 IOPS at 1,229μs.
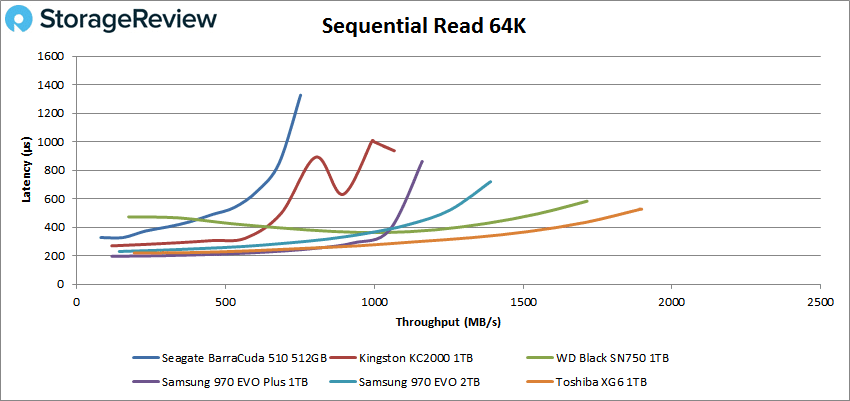
Next, we switched over to sequential workloads. For 64K read, the BarraCuda 510 started off with the second highest latency at 328μs. As far as peak performance goes, the drive came in last with 12,040 IOPS or 753MB/s at a latency of 1,327μs.
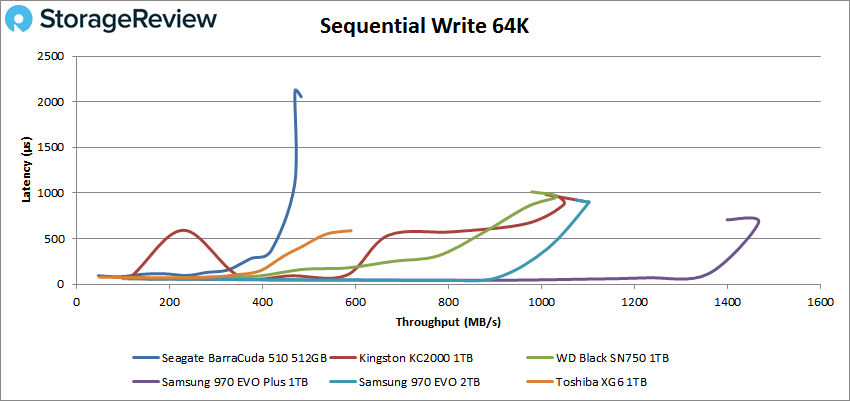
For 64K sequential write, again the BarraCuda drive started with a latency around 80μs, while peaking with 7,728.4 IOPS or 483MB/s at 2,055μs.
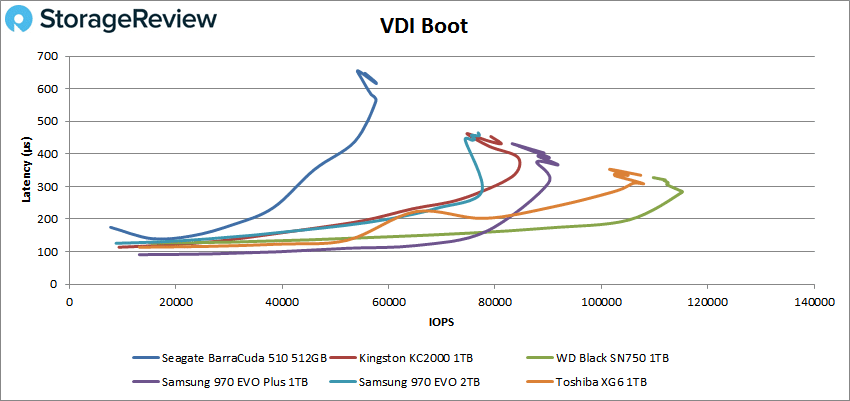
Next, we looked at our VDI benchmarks, which are designed to tax the drives even further. These tests include Boot, Initial Login, and Monday Login. Looking at the Boot test, the Seagate BarraCuda drive started with latency around 175μs, which was the highest among the tested drives. The Seagate went on to peak in last place with 57,639 IOPS at a latency of 616μs.
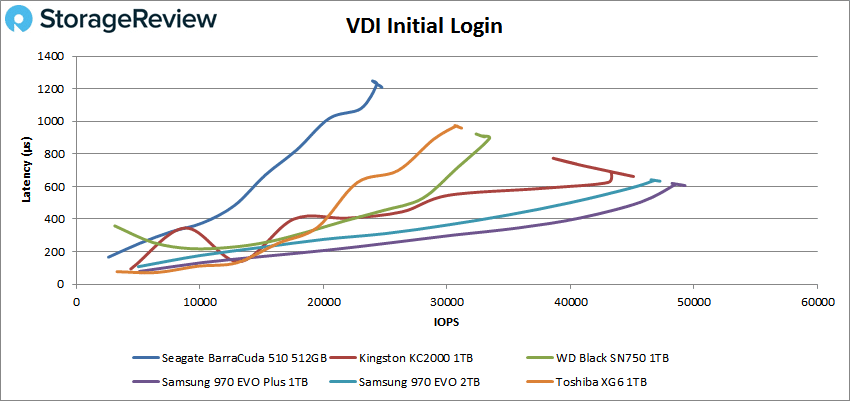
For VDI Initial Login, the BarraCuda drive started off with the second-highest latency of 166μs. It went on to peak at last place with 24,731 IOPS at a latency of 1,209μs.
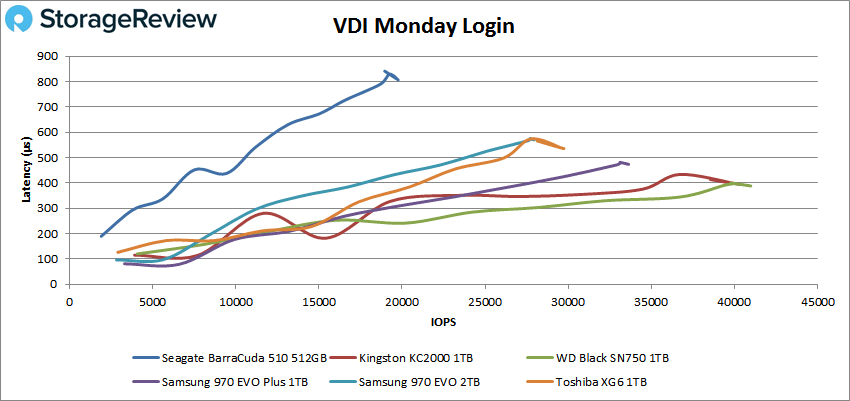
With VDI Monday Login, the Seagate drive started with the highest latency at 189μs. The drive peaked at 19,754 IOPS with a latency of 807μs for last place among the tested drives.
Conclusion
The Seagate BarraCuda 510 is the newest addition to the company’s 3D cTLC NAND SSD portfolio designed for those looking to upgrade their home PCs with speedy NVMe technology. Available in two capacities of 512GB and 256GB, the 510 comes a range of useful software like SeaTools SSD and Rescue Data Recovery Services plan to ensure your data is protected while featuring decent endurance specs with 1.8M hours MTBF and up to 320 terabytes written. In our review, we tested the 512GB capacity, which is likely to show a slightly better in performance compared to the smaller capacity model.
Unfortunately, the 510 fell behind other tested drives in our performance tests. Looking at Application Workload Analysis performance, the Seagate drive showed results near the bottom of the leaderboard in SQL for the consumer segment, showing 3,147.2 TPS and an average latency of 23ms. This placed it more or less around the same performance of the Kingston A1000 budget drive in TPS, though well behind in latency for last place. The BarraCuda 510 performance was a little better in our Houdini test with 3,852.2 seconds, which was just below the Intel 760p. These results aren’t surprising, however, as the top drives are a bit out of its class.
In 4K reads and writes, the drive showed subpar results with 255,647 IOPS and 98,048 IOPS, respectively. Switching over to 64K reads and writes, the Barracuda 510 showed performance of 753MB/s and 483MB/s, respectively, which was essentially half the performance of the top performance drive. Latency was more or less the same. Our VDI benchmarks had the Barracuda 510 have average to fair performance with 58K IOPS for Boot, 25K IOPS for Initial Login, and 19K IOPS for Monday Login, all of which placed last.
With the Seagate Barracuda 510’s performance being low to average it will all come down to price. If it can be picked up for the right price it will serve as a good NVMe drive for most use cases.


 Amazon