

The Seagate IronWolf SSD family was launched a few months ago near the end of April with the promise of improved reads and writes (and thus a longer life span) via the company’s Durawrite technology. We previously looked at the new IronWolf drive in a NAS environment with 8 samples of the 240GB SSDs in RAID 6. For this review, we are looking at a single 3.84TB capacity IronWolf 110 SSD within a server. As we mentioned in the previous review, the benefits of using SSDs in a NAS environment are significant if the cost, durability and capacity all match customer needs.
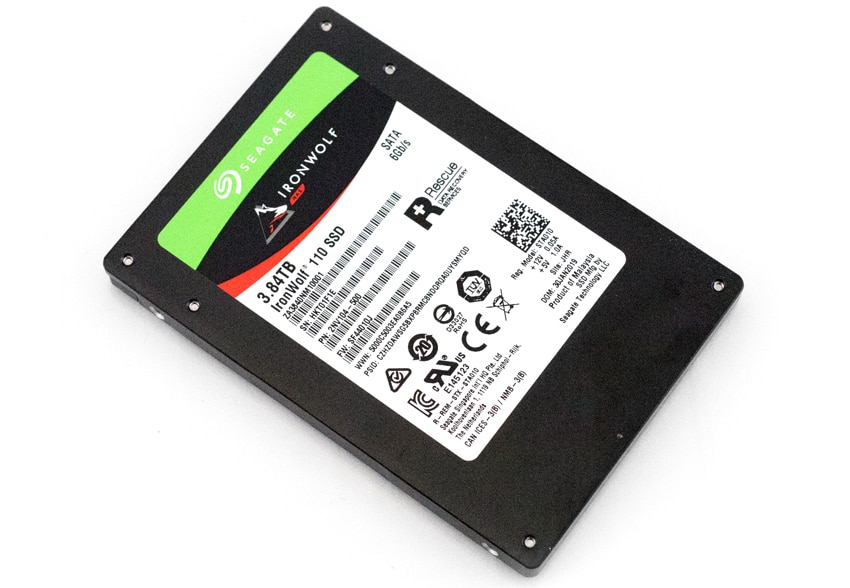
Seagate claims a maximum performance of up to 560MB/s read and 535MB/s write, and throughput up to 85,000 IOPS read and 60,000 IOPS write for the 3.48TB model. Available in 3.84TB, 1.92TB, 960GB, 480GB, and 240GB capacities, the IronWolf features an endurance rating of 7000TBW for the top capacity (it scales down to 438TBW for the 240GB drive). All of the IronWolf 110 SSDs are backed by a 5-year limited warranty, support IronWolf Health Management and come with two years of rescue data recovery services.
Seagate IronWolf 110 SSD 3.84TB Speed
Testbed
Our 3.84GB capacity IronWolf 110 SSD uses our Lenovo ThinkSystem SR850 for application tests and a Dell PowerEdge R740xd for synthetic benchmarks. The ThinkSystem SR850 is a well-equipped quad-CPU platform, offering CPU power well in excess of what’s needed to stress high-performance local storage. Synthetic tests that don’t require a lot of CPU resources use the more traditional dual-processor server. In both cases, the intent is to showcase local storage in the best light possible that aligns with storage vendor maximum drive specs.
Lenovo ThinkSystem SR850
- 4 x Intel Platinum 8160 CPU (2.1GHz x 24 Cores)
- 16 x 32GB DDR4-2666Mhz ECC DRAM
- 2 x RAID 930-8i 12Gb/s RAID Cards
- 8 NVMe Bays
- VMware ESXI 6.5
Dell PowerEdge R740xd
- 2 x Intel Gold 6130 CPU (2.1GHz x 16 Cores)
- 4 x 16GB DDR4-2666MHz ECC DRAM
- 1x PERC 730 2GB 12Gb/s RAID Card
- Add-in NVMe Adapter
- Ubuntu-16.04.3-desktop-amd64
Testing Background
The StorageReview Enterprise Test Lab provides a flexible architecture for conducting benchmarks of enterprise storage devices in an environment comparable to what administrators encounter in real deployments. The Enterprise Test Lab incorporates a variety of servers, networking, power conditioning, and other network infrastructure that allows our staff to establish real-world conditions to accurately gauge performance during our reviews.
We incorporate these details about the lab environment and protocols into reviews so that IT professionals and those responsible for storage acquisition can understand the conditions under which we have achieved the following results. None of our reviews are paid for or overseen by the manufacturer of equipment we are testing.
Application Workload Analysis
In order to understand the performance characteristics of enterprise storage devices, it is essential to model the infrastructure and the application workloads found in live-production environments. Our benchmarks are therefore the MySQL OLTP performance via SysBench and Microsoft SQL Server OLTP performance with a simulated TCP-C workload. For our application workloads, each drive will be running 2-4 identically configured VMs.
SQL Server Performance
Each SQL Server VM is configured with two vDisks: 100GB volume for boot and a 500GB volume for the database and log files. From a system-resource perspective, we configured each VM with 16 vCPUs, 64GB of DRAM and leveraged the LSI Logic SAS SCSI controller. While our Sysbench workloads tested previously saturated the platform in both storage I/O and capacity, the SQL test is looking for latency performance.
This test uses SQL Server 2014 running on Windows Server 2012 R2 guest VMs, and is stressed by Quest’s Benchmark Factory for Databases. StorageReview’s Microsoft SQL Server OLTP testing protocol employs the current draft of the Transaction Processing Performance Council’s Benchmark C (TPC-C), an online transaction-processing benchmark that simulates the activities found in complex application environments. The TPC-C benchmark comes closer than synthetic performance benchmarks to gauging the performance strengths and bottlenecks of storage infrastructure in database environments. Each instance of our SQL Server VM for this review uses a 333GB (1,500 scale) SQL Server database and measures the transactional performance and latency under a load of 15,000 virtual users.
SQL Server Testing Configuration (per VM)
- Windows Server 2012 R2
- Storage Footprint: 600GB allocated, 500GB used
- SQL Server 2014
- Database Size: 1,500 scale
- Virtual Client Load: 15,000
- RAM Buffer: 48GB
- Test Length: 3 hours
- 2.5 hours preconditioning
- 30 minutes sample period
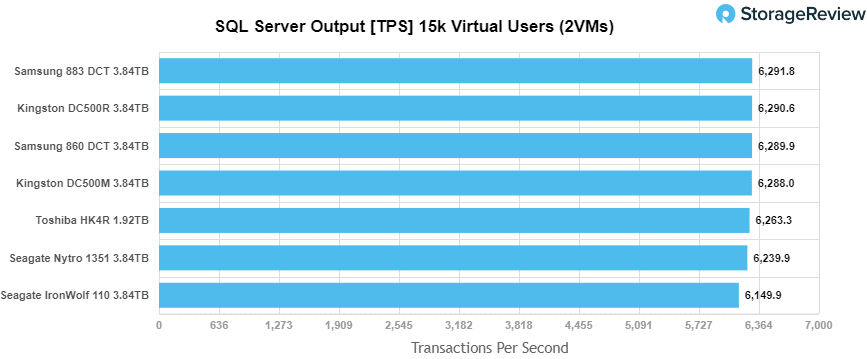
For our SQL Server transactional benchmark, the IronWolf 110 fell behind the rest of the drives, posting a total of 6,149.9 TPS for last place.
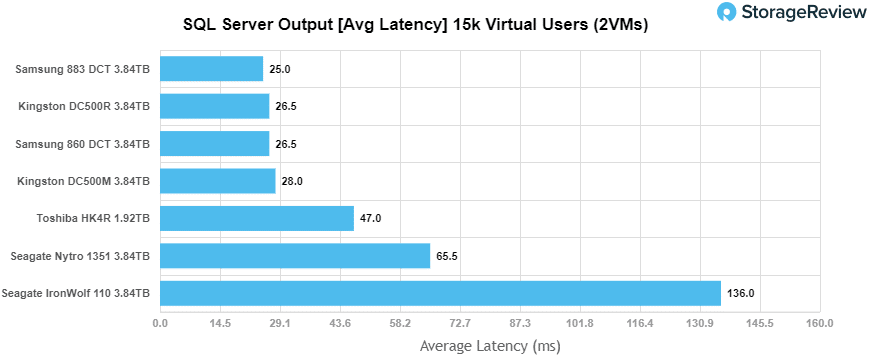
A better indication of SQL Server performance is latency compared to TPS. In this scenario, the IronWolf 110 found itself at the bottom of the pack by a large margin with 136.0ms in latency.
Sysbench Performance
The next application benchmark consists of a Percona MySQL OLTP database measured via SysBench. This test measures average TPS (Transactions Per Second), average latency, and average 99th percentile latency as well.
Each Sysbench VM is configured with three vDisks: one for boot (~92GB), one with the pre-built database (~447GB), and the third for the database under test (270GB). From a system-resource perspective, we configured each VM with 16 vCPUs, 60GB of DRAM and leveraged the LSI Logic SAS SCSI controller.
Sysbench Testing Configuration (per VM)
- CentOS 6.3 64-bit
- Percona XtraDB 5.5.30-rel30.1
- Database Tables: 100
- Database Size: 10,000,000
- Database Threads: 32
- RAM Buffer: 24GB
- Test Length: 3 hours
- 2 hours preconditioning 32 threads
- 1 hour 32 threads
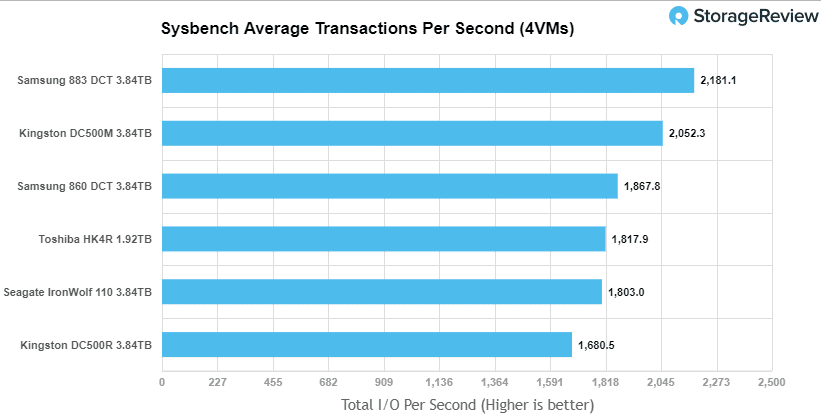
With the Sysbench transactional benchmark, the IronWolf had a showing of 1,803 TPS, which was just behind the Toshiba drive for second last place.
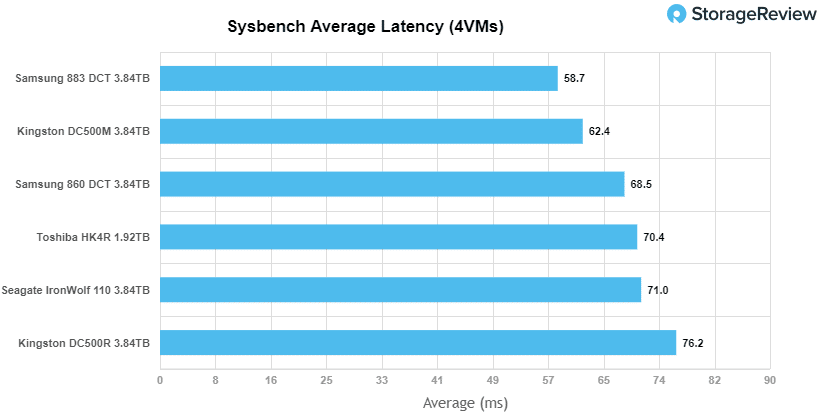
In sysbench average latency, the IronWolf trailed the Toshiba drive once again with 71.0ms.
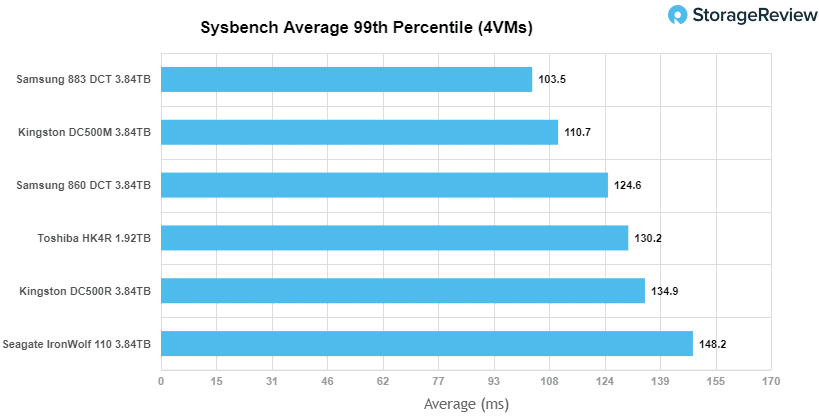
For our worst-case scenario latency (99thpercentile), IronWolf fell back into last place with 148.2ms in average latency.
VDBench Workload Analysis
When it comes to benchmarking storage devices, application testing is best, and synthetic testing comes in second place. While not a perfect representation of actual workloads, synthetic tests do help to baseline storage devices with a repeatability factor that makes it easy to do apples-to-apples comparison between competing solutions. These workloads offer a range of different testing profiles ranging from “four corners” tests, common database transfer size tests, to trace captures from different VDI environments. All of these tests leverage the common vdBench workload generator, with a scripting engine to automate and capture results over a large compute testing cluster. This allows us to repeat the same workloads across a wide range of storage devices, including flash arrays and individual storage devices. Our testing process for these benchmarks fills the entire drive surface with data, then partitions a drive section equal to 25% of the drive capacity to simulate how the drive might respond to application workloads. This is different than full entropy tests which use 100% of the drive and take them into steady state. As a result, these figures will reflect higher-sustained write speeds.
Profiles:
- 4K Random Read: 100% Read, 128 threads, 0-120% iorate
- 4K Random Write: 100% Write, 64 threads, 0-120% iorate
- 64K Sequential Read: 100% Read, 16 threads, 0-120% iorate
- 64K Sequential Write: 100% Write, 8 threads, 0-120% iorate
- Synthetic Database: SQL and Oracle
- VDI Full Clone and Linked Clone Traces
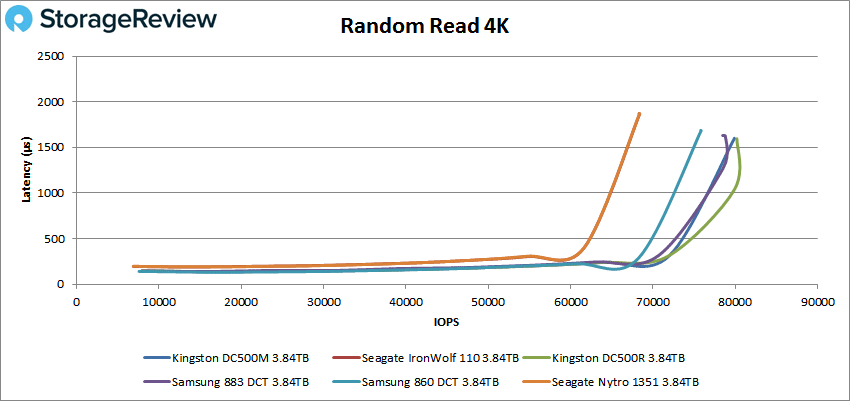
In our first VDBench Workload Analysis, Random 4K Read, the 110 SSD had virtually identical results when compared to the Seagate Nytro 1351. Here, the drive remained under 1ms latency until around 64,000 IOPS, then went out to peak at 68,411 IOPS.
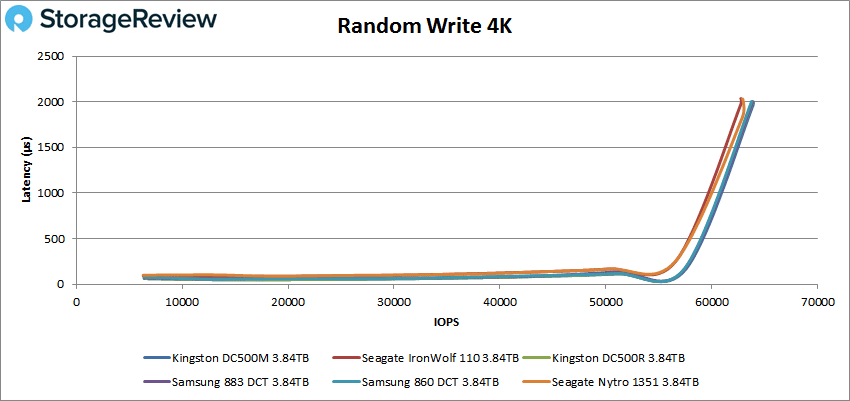
With Random 4K writes, all of the drives had nearly identical results, posting a bit over 60,000 IOPS with a latency of 2ms.
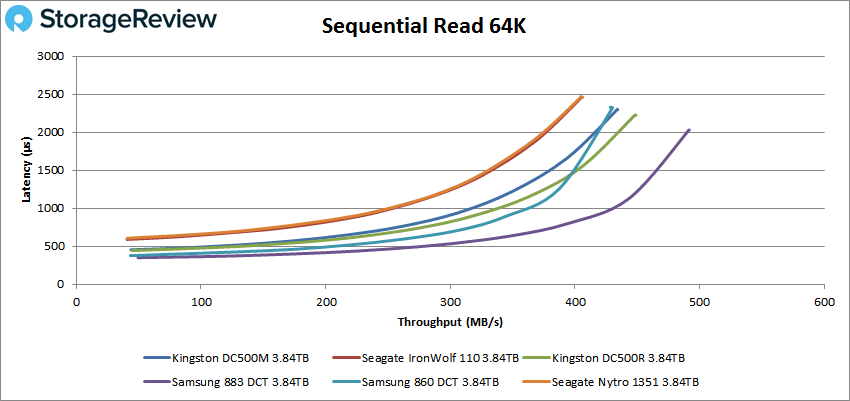
Switching over to sequential workloads, we first look at our 64K read test. Here, the IronWolf 110 SSD had sub-millisecond latency until around 3,900 IOPS or 243MB/s. The drive went on to peak at 6,495 IOPS or 406MB/s with a latency of 2.46ms. This test showed, again, similar results with the Nytro 1351.
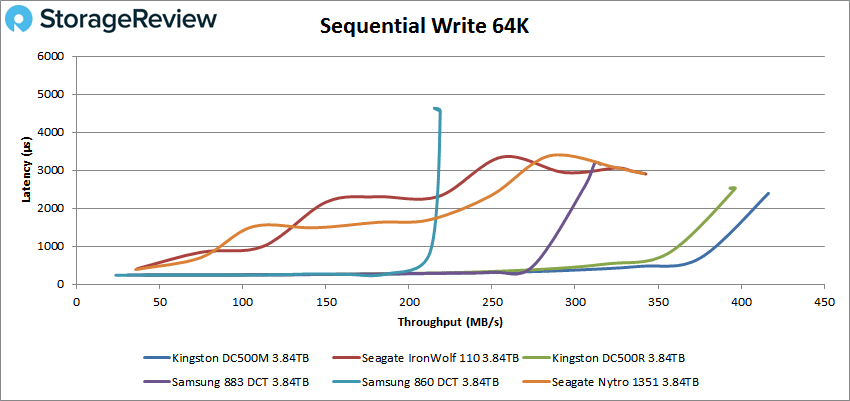
With sequential writes, the IronWolf 110 maintained sub-millisecond latency until right at 12,000 IOPS or 365MB/s. The trend continues with the Ntyro, showing identical results.
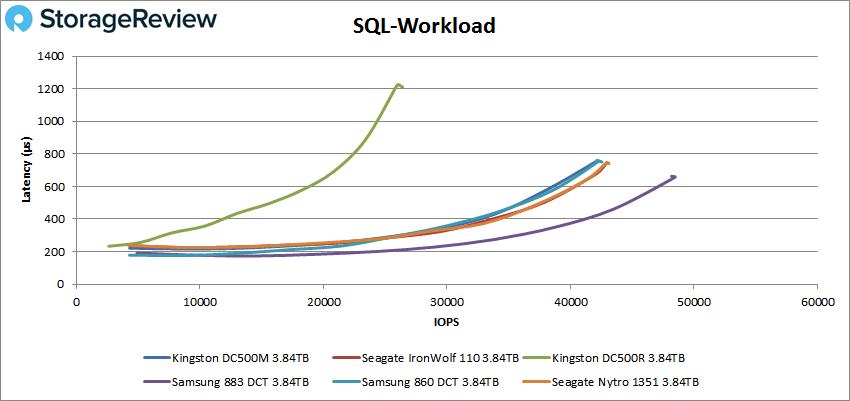
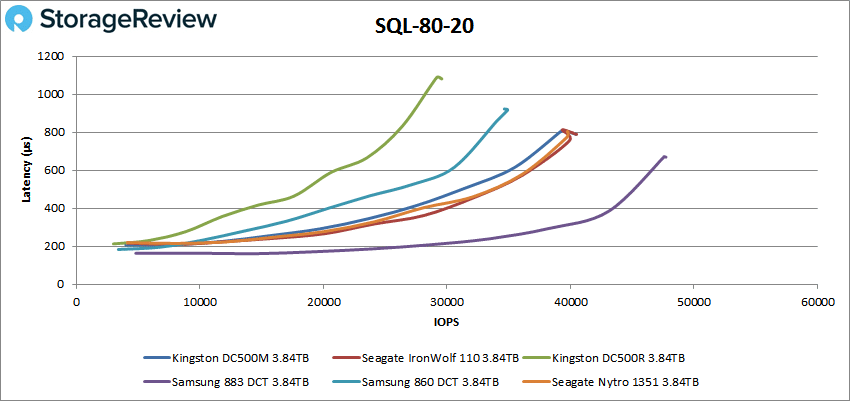
Next, we move on to our SQL workloads, where the IronWolf 110 tied with the Nytro 1351 for second place in all three tests. Here, the 110 SSD had a peak performance of 43,120 IOPS while maintaining a sub-millisecond latency.
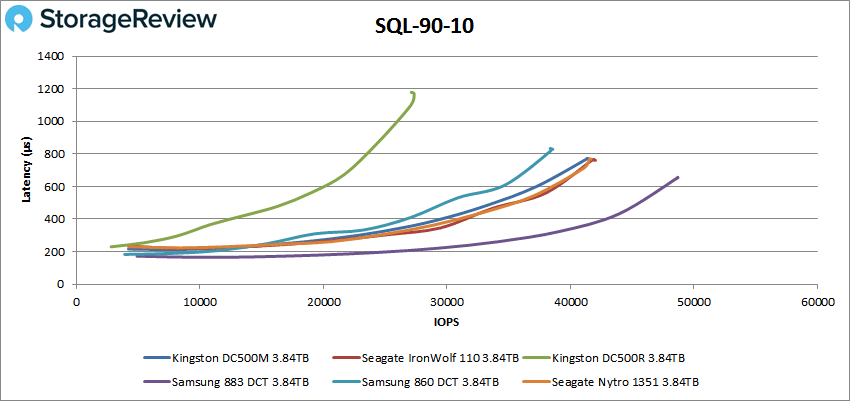
For SQL 90-10, the IronWolf 110 drive had a peak performance of 41,650 IOPS while, again, maintaining a sub-millisecond latency.
In SQL 80-20, the sub-millisecond latency continues with IOPS peaking at 40,494 IOPS.
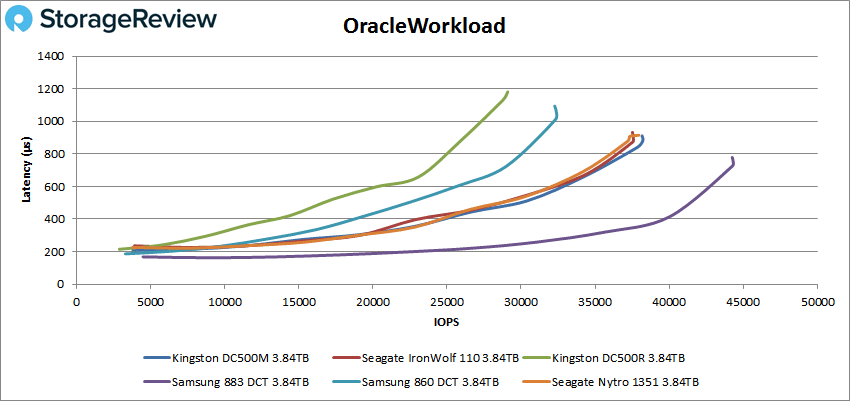
Moving on to Oracle workloads, the 110 held or fell insignificantly behind second place. Even still, it was able to maintain sub-millisecond latency in all three tests. For the first test, it had a peak performance of 37,946 IOPS with a latency of 915μs.
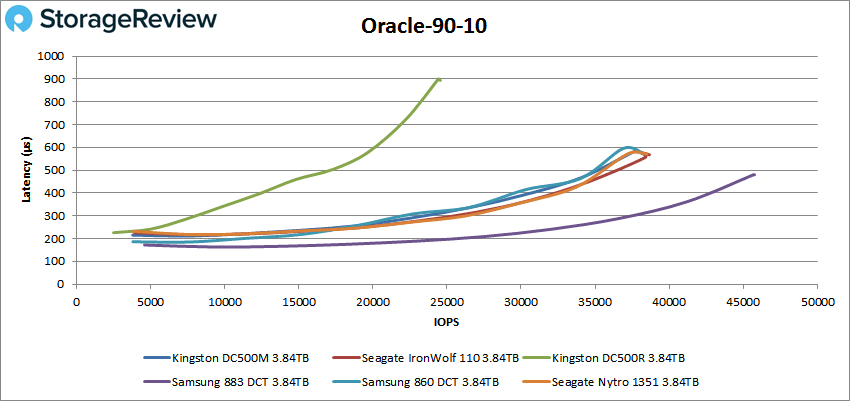
With Oracle 90-10, the 110 had a peak performance of 38,4680 IOPS with a latency of 571.1μs.
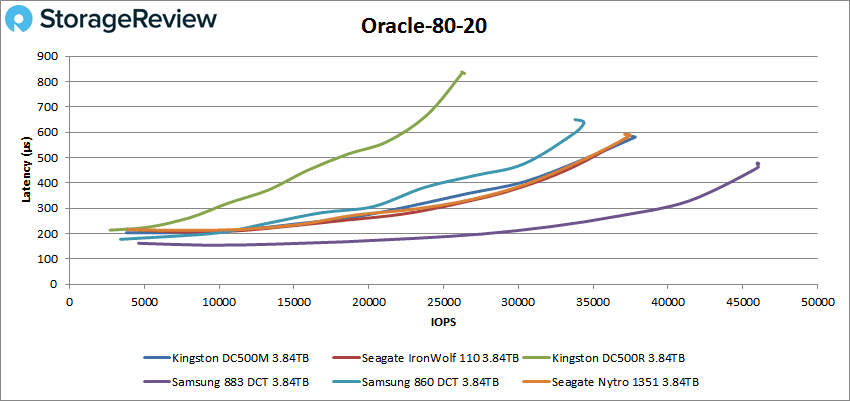
Oracle 80-20 had the 110 at 37,456 IOPS with a latency of 586.2μs.
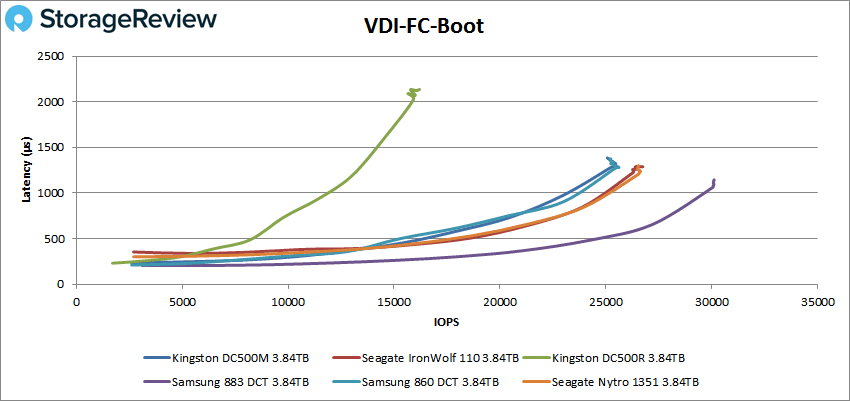
Next, we switched over to our VDI clone test, Full and Linked. For VDI Full Clone Boot, the 110 continued holding second, breaking sub-millisecond latency at around 25,000 IOPS, and going on to peak at 26,640 IOPS with a latency of 1.3ms.
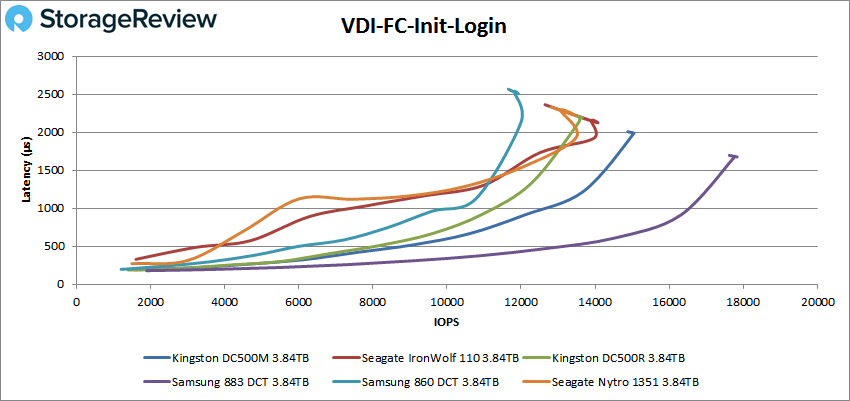
VDI FC Initial Login saw the 110 fall back to third place. The drive maintained sub-millisecond latency at roughly 6,200 IOPS and went on to peak at 14,073 IOPS with a latency of 2.12ms.
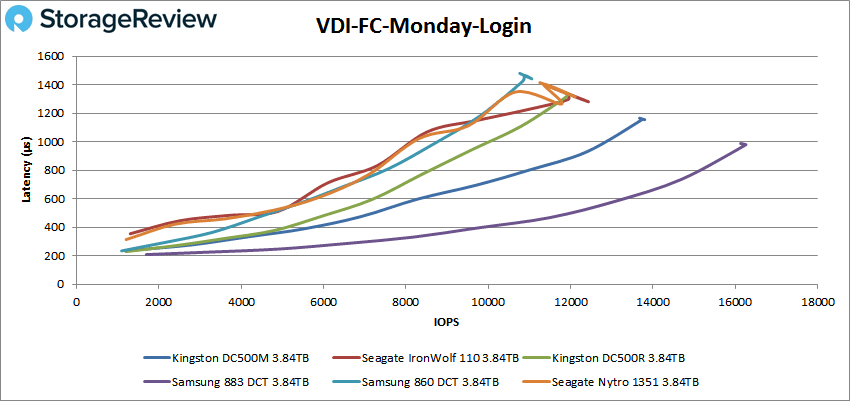
For VDI FC Monday Login, the 110 continued to hold third, breaking sub-millisecond latency at 8,000 IOPS and going on to peak at 12,413 IOPS with a latency of 1.28ms.
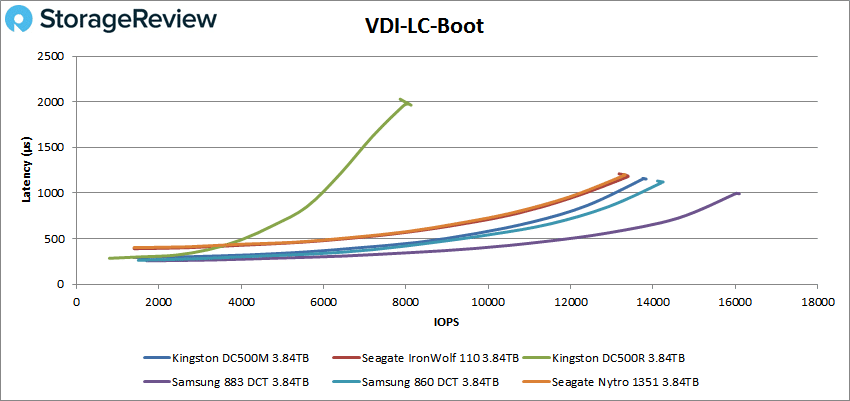
Switching over to Linked Clone, the 110 fell back to fourth place in the boot test, breaking sub-millisecond latency at 12,000 IOPS and peaking at 13,330 IOPS with a latency of 1.19ms.
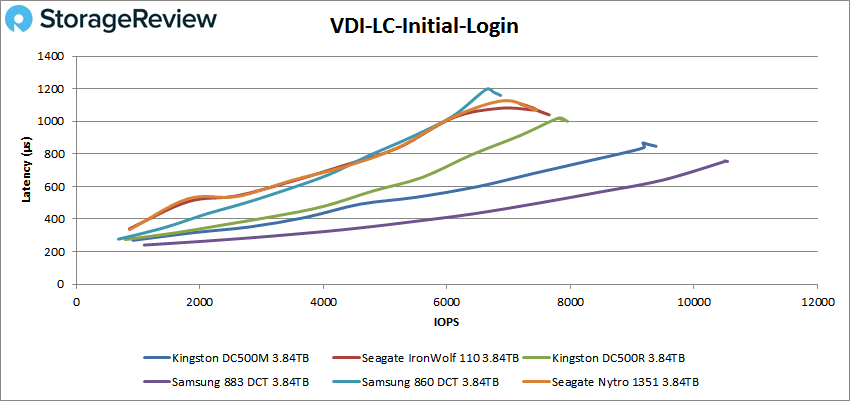
The fourth-place trend continued with VDI LC Initial Login, with the 110 holding breaking sub-millisecond latency at 6,100 IOPS and peaking at 7,648 IOPS with a latency of 1.04ms.
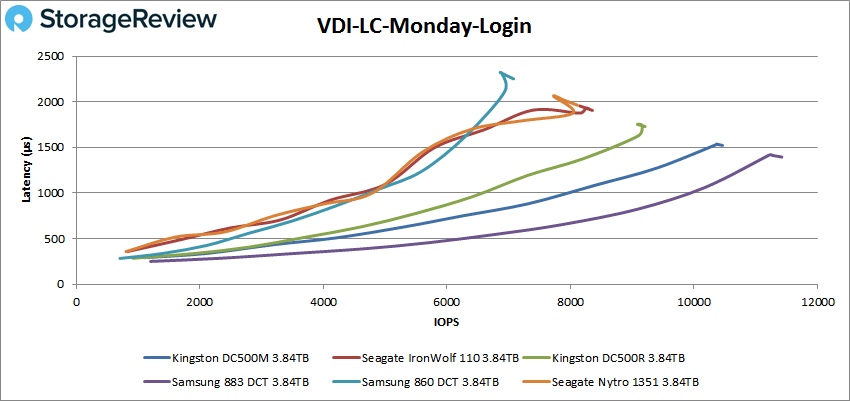
For our final test, we look at VDI LC Monday Login. Here, the 110 continued holding fourth place with a peak performance of 8,354 IOPS with a latency of 1.91ms. The drive had sub-millisecond latency until about 4,800 IOPS.
Conclusion
The Seagate IronWolf 110 SSD features DuraWrite technology, which helps to improve both performance and the lifespan of the SSD. The new Seagate drive also comes equipped with a power-loss data protection circuit, enterprise-class in-house SSD controller, and a SATA 6Gb/s interface for easy deployment. Ranging in capacities of 240GB to 3.84TB, the IronWolf 110 is backed by a 5-year warranty and 2 years of data recovery services.
Though the Seagate IronWolf 110 SSD is specifically designed for all-flash and tiering/caching enabled NAS use cases, it’s worthwhile to see how it performs as a single drive. As such, to test the 3.84TB SSD, we used our aforementioned enterprise SSD test environment for benchmarking. During our SQL and sysbench tests, it performed well below average. However, during our VDBench Workload Analysis, it performed extremely well, managing to hold second place throughout most of the tests. You may also have noticed a trend where the IronWolf 110 SSD results were virtually identical to the Seagate Nytro 1351 SSD in almost every test. That’s because the IronWolf 110 is based on that Nytro platform, with modest tweaks for the expected NAS environment.
Some highlights from these benchmarks include peak 4K throughput reads and writes of 68,411 IOPS and over 60,000 IOPS, respectively. In sequential 64K, reads had sub-millisecond latency until around 3,900 IOPS or 243MB/s and peaked at 6,495 IOPS or 406MB/s with a latency of 2.46ms, while writes maintained sub-millisecond latency until 12,000 IOPS or 365MB/s. For SQL workloads, 90-10, and 80-20, peak performance was 43,120 IOPS, 41,650 IOPS and 40,494 IOPS, respectively, all of which maintained sub-millisecond latency throughout. Moreover, Oracle workloads, 90-10 and 80-20 had peak performance of 37,946 IOPS, 38,4680 IOPS and 37,456 IOPS, respectively.
Meanwhile, VDI Full Clone Boot had peak performance at 26,640 IOPS with a latency of 1.3ms, Initial Login peaked at 14,073 IOPS with a latency of 2.12ms, and Monday Login showed peak numbers at 12,413 IOPS with a latency of 1.28ms. Switching over to Linked Clone, the IronWolf 110 Boot test peaked at 13,330 IOPS with a latency of 1.19ms, Initial Login peaked at 7,648 IOPS with a latency of 1.04ms and Monday Login had a peak performance of 8,354 IOPS with a latency of 1.91ms.
Like the smaller capacity IronWolf SSDs, the larger units will be at home in NAS environments – this time where density is a critical decision factor. Either as part of a large flash pool, or perhaps in an all-flash NAS, the IronWolf drives offer a complete feature set with additional tools like IronWolf Health Management.


 Amazon