---
description: NVIDIA GeForce RTX 5080 Review: Launch on January 30, 2025 at $999. Is the 5080 the sweet spot for gaming, rendering and AI workloads?
title: NVIDIA GeForce RTX 5080 Review: The Sweet Spot for AI Workloads
image: https://www.storagereview.com/wp-content/uploads/2025/01/StorageReview-NVIDIA-GeForce-RTX-5080-2.jpg
---


[](//storagereview.com/) 

---

[ ](https://www.facebook.com/@storagereview) [ ](https://twitter.com/storagereview) [ ](https://www.instagram.com/storagereview/) [ ](https://www.linkedin.com/company/storagereview-com) [ ](https://www.youtube.com/user/storagereview?sub%5Fconfirmation=1) [ ](mailto:info@storagereview.com) [ ](https://open.spotify.com/show/1y6VnznABhHeOSMOmbDTz0) [ ](https://www.reddit.com/r/StorageReview/) [ ](https://discord.gg/TwMHb4azdC) [ ](https://www.storagereview.com/rss.xml) [ ](https://www.tiktok.com/@storagereview) 

[![StorageReview.com](https://www.storagereview.com/wp-content/uploads/2026/07/Storage-Review-2x.png)](https://www.storagereview.com) 

≡ Menu 
* [Home](https://www.storagereview.com/)
* [Storage Reviews](https://www.storagereview.com/review)  
  * [Consumer Reviews](https://www.storagereview.com/consumer)
  * [Enterprise Reviews](https://www.storagereview.com/enterprise)
  * [Ubiquiti Reviews](https://www.storagereview.com/best/ubiquiti-reviews)
* [SR Merch](https://store.storagereview.com)
* [Leaderboards](https://www.storagereview.com/best)  
  * [Best Storage Arrays](https://www.storagereview.com/best/storage-arrays)
  * [Best Enterprise SSDs](https://www.storagereview.com/best/enterprise-ssds)
  * [Best Servers](https://www.storagereview.com/best/servers)
  * [Best Desktops for Local AI](https://www.storagereview.com/best/desktops-local-ai)
  * [Best Laptops for Local AI](https://www.storagereview.com/best/laptops-local-ai)
  * [Best Local LLM Tools](https://www.storagereview.com/best/local-llm-tools)
  * [Agentic AI Hardware](https://www.storagereview.com/best/agentic-ai-hardware)
  * [Best SSDs & Hard Drives](https://www.storagereview.com/best%5Fdrives)
  * [Best Portable SSDs](https://www.storagereview.com/best/portable-ssds)
  * [Best Business Laptops](https://www.storagereview.com/best/business-laptops)
  * [Best Mobile Workstations](https://www.storagereview.com/best/mobile-workstations)
  * [Best Desktop Workstations](https://www.storagereview.com/best/desktop-workstations)
  * [Best Laptop Battery Life](https://www.storagereview.com/best/laptop-battery-life)
* [Storage Reference Guide](https://www.storagereview.com/storage-reference-guide)
* [About SR](https://www.storagereview.com/about-storagereview)  
  * [StorageReview.com Sweepstakes Rules and Regulations](https://www.storagereview.com/storagereview-com-sweepstakes-rules-and-regulations)

Search 

[Home](https://www.storagereview.com/) » [Review](https://www.storagereview.com/review) » NVIDIA GeForce RTX 5080 Review: The Sweet Spot for AI Workloads

# NVIDIA GeForce RTX 5080 Review: The Sweet Spot for AI Workloads

by Kevin OBrien and Divyansh Jain on January 29, 2025 

[Consumer](https://www.storagereview.com/consumer) ◇ [Workstation](https://www.storagereview.com/consumer/workstation) 

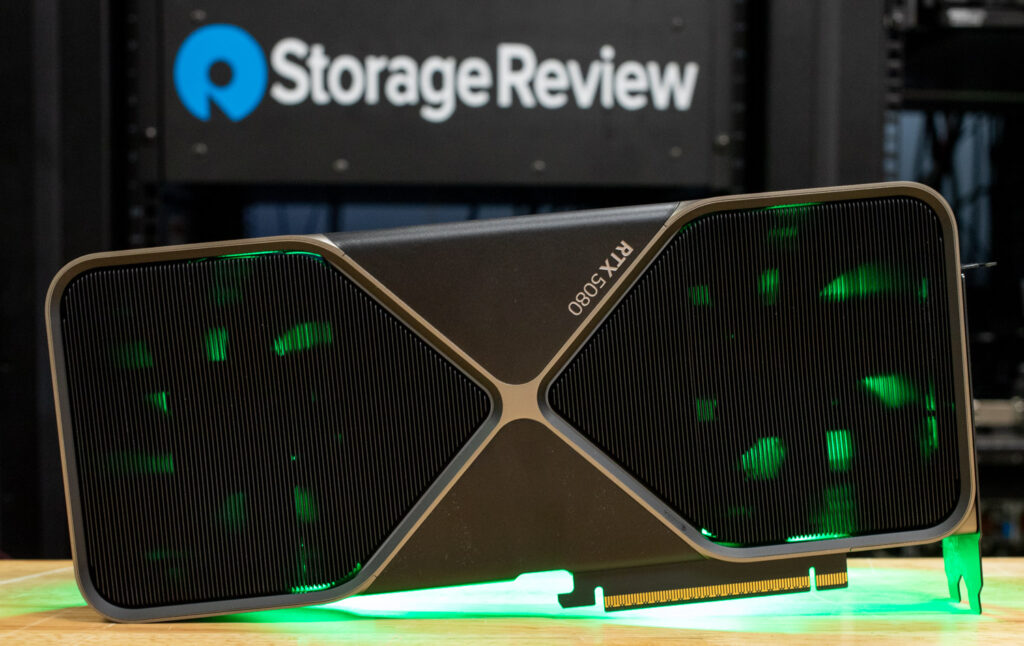
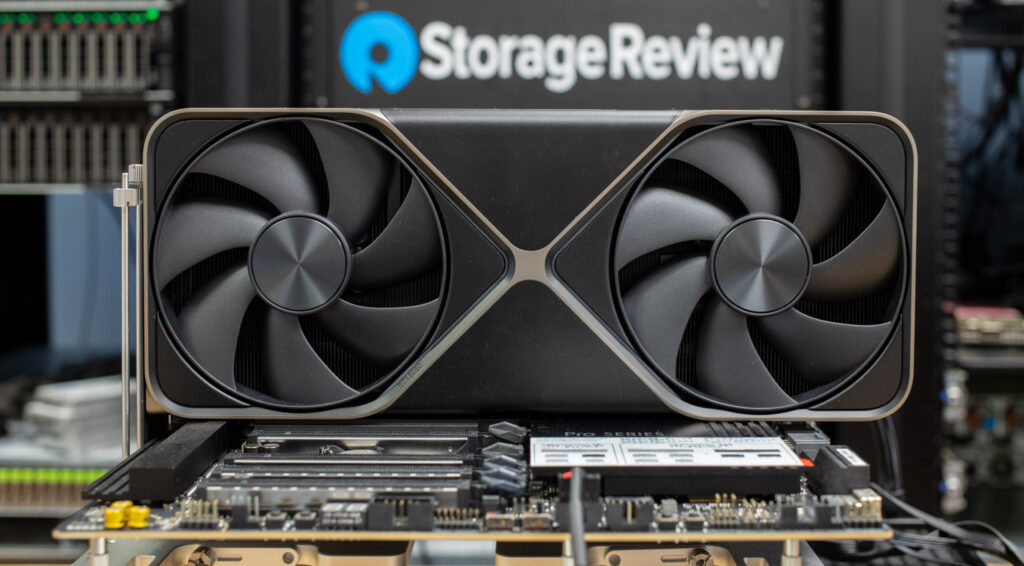
The NVIDIA GeForce RTX 5080, which launches on January 30 alongside the flagship RTX 5090, is positioned as the more affordable high-performance option in NVIDIA’s Blackwell lineup. Priced at $999, it’s a step down from the $1,999 RTX 5090 but still delivers cutting-edge performance. This makes it a likely favorite among developers, content creators, and gamers who want top-tier features without the flagship price tag.

![](https://www.storagereview.com/wp-content/uploads/2025/01/StorageReview-NVIDIA-GeForce-RTX-5080-2-1024x646.jpg) 

Equipped with the same advanced AI features as the RTX 5090, the RTX 5080 brings NVIDIA’s latest innovations, such as **DLSS 4 with Multi-Frame Generation** and **Ray Reconstruction**, to a broader audience. These technologies redefine gaming performance and visual fidelity, allowing the RTX 5080 to deliver smooth frame rates and stunning graphics even in the most demanding titles.

## Specifications

The RTX 5080 features 10,752 CUDA cores, a significant step up from the RTX 4080’s 9,728 cores, though it falls short of the RTX 5090’s massive 21,760 cores. This translates to excellent performance in gaming and AI-accelerated workloads, albeit at a slightly lower ceiling than the flagship.

| **GPU Comparison**     | NVIDIA RTX 6000 Ada          | NVIDIA RTX 5090                  | NVIDIA RTX 4090                  | **NVIDIA RTX 5080**                   | NVIDIA RTX 5070                   |
| ---------------------- | ---------------------------- | -------------------------------- | -------------------------------- | ------------------------------------- | --------------------------------- |
| GPU Name               | AD102                        | GB202                            | AD102                            | **GB203**                             | GB205                             |
| Architecture           | Ada Lovelace                 | Blackwell 2.0                    | Ada Lovelace                     | **Blackwell 2.0**                     | Blackwell 2.0                     |
| Process Size           | 5 nm                         | 4 nm                             | 5 nm                             | **4 nm**                              | 4 nm                              |
| Transistors            | 76,300 million               | 92,200 million                   | 76,300 million                   | **45,600 million**                    | 31,000 million                    |
| Density                | 125.3M / mm²                 | 123.9M / mm²                     | 125.3M / mm²                     | **120.6M / mm²**                      | 117.9M / mm²                      |
| Die Size               | 609 mm²                      | 744 mm²                          | 609 mm²                          | **378 mm²**                           | 263 mm²                           |
| Slot Width             | Dual-slot                    | Dual-slot                        | Triple-slot                      | **Dual-slot**                         | Dual-slot                         |
| Dimensions             | 267mm x 122mm                | 304 mm x 137 mm x 48 mm          | 304 mm x 137 mm x 61 mm          | **304 mm x 137 mm x 48 mm**           | 242 mm x 112 mm                   |
| TDP                    | 300W                         | 575 W                            | 450 W                            | **360 W**                             | 250 W                             |
| Outputs                | 4x DisplayPort 1.4a          | 1x HDMI 2.1b,3x DisplayPort 2.1b | 1x HDMI 2.1, 3x DisplayPort 1.4a | **1x HDMI 2.1b, 3x DisplayPort 2.1b** | 1x HDMI 2.1b, 3x DisplayPort 2.1a |
| Power Connectors       | 1x 16-pin                    | 1x 16-pin                        | 1x 16-pin                        | **1x 16-pin**                         | 1x 16-pin                         |
| Bus Interface          | PCIe 4.0 x16                 | PCIe 5.0 x16                     | PCIe 4.0 x16                     | **PCIe 5.0 x16**                      | PCIe 5.0 x16                      |
| Base Clock             | 915 MHz                      | 2017 MHz                         | 2235 MHz                         | **2295 MHz**                          | 2165 MHz                          |
| Boost Clock            | 2505 MHz                     | 2407 MHz                         | 2520 MHz                         | **2617 MHz**                          | 2510 MHz                          |
| Memory Clock           | 2500 MHz 20 (Gbps effective) | 2209 MHz (28 Gbps effective)     | 1313 MHz (21 Gbps effective)     | **2366 MHz (30 Gbps effective)**      | 2209 MHz (28 Gbps effective)      |
| Memory Size            | 48 GB                        | 32 GB                            | 24 GB                            | **16 GB**                             | 12 GB                             |
| Memory Type            | GDDR6                        | GDDR7                            | GDDR6X                           | **GDDR7**                             | GDDR7                             |
| Memory Bus             | 384 bit                      | 512 bit                          | 384 bit                          | **256 bit**                           | 192 bit                           |
| Memory Bandwidth       | 960 GB/s                     | 1.79 TB/s                        | 1.01 TB/s                        | **960.0 GB/s**                        | 672.2 GB/s                        |
| CUDA Cores             | 18,176                       | 21,760                           | 16,384                           | **10,752**                            | 6,144                             |
| TMUs                   | 568                          | 680                              | 512                              | **336**                               | 192                               |
| ROPs                   | 192                          | 192                              | 176                              | **128**                               | 64                                |
| SM Count               | 142                          | 170                              | 128                              | **84**                                | 48                                |
| Tensor Cores           | 568                          | 680                              | 512                              | **336**                               | 192                               |
| RT Cores               | 142                          | 170                              | 128                              | **84**                                | 48                                |
| L1 Cache               | 128 KB (per SM)              | 128 KB (per SM)                  | 128 KB (per SM)                  | **128 KB (per SM)**                   | 128 KB (per SM)                   |
| L2 Cache               | 96MB                         | 88 MB                            | 72 MB                            | **64 MB**                             | 40 MB                             |
| Pixel Rate             | 481.0 GPixel/s               | 462.1 GPixel/s                   | 443.5 GPixel/s                   | **335.0 GPixel/s**                    | 160.6 GPixel/s                    |
| Texture Rate           | 1,423 GTexel/s               | 1,637 GTexel/s                   | 1,290 GTexel/s                   | **879.3 GTexel/s**                    | 481.9 GTexel/s                    |
| FP16 (half)            | 91.06 TFLOPS (1:1)           | 104.8 TFLOPS (1:1)               | 82.58 TFLOPS (1:1)               | **56.28 TFLOPS (1:1)**                | 30.84 TFLOPS (1:1)                |
| FP32 (float)           | NVIDIA RTX 5090              | 104.8 TFLOPS                     | 82.58 TFLOPS                     | **56.28 TFLOPS**                      | 30.84 TFLOPS                      |
| FP64 (double)          | 91.06 TFLOPS                 | 1.637 TFLOPS (1:64)              | 1,290 GFLOPS (1:64)              | **879.3 GFLOPS (1:64)**               | 481.9 GFLOPS (1:64)               |
| **Launch Price (USD)** | 6,799 USD                    | $1,999                           | $1,599                           | **$999**                              | $549                              |

Equipped with 16GB of GDDR7 memory on a 384-bit bus, the RTX 5080 offers plenty of bandwidth for modern games and creative applications. While it doesn’t match the 5090’s 32GB and 512-bit bus, it’s more than sufficient for most users. With a TDP of 360W, the RTX 5080 is more power-hungry than the RTX 4080 but remains more manageable than the 5090’s 575W. This makes it a better fit for users with standard high-end PC builds.

For a deeper dive into the Blackwell architecture and the innovations powering the 50-series GPUs, check out our [**RTX 5090 review**](https://www.storagereview.com/review/nvidia-geforce-rtx-5090-review-pushing-boundaries-with-ai-acceleration).

## **Build and Design**

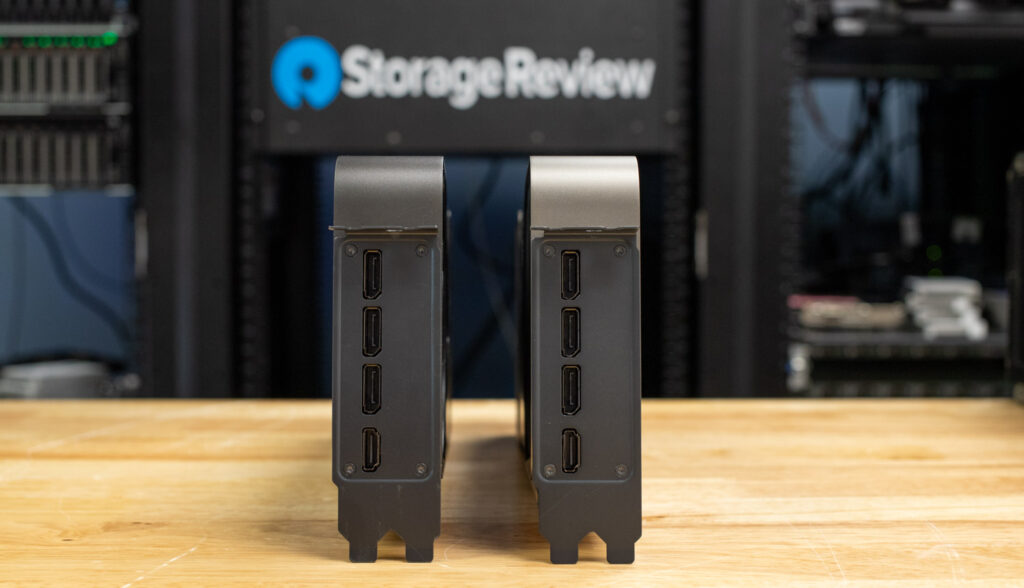
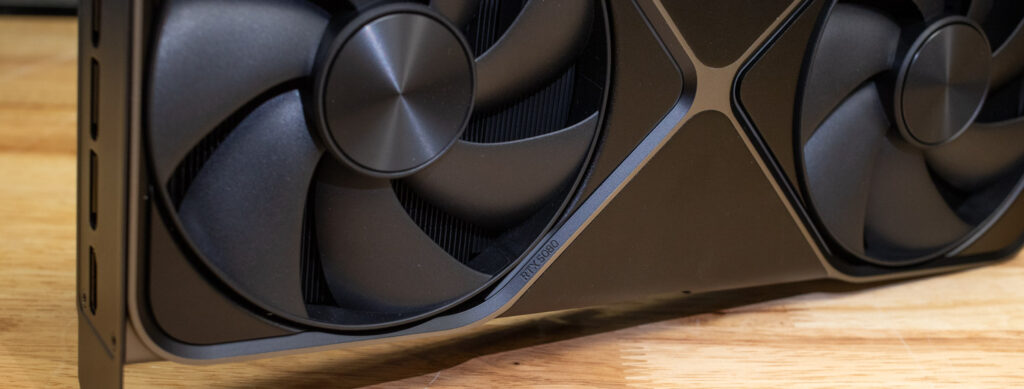
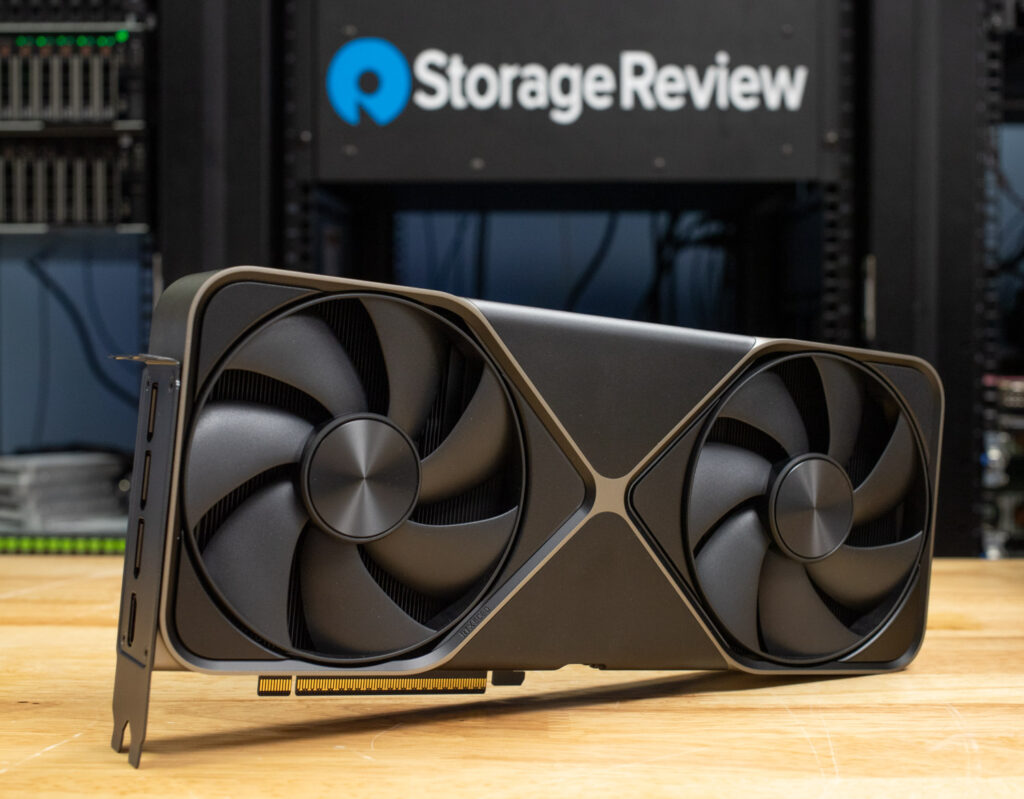
The RTX 5080 retains the sleek, dual-slot design of NVIDIA’s Founders Edition cards, making it more compact than the triple-slot RTX 4090\. It features the same 3D vapor chamber and dual axial fans as the 5090, ensuring efficient cooling even under heavy workloads. Unlike the 5090, the RTX 5080 comes with traditional thermal compound instead of liquid metal. The GeForce RTX 5080 had no trouble operating within normal temperatures in our open-air test rig, although it has a much lower power draw under load than the GeForce RTX 5090.

![]() 

(5090 pictured Right) (5080 pictured left)

The card’s dimensions—L 304 mm x W 137 mm x H 48 mm—make it perfect for most high-end PC builds. Its dual-slot form factor ensures compatibility with a wide range of cases. The flow-through cooling design improves airflow, keeping the card cool and quiet even under heavy loads.

![]() 

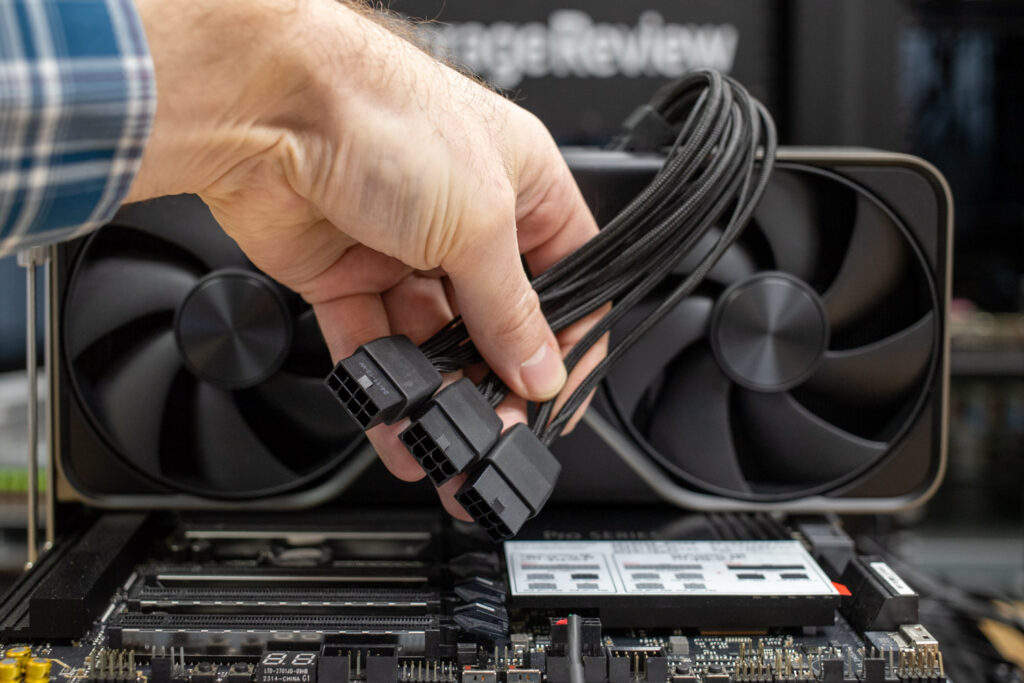
1x 16-pin to 3x 8-pin connectors

## **Key Features and Performance**

The RTX 5080 shares much of the same DNA as the RTX 5090, including the Blackwell architecture and support for DLSS 4 with Multi-Frame Generation. While it doesn’t quite match the raw power of its bigger sibling, the RTX 5080 still delivers impressive performance gains over the previous generation RTX 4080, making it a compelling upgrade for gamers and creators alike.

### **Gaming and AI Features**

The RTX 5080 benefits from the same advancements in AI-driven gaming as the RTX 5090, including DLSS 4 and Ray Reconstruction. These features allow the card to deliver smoother frame rates and enhanced visual fidelity, even in the most demanding titles. Like the 5090, the RTX 5080 leverages DLSS 4’s Multi-Frame Generation to generate up to three AI frames per rendered frame. This results in a significant performance boost in supported games, making 4K gaming at high refresh rates more accessible.

![]() 

The 5080’s 128 RT Cores (compared to the 5090’s 170) still provide excellent ray tracing performance, enabling realistic lighting, shadows, and reflections in games. While the RTX 5090 is better suited for heavy AI workloads, the RTX 5080’s 5th-gen Tensor Cores and FP4 precision still make it a capable option for creators dabbling in AI-assisted workflows.

## **NVIDIA GeForce RTX 5080 Review – Performance Benchmarks**

To maximize the performance of the new NVIDIA GeForce RTX 5080, we used our high-performance AMD ThreadRipper platform. With a 64-core CPU and a water cooling loop, this system provides CPU power to ensure the GPU performs at its full capacity without bottlenecks. The same configuration was used to test the NVIDIA GeForce RTX 6000 Ada, 5090, and 4090, ensuring a fair comparison across all cards. Below is the complete system configuration:

**StorageReview AMD ThreadRipper Test Platform**

* **Motherboard:** ASUS Pro WS TRX50-SAGE WIFI
* **CPU:** AMD Ryzen Threadripper 7980X 64-Core
* **RAM:** 32GB DDR5 4800MT/s
* **Storage:** 2TB Samsung 980 Pro
* **OS:** Windows 11 Pro for Workstations
* **Driver:** NVIDIA 571.86 GameReady Driver
![]() 

## **UL Procyon: AI Text Generation**  

The [Procyon AI Text Generation Benchmark](https://www.storagereview.com/procyon-ai-text-and-image-generation-benchmark) simplifies AI LLM performance testing by offering a compact and consistent evaluation method. It allows for repeated testing across multiple LLM models while minimizing the complexity of large model sizes and variable factors. Developed with AI hardware leaders, it optimizes the use of local AI accelerators for more reliable and efficient performance assessments. The results measured below were tested using TensorRT.

The Procyon AI Text Generation Benchmark showed the RTX 5080 closely trailed the performance of the RTX 6000 Ada across all tests. In the **Phi** test, the 5080 scored 4,400, which is slightly behind the 6000 Ada’s 4,508, but both cards perform similarly in terms of output tokens per second and overall duration—the RTX 5090 and 4090 score higher with 5,749 and 4,958, respectively.

For the **Mistral** test, the RTX 5080 scored 4,635, outperforming the 6000 Ada, which scored 4,255, but still behind the 5090 (6,267) and the 4090 (5,094). The 5080 achieved faster output tokens per second than the 6000 Ada and delivered a slightly shorter overall duration.

For **Llama3**, the RTX 5080 scored 4,424, performing better than the 6000 Ada’s 4,026, but still behind the 5090 (6,104) and 4090 (4,849). In this test, the 5080 achieved better output tokens per second than the 6000 Ada, but both cards had similar overall durations.

Finally, in the **Llama2** test, the RTX 5080 scored 4,790, trailing the 5090 (6,591) and 4090 (5,013) but still slightly outperforming the 6000 Ada, which scored 3,957\. The 5080 achieved faster token output speeds than the 6000 Ada, and its overall duration was slightly shorter than the 6000 Ada. Overall, the RTX 5080 delivers solid AI image generation performance, maintaining a competitive edge over the 6000 Ada in 3 of 4 tests.

| **UL Procyon: AI Text Generation** | **NVIDIA RTX 5080**   | **NVIDIA RTX 5090** | **NVIDIA RTX 4090** | **NVIDIA RTX 6000 Ada** |
| ---------------------------------- | --------------------- | ------------------- | ------------------- | ----------------------- |
| Phi Overall Score                  | **4,400**             | 5,749               | 4,958               | 4,508                   |
| Phi Output Time To First Token     | **0.277 s**           | 0.244 s             | 0.255 s             | 0.288 s                 |
| Phi Output Tokens Per Second       | **209.459 tokens/ s** | 314.435 tokens/s    | 244.343 tokens/s    | 228.359 tokens/s        |
| Phi Overall Duration               | **14.908 s**          | 10.280 s            | 12.872 s            | 13.869 s                |
| Mistral Overall Score              | **4,635 s**           | 6,267               | 5,094               | 4,255                   |
| Mistral Output Time To First Token | **0.347 s**           | 0.297 s             | 0.322 s             | 0.419 s                 |
| Mistral Output Tokens Per Second   | **163.598 tokens/s**  | 255.945 tokens/s    | 183.266 tokens/s    | 166.633 tokens/s        |
| Mistral Overall Duration           | **18.933 s**          | 12.593 s            | 17.010 s            | 19.092 s                |
| Llama3 Overall Score               | **4,424**             | 6,104               | 4,849               | 4,026                   |
| Llama3 Output Time To First Token  | **0.283 s**           | 0.234 s             | 0.259 s             | 0.348 s                 |
| Llama3 Output Tokens Per Second    | **136.177 s**         | 214.285 tokens/s    | 150.039 tokens/s    | 138.620 tokens/s        |
| Llama3 Overall Duration            | **21.985 s**          | 14.304 s            | 19.991 s            | 22.062 s                |
| Llama2 Overall Score               | **4,790**             | 6,591               | 5,013               | 3,957                   |
| Llama2 Output Time To First Token  | **0.493 s**           | 0.419 s             | 0.500 s             | 0.679 s                 |
| Llama2 Output Tokens Per Second    | **83.653 tokens/s**   | 134.502 tokens/s    | 92.853 tokens/s     | 78.532 tokens/s         |
| Llama2 Overall Duration            | **35.703s**           | 23.018 s            | 32.448 s            | 38.923 s                |

## **UL Procyon:** **AI Image Generation**

The [Procyon AI Image Generation Benchmark](https://www.storagereview.com/procyon-ai-text-and-image-generation-benchmark) offers a consistent, accurate way to measure AI inference performance across various hardware, from low-power NPUs to high-end GPUs. It includes three tests: Stable Diffusion XL (FP16) for high-end GPUs, Stable Diffusion 1.5 (FP16) for moderately powerful GPUs, and Stable Diffusion 1.5 (INT8) for low-power devices. The benchmark uses the optimal inference engine for each system, ensuring fair and comparable results.

In this AI image generation benchmark, the RTX 5080 delivered a strong performance but still trailed the higher-tier RTX 5090 and 4090\. In the **Stable Diffusion 1.5 (FP16)** test, the RTX 5080 scored 4,650, slightly ahead of the 6000 Ada’s 4,230 but behind the 5090 (8,193) and 4090 (5,260). The 5080’s image generation speed was slower than the 5090 and 4090, taking 1.344 seconds per image compared to 0.763 seconds for the 5090 and 1.188 seconds for the 4090, but still faster than the 6000 Ada (1.477 seconds).

For the **Stable Diffusion 1.5 (INT8)** test, the RTX 5080 scored 55,683, trailing the 5090 (79,272) and 4090 (62,160) but ahead of the 6000 Ada (55,901). The 5080’s image generation speed (0.561 seconds per image) was slower than the 5090 (0.394 seconds) and 4090 (0.503 seconds) but slightly ahead of the 6000 Ada (0.559 seconds).

In the **Stable Diffusion XL (FP16)** test, the 5080 scored 4,257\. Once again, it was outperformed by the 5090 (7,179) and 4090 (5,025) but noticeably ahead of the 6000 Ada (3,043). The 5080’s image generation speed of 8.808 seconds per image is slower than that of the 5090 (5.223 seconds) and 4090 (7.461 seconds) but faster than that of the 6000 Ada (12.323 seconds).

While the RTX 5080 consistently trailed the higher-end models, it maintained a competitive edge over the 6000 Ada across all (Overall Score) tests, delivering solid image generation performance at a relatively lower price point.

| **UL Procyon: AI Image Generation (overall score: higher is better)** | **NVIDIA RTX 5080** | **NVIDIA RTX 5090** | **NVIDIA RTX 4090** | **NVIDIA RTX 6000 Ada** |
| --------------------------------------------------------------------- | ------------------- | ------------------- | ------------------- | ----------------------- |
| Stable Diffusion 1.5 (FP16) – Overall Score                           | **4,650**           | 8,193               | 5,260               | 4,230                   |
| Stable Diffusion 1.5 (FP16) – Overall Time                            | **21.503 s**        | 12.204 s            | 19.011 s            | 23.639 s                |
| Stable Diffusion 1.5 (FP16) – Image Generation Speed                  | **1.344 s/image**   | 0.763 s/image       | 1.188 s/image       | 1.477 s/image           |
| Stable Diffusion 1.5 (INT8) – Overall Score                           | **55,683**          | 79,272              | 62,160              | 55,901                  |
| Stable Diffusion 1.5 (INT8) – Overall Time                            | **4.490 s**         | 3.154 s             | 4.022 s             | 4.472 s                 |
| Stable Diffusion 1.5 (INT8) – Image Generation Speed                  | **0.561 s/image**   | 0.394 s/image       | 0.503 s/image       | 0.559 s/image           |
| Stable Diffusion XL (FP16) – Overall Score                            | **4,257**           | 7,179               | 5,025               | 3,043                   |
| Stable Diffusion XL (FP16) – Overall Time                             | **140.928s**        | 83.573 s            | 119.379 s           | 197.172 s               |
| Stable Diffusion XL (FP16) – Image Generation Speed                   | **8.808 s/image**   | 5.223 s/image       | 7.461 s/image       | 12.323 s/image          |

## Luxmark

Luxmark is a GPU benchmark that uses LuxRender, an open-source ray tracing renderer, to evaluate a system’s performance in handling highly detailed 3D scenes. This benchmark is pertinent for assessing the graphical rendering prowess of servers and workstations, especially for visual effects and architectural visualization applications, where accurate light simulation is critical.

In the Luxmark benchmark, the RTX 5080 scored 13,637 in the **“Food”** scene, falling behind the RTX 5090, which scored 23,141\. The RTX 4090 also outperformed the 5080 with a score of 17,171\. The RTX 6000 Ada scored 14,873, slightly ahead of the 5080\. In the **“Hall”** scene, the 5080 scored 30,815, trailing the 5090’s 51,725 and the 4090’s 38,887\. However, it performs slightly better than the RTX 6000 Ada, which scored 32,132\. While the RTX 5080 doesn’t match the higher-end models, it does perform closely to the 6000 Ada, especially in both the Food and Hall scenes.

| **Luxmark (higher is better)** | **NVIDIA RTX 5080** | **NVIDIA RTX 5090** | **NVIDIA RTX 4090** | **NVIDIA RTX 6000 Ada** |
| ------------------------------ | ------------------- | ------------------- | ------------------- | ----------------------- |
| Food Score                     | **13,637**          | 23,141              | 17,171              | 14,873                  |
| Hall Score                     | **30,815**          | 51,725              | 38,887              | 32,132                  |

## **Geekbench 6**

[Geekbench 6](https://www.geekbench.com/ "Opens in a new window") is a cross-platform benchmark that measures overall system performance. The Geekbench Browser allows you to compare any system to it.

The Geekbench 6 results indicated that the RTX 5080 achieved a GPU OpenCL score of 265,397\. It trailed significantly behind the higher-tier RTX 5090, which scored 374,807\. The RTX 4090 and RTX 6000 Ada performed similarly, scoring 333,384 and 336,882, respectively. The 5080’s score is notably lower, falling 41,423 points behind the 4090, indicating a clear performance gap compared to the 90 series cards and 6000 ada models in this benchmark.

| **Geekbench (higher is better)** | **NVIDIA RTX 5080** | **NVIDIA RTX 5090** | **NVIDIA RTX 4090** | **NVIDIA RTX 6000 Ada** |
| -------------------------------- | ------------------- | ------------------- | ------------------- | ----------------------- |
| GPU OpenCL Score                 | **265,397**         | 374,807             | 333,384             | 336,882                 |

## V-Ray

The [V-Ray](https://www.chaos.com/vray/benchmark) Benchmark measures rendering performance for CPUs, NVIDIA GPUs, or both using advanced V-Ray 6 engines. It uses quick tests and a simple scoring system to let users evaluate and compare their systems’ rendering capabilities. It’s an essential tool for professionals seeking efficient performance insights.

The V-Ray benchmark concluded that the RTX 5080 performed well with a paths score of 9,311\. While the higher-tier RTX 5090 leads with 14,764 paths, the 5080’s performance was within a 1,000-point difference of the RTX 4090’s 10,847 paths and the RTX 6000 Ada’s 10,766 paths, showing that it competes closely in this test.

| **V-Ray (higher is better)** | **NVIDIA RTX 5080** | **NVIDIA RTX 5090** | **NVIDIA RTX 4090** | **NVIDIA RTX 6000 Ada** |
| ---------------------------- | ------------------- | ------------------- | ------------------- | ----------------------- |
| vpaths                       | **9,311**           | 14,764              | 10,847              | 10,766                  |

## NVIDIA GeForce RTX 5080 Power Consumption

Power consumption is a significant component of any high-end computing platform. Each new generation of GPU consumes more power under load, meaning larger power supplies and ample airflow for cooling. However, there is another aspect to power regarding performance: faster GPUs might spike higher, but the duration of each workload decreases.

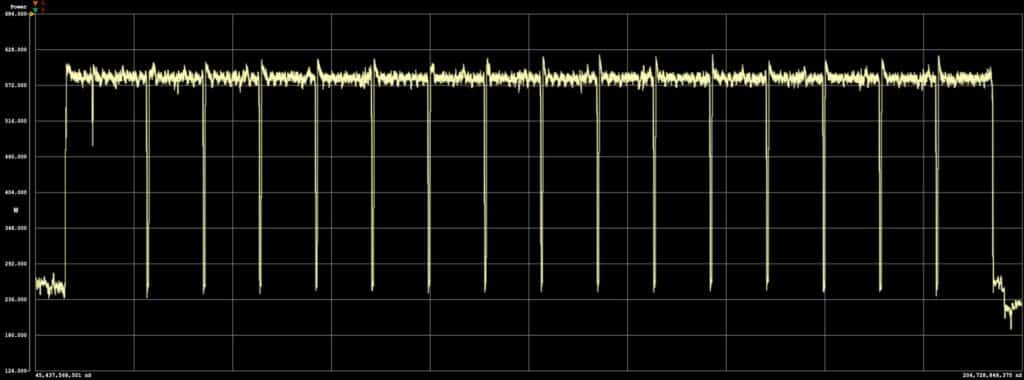
NVIDIA discussed the improved power efficiency of the Blackwell architecture during the Editor’s Day at CES 2025, which we wanted to see play out in an AI-driven workload. Leveraging the [Quarch Mains Analyzer](https://www.storagereview.com/review/quarch-qtl2843-iec-mains-power-analysis-module-review) in our test lab, we measured the total system power consumed while running the [Procyon AI Image Generator](https://www.storagereview.com/procyon-ai-text-and-image-generation-benchmark) Stable Diffusion XL FP16 test. This workload pushed each GPU to its power limits, with defined start and stop points for each generated image being readily visible. Here, [we cover the new GeForce RTX 5090 results against the prior-generation GeForce RTX 4090 and RTX 6000 Ada.](https://www.storagereview.com/review/nvidia-geforce-rtx-5090-review-pushing-boundaries-with-ai-acceleration)

The NVIDIA GeForce RTX 5080 has a listed peak power draw of 360W. While running the Procyon AI image-generating test, the system power increased from 239W as the test was preparing to 584W when the GPU was put under load, an uptick of 345W. We measured the energy needed to create the second-to-last image in the test, which took 8.7 seconds and used 1.39Wh of energy.

![]() 

## **Conclusion**

The NVIDIA GeForce RTX 5080 is the sweet spot in the 50-series lineup, offering cutting-edge features and excellent performance at a more approachable price point. It’s ideal for graphics-heavy use cases that need the latest advancements in AI-driven workloads without splurging on the flagship RTX 5090\. For those who require the absolute best, the 5090 is the way to go—but for everyone else, the RTX 5080 is likely to be the most popular option.

In terms of price, NVIDIA lists the GeForce RTX 5080 at $999, which is half the price of the GeForce RTX 5090\. What’s most surprising, though, is when you look at the range from the previous generation 40-series models, the GeForce RTX 5080 has a lower entry price than the GeForce RTX 4080, which is listed at $1,199\. So, while the RTX 5090 will still command a significant chunk of change, the RTX 5080 has an attractive price for those who want the latest feature set. It also has the added benefit of drawing less power than the GeForce RTX 4090, so for buyers with platforms that can support a 450W but not a 575W GPU, the RTX 5080 can slot in without hardware changes needed.

![]() 

Regarding performance, we grouped it against the GeForce RTX 5090, GeForce RTX 4090, and RTX 6000 Ada. The NVIDIA GeForce RTX 5080 performed surprisingly well against the top previous-generation consumer and workstation offerings. While it doesn’t beat the GeForce RTX 4090 in our AI workloads, it doesn’t trail far behind. The RTX 5080 slips further in rendering workloads but performs well against cards at a much higher price point.

Overall, the NVIDIA GeForce RTX 5080 offers a lot of value at an attractive $999 list price, making it a good choice for rendering, AI, or gaming workloads.

[NVIDIA Product Page](https://www.nvidia.com/en-us/geforce/graphics-cards/50-series/rtx-5080/)

**Engage with StorageReview**

[Newsletter](https://www.storagereview.com/storage%5Fnewsletter) | [YouTube](https://www.youtube.com/user/StorageReview "Opens in a new window") | Podcast [iTunes](https://podcasts.apple.com/gb/podcast/storagereview-com-storage-reviews/id1060681115 "Opens in a new window")/[Spotify](https://open.spotify.com/show/1y6VnznABhHeOSMOmbDTz0 "Opens in a new window") | [Instagram](https://www.instagram.com/storagereview/ "Opens in a new window") | [Twitter](https://twitter.com/storagereview "Opens in a new window") | [TikTok](https://www.tiktok.com/@storagereview? "Opens in a new window") | [RSS Feed](https://www.storagereview.com/rss.xml)

![]()

### Kevin OBrien and Divyansh Jain

Previous post: [Emulex Secure HBAs: The New Standard for In-Flight Network Encryption](https://www.storagereview.com/review/emulex-secure-hbas-the-new-standard-for-in-flight-network-encryption)

Next post: [Maximizing Value with Recertified Hard Drives](https://www.storagereview.com/review/maximizing-value-with-recertified-hard-drives)

Trusted Vendors

Products and solutions from our affiliate partners:

* [ ![Ubiquiti Logo](https://www.storagereview.com/wp-content/uploads/2024/11/2-1.webp) Ubiquiti ](https://store.ui.com/us/en?a%5Faid=StorageReview "Opens in a new window")
* [ ![Newegg Logo](https://www.storagereview.com/wp-content/uploads/2025/11/newegg.webp) Newegg ](https://click.linksynergy.com/fs-bin/click?id=g5terNMDhz0&offerid=1207190.18&subid=0&type=4 "Opens in a new window")
* [ ![Amazon Logo](https://www.storagereview.com/wp-content/uploads/2025/11/amazon.webp) Amazon ](https://amzn.to/4fLJUEW "Opens in a new window")

Newsletter

Subscribe to the StorageReview newsletter to stay up to date on the latest news and reviews. We promise no spam!

1  

Leave this field empty if you’re human: 

## Advertisement

Content Categories

[ Facebook ](https://www.facebook.com/@storagereview) [ X ](https://twitter.com/storagereview) [ Instagram ](https://www.instagram.com/storagereview/) [ LinkedIn ](https://www.linkedin.com/company/storagereview-com) [ YouTube ](https://www.youtube.com/user/storagereview?sub%5Fconfirmation=1) [ Email ](mailto:info@storagereview.com) [ Spotify ](https://open.spotify.com/show/1y6VnznABhHeOSMOmbDTz0) [ Reddit ](https://www.reddit.com/r/StorageReview/) [ Discord ](https://discord.gg/TwMHb4azdC) [ RSS ](https://www.storagereview.com/rss.xml) [ TikTok ](https://www.tiktok.com/@storagereview) 

Copyright © 1998-2025 Flying Pig Ventures, LLC Cincinnati, Ohio. All rights reserved.

Manage your privacy

To provide the best experiences, we and our partners use technologies like cookies to store and/or access device information. Consenting to these technologies will allow us and our partners to process personal data such as browsing behavior or unique IDs on this site and show (non-) personalized ads. Not consenting or withdrawing consent, may adversely affect certain features and functions.

Click below to consent to the above or make granular choices. Your choices will be applied to this site only. You can change your settings at any time, including withdrawing your consent, by using the toggles on the Cookie Policy, or by clicking on the manage consent button at the bottom of the screen.

Functional Functional Always active 

The technical storage or access is strictly necessary for the legitimate purpose of enabling the use of a specific service explicitly requested by the subscriber or user, or for the sole purpose of carrying out the transmission of a communication over an electronic communications network. 

Preferences Preferences 

The technical storage or access is necessary for the legitimate purpose of storing preferences that are not requested by the subscriber or user. 

Statistics Statistics 

The technical storage or access that is used exclusively for statistical purposes. The technical storage or access that is used exclusively for anonymous statistical purposes. Without a subpoena, voluntary compliance on the part of your Internet Service Provider, or additional records from a third party, information stored or retrieved for this purpose alone cannot usually be used to identify you. 

Marketing Marketing 

The technical storage or access is required to create user profiles to send advertising, or to track the user on a website or across several websites for similar marketing purposes. 

Statistics

Marketing

Features

Always active

Always active

* [Manage options](#)
* [Manage services](#)
* [Manage {vendor\_count} vendors](#)
* [Read more about these purposes](https://cookiedatabase.org/tcf/purposes/)

Accept Deny Manage options Save preferences [Manage options](#) 

* [{title}](#)
* [{title}](#)
* [{title}](#)

Manage your privacy

To provide the best experiences, we use technologies like cookies to store and/or access device information. Consenting to these technologies will allow us to process data such as browsing behavior or unique IDs on this site. Not consenting or withdrawing consent, may adversely affect certain features and functions.

Functional Functional Always active 

The technical storage or access is strictly necessary for the legitimate purpose of enabling the use of a specific service explicitly requested by the subscriber or user, or for the sole purpose of carrying out the transmission of a communication over an electronic communications network. 

Preferences Preferences 

The technical storage or access is necessary for the legitimate purpose of storing preferences that are not requested by the subscriber or user. 

Statistics Statistics 

The technical storage or access that is used exclusively for statistical purposes. The technical storage or access that is used exclusively for anonymous statistical purposes. Without a subpoena, voluntary compliance on the part of your Internet Service Provider, or additional records from a third party, information stored or retrieved for this purpose alone cannot usually be used to identify you. 

Marketing Marketing 

The technical storage or access is required to create user profiles to send advertising, or to track the user on a website or across several websites for similar marketing purposes. 

Statistics

Marketing

Features

Always active

Always active

* [Manage options](#)
* [Manage services](#)
* [Manage {vendor\_count} vendors](#)
* [Read more about these purposes](https://cookiedatabase.org/tcf/purposes/)

Accept Deny Manage options Save preferences [Manage options](#) 

* [{title}](#)
* [{title}](#)
* [{title}](#)

Manage consent Manage consent

```json
{"@context":"https:\/\/schema.org","@graph":[{"@type":"WebPage","@id":"https:\/\/www.storagereview.com\/review\/nvidia-geforce-rtx-5080-review-the-sweet-spot-for-ai-workloads","url":"https:\/\/www.storagereview.com\/review\/nvidia-geforce-rtx-5080-review-the-sweet-spot-for-ai-workloads","name":"NVIDIA GeForce RTX 5080 Review: The Sweet Spot for AI Workloads - StorageReview.com","isPartOf":{"@id":"https:\/\/www.storagereview.com\/#website"},"primaryImageOfPage":{"@id":"https:\/\/www.storagereview.com\/review\/nvidia-geforce-rtx-5080-review-the-sweet-spot-for-ai-workloads#primaryimage"},"image":{"@id":"https:\/\/www.storagereview.com\/review\/nvidia-geforce-rtx-5080-review-the-sweet-spot-for-ai-workloads#primaryimage"},"thumbnailUrl":"https:\/\/www.storagereview.com\/wp-content\/uploads\/2025\/01\/StorageReview-NVIDIA-GeForce-RTX-5080-2.jpg","datePublished":"2025-01-29T14:02:34+00:00","dateModified":"2025-01-29T14:56:33+00:00","description":"NVIDIA GeForce RTX 5080 Review: Launch on January 30, 2025 at $999. Is the 5080 the sweet spot for gaming, rendering and AI workloads?","breadcrumb":{"@id":"https:\/\/www.storagereview.com\/review\/nvidia-geforce-rtx-5080-review-the-sweet-spot-for-ai-workloads#breadcrumb"},"inLanguage":"en-US","potentialAction":[{"@type":"ReadAction","target":["https:\/\/www.storagereview.com\/review\/nvidia-geforce-rtx-5080-review-the-sweet-spot-for-ai-workloads"]}]},{"@type":"ImageObject","inLanguage":"en-US","@id":"https:\/\/www.storagereview.com\/review\/nvidia-geforce-rtx-5080-review-the-sweet-spot-for-ai-workloads#primaryimage","url":"https:\/\/www.storagereview.com\/wp-content\/uploads\/2025\/01\/StorageReview-NVIDIA-GeForce-RTX-5080-2.jpg","contentUrl":"https:\/\/www.storagereview.com\/wp-content\/uploads\/2025\/01\/StorageReview-NVIDIA-GeForce-RTX-5080-2.jpg","width":1500,"height":946},{"@type":"BreadcrumbList","@id":"https:\/\/www.storagereview.com\/review\/nvidia-geforce-rtx-5080-review-the-sweet-spot-for-ai-workloads#breadcrumb","itemListElement":[{"@type":"ListItem","position":1,"name":"Home","item":"https:\/\/www.storagereview.com\/"},{"@type":"ListItem","position":2,"name":"Review","item":"https:\/\/www.storagereview.com\/review"},{"@type":"ListItem","position":3,"name":"NVIDIA GeForce RTX 5080 Review: The Sweet Spot for AI Workloads"}]},{"@type":"WebSite","@id":"https:\/\/www.storagereview.com\/#website","url":"https:\/\/www.storagereview.com\/","name":"StorageReview.com","description":"StorageReview.com is a leading provider of news and reviews throughout the entire IT stack - from the datacenter to the edge, and all points in between.","publisher":{"@id":"https:\/\/www.storagereview.com\/#organization"},"potentialAction":[{"@type":"SearchAction","target":{"@type":"EntryPoint","urlTemplate":"https:\/\/www.storagereview.com\/?s={search_term_string}"},"query-input":{"@type":"PropertyValueSpecification","valueRequired":true,"valueName":"search_term_string"}}],"inLanguage":"en-US"},{"@type":"Organization","@id":"https:\/\/www.storagereview.com\/#organization","name":"StorageReview.com","url":"https:\/\/www.storagereview.com\/","logo":{"@type":"ImageObject","inLanguage":"en-US","@id":"https:\/\/www.storagereview.com\/#\/schema\/logo\/image\/","url":"https:\/\/www.storagereview.com\/wp-content\/uploads\/2020\/02\/Storage-Reviews-2-2.png","contentUrl":"https:\/\/www.storagereview.com\/wp-content\/uploads\/2020\/02\/Storage-Reviews-2-2.png","width":344,"height":61,"caption":"StorageReview.com"},"image":{"@id":"https:\/\/www.storagereview.com\/#\/schema\/logo\/image\/"},"sameAs":["https:\/\/x.com\/storagereview","http:\/\/youtube.com\/user\/storagereview"]}]}
```