

The Dell EMC Unity family of storage is designed to meet the needs of the midrange customer with a variety of options including hybrid, all-flash and VSA deployment options. Dell EMC Unity storage generally takes over for the previous EMC VNX family. To say it’s an evolution of VNX, though, isn’t entirely accurate; EMC completely revamped the interface and continued ease-of-use and deployment developments that largely got underway with the VNXe in 2014. The interface is totally new, and the underlying code has been updated as well. The Unity array consists of a 2U chassis with dual-active/active controllers powered by Intel Xeon processors and 25 2.5″ drive bays (there is also an option for 12 3.5″ bays for the hybrid version). Systems scale up for more capacity and Dell EMC leverages TLC flash in the SSDs to help drive affordability. The systems support block, file, and VMware VVols with concurrent support for native NAS, iSCSI, and Fibre Channel protocols. The all-flash systems (or hybrid with an all-flash pool) include data reduction features for further TCO gains. All Dell EMC Unity arrays can tier to the cloud easily and offer cloud-based analytics via CloudIQ with no additional investment.
Unity is all about simplicity and ease of use. Having a powerful array that is extremely difficult to use or integrate into existing infrastructure is not nearly as useful as something that can be easily deployed and managed. On the deployment side of things, Dell EMC says a unit can be deployed in under 10 minutes. On the software/management side of things, Unity utilizes a modern HTML5 task-oriented interface that can easily integrate with VMware and Microsoft environments. The latest OS offers compression, enhancements for improved all-flash efficiency, and data-in-place storage controller upgrades. Deduplication is available in the next release and is a no-charge, non-disruptive upgrade. Another feature of Unity is CloudIQ, Dell EMC’s cloud-based proactive monitoring and smart analytics application.
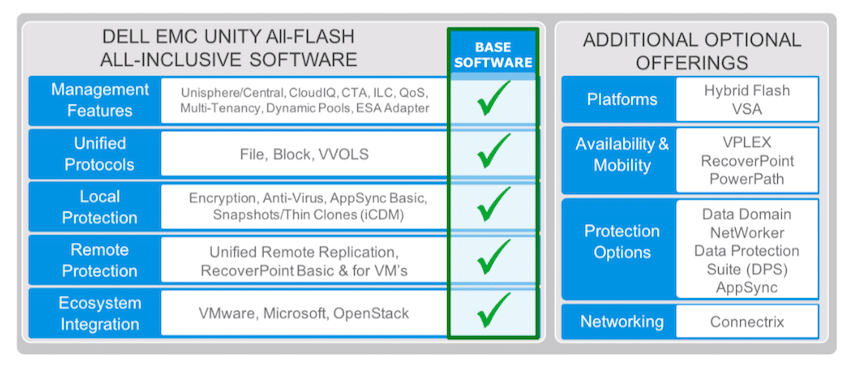
Unity supports a large variety of various software suites, plug-ins, drivers, and packs. Part of Unity’s all-inclusive base software are management software (including Unisphere: Element Manager, Unisphere Central: Consolidated dashboard and alerting, CloudIQ: Cloud-based storage analytics, Thin Provisioning, and Dynamic Pools, among others), unified protocols (file, block, and VVols), local protection (optional Controller-Based Encryption) with self-managed or external key management, Local Point-In-Time Copies (Snapshots and Thin Clones), AppSync Basic and Dell EMC Common Event Enabler (AntiVirus Agent, Event Publishing Agent), and remote protection (Native Asynchronous Block & File Replication, Native Synchronous Block Replication, Snapshot Shipping, Dell EMC RecoverPoint Basic, and Dell EMC RecoverPoint for VMs).
The increasing numbers, from 350F, 450F, 550F, to 650F, indicate the increase in total flash storage and CPU performance that can be put into each Unity unit and/or its expansion. The 450F we are reviewing here is aimed more at the midrange with a maximum raw capacity of 4PB. The next size up, the 550F, doubles that capacity to 8PB and the size above that, the 650F, again doubles the total to 16PB. The Unity family supports several SSDs and capacities including 400GB, 800GB, 1.6TB, 1.92TB, 3.84TB, 7.68TB, and 15.36TB. Obviously, the maximum raw capacity is reflective of the highest capacity SSDs being leveraged.
Unity (and all of its benefits) isn’t just limited to a physical appliance. Dell EMC has also released UnityVSA (Virtual Storage Appliance). Users can save on costs by simply deploying UnityVSA on an existing VMware ESXi server. Not only does this bring the benefits of Unity at a lower cost, organizations can use it for ROBO environments or as a cost-effective replication target.
Dell EMC Unity 450F Specifications
| Form Factor | 2U |
| Controller CPU (per array) | 2x Intel 10-core, 2.2GHz |
| Memory (per array) | 128GB |
| Drives per array | 25 x 2.5” |
| Max Raw Capacity | 4PB |
| Ports | |
| Embedded SAS IO Ports | 4 x 4 lane 12Gb/s SAS ports for BE Connection |
| Base 12 Gb/s SAS BE Buses | 2 x 4 Lane (per processor) |
| Max 12 Gb/s SAS BE Buses | 2 x 4 Lane (per processor) |
| Max FE (front end) Total Ports | 24 |
| Power | |
| AC Line Voltage | 100 to 240 VAC ± 10%, single phase, 47 to 63 Hz |
| AC Line Current | 10.18 A max at 100 VAC 5.09 A max at 200 VAC |
| Power Consumption | 1017.6 VA (981.0 W) max at 100 VAC 1017.6 VA (981.0 W) max at 200 VAC |
| Physical | |
| Weight | 24.60kg (54.11 lbs.) |
| HxWxD | 8.88 x 44.76 x 60.9 cm (3.5 x 17.62 x 24 in.) |
Build and Design
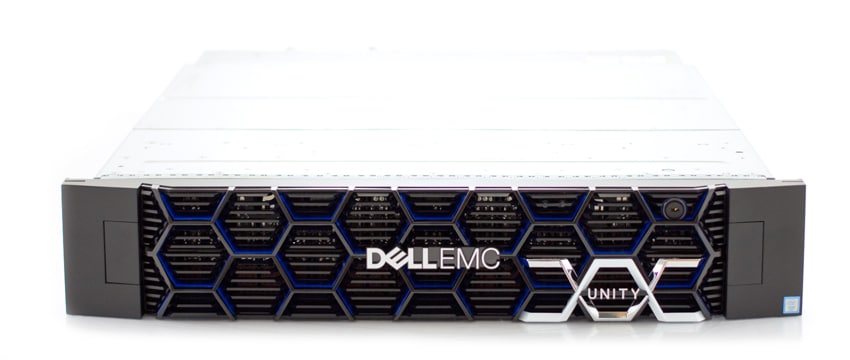
The Dell EMC Unity 450F All-Flash Storage is a two-controller array and 25-disk shelf within a 2U box. Across the front is the new highly stylized bezel design that Dell EMC rolled out with their new products over the second half of 2017. Company branding is in the center with the product name near the bottom right. The Bezel easily pops off to reveal the 25 front-loading drive bays, fitting in 1 more drive versus 24-bay platforms. While this doesn’t have a huge impact on performance, it allows for simple RAID group sizing, as well as room for an odd-numbered online spare.
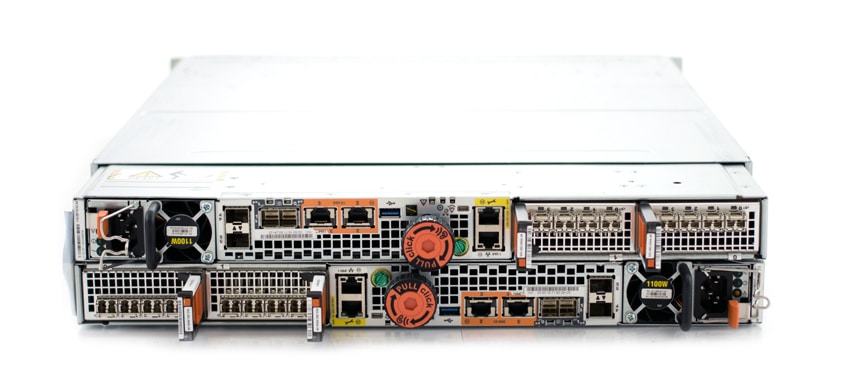
The rear of the Unity 450F is split into two mirrored sections, one on top of the other. Each side has power and a storage processor assembly, along with network ports and I/O module slots. In this configuration, we have 4 quad-port 16Gb FC modules, providing 8 ports per controller. Field servicing is made easy with a clearly defined orange pull color. For service techs, this makes swapping components less error prone, as they know exactly where to go to remove a certain component.
Management/UI
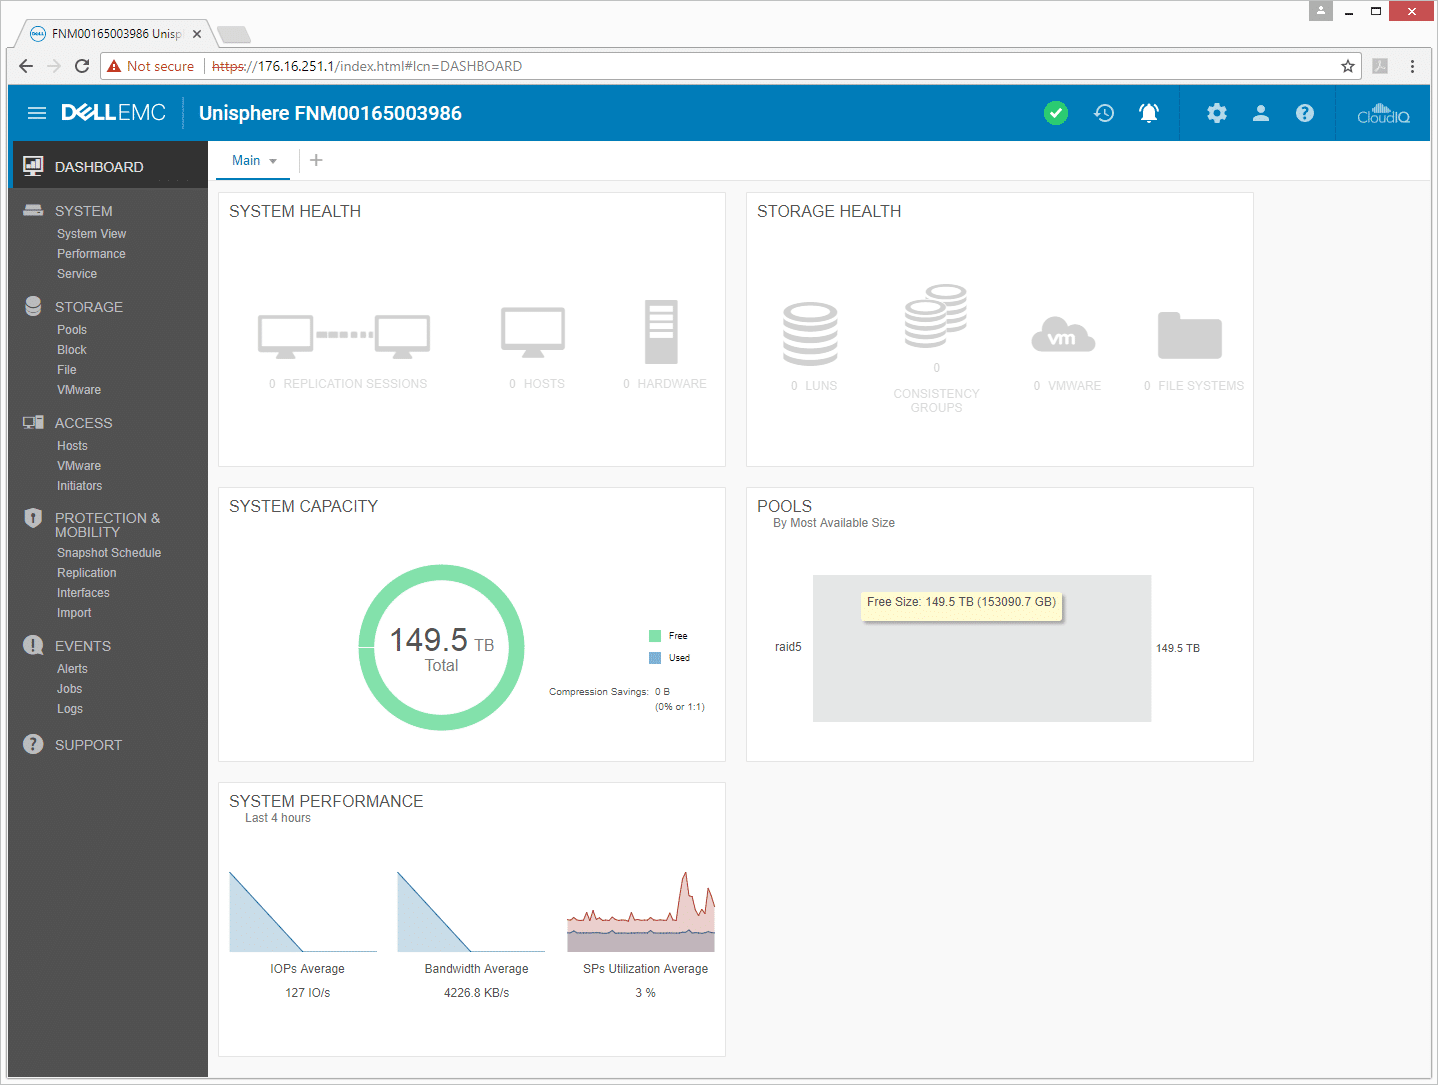
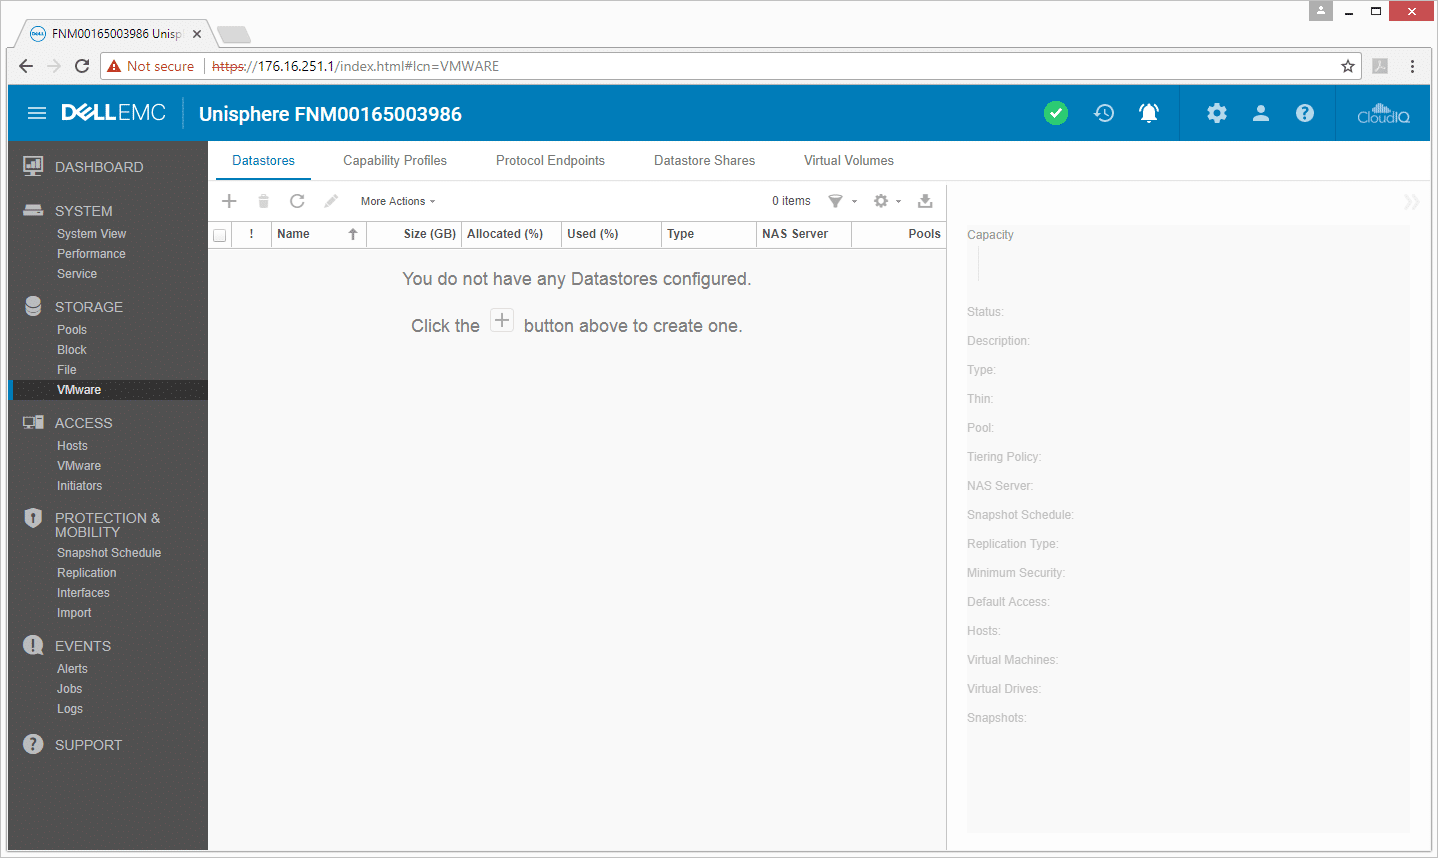
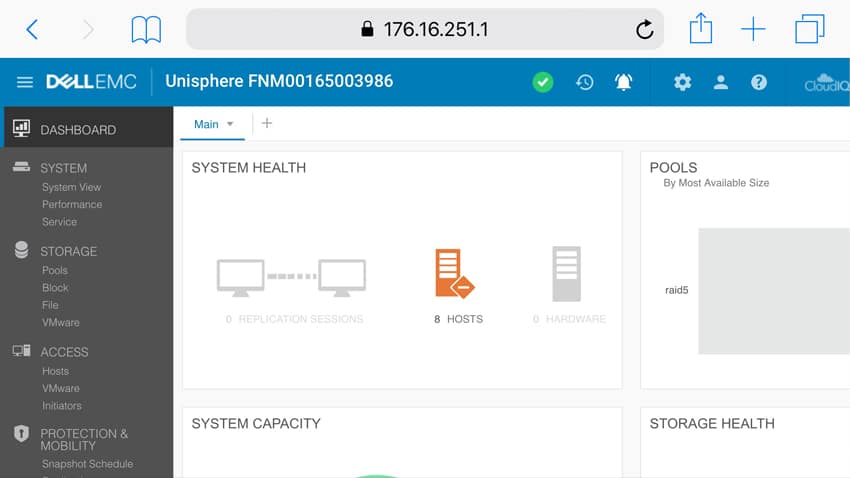
The Dell EMC Unity 450F uses Unisphere for management. The main page or Dashboard gives a brief overview of the system. Users can easily see System and Storage health, as well as capacity (free and used), pools, and performance. Along the left-hand side of the screen are menus (System, Storage, Access, Protection & Mobility, Events, and Support) and their submenus. Unisphere easily ranks as one of the most intuitive and integrated management platforms we’ve tested to date. Tasks such as creating new datastores are easier than ever, where Unisphere will create the storage, provision it onto your hosts automatically, and even make sure multi-pathing is correctly handled.
Under the System menu, there are options such as system view, performance, and service. The system view allows users to give a quick look over the entire system choosing front, rear, or top. This view quickly tells if the system or ports are running ok. If problems exist, the item is clearly labeled to minimize confusion when pulling components for replacement.
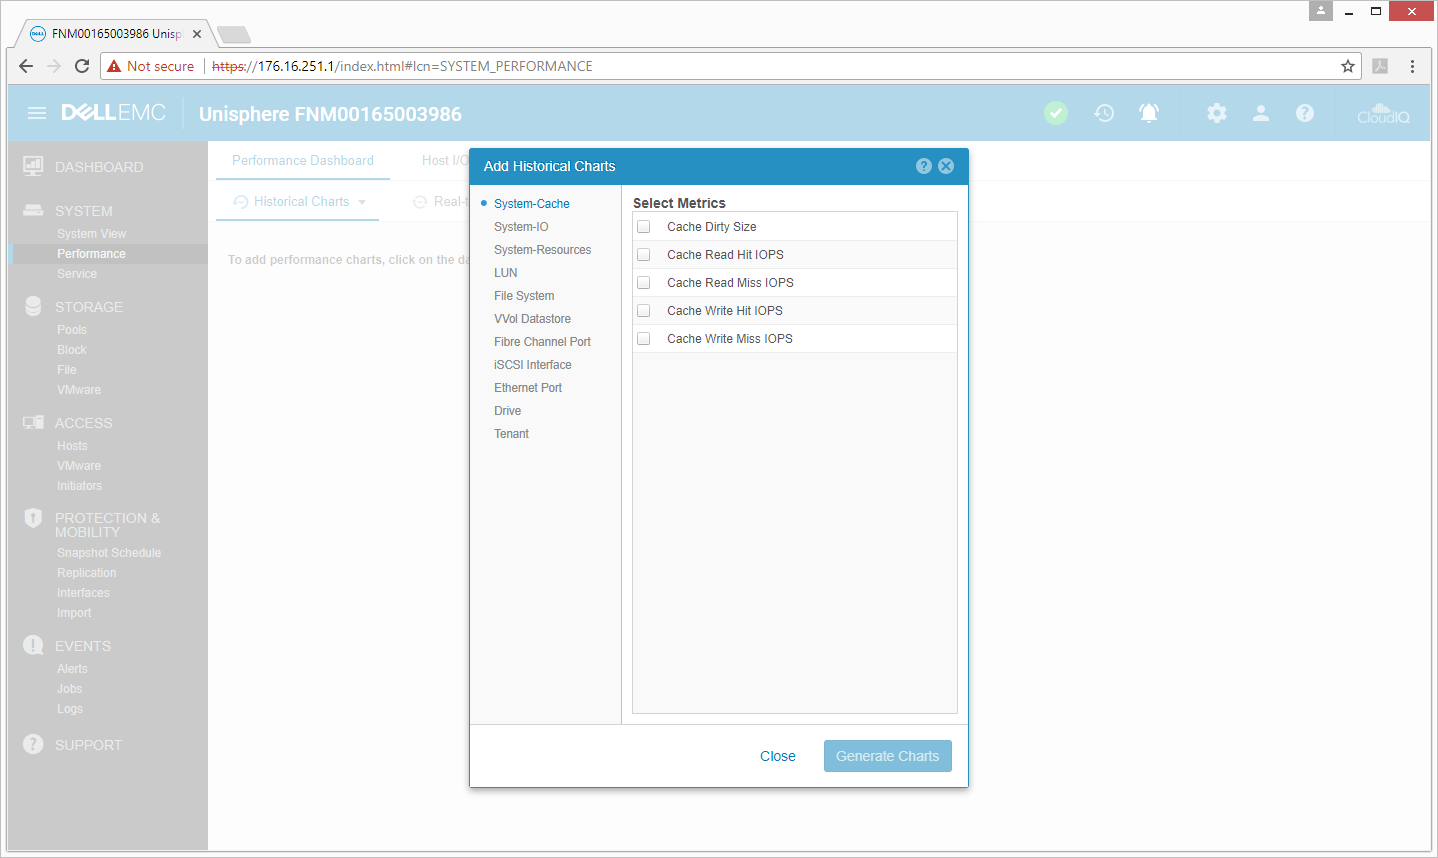
The performance submenu can give users historical or real-time charts. Users need to first select which aspects of the system or where they want to view performance, and then select the metrics they want to see. Not all systems handle live or historical metrics internally, so having this built in to Unisphere is very helpful when working through performance issues or making sure everything is running as it should.
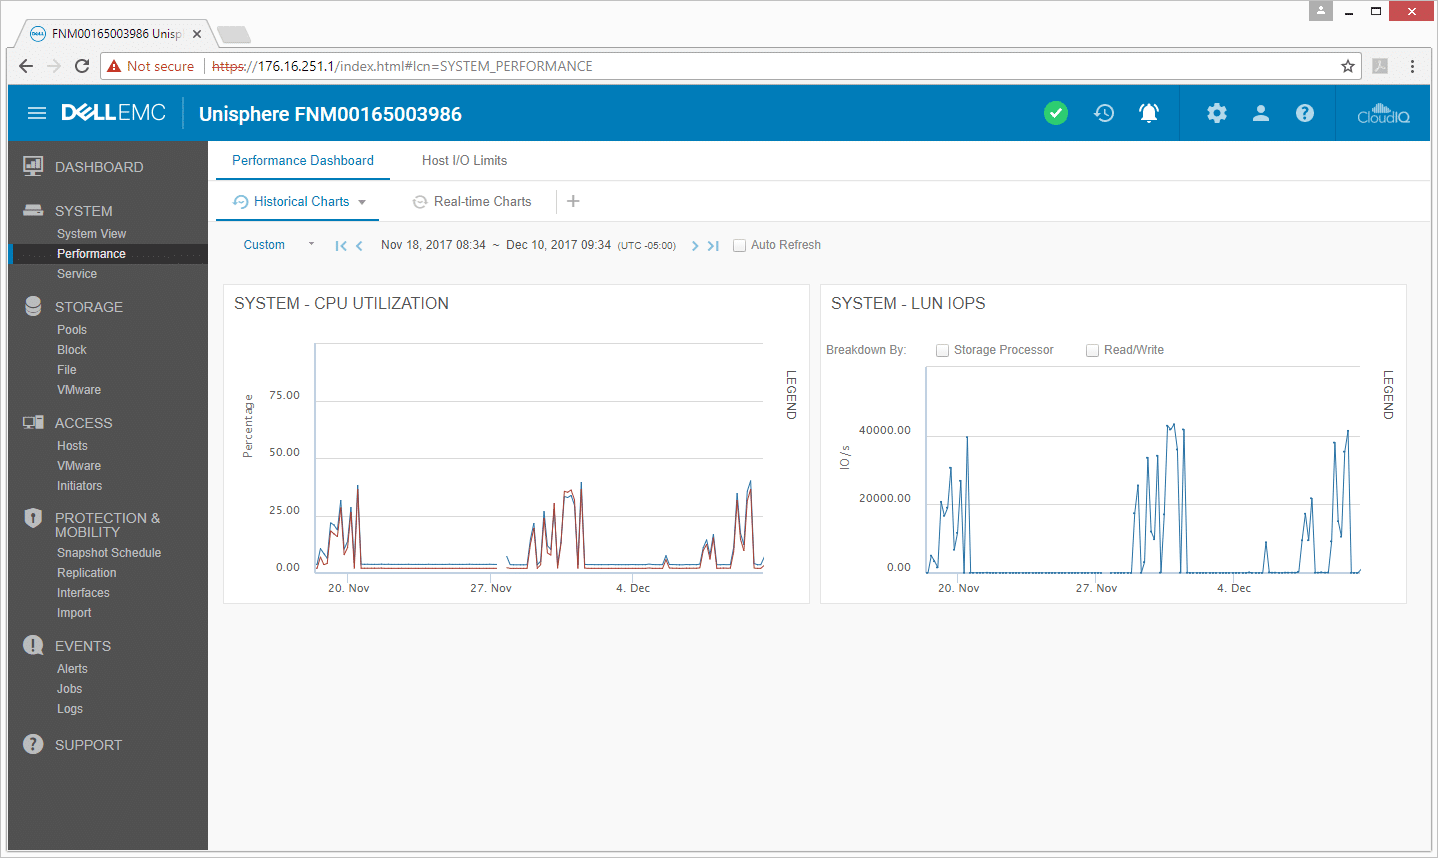
Once the metrics are selected, users can generate charts to see how performance was at a particular time. This can help to drill down and pinpoint issues that may have arisen. Historical charts have an auto-refresh option that updates their content every 60 seconds. Real-time charts allow for the same type of visibility, with 5-second updates to a selectable subset of key performance metrics.
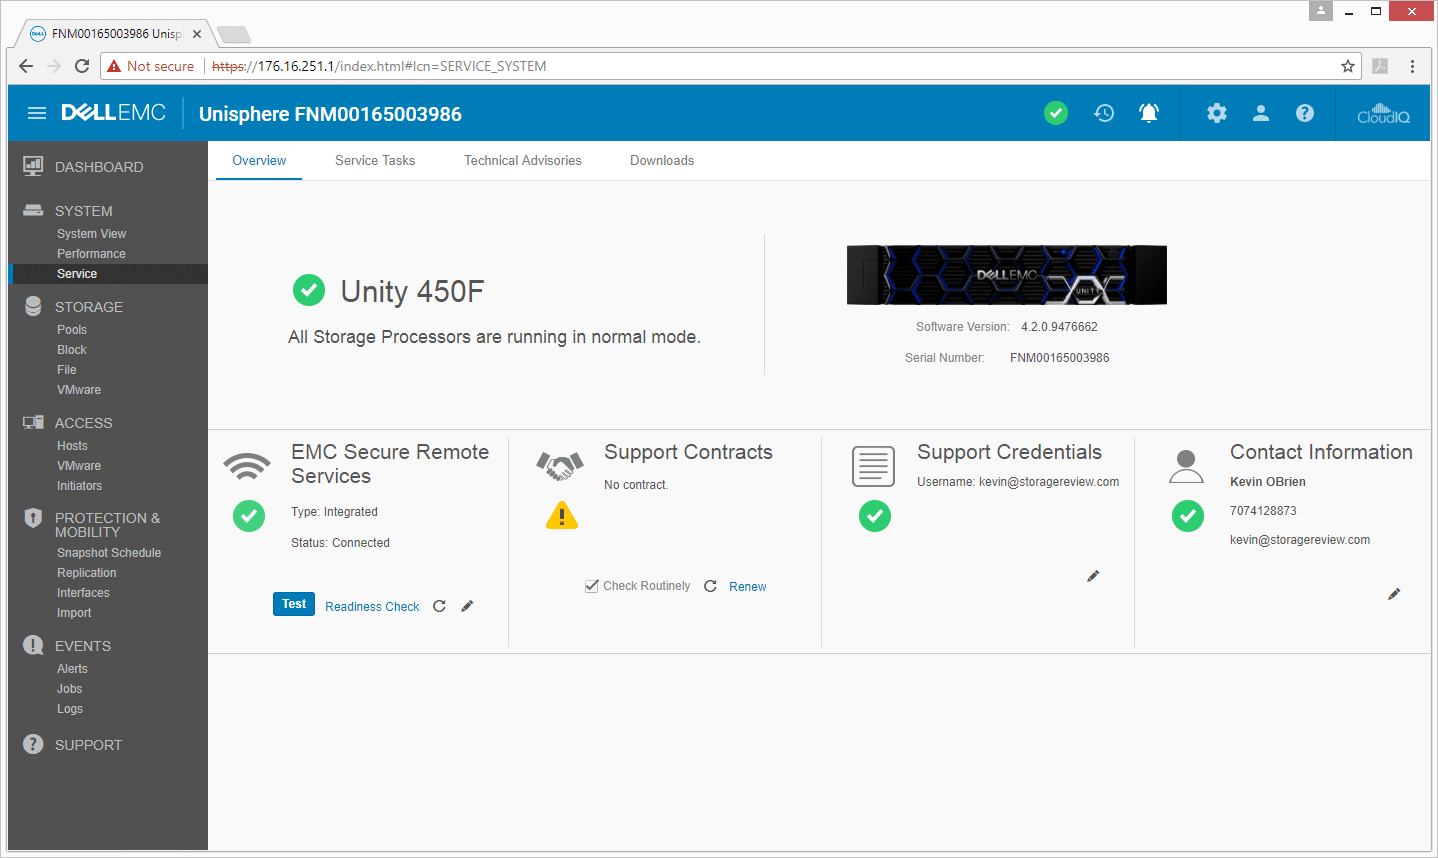
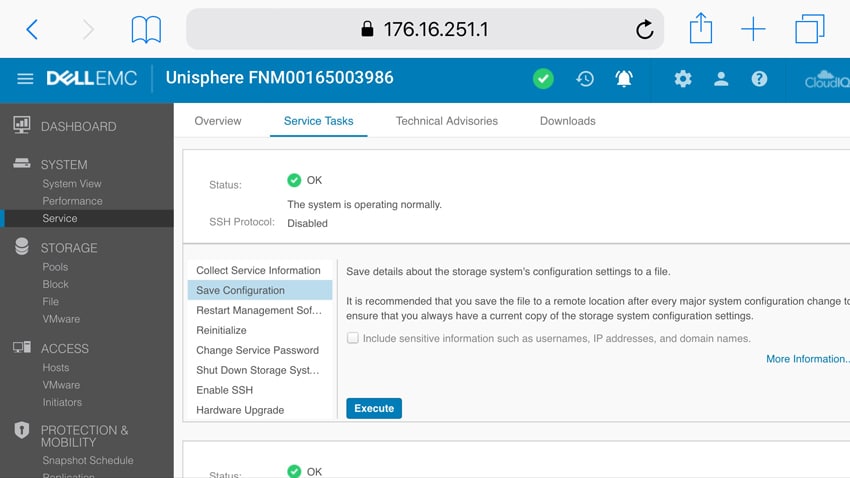
The service submenu gives a brief rundown on the system, its software version, and serial number. Beneath that, users have the ability to connect to EMC Secure Remote services, where experts can remotely address an issue. Users can also view any support contracts they may have. To the right of that, there are the support credentials and contact information for the support person on site. Again, this brings many of the core aspects of managing the array into one complete user interface, instead of multiple fragmented places.
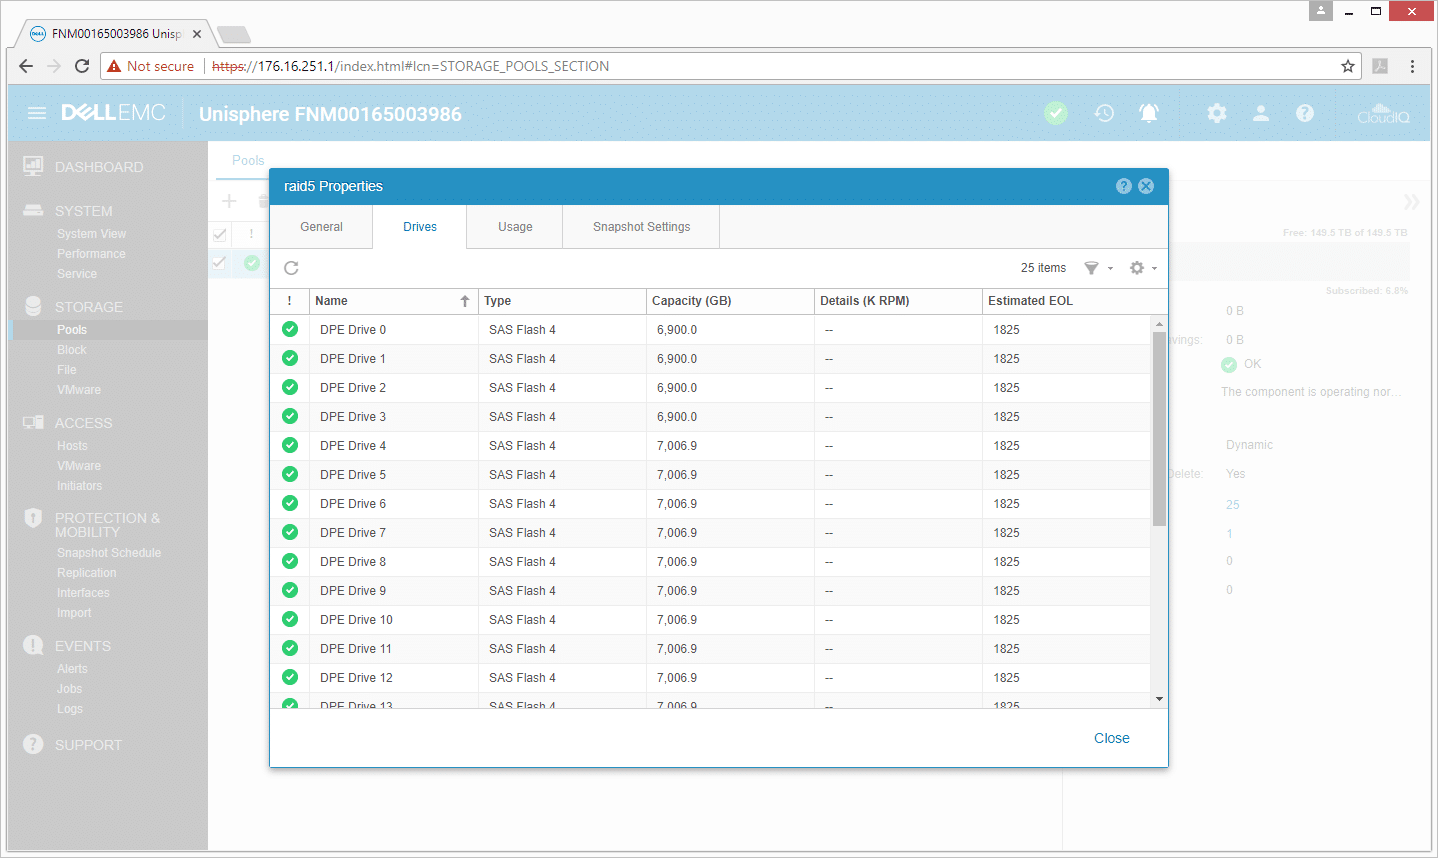
The next main menu is Storage with the submenus of pools, block, file, and VMware. As the name implies, the pools submenu lets admins drill down into each pool with general information, as well as the drives, usage, and snapshot settings.
The VMware submenu, under the Storage menu, allows users to easily create and configure new datastores. We will show over the next several steps how we quickly and easily created a datastore on our Dell EMC Unity 450F.
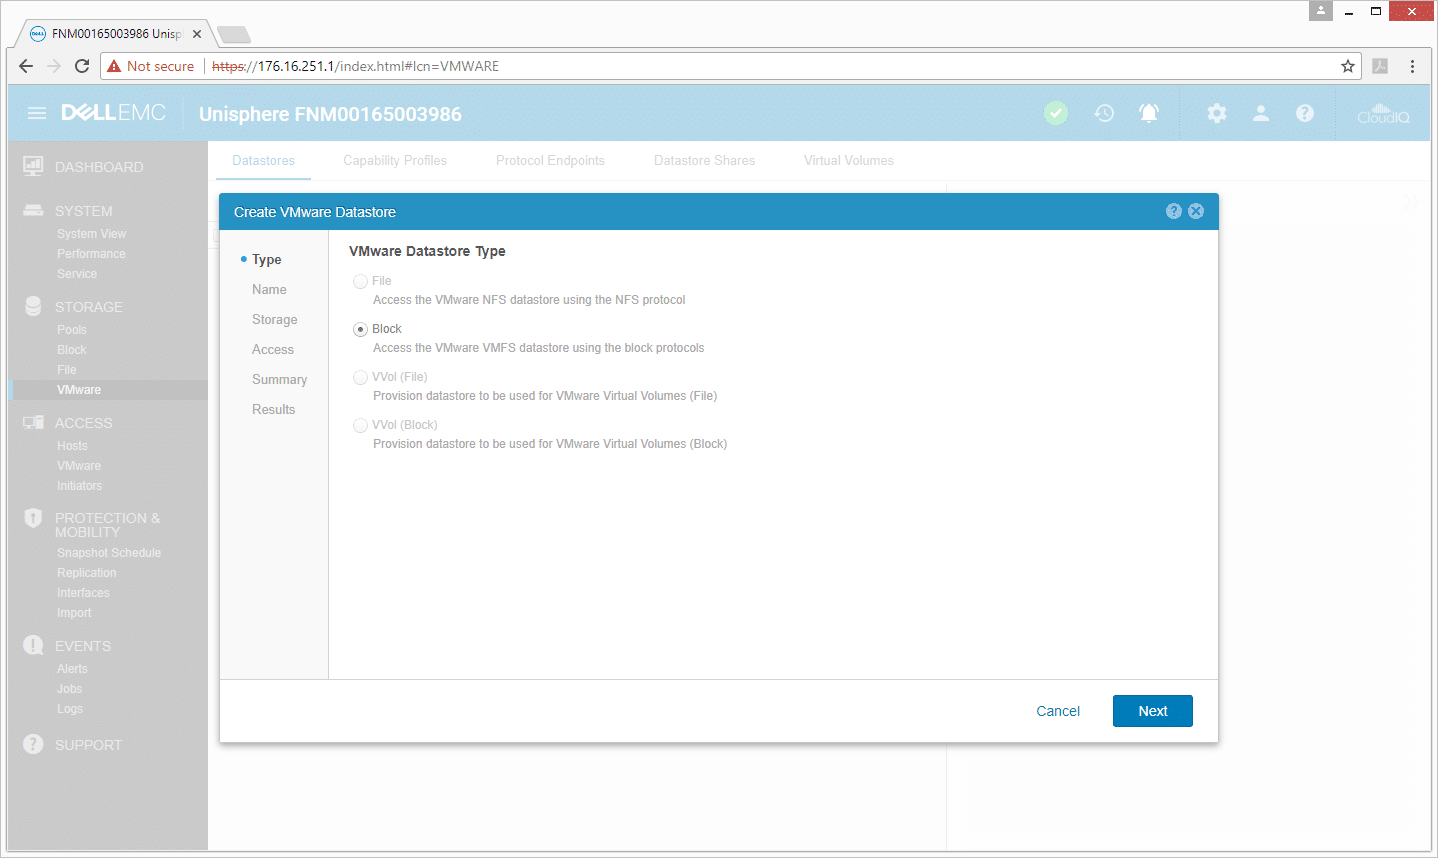
First, we clicked on the create button. Here, users will be prompted with a screen asking what type of datastore they are looking for: File, Block, VVol (File), or VVol (Block).
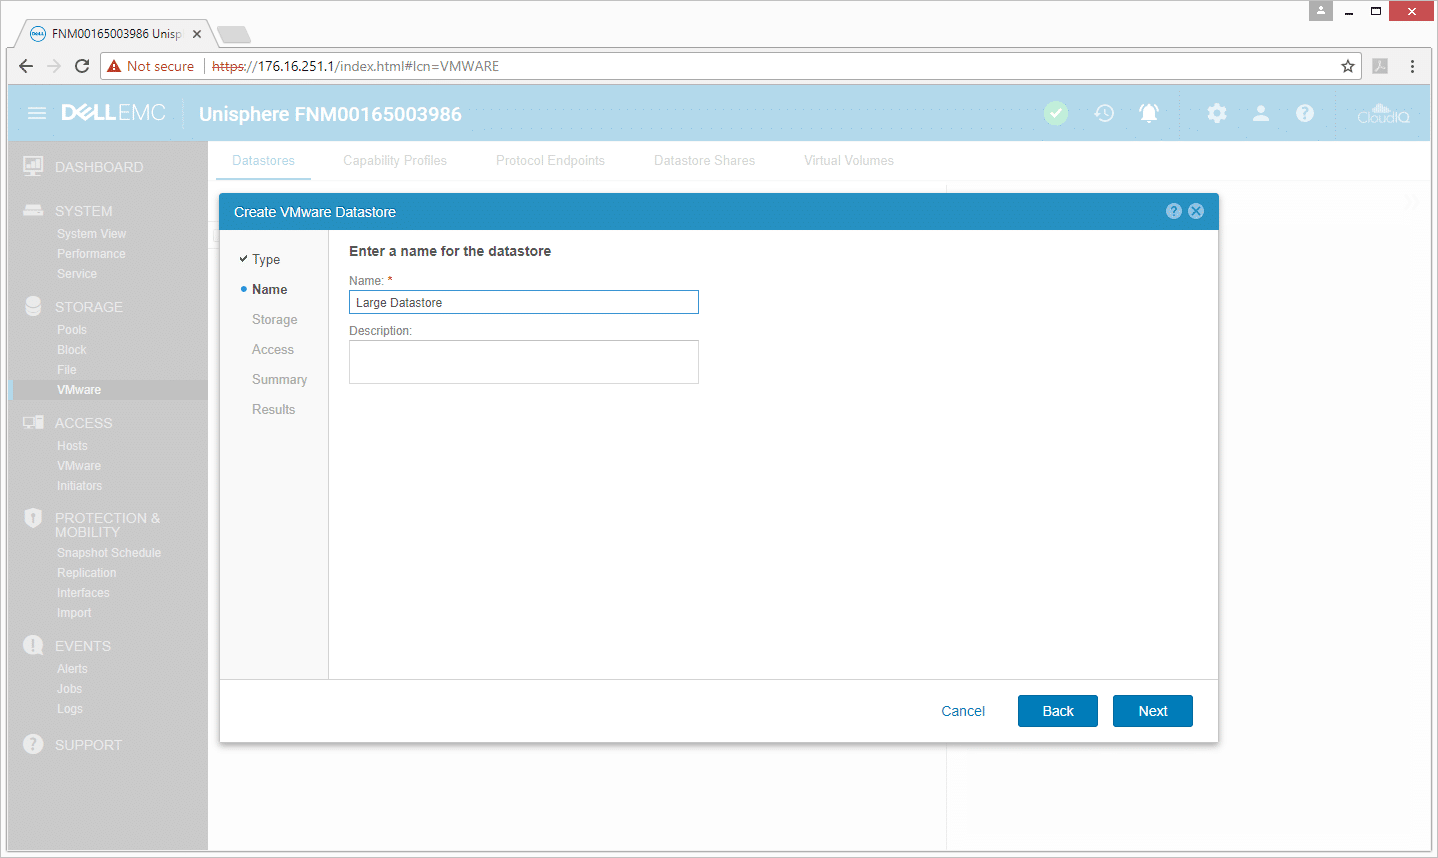
The next screen asks for a name and description. We named our datastore the imaginative “Large Datastore.”
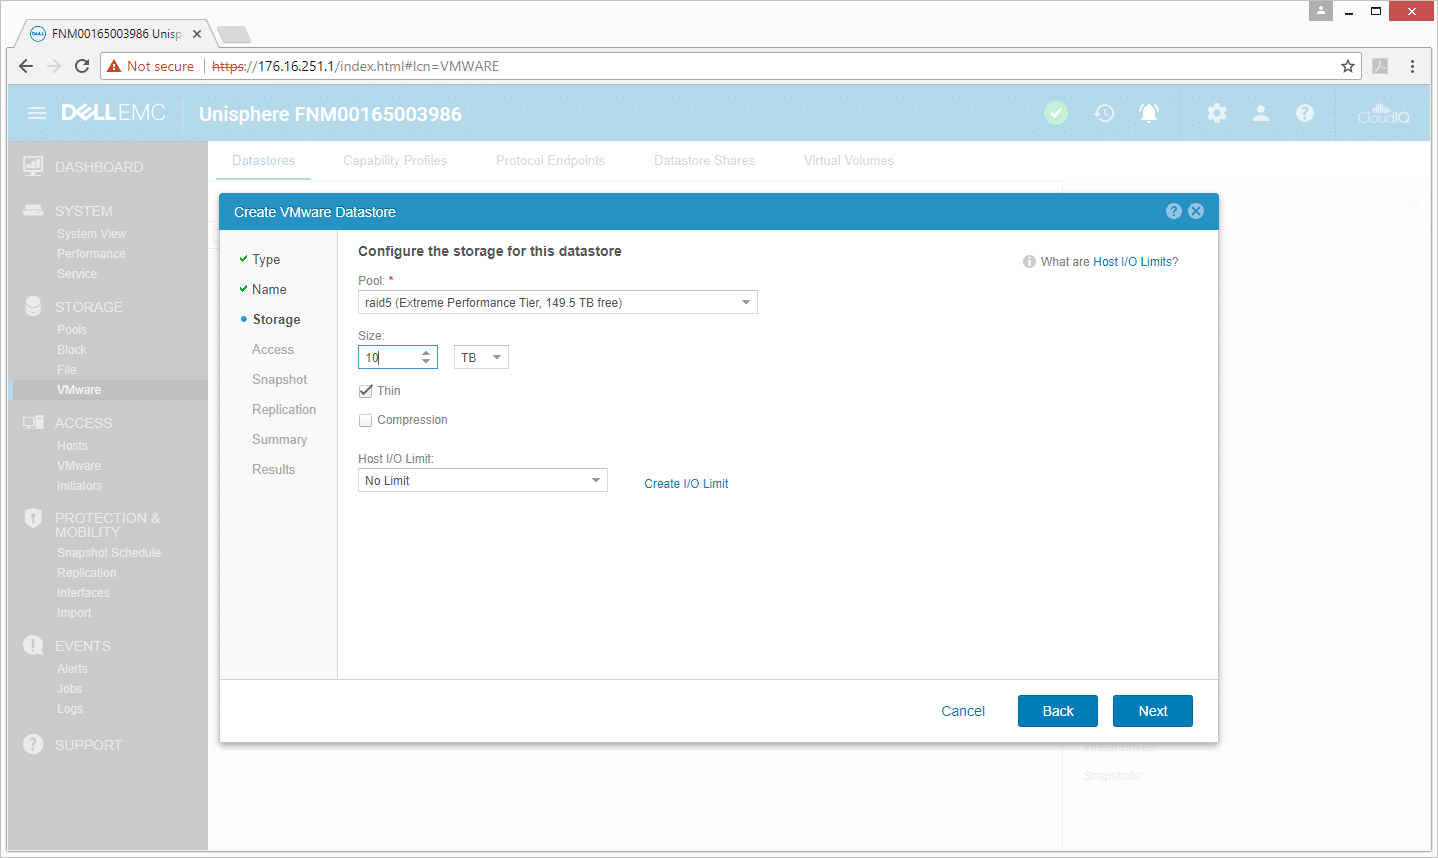
The next step in the setup is storage. To configure storage, one needs to select the pool it comes from, the size (we used 10TB), whether or not to turn on thin provisioning and compression, and the Host I/O limit (it can be set to no limit as well).
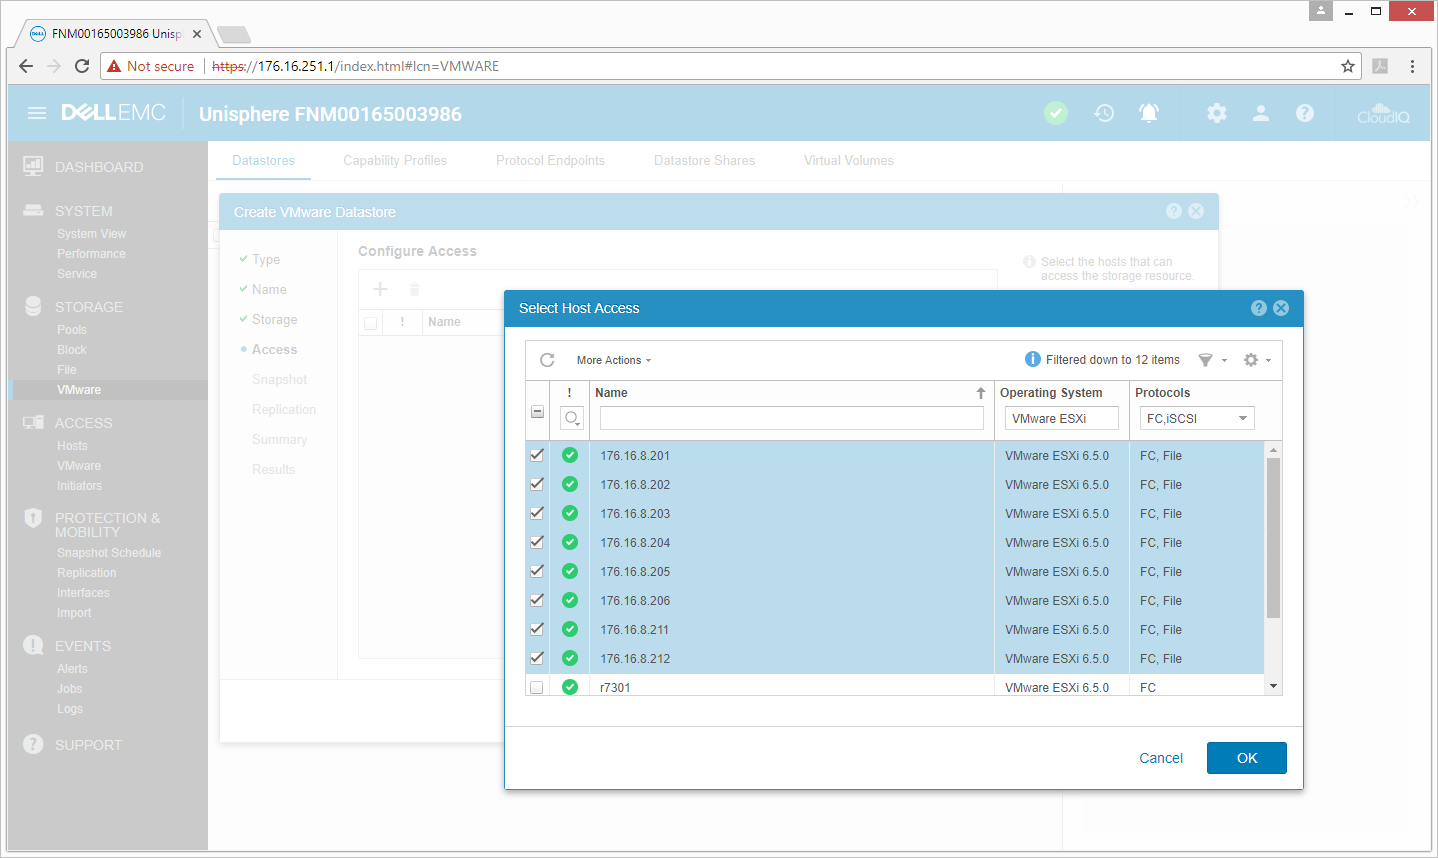
When setting up Access, users need to select which hosts have access. Unisphere generates a list of hosts that can be checked off or they can be searched for by name, operating system, or protocol. Systems are auto discovered, or pulled in through the VMware integration that we show further down in the review.
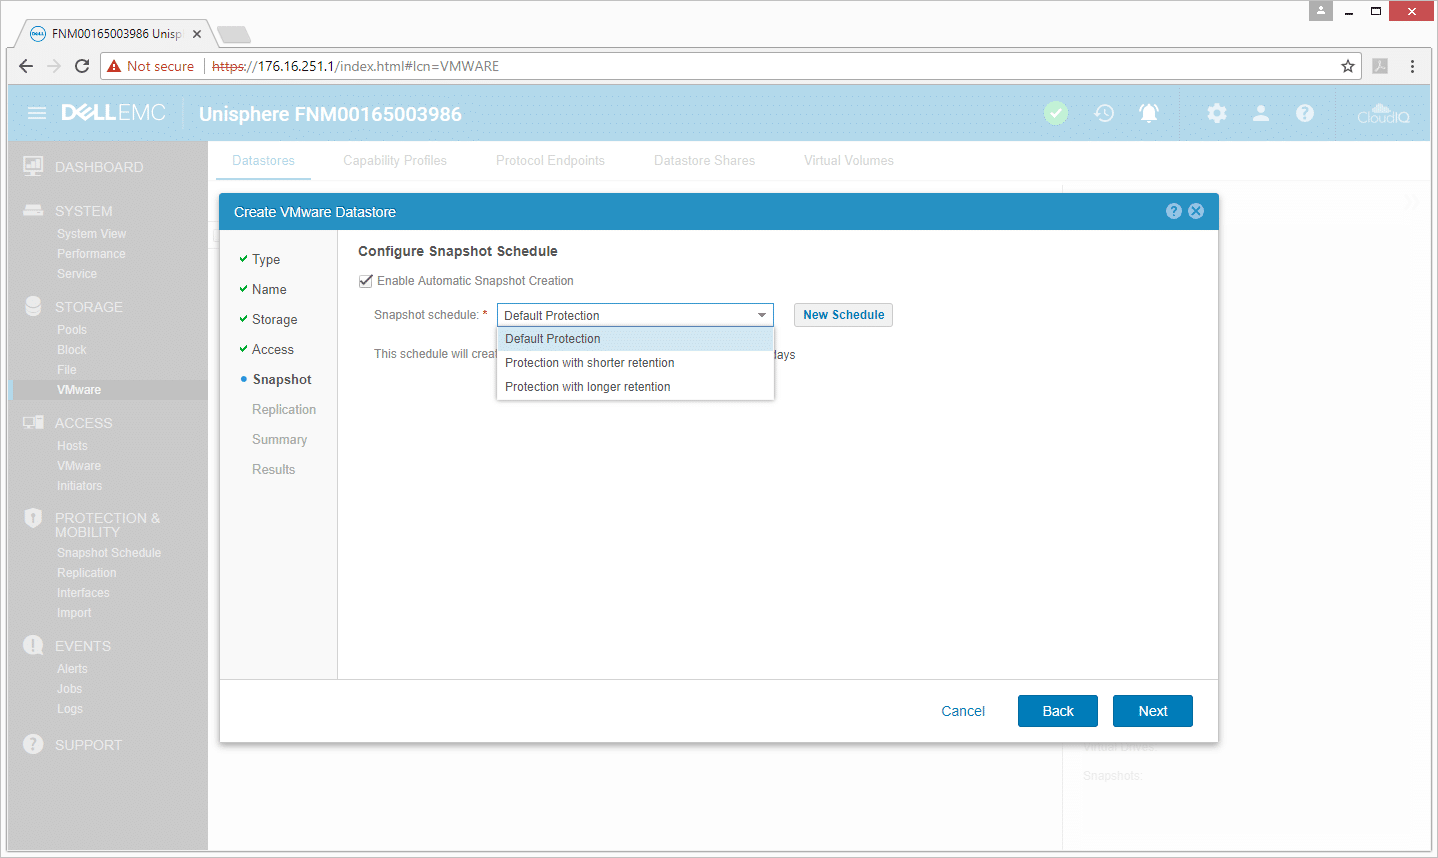
Snapshots can also be enabled or disabled. If they are enabled, the schedule needs to be set. Unity comes with a default setting, but it can be adjusted more or less depending on the needs of the organization.
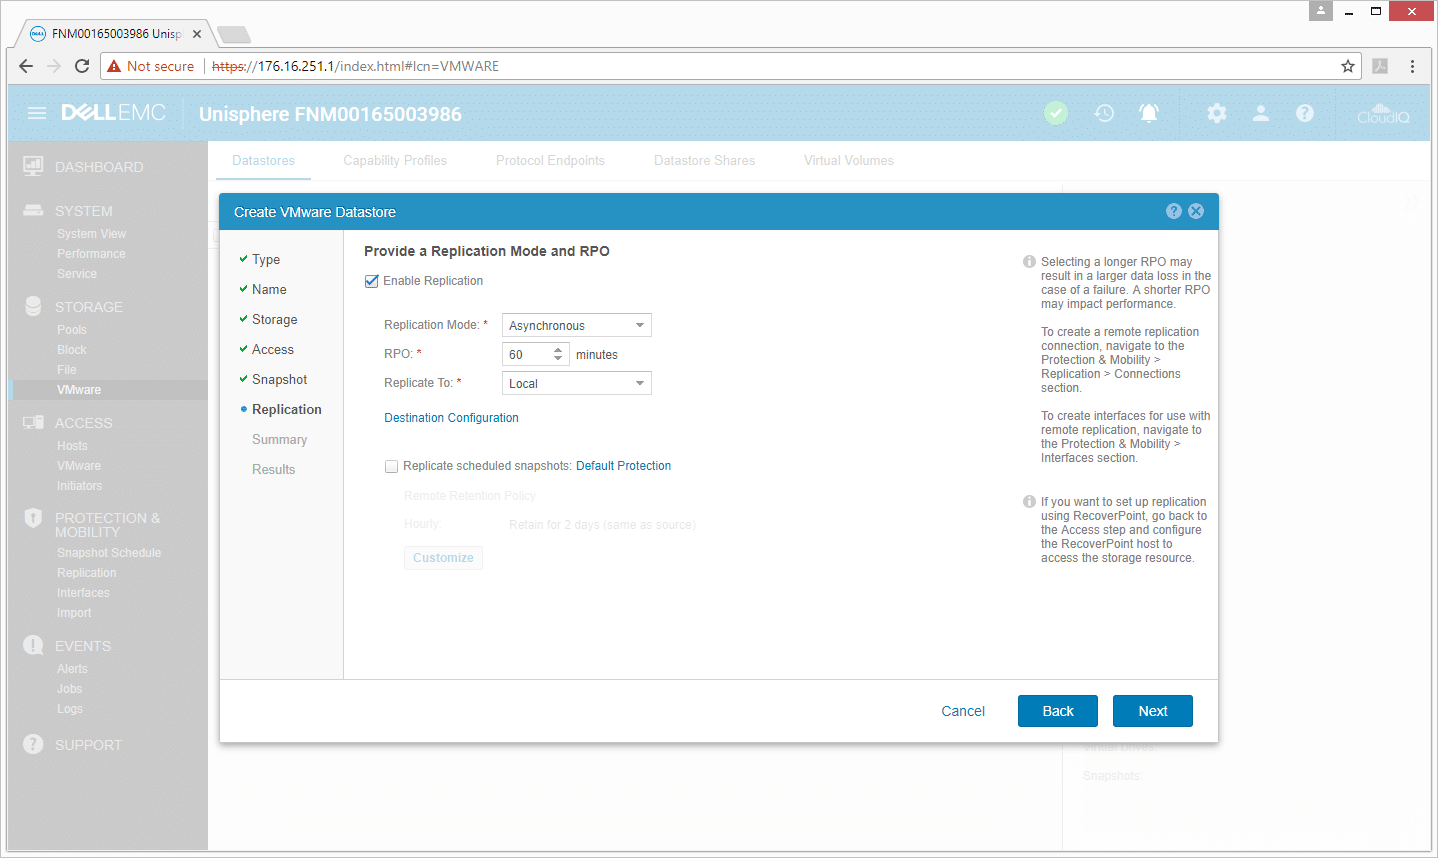
After setting up snapshots, it’s time to set up replication. Similar to the above, one must choose whether or not to enable it, and then choose the mode, the RPO, and where it will be replicated to. There is also an option for choosing to replicate scheduled snapshots.
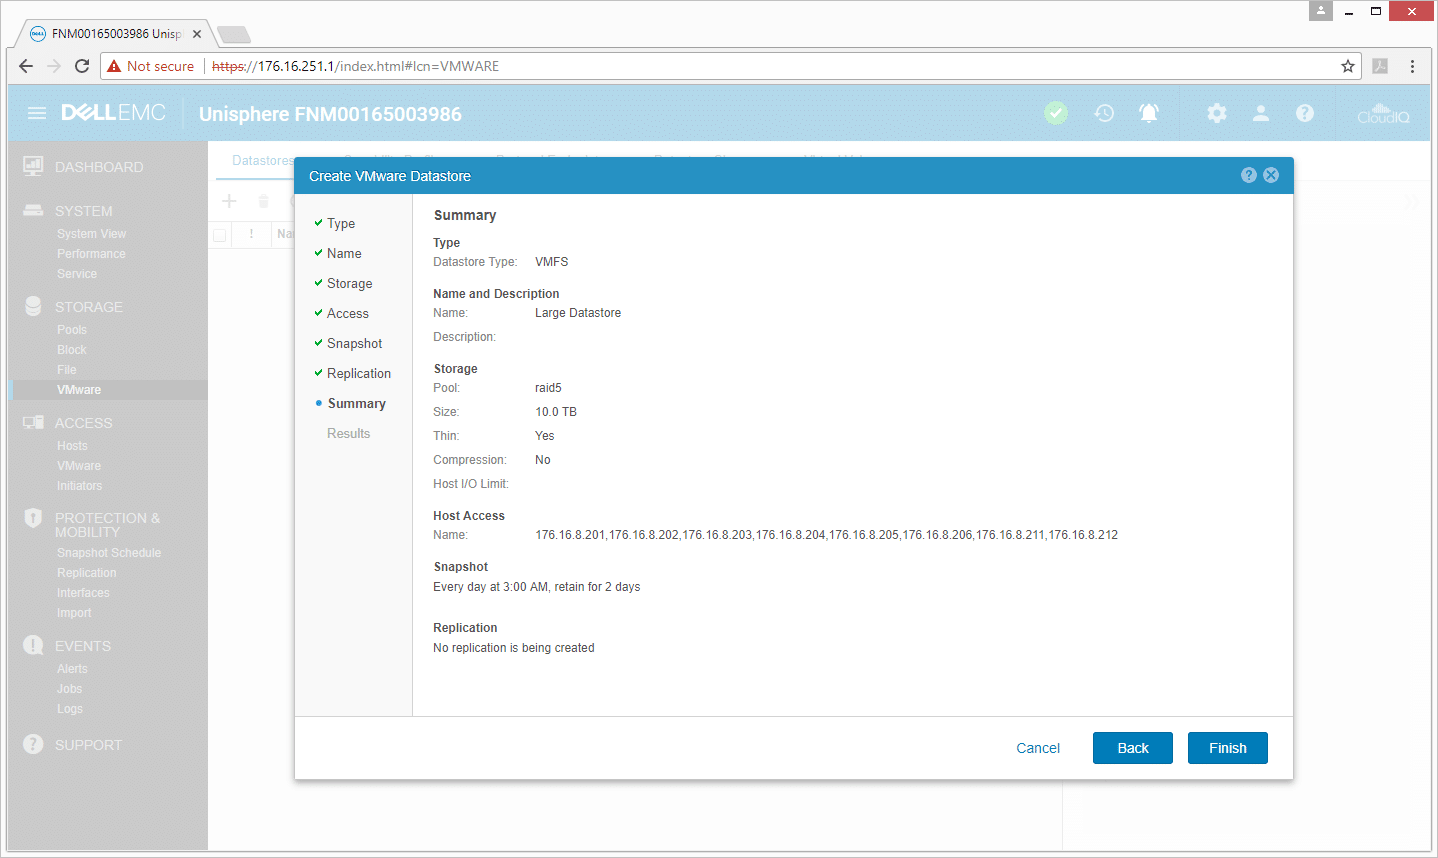
After everything is in, Unisphere generates a summary page. This is the last chance to go through and make sure everything is the way it needs to be. Once everything is correct, click finish.
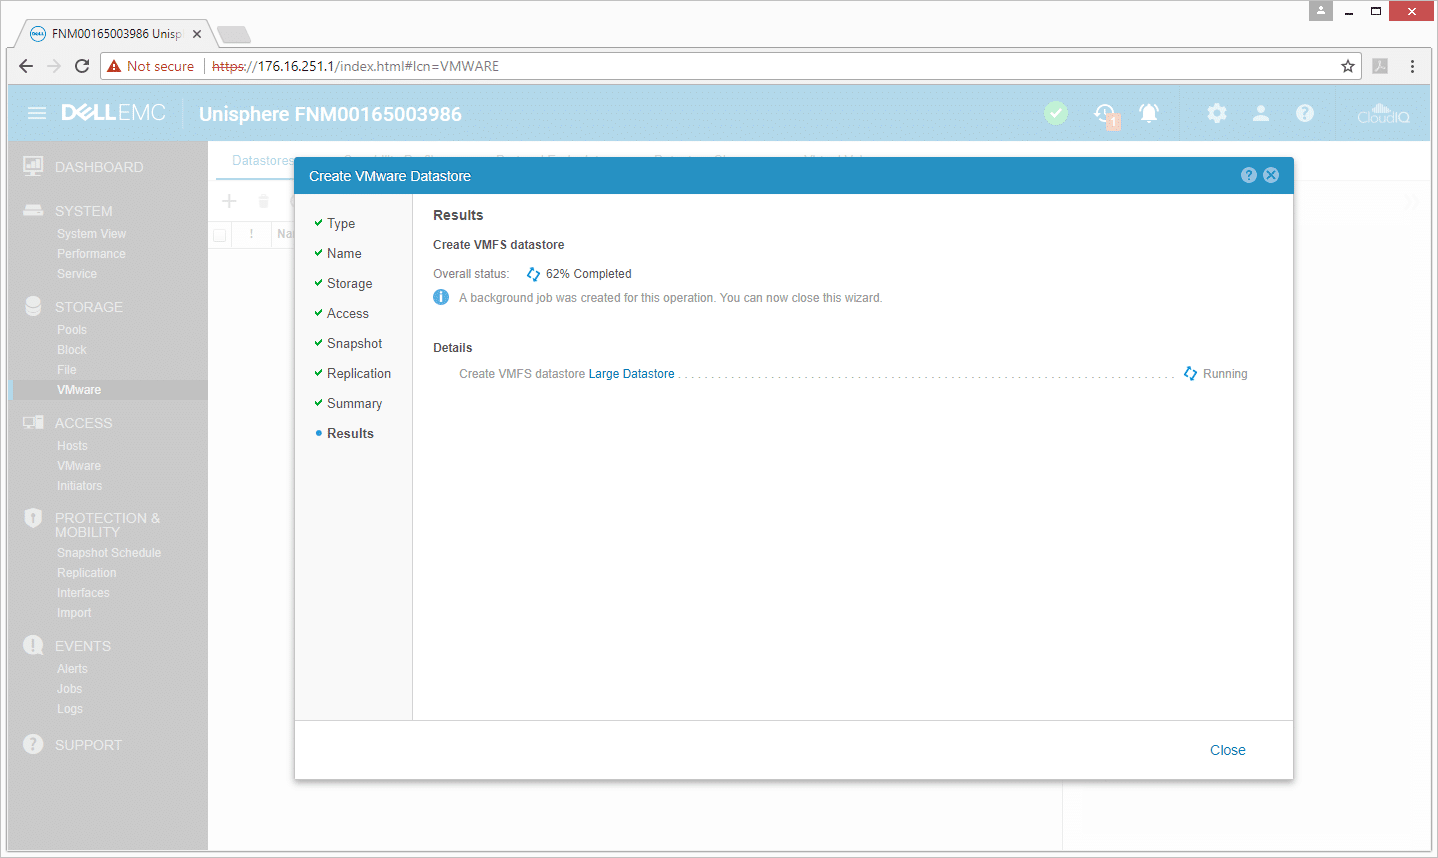
After clicking finish, users will see the result screen that will give the status of the datastore as it is being created, as well as more details. During this process, the array is creating the datastore on itself, as well as communicating with the outside ESXi hosts to scan for LUNs and create the datastore on that end.
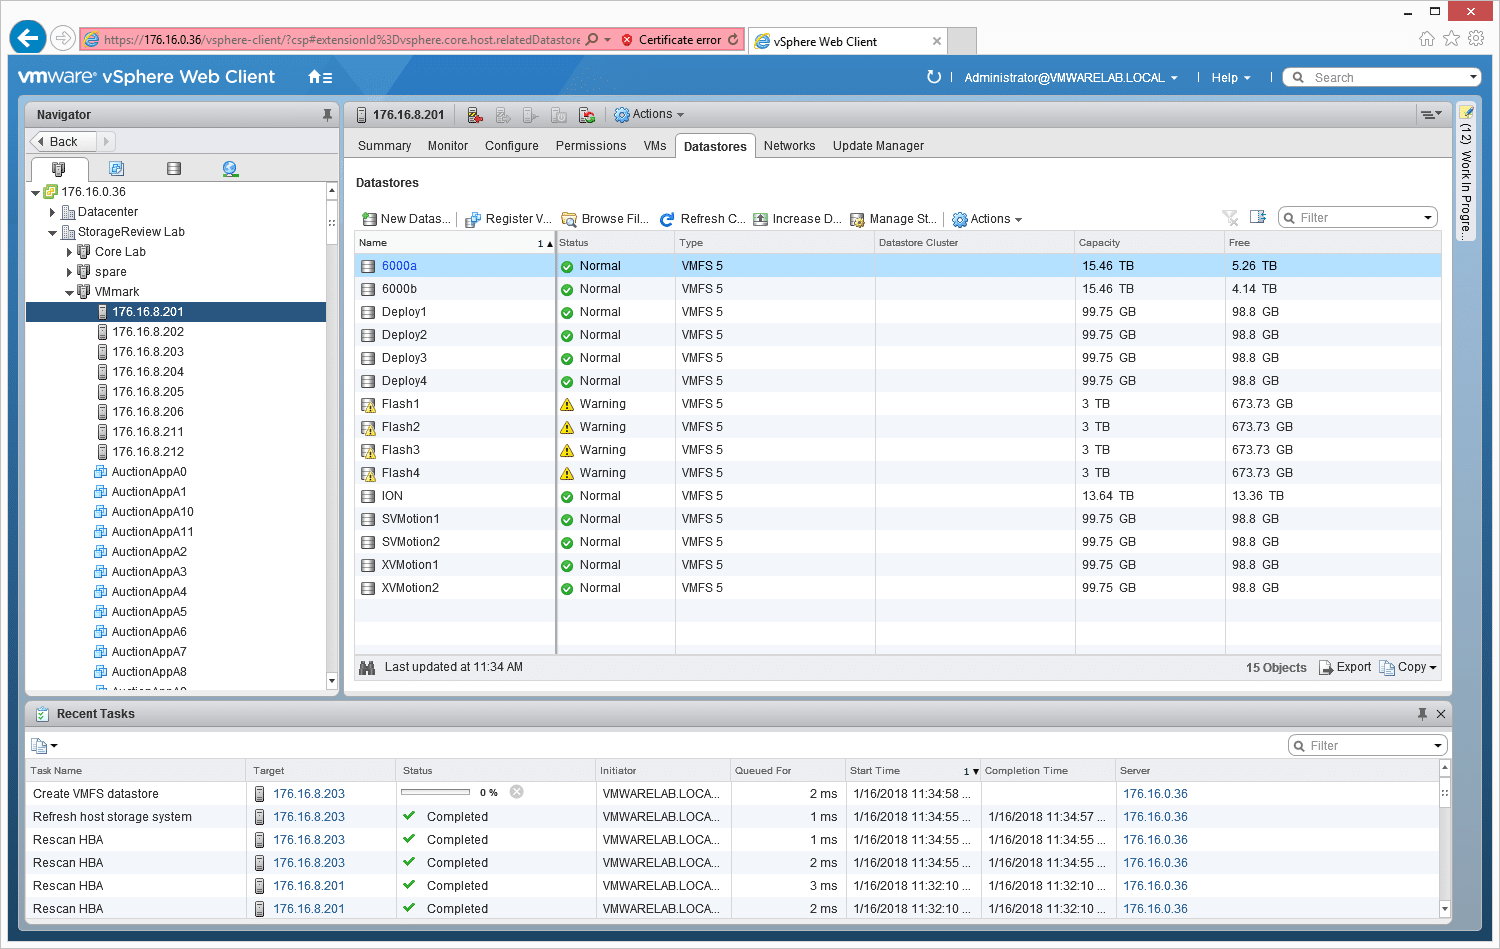
Flipping over to vSphere, we can see that all the hosts we selected to access the storage are polling for new storage devices, and we can open up our datastores and see at the bottom that one is being created.
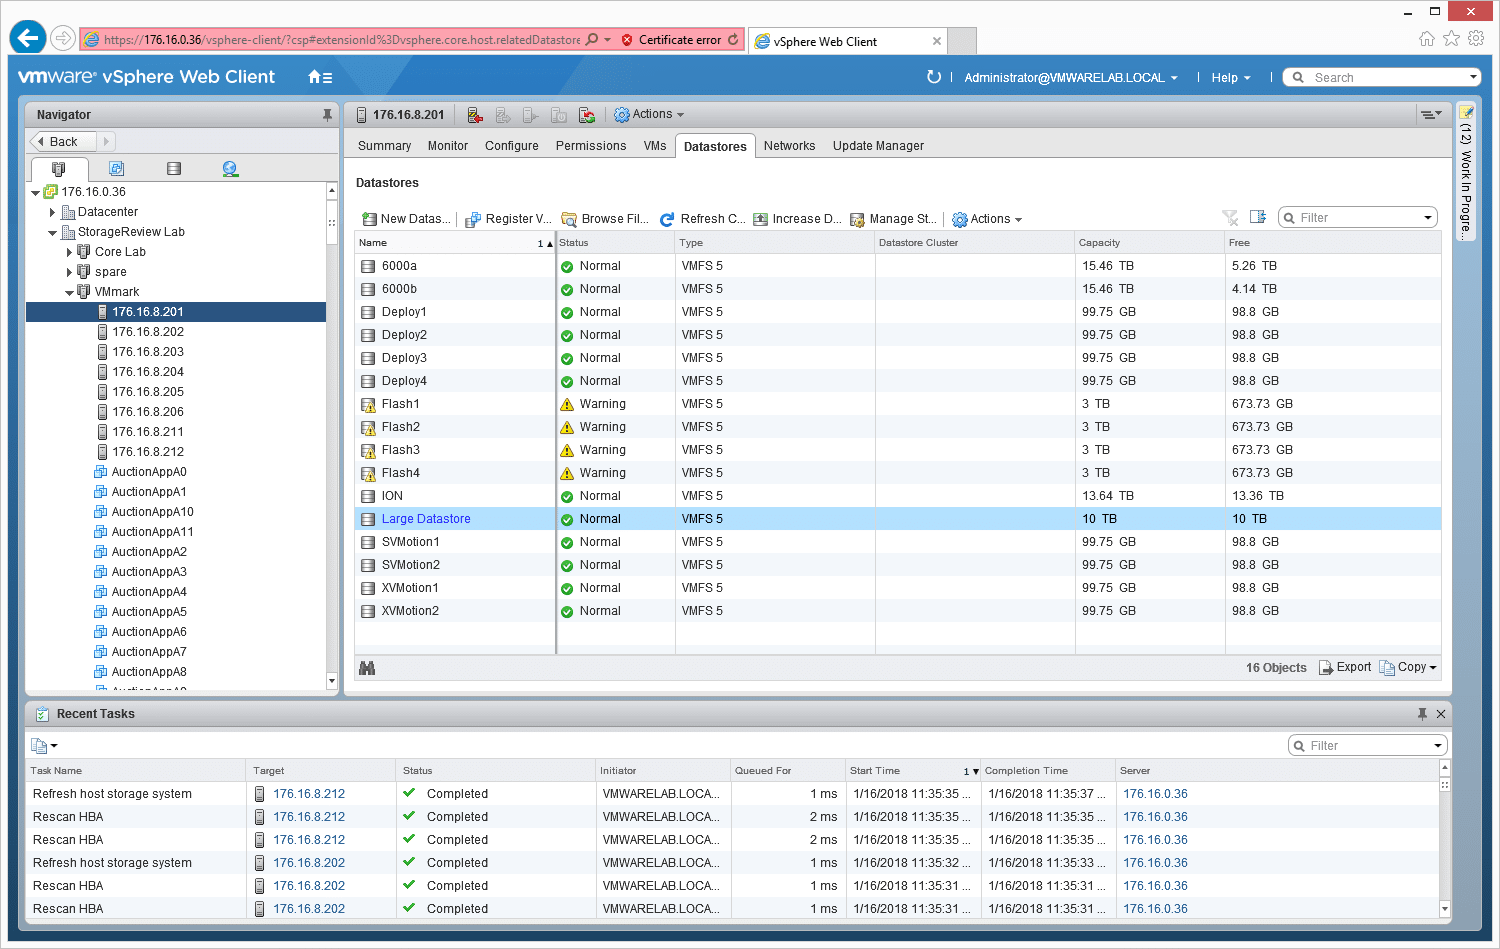
When it is finished, it pops into the list with the other datastores.
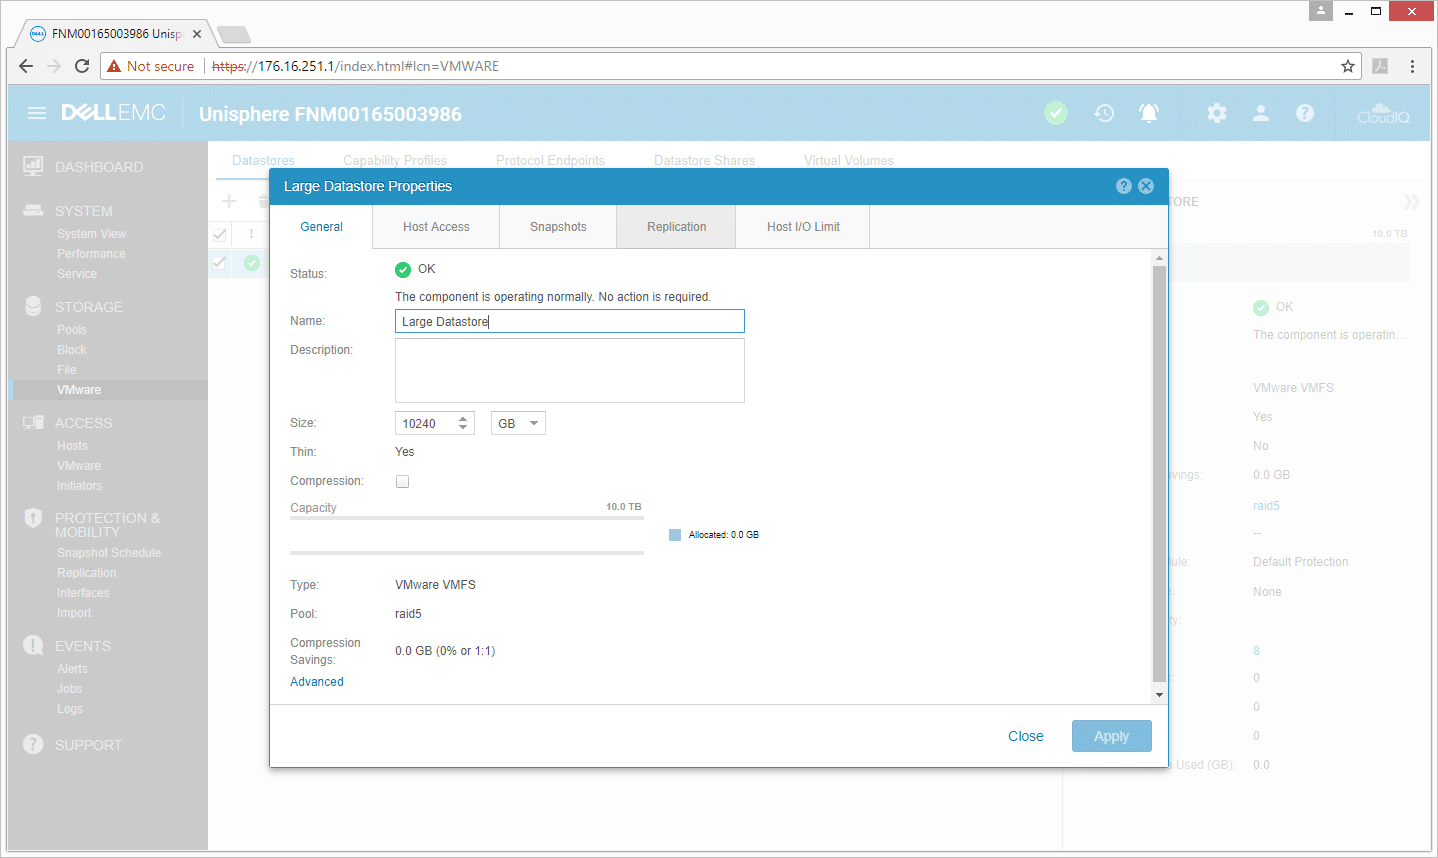
We can also see the datastore when we go back into Unisphere under Storage>VMware.
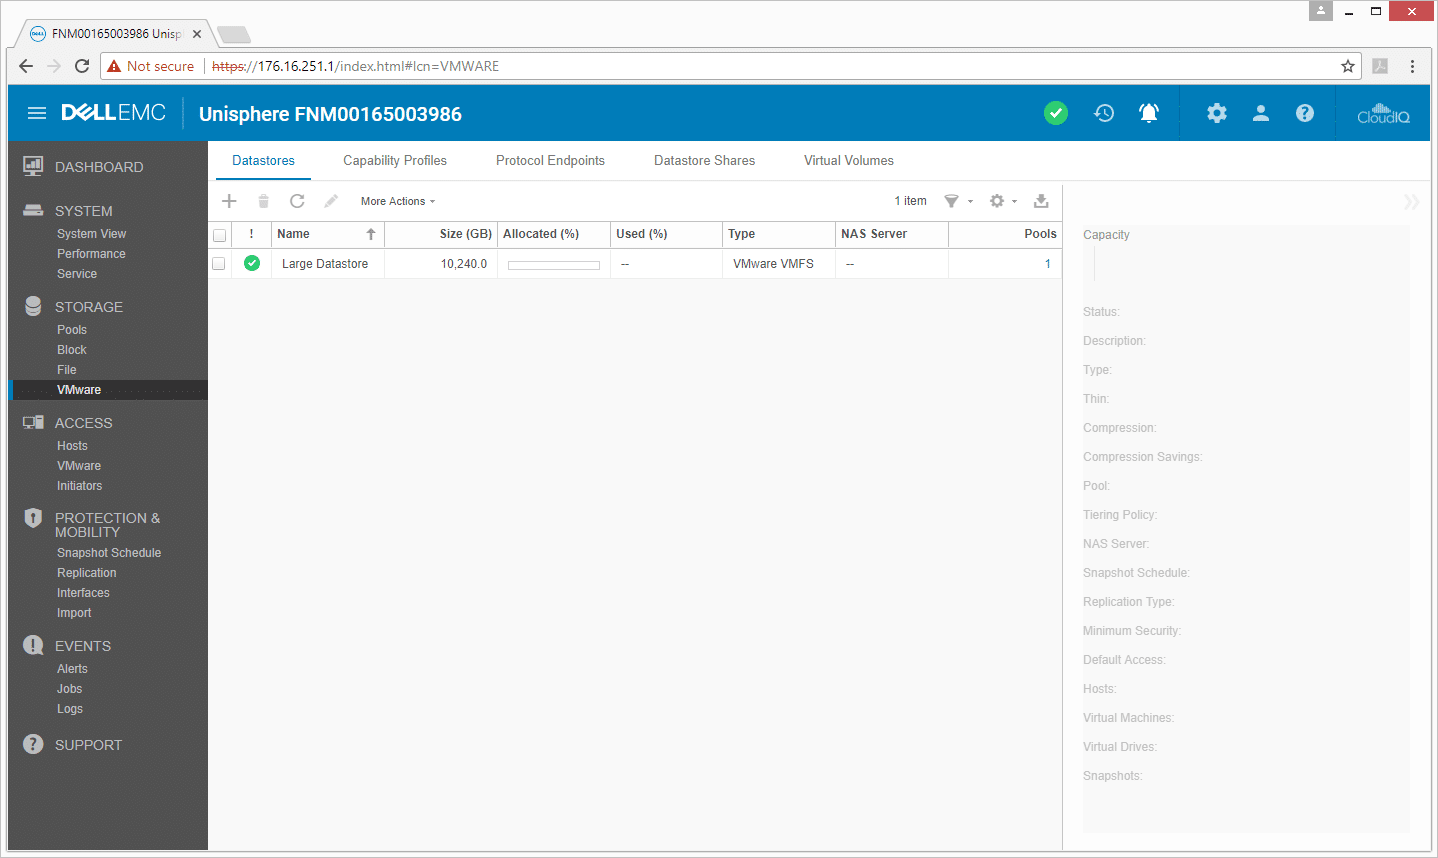
And we can double click on this to get the properties of the datastore and make some changes.
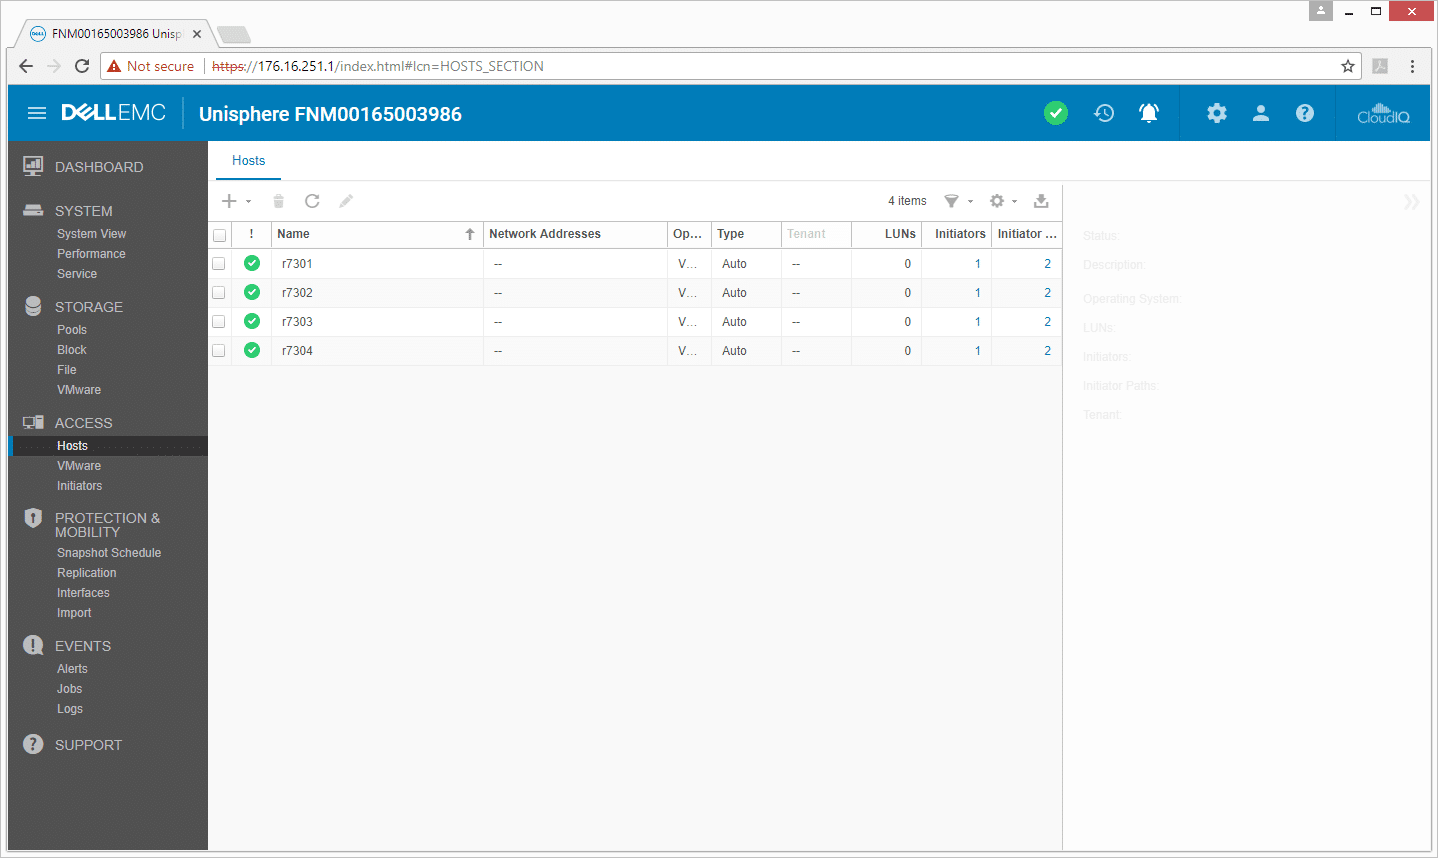
The next main menu is Access, with the submenus of Hosts, VMware, and Initiators. Under the hosts submenu, users can see the potential hosts to connect the Unity to in the network and basic information about each such as name, address, type, LUNs, and so on. Hosts can be directly managed as seen below, or automatically managed through an integration point with VMware vCenter.
The VMware submenu gives users the option to allow Unisphere to talk with and manage storage through vCenter directly. It also states whether or not the component is operating correctly. This is incredibly useful for novice users or even experienced IT administrators who don’t want the hassle of directly managing the settings of a cluster of servers for each new datastore provisioned. Unisphere is set to automatically handle all of the legwork for you.
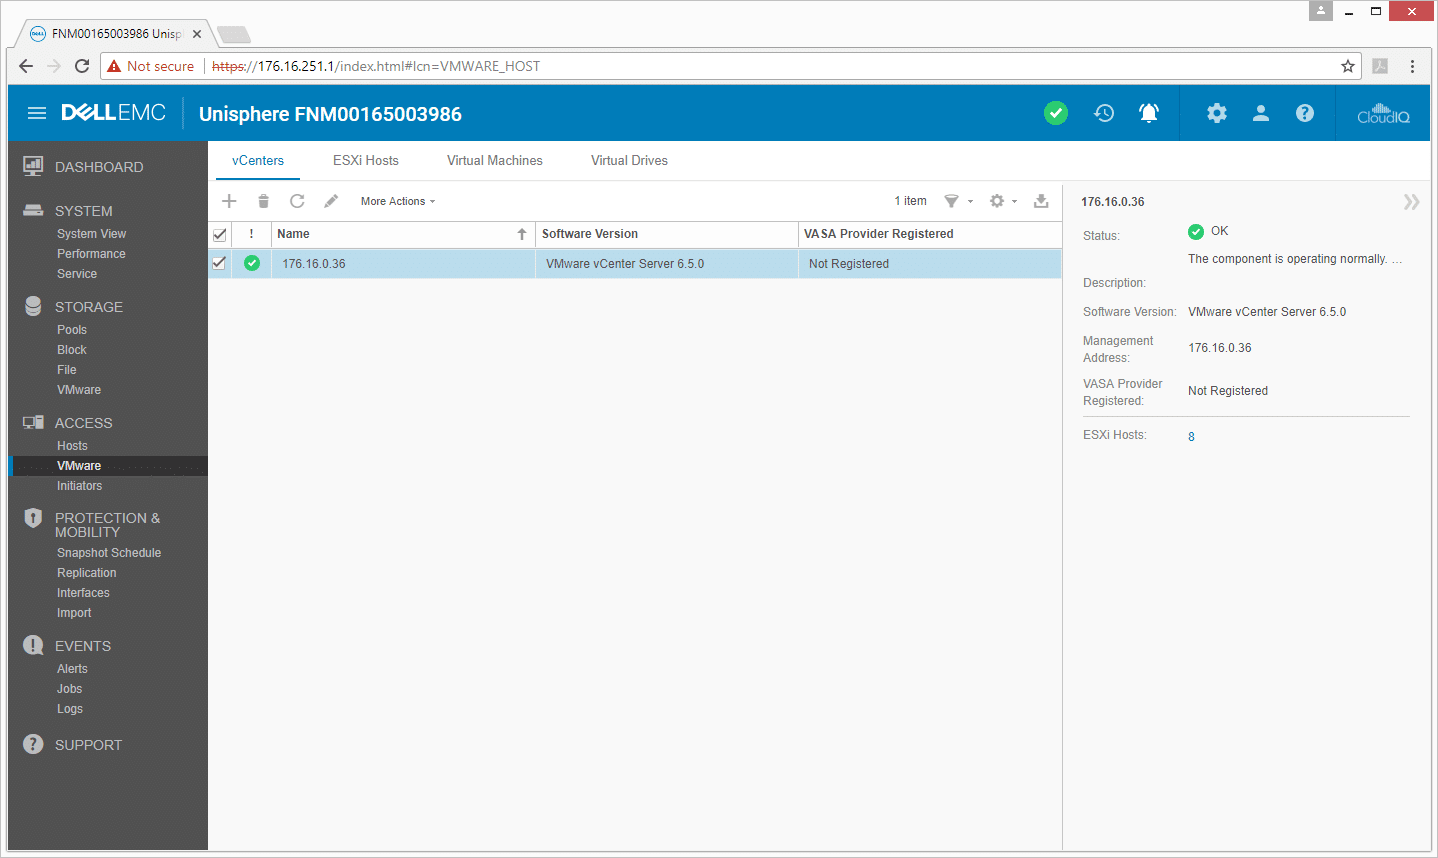
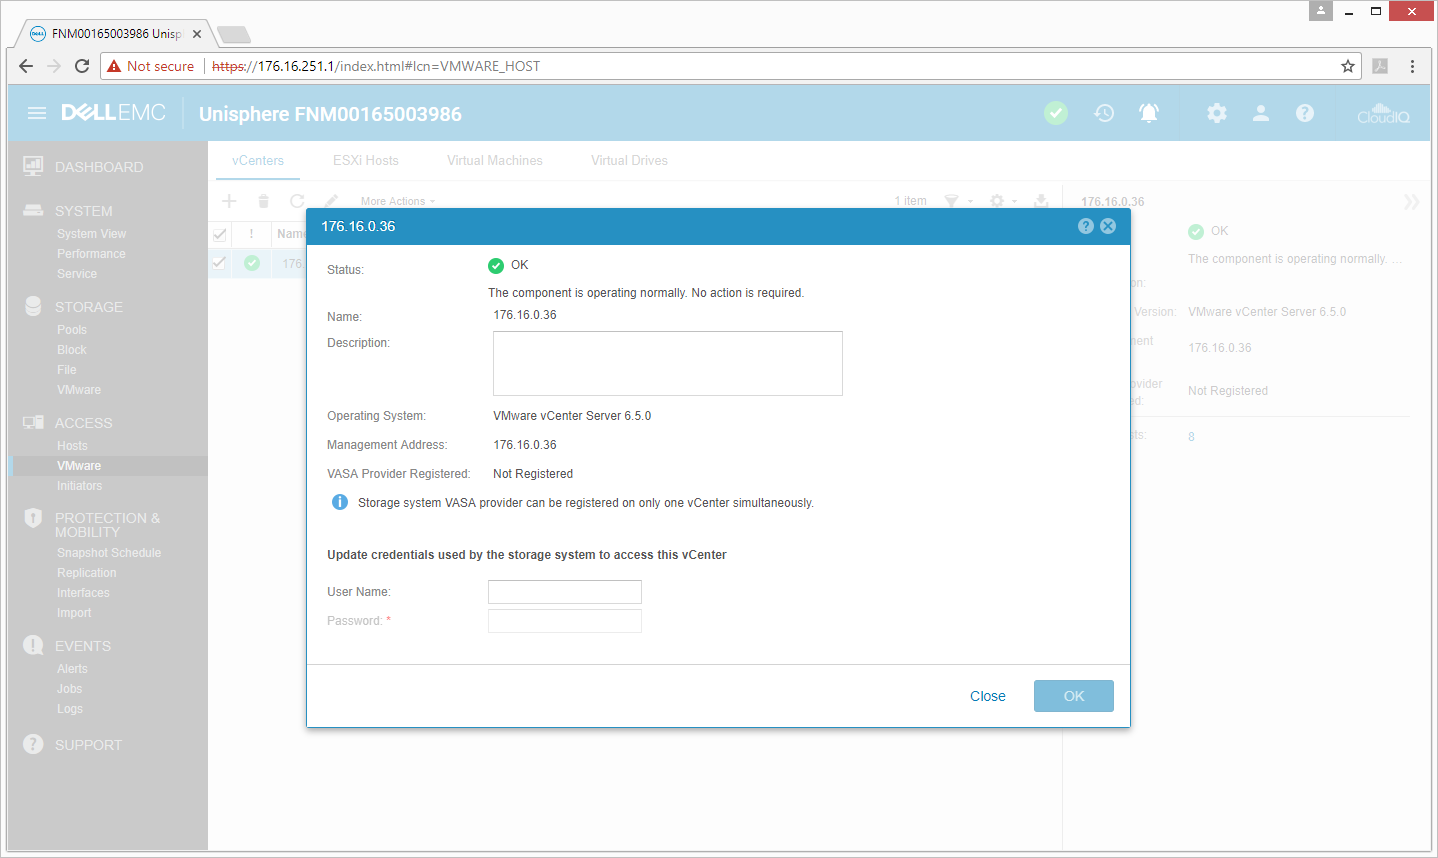
Double-clicking on the vCenters gives more information about them.
The Access submenu allows us to see the ESXi hosts as well. Through here we can click on them and get more information such as network address, initiators, and initiator paths.
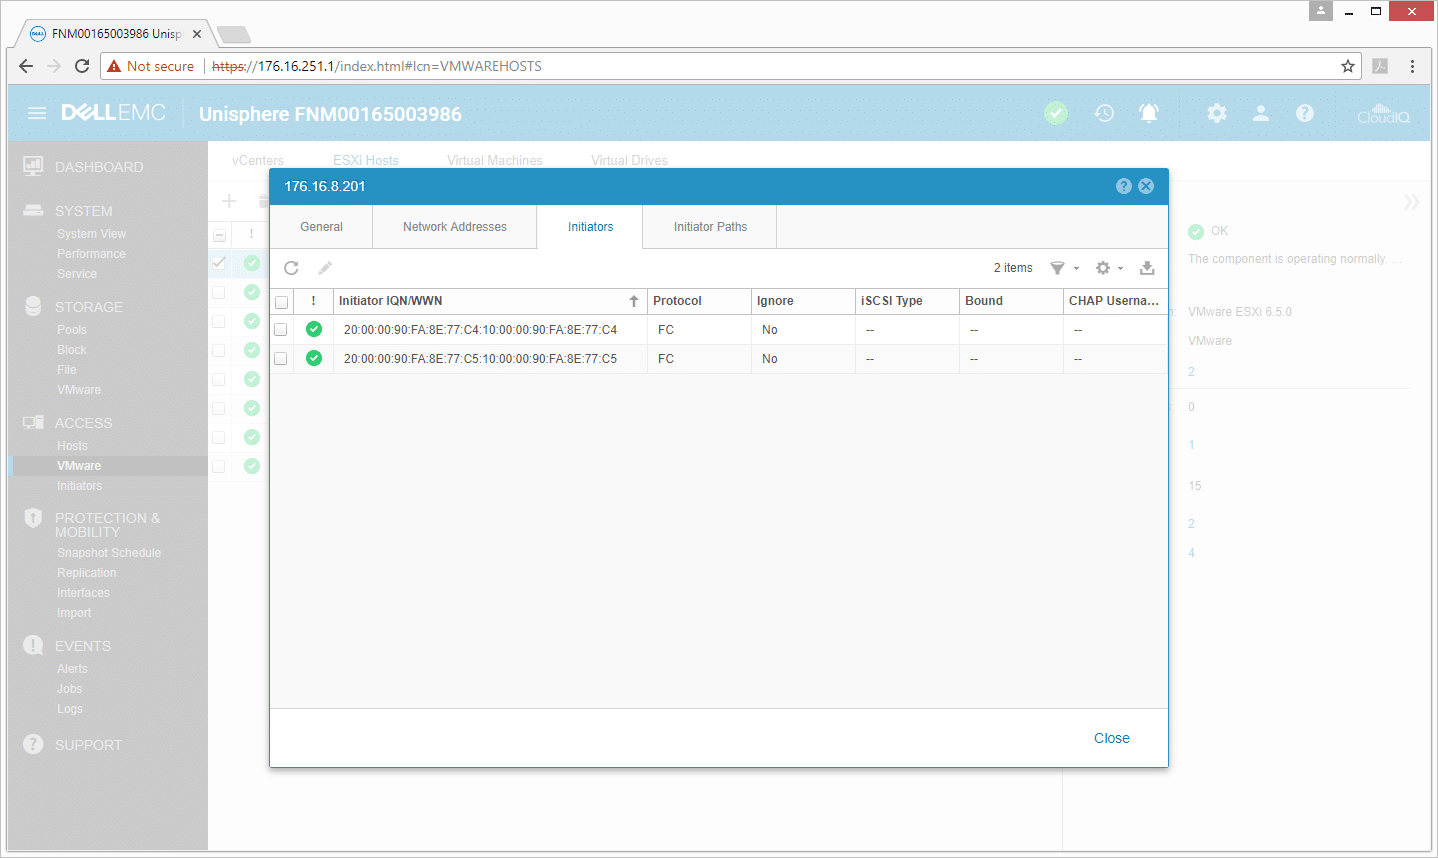
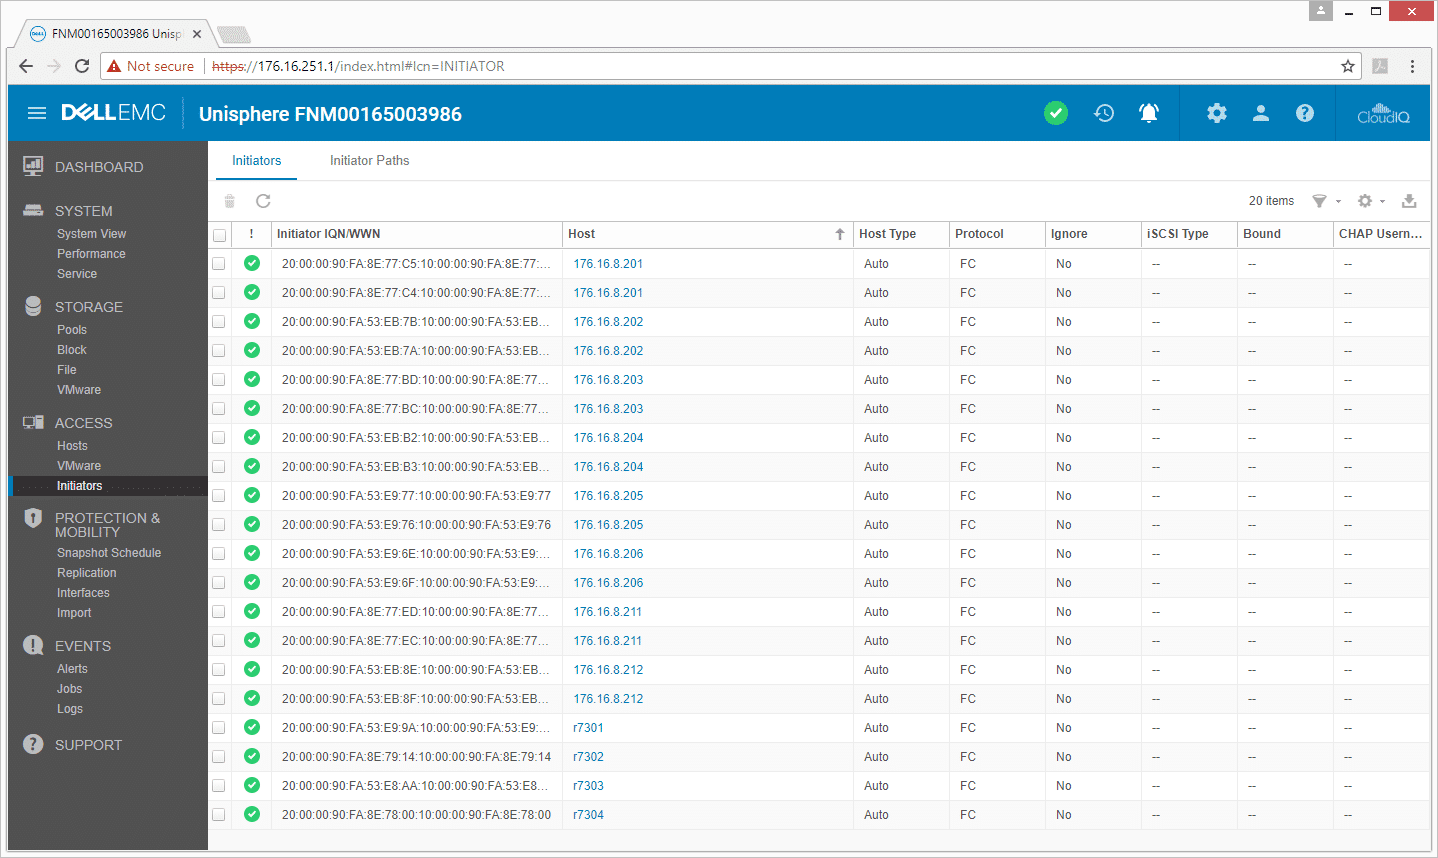
The initiator submenu gives us a list of initiators, their hosts, host type, protocol, the ability to ignore them, iSCSI type, as well as other information.
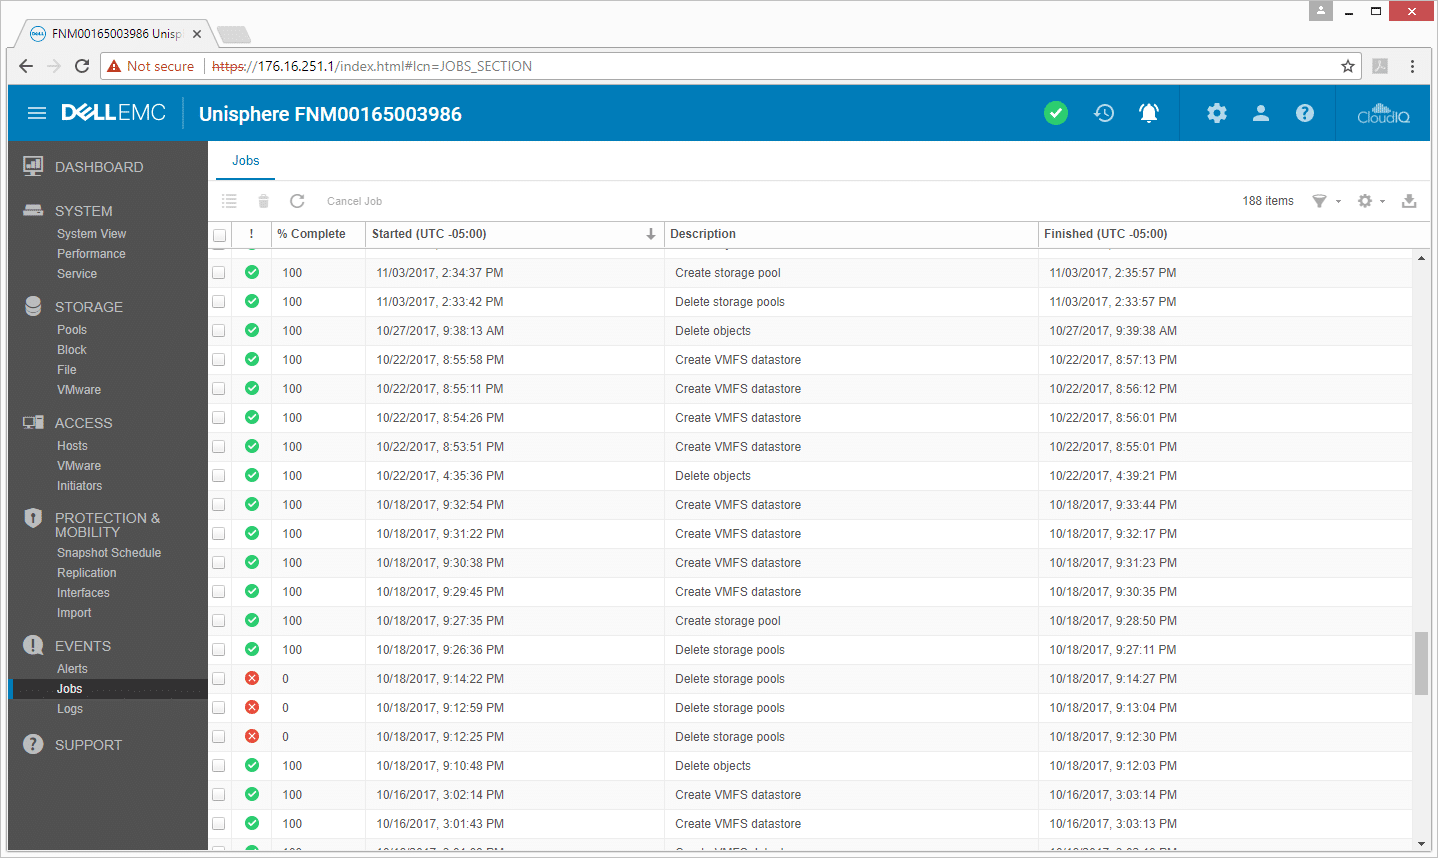
Under the Events menu, users can see the jobs they’ve run or have running, their rate of completion, what the jobs are, and when they were finished.
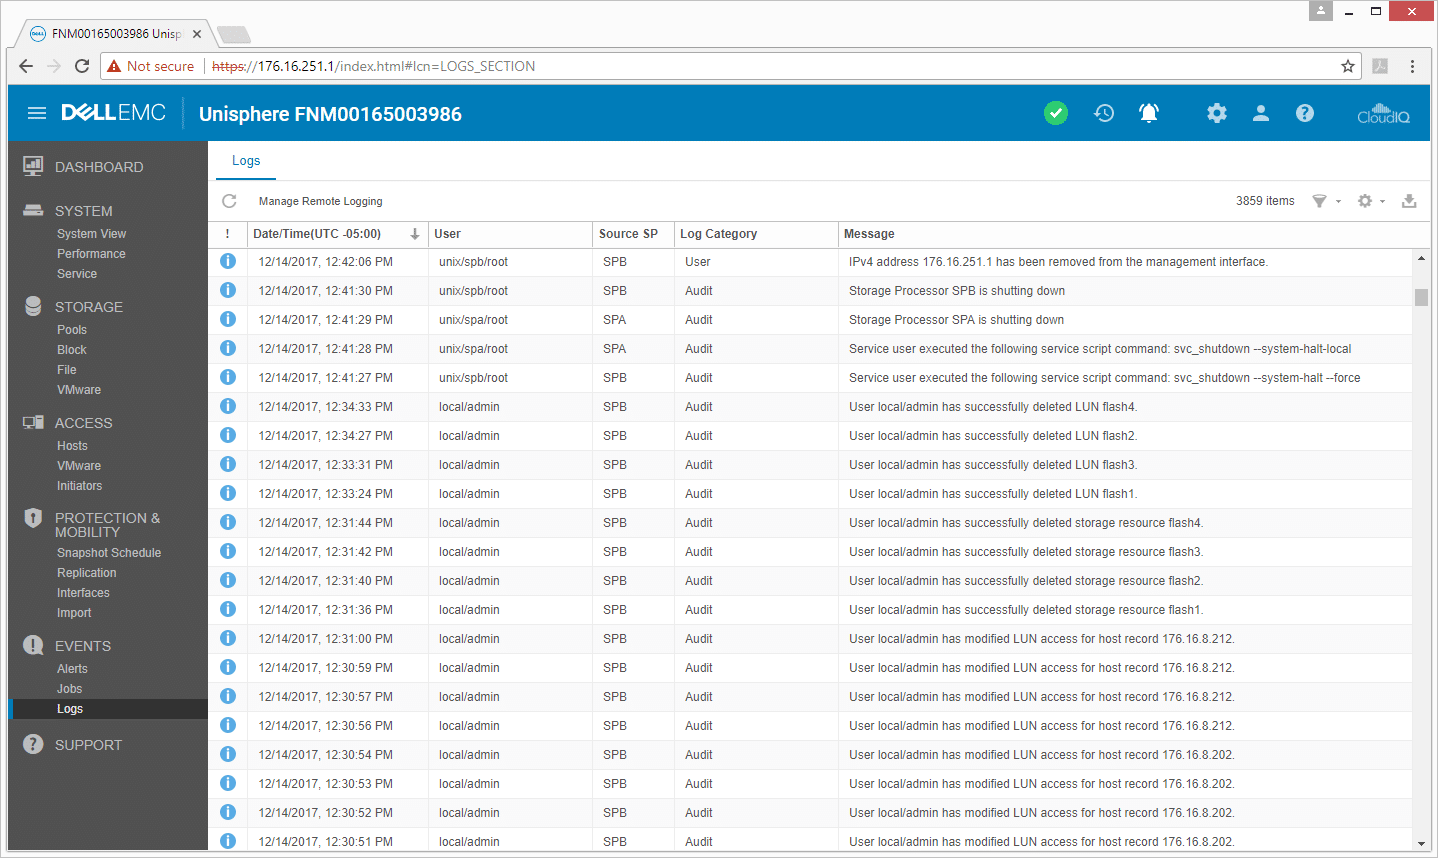
Similarly, users can easily go through the logs in the Events menu under Logs.
The management is no longer limited to a web browser on a PC. Dell EMC now supports mobile management. As one can see below, the layout is very similar to the dashboard.
The capabilities aren’t limited to just viewing the system. Through the mobile app, an admin can enjoy much of the same functionality as the web GUI.
Performance
Sysbench MySQL Performance
Our first shared-storage application benchmark consists of a Percona MySQL OLTP database measured via SysBench. This test measures average TPS (Transactions Per Second), average transactional latency, and average 99th percentile transactional latency as well.
Each Sysbench VM is configured with three vDisks: one for boot (~92GB), one with the pre-built database (~447GB), and another for the database under test (270GB). From a system resource perspective, we configured each VM with 16 vCPUs and 60GB of DRAM, and leveraged the LSI Logic SAS SCSI controller.
Sysbench Testing Configuration (per VM)
- CentOS 6.3 64-bit
- Percona XtraDB 5.5.30-rel30.1
- Database Tables: 100
- Database Size: 10,000,000
- Database Threads: 32
- RAM Buffer: 24GB
- Test Length: 3 hours
- 2 hours preconditioning 32 threads
- 1 hour 32 threads
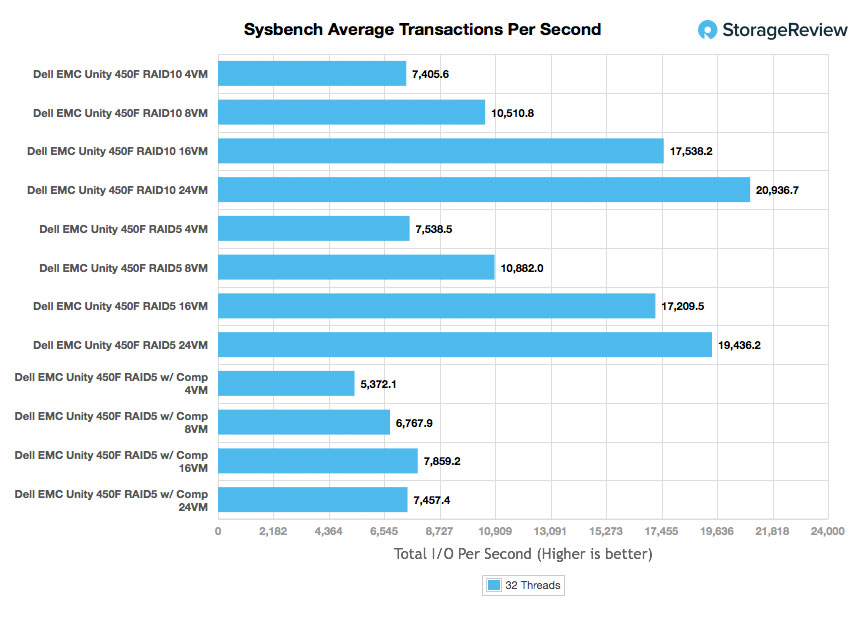
For our Sysbench test, we compared several sets of VMs, ranging from 4VM to 24VM, and configured them in both RAID5 with compression, RAID5 without compression, and RAID10. Instead of saying which one is “best,” we will look at each, giving users an idea what to expect.
With 4VM, the Dell EMC Unity 450F gave us 5,372.1 TPS in RAID5 with compression, 7,538.5 TPS in RAID5, and 7,405.6 TPS in RAID10. With 8VM, Unity hit 6,767.9 TPS in RAID5 with compression, 10,882 TPS in RAID5, and 10,510.8 TPS in RAID10. With 16VM, we saw 7,859.2 TPS in RAID5 with compression, 17,209.5 TPS in RAID5, and 17,538.2 TPS in RAID10. And finally, 24VM with the Unity gave us numbers of 7,457.4 TPS in RAID5 with compression on, 19,436.2 in RAID5 with compression off, and 20,936.7 TPS in RAID10.
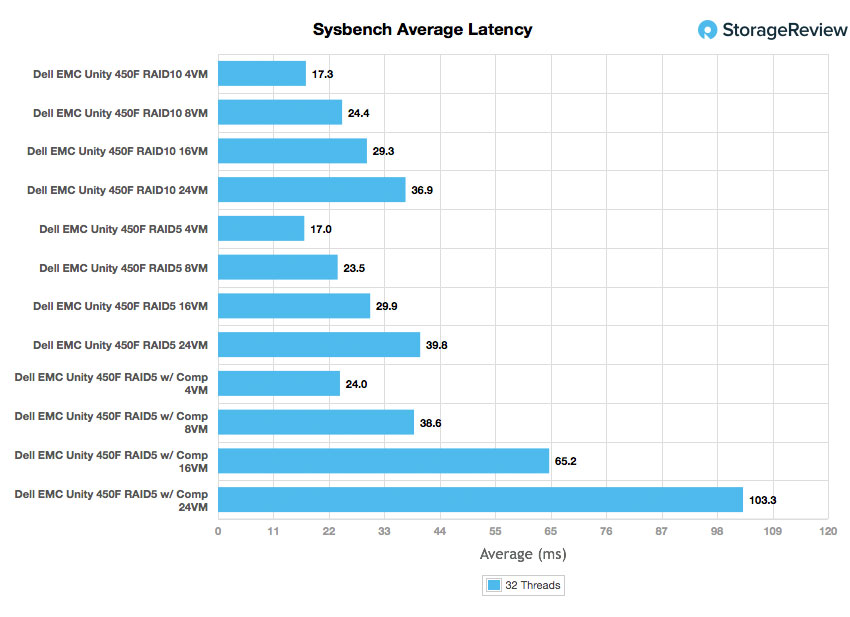
We ran the same VM and configurations for Sysbench average latency. With 4VM, the unity hit an average latency of 17ms in RAID5, 17.3ms in RAID10, and only 24ms in RAID5 with compression. Looking at 8VM, we saw 23.5ms in RAID5, 24.4ms in RAID10, and 38.6ms in RAID5 with compression. The 16VM gave us 29.3ms in RAID10, 29.9ms in RAID5, and 65.2ms in RAID5 with compression. Finally, 24VM gave us latency numbers of 36.9ms in RAID10, 39.8ms in RAID5, and 103.3ms in RAID5 with compression.
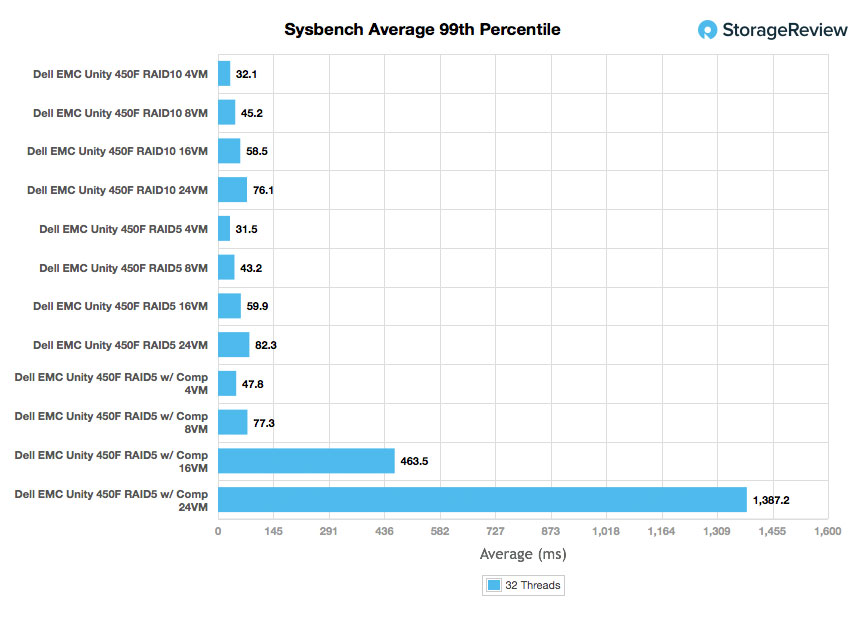
Our last Sysbench test looks at worst-case scenario (99th percentile) latency. With the 4VM, we saw latency numbers of 31.5ms with RAID5, 32.1ms with RAID10, and only 47.8ms with RAID5 and compression. The 8VM gave us 43.2ms in RAID5, 45.2ms in RAID10, and 77.3ms in RAID5 with compression. The 16VM had 58.5ms in RAID10, 59.9ms in RAID5, and 463.5ms in RAID5 with compression. And the 24VM had 76.1ms in RAID10, 82.3ms in RAID5 and a whopping 1,387.2ms in RAID5 with compression.
SQL Server Performance
StorageReview’s Microsoft SQL Server OLTP testing protocol employs the current draft of the Transaction Processing Performance Council’s Benchmark C (TPC-C), an online transaction processing benchmark that simulates the activities found in complex application environments. The TPC-C benchmark comes closer than synthetic performance benchmarks to gauging the performance strengths and bottlenecks of storage infrastructure in database environments.
Each SQL Server VM is configured with two vDisks: 100GB volume for boot and a 500GB volume for the database and log files. From a system resource perspective, we configured each VM with 16 vCPUs, 64GB of DRAM and leveraged the LSI Logic SAS SCSI controller. While our Sysbench workloads tested previously saturated the platform in both storage I/O and capacity, the SQL TPC-C test is very sensitive when it comes to storage latency, which will impact its ultimate application latency score.
This test uses SQL Server 2014 running on Windows Server 2012 R2 guest VMs, and is stressed by Dell’s Benchmark Factory for Databases. While our traditional usage of this benchmark has been to test large 3,000-scale databases on local or shared storage, in this iteration we focus on spreading out four 1,500-scale databases evenly across our servers.
SQL Server Testing Configuration (per VM)
- Windows Server 2012 R2
- Storage Footprint: 600GB allocated, 500GB used
- SQL Server 2014
- Database Size: 1,500 scale
- Virtual Client Load: 15,000
- RAM Buffer: 48GB
- Test Length: 3 hours
- 2.5 hours preconditioning
- 30 minutes sample period
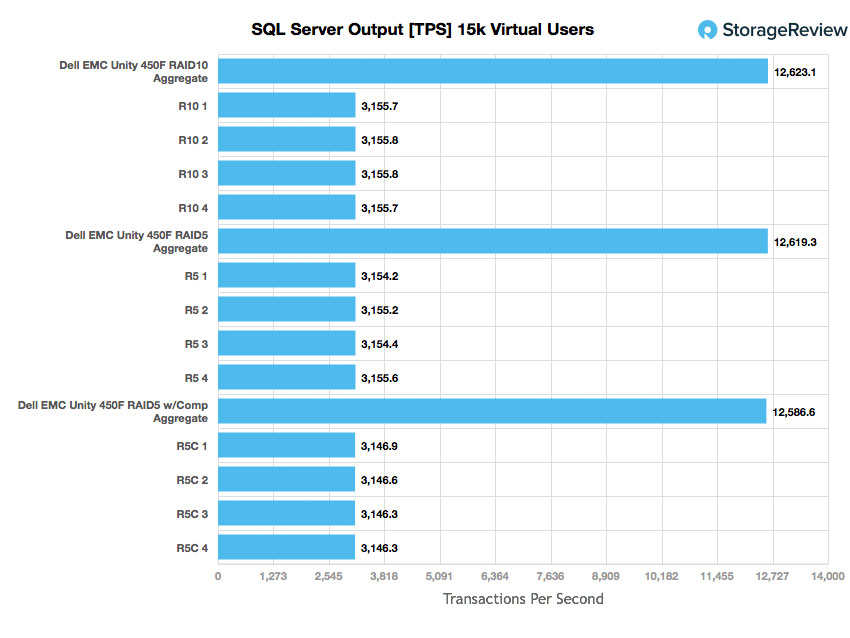
Similar to how we ran our Sysbench benchmark, we tested configurations with RAID5, RAID10, and RAID5 with compression turned on. In our SQL Server benchmark, the Dell EMC Unity 450F gave us an aggregate TPS score of 12,623.1 in RAID10, with individual VMs ranging from 3,155.7 TPS to 3,155.8 TPS. In RAID 5 without compression, we saw an aggregate score of 12,619.3 TPS with individual VMs ranging from 3,154.2 TPS to 3,155.6 TPS. In RAID5 with compression turned on, we saw an impressive aggregate score of 12,586.6 TPS, with individual VMs ranging from 3,146.3 TPS to 3,146.9 TPS.
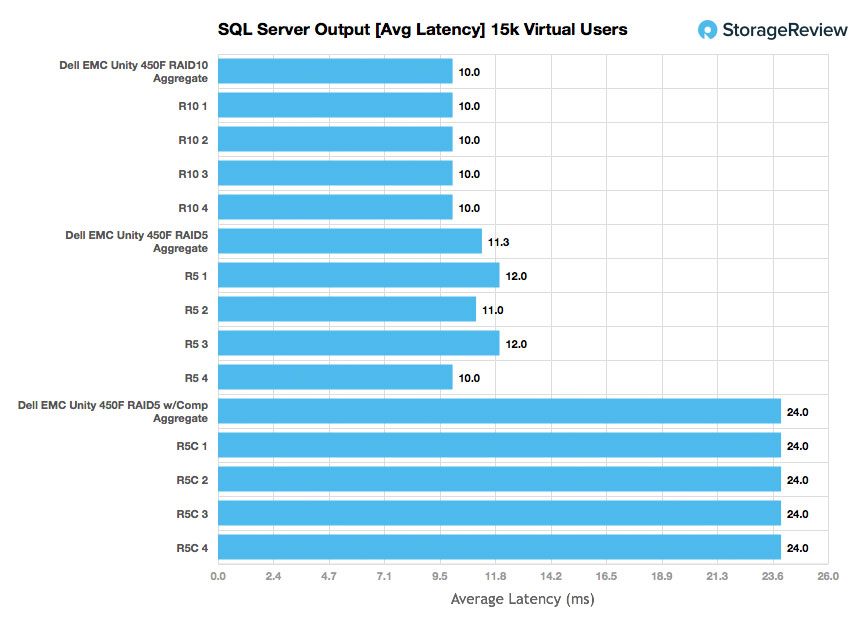
For SQL Server average latency, the Unity gave us 10ms aggregate and across the board in RAID10. RAID5 gave us an aggregate of 11.3ms, with individual VMs ranging from 10ms to 12ms. And RAID5 with compression turned on had 24ms across the board.
VDBench Workload Analysis
Our last section of local performance testing focuses in on synthetic-workload performance. In this area, we measured the performance across three different storage configurations: RAID10, RAID5 and RAID5 with inline compression. We tested with 32 125GB VMDKs mounted across 16 VMs to measure a storage footprint of 4TB. This type of test is useful in showing what real-world storage metrics look like with the overhead associated with a virtualized environment.
When it comes to benchmarking storage arrays, application testing is best, and synthetic testing comes in second place. While not a perfect representation of actual workloads, synthetic tests do help to baseline storage devices with a repeatability factor that makes it easy to do apples-to-apples comparison between competing solutions. These workloads offer a range of different testing profiles ranging from “four corners” tests, common database transfer size tests, as well as trace captures from different VDI environments. All of these tests leverage the common vdBench workload generator, with a scripting engine to automate and capture results over a large compute testing cluster. This allows us to repeat the same workloads across a wide range of storage devices, including flash arrays and individual storage devices. On the array side, we use our cluster of Dell PowerEdge R730 servers:
Profiles:
- 4K Random Read: 100% Read, 128 threads, 0-120% iorate
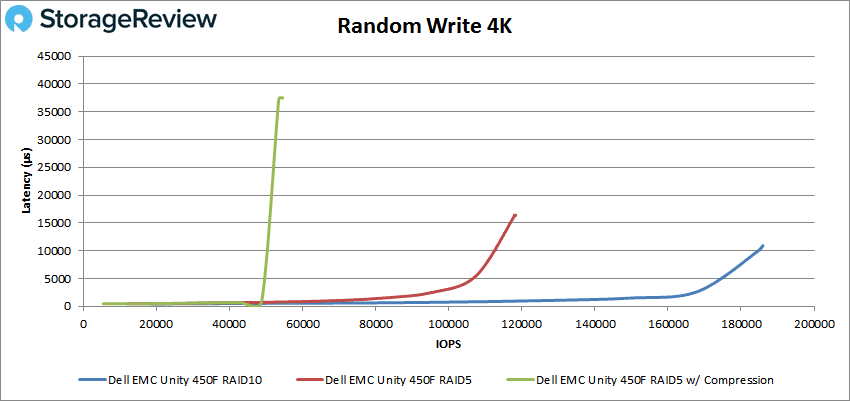
- 4K Random Write: 100% Write, 64 threads, 0-120% iorate
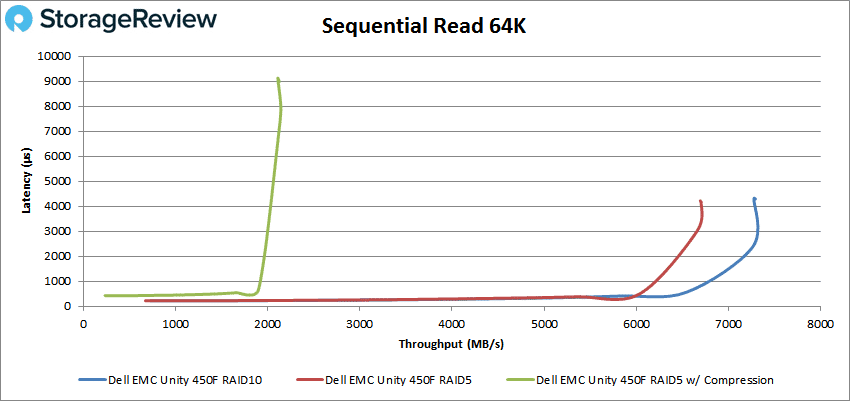
- 64K Sequential Read: 100% Read, 16 threads, 0-120% iorate
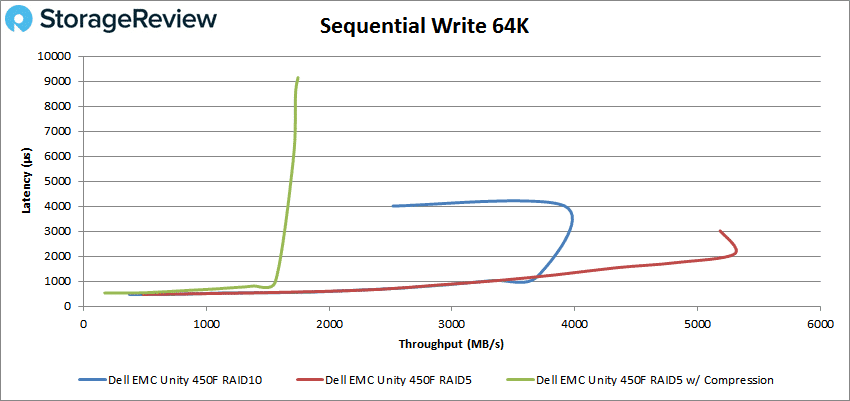
- 64K Sequential Write: 100% Write, 8 threads, 0-120% iorate
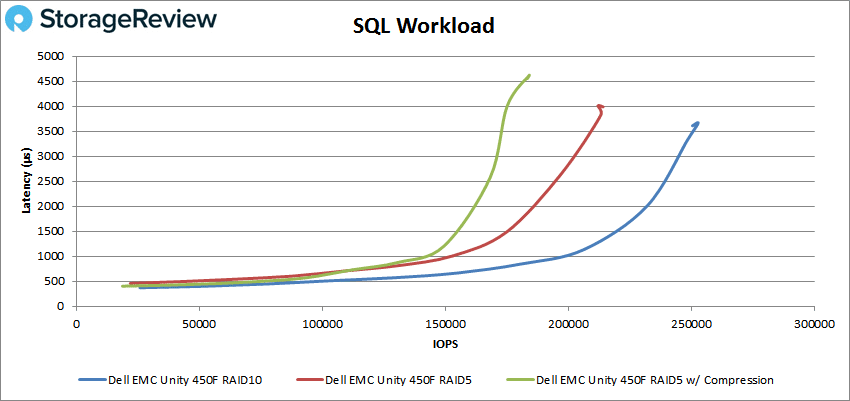
- Synthetic Database: SQL and Oracle
- VDI Full Clone and Linked Clone Traces
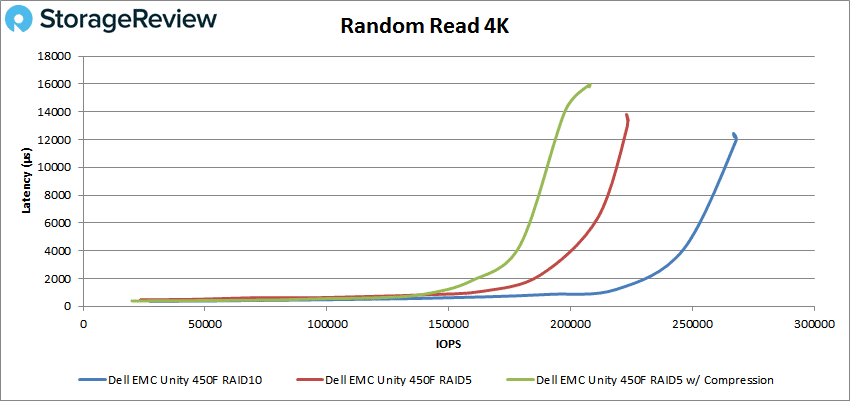
Looking at peak 4K read performance, all three configurations had sub-millisecond performance until around 140K IOPS. The RAID10 configuration peaked at 267,918 IOPS with a latency of 11.9ms. In RAID5, we saw a peak of 222,963 IOPS with a latency of 13.8ms. And with compression on, performance topped out at 207,915 IOPS and a latency of 16ms.
For peak 4K write, the Unity with compression had sub-millisecond latency until just over 31K IOPS and peaked at 34K IOPS with 9.12ms latency. RAID5 made it to roughly 100K IOPS with latency under 1ms and peaked at 107,216 IOPS with 4.16ms latency. For RAID10, there was sub-millisecond latency until around 184.7K IOPS with a peak of 185,979 IOPS with 1.09ms latency.
Looking at sequential 64K read, with compression the Unity 450F went above 1ms at about 31K IOPS or 1.9GB/s to peak at 33,764 IOPS, 8.99ms latency, and a bandwidth of 2.11GB/s. The RAID5 config made it until right about 100K IOPS or 6GB/s before breaking 1ms latency; it peaked at 107,216 IOPS, 4.16ms latency, with a bandwidth of 6.7GB/s. The RAID10 config performed best overall with a sub-millisecond performance until about 110K IOPS or 6.7GB/s; it peaked at 116,645 IOPS with a latency of 4.312ms and a bandwidth of 7.27GB/s.
For sequential 64K write, the unity with compression made it to just north of 25K IOPS or 1.56GB/s before going over 1ms of latency; it peaked at 27,954 IOPS at 9.15ms latency and 1.74GB/s bandwidth. Both the RAID5 and RAID10 made it to about 54K IOPS or 3.3GB/s under 1ms of latency. The RAID10 config peaked at 62,650 IOPS before dropping down to 40,309 IOPS with a latency of 4.01ms and a bandwidth of 2.52GB/s. The RAID5 config peaked at 84,778 IOPS before dropping to 82,892 IOPS with a latency of 3.02ms and a bandwidth of 5.18GB/s.
In our SQL workload, the Unity 450F with compression had sub-millisecond latency performance up until about 149K IOPS; it peaked at 184,097 IOPS with 4.62ms latency. For our RAID5 config, we saw sub-millisecond performance until 152K IOPS; it peaked at 214,160 IOPS with 3.99ms latency. With the RAID10 config, Unity made it until about 206K IOPS and peaked at 252,821 IOPS with 3.66ms latency.
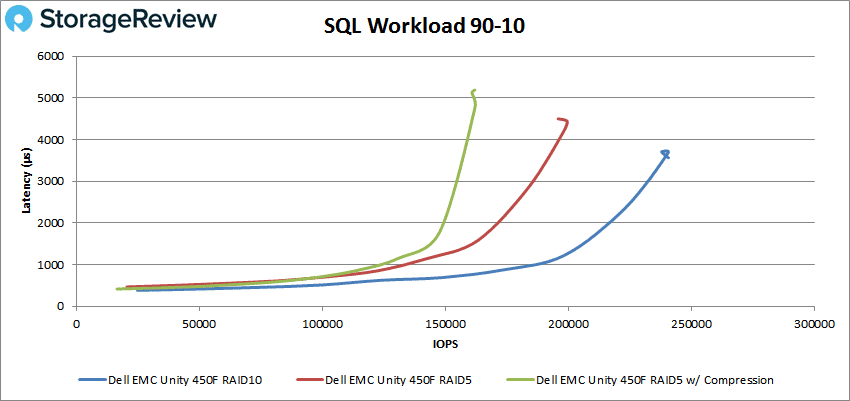
In the SQL 90-10 benchmark, the unity with compression made it to roughly 130K IOPS before going over 1ms; it peaked at 160,824 IOPS and 5.11ms latency. The RAID5 config had sub-millisecond latency until about 140K IOPS, peaking at 199,600 IOPS with a latency of 4.44ms. And the RAID10 config performed under 1ms until it hit roughly 195K IOPS; it peaked at 240,649 IOPS with a latency of 3.7ms.
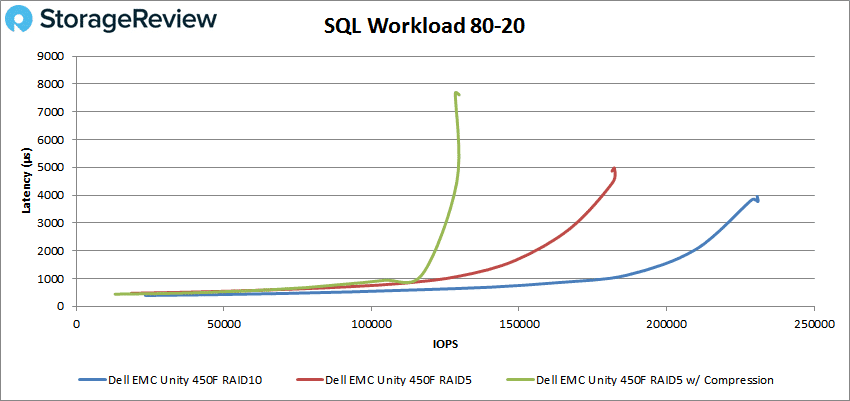
The SQL 80-20 saw the Unity with compression run sub-millisecond until about 104K IOPS; it peaked at 128,421 IOPS and 7.7ms latency. The RAID5 config saw sub-millisecond latency until just shy of 130K IOPS and peaked at 182,314 IOPS and a latency of 4.9ms. The RAID10 config performed under 1ms until it hit about 185K IOPS and peaked at 230,672 IOPS with a latency of 3.8ms.
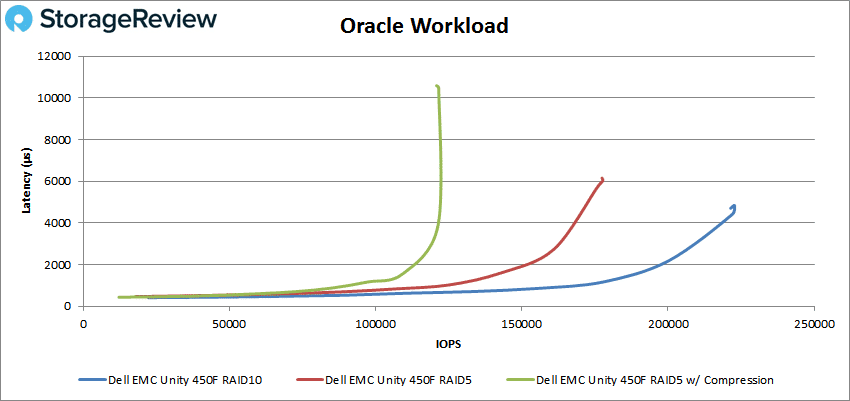
In our Oracle workload, the Unity 450F with compression on performed under 1ms on latency until it passed 85K IOPS and peaked at 121,584 IOPS with a latency of 10.47ms. The RAID5 config had sub-millisecond latency until it hit 110K IOPS and peaked at 177,664 IOPS with 6.02ms latency. The RAID10 config again performed the best with sub-millisecond latency until around 156K IOPS, peaking at 222,777 IOPS with a latency of 4.7ms.
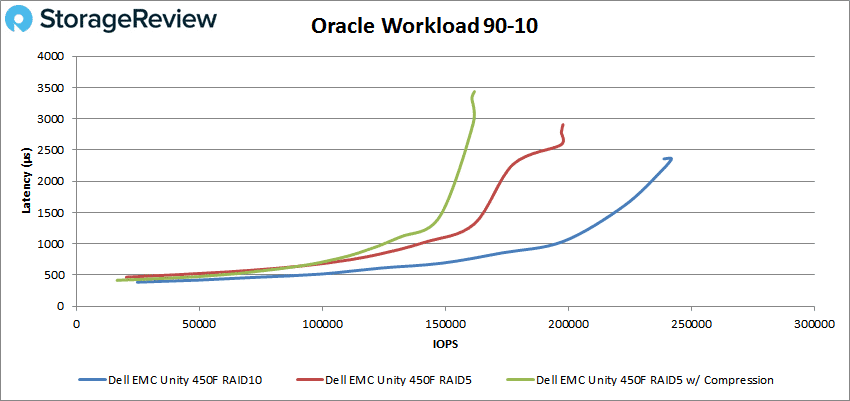
For the Oracle 90-10 workload, the Unity 450F with compression gave us sub-millisecond performance up to about 130K IOPS and peaked at 161,864 IOPS with 3.43ms latency. The RAID5 config ran sub-millisecond performance up until about 141K IOPS and peaked at 197,885 IOPS with a latency of 2.91ms. The RAID10 config almost hit 200K IOPS with less than 1ms of latency; it peaked at 241,981 with 2.36ms latency.
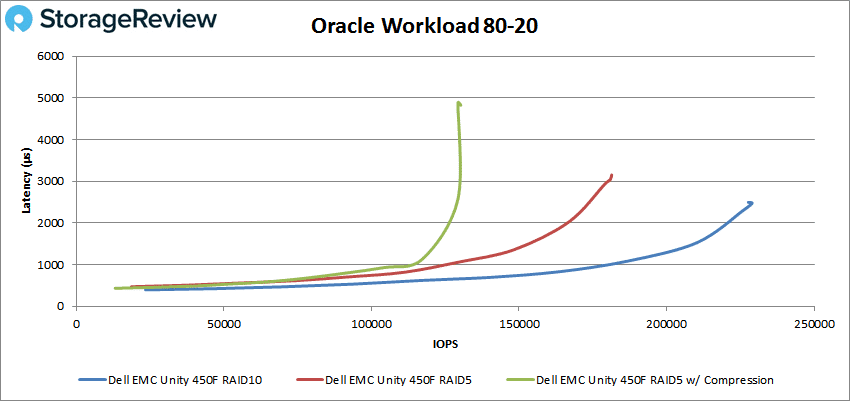
The Oracle 80-20 workload showed the Unity 450F with compression made it to about 110K IOPS with sub-millisecond latency and peaked at 130,250 IOPS with 4.9ms latency. The RAID5 config stayed under 1ms until it hit about 128K IOPS and peaked at 180,858 IOPS with a latency of 3.15ms. And the RAID10 config stayed under 1ms until around 187K IOPS, peaking at 228,943 IOPS and a latency of 2.47ms.
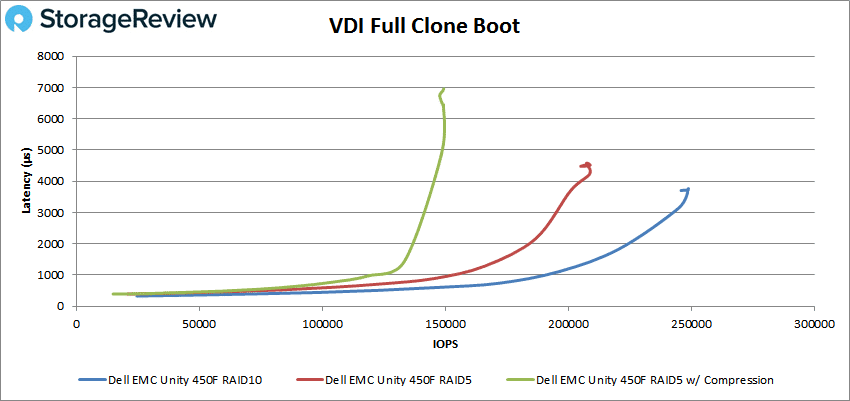
Next we looked at VDI Full Clone. During the boot test, the Unity 450F with compression was able to maintain sub-millisecond latency until around 119K IOPS and peaked at 148,960 IOPS with a latency of 6.89ms. The RAID5 config made it until about 150K IOPS before going over 1ms latency and peaked at 208, 850 IOPS with 4.51ms latency. The RAID10 config once again performed the best with sub-millisecond latency up to about 193K IOPS and peaked at 248,333 IOPS with 3.72ms latency.
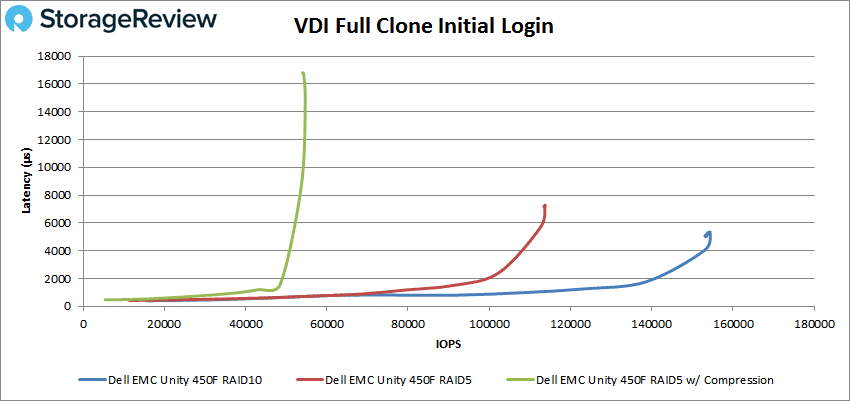
With VDI Full Clone Initial Log In, the Unity 450F with compression had sub-millisecond performance until about 38K IOPS and peaked at 54,297 IOPS with 1.67ms latency. The RAID5 configuration had sub-millisecond performance up to about 80K IOPS and peaked at 113,669 IOPS with 7.16ms. The RAID10 config had performance under 1ms of latency up until about 110K IOPS and peaked at 154,075 IOPS with 5.05ms latency.
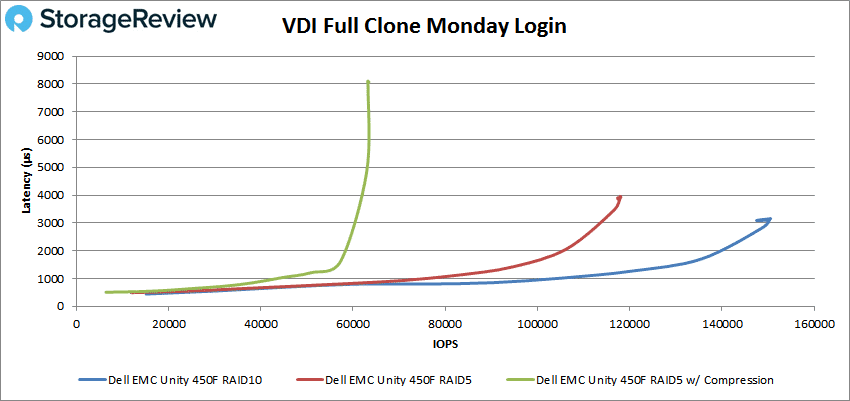
Our VDI Full Clone Monday Login showed the Unity 450F with compression to have sub-millisecond performance up to about 44K IOPS; it peaked at 63,151 IOPS with a latency of 8.1ms. The RAID5 config had performance at under 1ms latency up to about 72K IOPS and peaked at 117,911 IOPS with 3.9ms latency. The RAID10 config made it to about 105K IOPS before going over 1ms latency and peaking at 149,912 IOPS with 3.11ms latency.
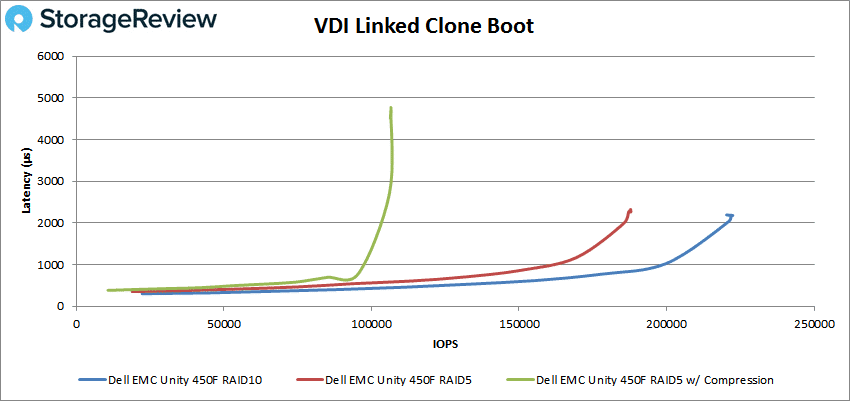
Our final selection of tests looks at VDI Linked Clone. Starting again with the boot test, the unity 450F had sub-millisecond latency until about 96K IOPS; it peaked at 106,534 IOPS with a latency of 4.77ms. The RAID5 configuration had sub-millisecond performance up until about 165K IOPS and peaked at 187,102 IOPS with a latency of 2.26ms. And the RAID10 config had performance under 1ms latency up until just shy of 200K IOPS, peaking at 221,760 IOPS with 2.18ms latency.
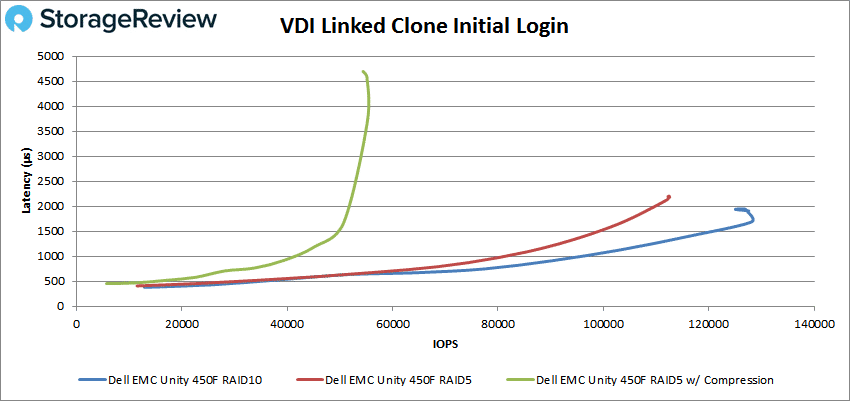
With Initial Login, the Unity 450F had sub-millisecond latency performance up until about 40K IOPS and peaked at 55,128 IOPS with a latency of 4.6ms. The RAID5 configuration stayed under 1ms latency until about 80K IOPS and peaked at 112K IOPS with 2.12ms latency. The RAID10 config made it all the way until 100K IOPS before going over 1ms latency and peaked at 128,131 IOPS with 1.7ms latency.
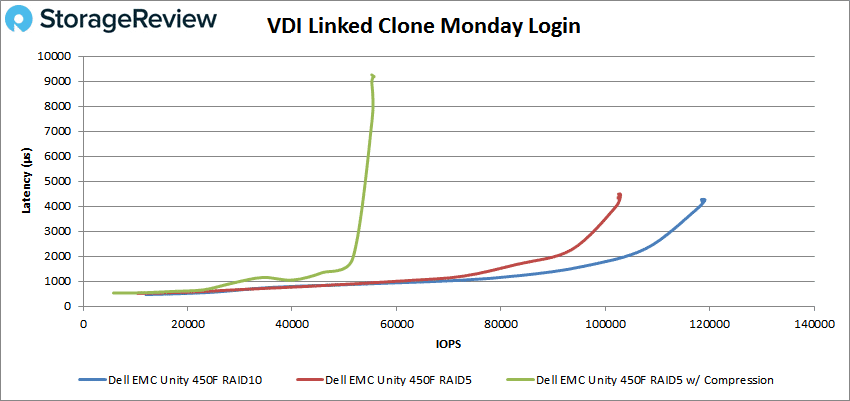
Finally, with VDI Linked Clone Monday Login, the Unity 450F with compression had sub-millisecond performance up to about 29K IOPS, peaking at 55,603 IOPS with a latency of 9.2ms. The RAID5 configuration had performance under 1ms up until about 60K IOPS and peaked at 102,936 IOPS with a latency of 4.47ms. And the RAID10 configuration once again had the best performance with sub-millisecond latency performance up until roughly 71K IOPS and a peak at 110,081 IOPS with a latency of 4.23ms.
VMware VMmark 3
VMware’s VMmark 3 is the latest version of the industry’s leading virtualization benchmark. VMmark aims to stress storage, compute and networking through complex real-world workloads and actions. Submissions for VMmark go through a stringent process that involves a review panel made up of VMware and representatives of several large vendors, many of which have published VMmark benchmark results. The rigorous review process was put in place to protect the integrity and fairness of the benchmark. StorageReview has added the formal submission of audited benchmarks to our normal review process for qualifying storage arrays.
It’s not an easy task running the VMmark 3 benchmark, nor is it easy setting up the environment to adequately stress the array to make it a meaningful storage benchmark. The StorageReview VMmark 3 test environment includes 8 Dell EMC PowerEdge R740xd servers and 4 Dell EMC PowerEdge R730 servers, both equipped with Mellanox ConnectX-4 Lx 25GbE NICs or rNDCs, as well as 2 Dell EMC Networking Z9100 switches, and a Brocade 6510 16GB FC switch.
In this review, we tested two configurations of the Dell EMC Unity 450F All-Flash Array for VMmark 3. One run was done with the array configured in RAID10, while the second run was in RAID5. Both runs were measured with inline data efficiencies (compression) disabled.
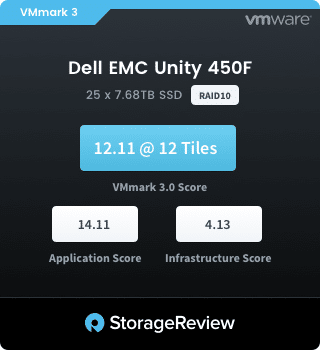
We were able to perform 12-tile benchmarks for both configurations. Each tile requires 891GB of storage, so a 12-tile run has a storage footprint of roughly 10.6TB.
In our RAID10 submission, the Dell EMC Unity 450F had a 12.11 VMmark 3.0 score, with a 14.11 Application score and 4.13 Infrastructure score. In our RAID5 submission, the Dell EMC Unity 450F measured slightly higher with a 12.43 VMmark 3.0 score, a 14.51 Application score and 4.13 Infrastructure score.
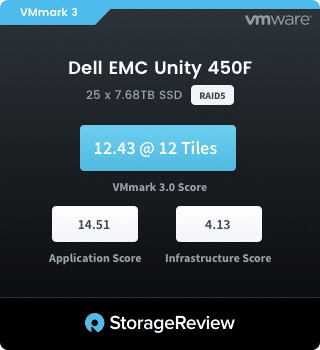
Both submissions did quite well, with the RAID5 configuration having a slight edge in performance.
Conclusion
Dell EMC released Unity to address the storage needs of the midmarket. Unity is built around simplicity of deployment, and integration into existing infrastructure and management. The F versions are the all-flash version of Unity, with higher model numbers indicating higher raw capacity and increased CPU performance that the unit can support. For our review, we looked at the midrange array with the Unity 450F. With a total raw capacity of 4PB, the 450F supports multiple capacities of SSD from 400GB all the way up to 15.36TB. All Unity arrays come with a large swath of software suites and other supported offerings. Unity is also available in a Virtual form to be deployed on existing hardware without the costs of the Dell EMC appliance.
In Sysbench testing, we ran the Unity 450F in RAID5 with compression on, in RAID5 with compression off, and in RAID10 with various VM counts. There were no real surprises here around compression dragging down performance and more so with higher VM counts (i.e., the 24VM had a TPS of 7,457.4 with compression on and 19,436.2 TPS with it off). Still, even with compression on, the Unity was able to hit 7,538 TPS with 4VM, 6,767 TPS with 8VM, 7,859 with 16VM, and as stated 7,457 TPS with 24VM. The same thing is seen in latency with the higher VM count resulting in higher latency and compression driving the latency up even further. However, latency topped out at 103.3ms with 24VMs and compression on. In our worst-case scenario, well beyond what most environments would typically see, the same test topped out at 1,387.2ms with compression on. Typical, real world scenarios had much lower latencies.
In SQL Server testing, the Dell EMC Unity 450F was able to put up impressive numbers even with compression on. In our TPS test, we saw aggregate scores of 12,623.1 TPS in RAID10, 12,619.3 TPS in RAID5, and 12,586.6 TPS in RAID5 with compression on. Compression impacted SQL Server latency a bit more. While we saw aggregate scores of 10ms in RAID10 and 11.3ms in RAID5, when compression was on, latency jumped up to 24ms.
For our VDBench tests, the Dell EMC Unity 450F was able to run at sub-millisecond in all of our tests even with compression on. In random 4K, we saw sub-millisecond performance until around 140K IOPS read and 31K IOPS write with compression on. RAID10 gave us our best performance in all our VDBench tests and in 4K, it topped around 268K IOPs and 116K IOPS read and write with latencies of 11.9ms and 4.31ms respectively. For sequential performance, we looked at our 64K benchmark where the 450F was able to hit sub-millisecond latency performance up until 31K IOPS or 1.9GB/s read and 25K IOPS or 1.56GB/s write with compression on. The RAID10 configuration was able to maintain sub-millisecond latency performance until 110K IOPS or 6.7GB/s read and 54K IOPS or 3.3GB/s write.
In our SQL VDBench workload, the 450F with compression had sub-millisecond latency performance until 149K IOPS, 130K IOPS in our 90-10, and 104K IOPS in our 80-20, while the RAID10 config maintained latency under 1ms until it hit 206K IOPS, 195K IOPs in 90-10, and 185K IOPS in 80-20. Our Oracle workloads showed sub-millisecond performance of 85K IOPS, 130K IOPS, and 110K IOPS with compression on and RAID10 gave us performance under 1ms until 156K IOPS, 200K IOPS, and 187K IOPS. For our VDI Full Clone and Linked Clone we looked at Boot, Initial Login, and Monday Login. With compression on, we saw sub-millisecond latency performance of 119K IOPS, 38K IOPS, and 44K IOPS Full Clone and 96K IOPS, 40K IOPS, and 29K IOPS Linked Clone. For comparison, the RAID10 configuration had sub-millisecond performance up until 193K IOPS, 110K IOPS, and 105K IOPS Full Clone and 200K IOPS, 100K IOPS, and 71K IOPS Linked Clone.
Clearly our lab is impressed with the 450F not just from a performance perspective, but from an integration one too. Of everything we’ve seen over the years, no storage array hooks into VMware so easily. The interface is perhaps the easiest to get acquainted with as well, perfect for the midrange target audience. Lastly, pricing on the 450F is in line with the comparables. While we tested with ~8TB SSDs, the lower capacity unit using 1TB class SSDs carries a street price right alongside the other big brands that we’ve seen with similar capacity. If there’s a place to complain, the Unity platform lacks dedupe today and the compression hit is significant in some workloads. However, Dell EMC has announced dedupe is coming soon and we know they’re tuning all of the data reduction features for more performance. In total, the Unity 450F delivers on the promise of making storage easy to manage for the midmarket, while offering a great performance profile and wide-ranging protocol support. These reasons, coupled with market pricing, are why we’re naming the Dell EMC Unity 450F the recipient of our first Editor’s Choice award of 2018.
Sign up for the StorageReview newsletter


 Amazon