

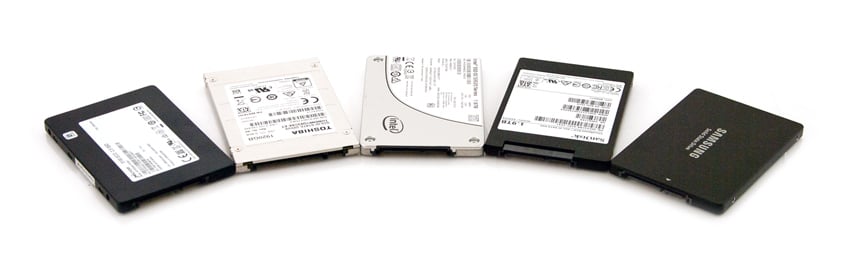
When it comes to enterprise SSD marketing currently, NVMe and high-capacity SAS drives garner most of the headlines. But behind their more showy cousins sit an entire stable of SATA SSDs that are taking the lion’s share of overall SSD units shipped. Enterprise SATA SSDs are commonly segmented further into read intensive and write intensive categories. In a few outlier cases a vendor may also ship a mixed-use drive just to cover all the bases. In reality, these drives are all the same at the core, with the key difference simply being over provisioning and firmware. Overprovisioning generally determines the usable capacity and endurance attributes of a drive. In this roundup we’re taking a non-standard approach. Our SSD reviews are generally a deep dive into a single drive. In this case we’ve lined up five of the leading read intensive SSD offerings from Intel, Toshiba, Samsung, Micron and SanDisk to see how they stack up in this lucrative market segment.
Testing Background and Comparables
The StorageReview Enterprise Test Lab provides a flexible architecture for conducting benchmarks of enterprise storage devices in an environment comparable to what administrators encounter in real deployments. The Enterprise Test Lab incorporates a variety of servers, networking, power conditioning, and other network infrastructure that allows our staff to establish real-world conditions to accurately gauge performance during our reviews.
We incorporate these details about the lab environment and protocols into reviews so that IT professionals and those responsible for storage acquisition can understand the conditions under which we have achieved the following results. None of our reviews are paid for or overseen by the manufacturer of equipment we are testing. Additional details about the StorageReview Enterprise Test Lab and an overview of its networking capabilities are available on those respective pages.
Comparables for this review
- Intel 3520 1.6TB
- Micron 5100 ECO 1.92TB
- Samsung PM863a 1.92TB
- SanDisk CloudSpeed Eco Gen2 1.92TB
- Toshiba HK4R 1.92TB
Application Workload Analysis
In order to understand the performance characteristics of enterprise storage devices, it is essential to model the infrastructure and the application workloads found in live production environments. Our first benchmarks for the RI SSD group are therefore the MySQL OLTP performance via SysBench and Microsoft SQL Server OLTP performance with a simulated TCP-C workload. For our application workloads, each drive will be running 2-4 identically configured VMs.
SQL Server Performance
Each SQL Server VM is configured with two vDisks: 100GB volume for boot and a 500GB volume for the database and log files. From a system resource perspective, we configured each VM with 16 vCPUs, 64GB of DRAM and leveraged the LSI Logic SAS SCSI controller. While our Sysbench workloads tested previously saturated the platform in both storage I/O and capacity, the SQL test is looking for latency performance.
This test uses SQL Server 2014 running on Windows Server 2012 R2 guest VMs, being stressed by Dell’s Benchmark Factory for Databases. StorageReview’s Microsoft SQL Server OLTP testing protocol employs the current draft of the Transaction Processing Performance Council’s Benchmark C (TPC-C), an online transaction-processing benchmark that simulates the activities found in complex application environments. The TPC-C benchmark comes closer than synthetic performance benchmarks to gauging the performance strengths and bottlenecks of storage infrastructure in database environments. Each instance of our SQL Server VM for this review uses a 333GB (1,500 scale) SQL Server database and measures the transactional performance and latency under a load of 15,000 virtual users.
SQL Server Testing Configuration (per VM)
- Windows Server 2012 R2
- Storage Footprint: 600GB allocated, 500GB used
- SQL Server 2014
- Database Size: 1,500 scale
- Virtual Client Load: 15,000
- RAM Buffer: 48GB
- Test Length: 3 hours
- 2.5 hours preconditioning
- 30 minutes sample period
SQL Server OLTP Benchmark Factory Host
- Supermicro SuperServer 2028U-TNR4T+
- Dual Intel E5-2699 v3 CPUs (2.3GHz, 18-cores, 45MB Cache)
- 768GB RAM (32GB x 24 DDR4, 384GB per CPU)
- CentOS 7.2
- Supermicro AOC-S3008L-L8i HBA
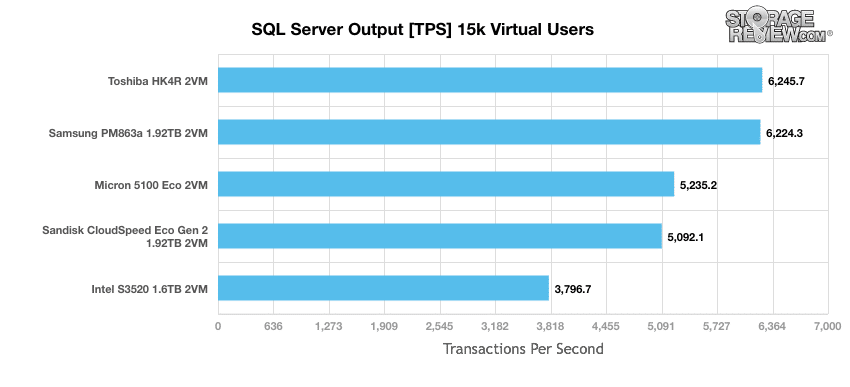
In our SQL Server TPC-C workload, looking at transaction performance we see a huge spread in performance, ranging from the Toshiba HK4R and Samsung PM863a in the lead with 6,245.7 and 6,224TPS respectively to the Intel 3520 trailing behind with 3,796.7TPS.
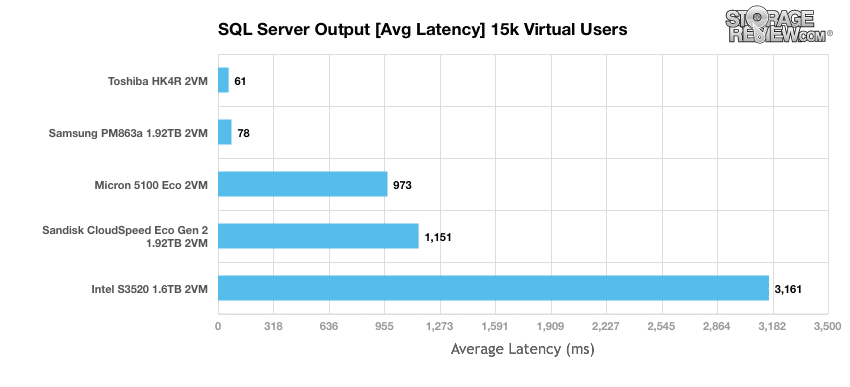
Drilling into the average latency in SQL Server, the differences between the drives becomes even more dramatic. Again the Toshiba HK4R and Samsung PM863a lead the pack with 61ms and 78ms, with the Micron 5100 ECO jumping to 973ms, the SanDisk CloudSpeed Eco Gen2 measuring 1,151 and lastly the Intel 3520 peaking at 3,161ms.
Sysbench Performance
The next application benchmark consists of a Percona MySQL OLTP database measured via SysBench. This test measures average TPS (Transactions Per Second), average latency, and average 99th percentile latency as well.
Each Sysbench VM is configured with three vDisks: one for boot (~92GB), one with the pre-built database (~447GB), and the third for the database under test (270GB). From a system resource perspective, we configured each VM with 16 vCPUs, 60GB of DRAM and leveraged the LSI Logic SAS SCSI controller.
Sysbench Testing Configuration (per VM)
- CentOS 6.3 64-bit
- Percona XtraDB 5.5.30-rel30.1
- Database Tables: 100
- Database Size: 10,000,000
- Database Threads: 32
- RAM Buffer: 24GB
- Test Length: 3 hours
- 2 hours preconditioning 32 threads
- 1 hour 32 threads
Sysbench OLTP Host
- Supermicro SuperServer 2028U-TNR4T+
- Dual Intel E5-2699 v3 CPUs (2.3GHz, 18-cores, 45MB Cache)
- 768GB RAM (32GB x 24 DDR4, 384GB per CPU)
- CentOS 7.2
- Supermicro AOC-S3008L-L8i HBA
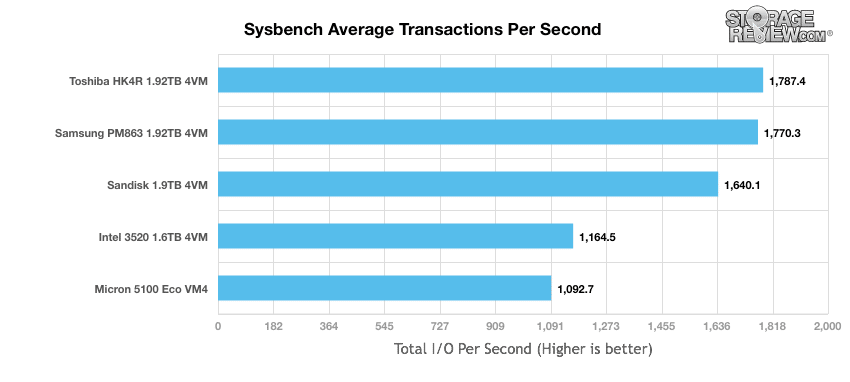
In the average transactions-per-second metric, we see another large spread between the drives in the read-intensive group, with the Toshiba HK4R leading the pack at 1,787.4TPS aggregate and the Micron 5100 ECO trailing the group at 1,092.7TPS. Again the Samsung was close in the #2 position, with a large spread in performance following it.
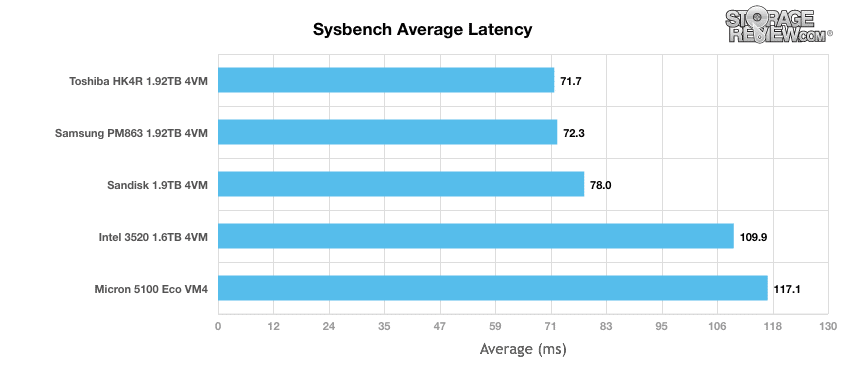
Comparing average latency between the different read-intensive SATA SSDs, we measured an average starting at 71.7ms with the Toshiba HK4R, 72.3ms from the Samsung PM863a, 78ms from the SanDisk CloudSpeed Eco Gen2, 109.9ms from the Intel 3520 and 117ms from the Micron 5100 ECO.
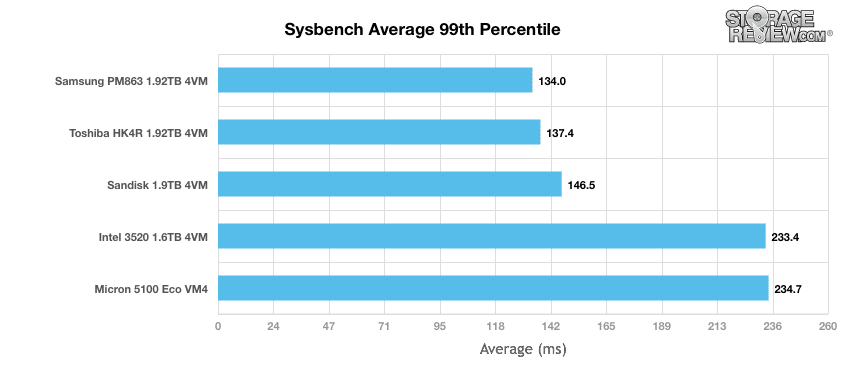
There was a subtle change looking at 99th percentile, with the Samsung PM863a taking the lead with the most consistent latency spread at 134ms whereas the Intel 3520 trailed the group with a measurement of 233.4ms.
Enterprise Synthetic Workload Analysis
Flash performance varies as the drive becomes conditioned to its workload, meaning that flash storage must be preconditioned before each of the fio synthetic benchmarks in order to ensure that the benchmarks are accurate. Each of the comparable drives are preconditioned into steady-state with a heavy load of 16 threads and an outstanding queue of 16 per thread.
Preconditioning and Primary Steady-State Tests:
- Throughput (Read+Write IOPS Aggregate)
- Average Latency (Read+Write Latency Averaged Together)
- Max Latency (Peak Read or Write Latency)
- Latency Standard Deviation (Read+Write Standard Deviation Averaged Together)
Once preconditioning is complete, each device is then tested in intervals across multiple thread/queue depth profiles to show performance under light and heavy usage. Our synthetic workload analysis for the RI SATA SSDs focuses on one profile, our 8K 70/30 mixed random workload It is important to take into consideration that synthetic workloads will never 100% represent the activity seen in production workloads, and in some ways inaccurately portray a drive in scenarios that wouldn’t occur in the real world.
- 8k
- 70% Read/30% Write
FIO Host
- Supermicro SuperServer 2028U-TNR4T+
- Dual Intel E5-2699 v3 CPUs (2.3GHz, 18-cores, 45MB Cache)
- 768GB RAM (32GB x 24 DDR4, 384GB per CPU)
- CentOS 7.2
- Supermicro AOC-S3008L-L8i HBA
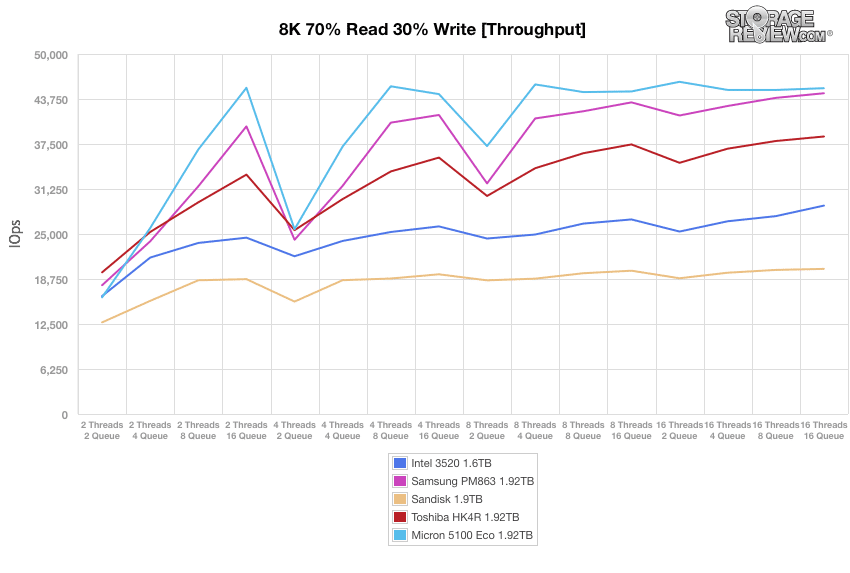
Our 8k benchmark uses a ratio of 70% read operations and 30% write operations. In our throughput test the Micron 5100 Eco starts off in the lead and was able to maintain this lead throughout the testing. The Micron 5100 Eco peaked at 46,137 IOPS and had the Samsung PM863 not too far behind throughout.
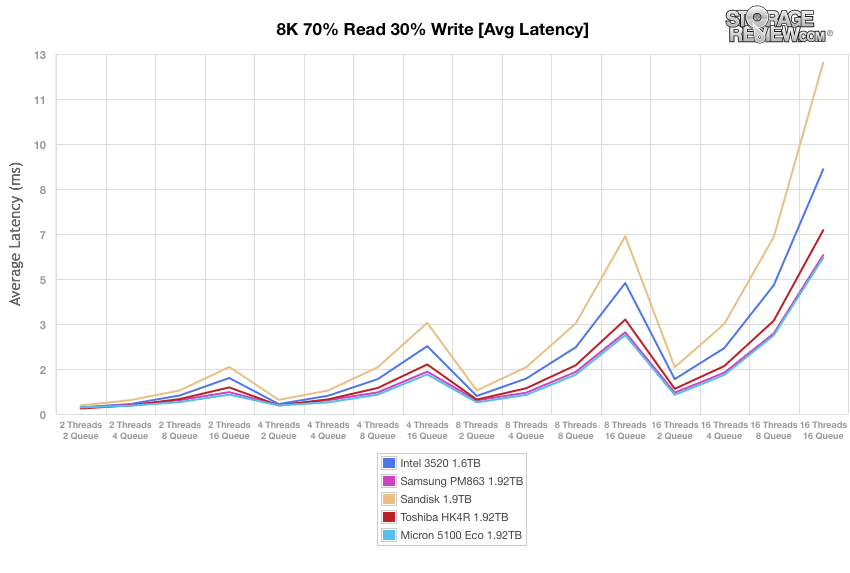
Looking at average latency, the Micron 5100 Eco had the lowest latency barely squeaking by the Samsung PM863 that ran neck and neck throughout the entire benchmark.
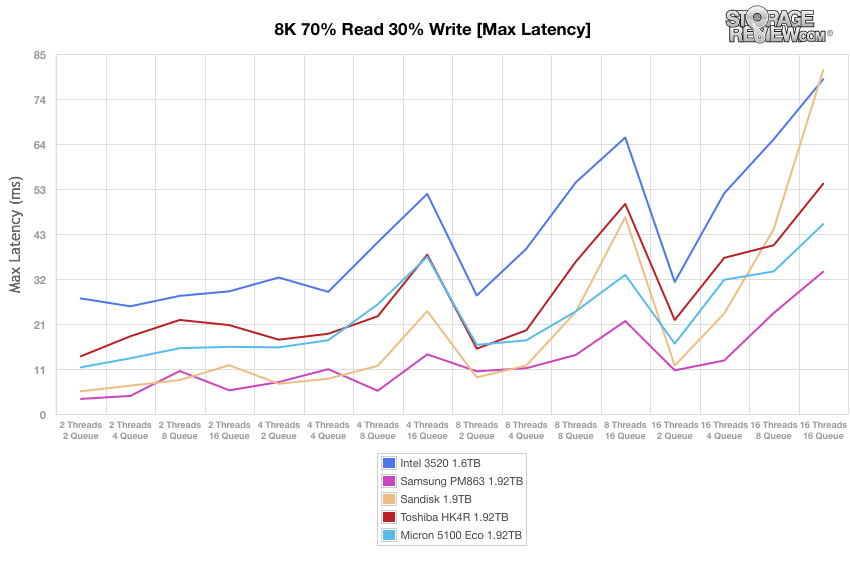
Max latency had the Samsung PM863 take the top spot with the lowest latency of all the drives, though it traded back and forth with the SanDisk.
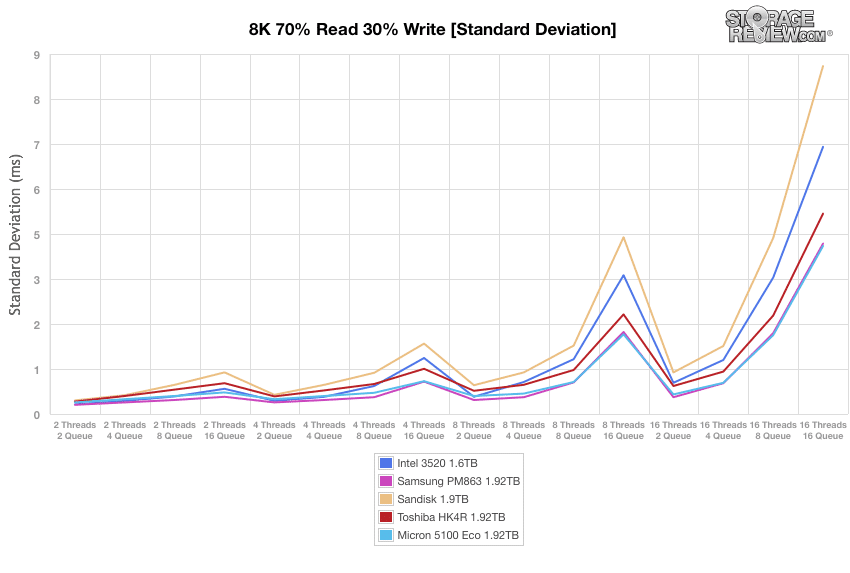
With standard deviation, once again the Samsung and the Micron battled it out for top spot. Though it is difficult to see on the chart, the Samsung had the lowest latency throughout most of the test before slipping slightly behind the Micron near the end.
Conclusion
The market for SATA enterprise SSDs is thriving, in good part thanks to software defined storage and HCI deployments that can effectively manage SATA drives and still provide the storage services organizations expect. VMware vSAN for instance takes a cache-based approach where the majority of the SSDs in a deployment will be SATA drives. Thanks to data reduction technologies (compression, dedupe) a 1.92TB SATA SSD (or 1.6TB if you’re Intel) can offer an effective capacity of 2-5 times that amount while maintaining a lower-cost profile. The explosion of these more flexible storage systems certainly bodes well for the entire SATA SSD category.
Market trends make this a perfect time to look at the most attainable category of enterprise SSD storage, read-intensive SATA drives. Interestingly a few of these drives are a bit long in the tooth, some have taken different capacity point strategies, but all are in the market today and the best offering from each vendor in this category. In our testing, the results are pretty clear, Toshiba and Samsung lead the pack in terms of application performance, with Toshiba taking the top spots. In our synthetic workload, the Micron 5100 ECO took the top spot, in front of both the Samsung PM863a and Toshiba HK4R, although those results didn’t translate over into our application tests.
In the end Toshiba is the leader, with Samsung very hot on their heels; the real question for customers is going to be around pricing. It’s hard to find a way to recommend the other three drives, especially the Intel, which in addition to poor performance, doesn’t refund the 320GB of capacity the other vendors do.


 Amazon