

This summer HPE made several portfolio updates including the release of the fifth generation MSA platforms consisting of the MSA 2050 and MSA 2052 entry-level SAN arrays. Starting at under $10,000, the new MSA systems deliver a deep set of well-proven features (500,000 systems sold), along with reliability and ease of use that MSA has long been known for. The MSA 2050 family is no slouch, though, touting an impressive 200K IOPS of throughput. It is certainly able to compete outside its weight class. HPE offers a couple of options in the latest MSA line, both leveraging the same chassis. The MSA 2050 can leverage HDDs with SSD pools or SSD caching, while the MSA 2052 comes with the licenses and two included SSDs for performance tiering. In a cache scenario, customers would typically add two SSDs to the mix, where a tiering configuration would generally have four SSDs. For the emphasis of this review, we’ll focus in on the MSA 2052 with four SSDs for tiering.
Beyond flexibility in drive configuration, the MSA 2052 handles all the connectivity needs a business could require, with support for four Fibre Channel (8/16) or iSCSI 10GbE ports per controller. These ports can be all Fibre, all iSCSI, or a blend–should the deployment scenario call for it. HPE indicates that many customers take full advantage of the mixing of FC and iSCSI on these arrays, frequently using two ports for local FC and two ports for iSCSI remote replication. The head units are dual controller in active/active configuration. Our chassis includes the fairly typical 24-bay 2.5″ SAS backplane, but there are LFF options as well, when total capacity is more of a concern. The MSA family is also expandable with SFF or LFF JBODs for additional capacity. Incidentally, these LFF drives can be treated as a third tier in either the MSA 2050 or MSA 2052 where the MSA intelligently manages the lifecycle of hot to cold data, migrating it from flash to the lowest cost tier over its lifetime.
In the MSA 2052, 1.6TB of flash and all software licensing is included in the system and ready to go out of the box. Should an MSA 2050 owner decide to add flash later, the process is as straightforward as adding the drives to the system and enabling caching or tiering after an appropriate license is applied. In either case, the entire process is automated, MSA does all the work as workloads change, and no management or thought by the end user is required to take advantage of these features. HPE also offers virtualized snapshots to make data protection and recovery easy. The MSA line also supports remote replication, for those who want to have a disaster recovery location off site.
The MSA 2052 under review is configured with 800GB SSDs and 1.2TB 10K HDDs. Drives are configured in two pools, one for each controller; 10 HDDs fronted by twin SSDs for tiering.
HPE MSA 2052 Specifications
- Drive description: Up to 192 SFF SSD/SAS/MDL SAS or 96 LFF SSD/SAS/MDL SAS maximum including base array and expansion, depending on model
- Max. drive type:
- 10 TB 12G 7.2K LFF dual-port MDL SAS HDD
- 1.8 TB 12G 10K SFF dual-port SAS HDD
- 2 TB 12G 7.2K SFF dual-port MDL SAS HDD
- 3.2 TB SFF SSD
- Max. raw capacity:
- Supported 614 TB SFF/960 TB LFF maximum raw capacity
- Including expansion, depending on model
- Storage expansion options:
- HPE MSA 2050 LFF Disk Enclosure
- HPE MSA 2050 SFF Disk Enclosure
- Host interface options:
- 8 Gb/16 Gb FC 8 ports per system or
- 1GbE/10GbE iSCSI 8 ports per system
- Storage controllers: 2 controllers, active/active
- SAN backup support
- RAID levels: 1, 5, 6, 10
- HPE Systems Insight Manager (SIM) support
- Compatible operating systems
- Microsoft Windows Server 2016
- Microsoft Windows Server 2012
- VMware
- HP-UX
- Red Hat Enterprise Linux
- SUSE Linux
- Clustering support: Windows, Linux, HP-UX
- Form factor: 2U base array, 2U LFF or SFF disk enclosures
Design and Build
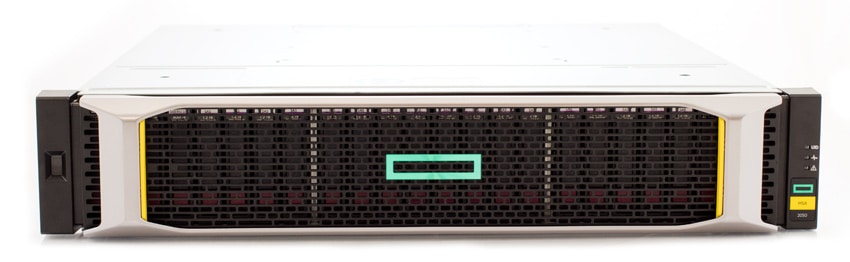
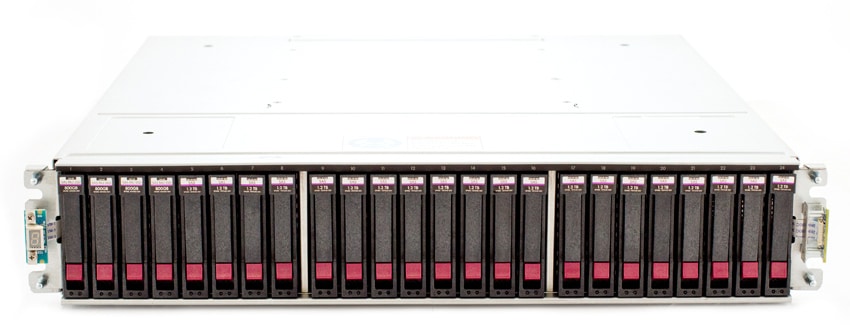
Our MSA 2052 review unit leverages the 2U 2.5″ drive chassis, though an LFF chassis is also available. Behind the HPE bezel sit the 24 drive carriers.
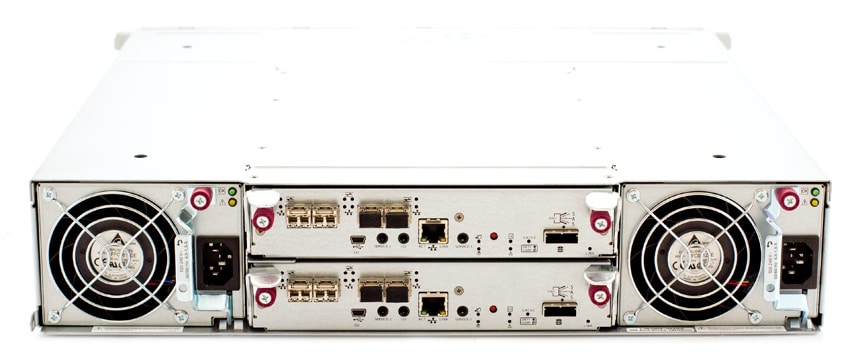
Around the back of the unit, the two controllers are stacked in the middle, flanked on either side by power supplies. On the controllers, the first four ports are for high-speed connectivity, either via Fibre Channel, 10GbE, or a combination of both (2 FC and 2 iSCSI). Underneath is miniUSB CLI port. To the right of that is an out-of-band management Ethernet port and a SAS expansion port for additional JBODs.
Management
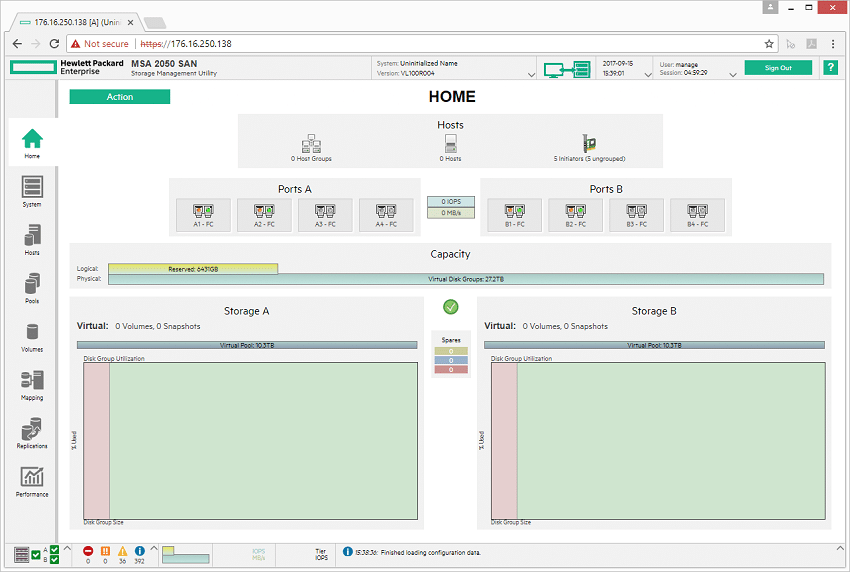
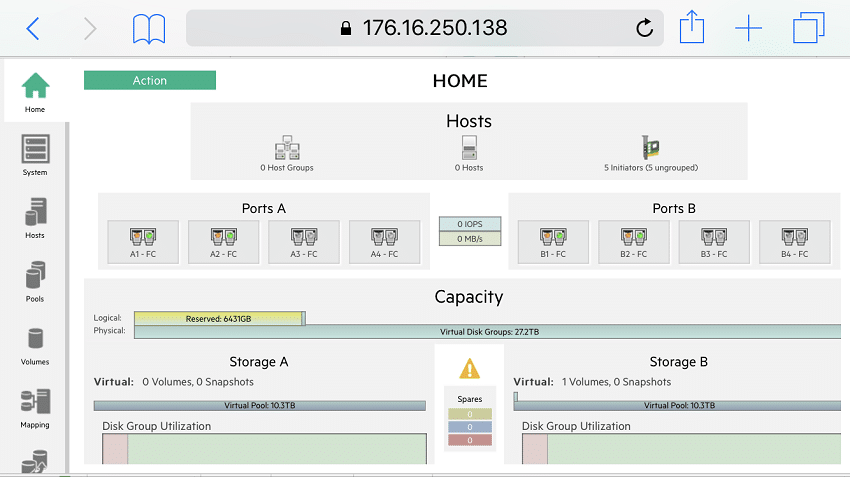
The MSA interface remains very familiar for those who have administered storage before. Even those new to the system will find it intuitive, if not full of HTLM5 glitz and glamour. At the management landing page users have all the important stats at their fingertips, including connected hosts, real-time transfer speeds, connected array ports, storage capacity, as well as utilization. The interface is compatible with a broad range of web browsers without requiring any additional software to be installed to manage it. Advanced users can also leverage a broad range of CLI commands through its console access.
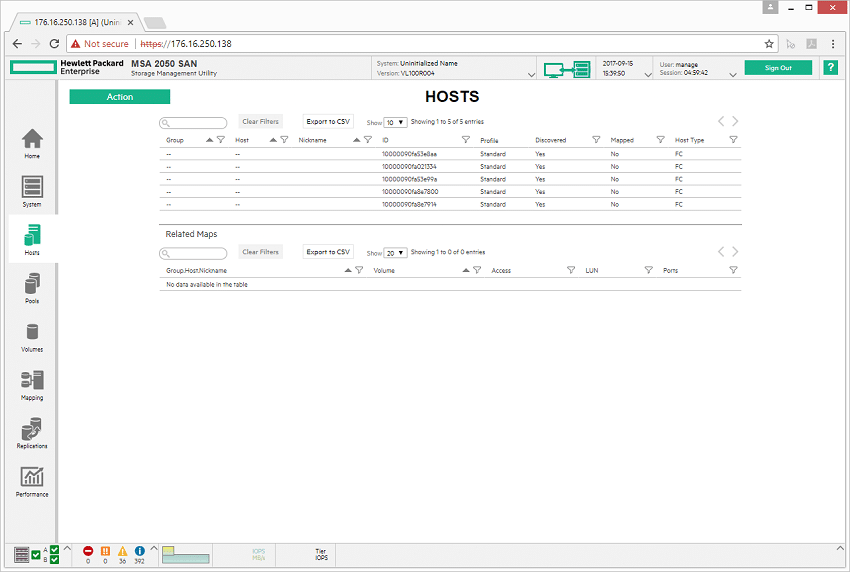
Moving through the interface, the Hosts tab gives users access to all the visible hosts, both FC and iSCSI depending on configuration. From here, you can see if hosts have proper mapping setup, or quickly share or modify a mapped LUN.
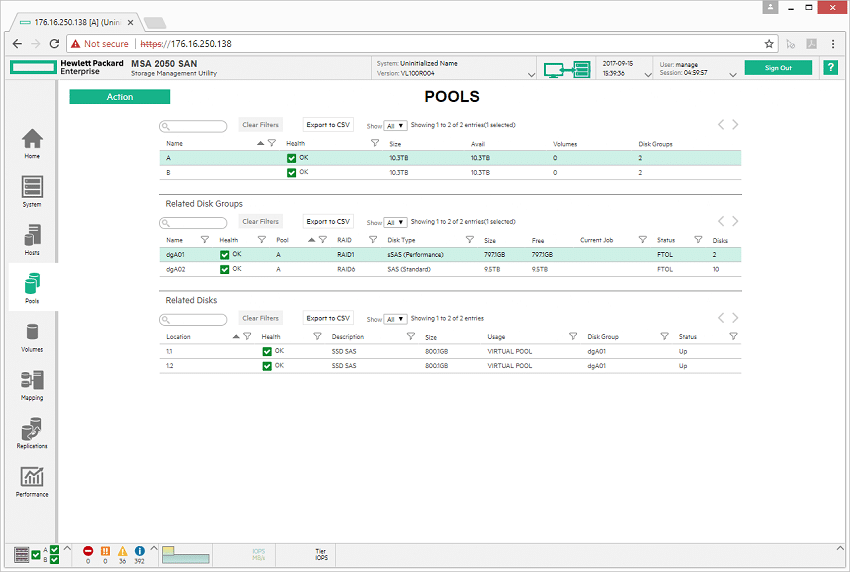
Through the Pools tab, users are able to view, modify and manage existing storage pools. In our case, we can see two storage pools (split between the dual controllers), each with one RAID1 SSD disk group as well as a single RAID6 HDD disk group. Drilling further down, you can see the health of the individual disks that make up the disk group. This will also show the breakdown of storage consumption at the tier level to view where data is currently situated.
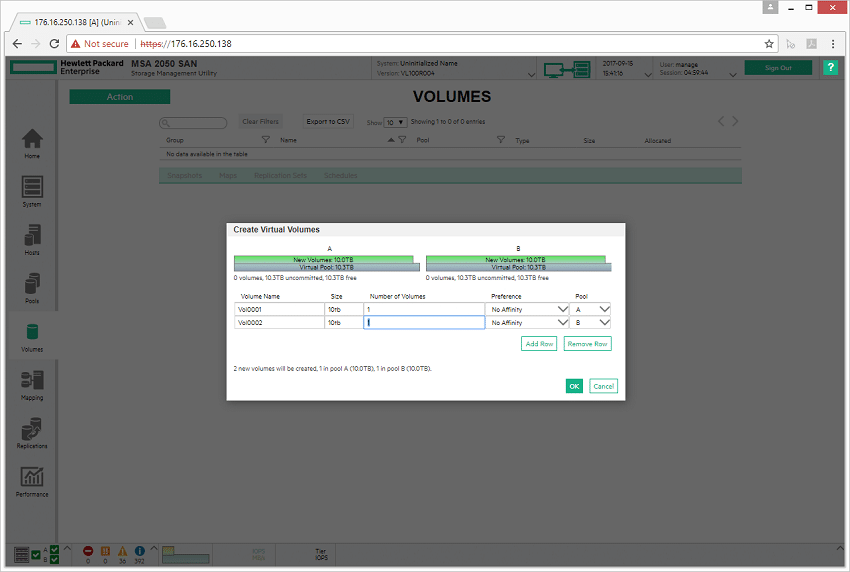
The Volumes tab (as the name implies) is where you are able to create and provision storage. Creating storage can be quickly addressed as a one-off creation, or you can quickly make multiple volumes at the same time. Users are able to select which pool the storage is located inside of, as well as a preference to which storage tier the data should reside.
Nearly full functionality was offered through a mobile browser, in this case a lab iPhone. While the interface was a tad hard to read, it was nice having that option just in case it was the only thing around and a change had to be made. It should be noted that HPE doesn’t officially support mobile browsers for MSA management, but most functionality worked well in our testing regardless.
Application Workload Analysis
The application workload benchmarks for the HPE MSA 2052 SAN Storage consist of the MySQL OLTP performance via SysBench and Microsoft SQL Server OLTP performance with a simulated TPC-C workload. In each scenario, the array is leveraging a LUN served from a disk group configured with one RAID1 SSD pair. Two LUNs were leveraged, balanced across both controllers. We chose the configuration allocating only the flash in each storage pool to speed up the data progression process for the purposes of testing. All testing was performed over 16Gb FC, two ports per controller.
We tested two flash configurations in this unit. The first includes 3.2TB (1.6TB usable) of raw flash across four 800GB SSDs, and the second includes 6.4TB (3.2TB usable) of raw flash across four 1.6TB SSDs. Given the entry pricing of the MSA 2052, most users will opt for smaller capacity SSDs. We included both to show more what the controllers are capable of. At its peak workload with 8VMs of Sysbench running, each controller leveled off at 80-85% CPU utilization.
The HPE MSA 2052 supports both SSD cache and tiering. In this review our focus is entirely on tiering performance. On this unit, SSD cache is read-only, so only read activity is accelerated. Tiering supports both read and write acceleration. As you might expect, read cache can be enabled with just one SSD per pool, whereas R/W tiering requires a minimum of two SSDs in RAID1 (or 3-4 SSDs for RAID5/6). Additional SSDs add a significant cost to the overall purchase price of the array.
SQL Server Performance
Each SQL Server VM is configured with two vDisks: 100GB volume for boot and a 500GB volume for the database and log files. From a system resource perspective, we configured each VM with 16 vCPUs, 64GB of DRAM and leveraged the LSI Logic SAS SCSI controller. While our Sysbench workloads tested previously saturated the platform in both storage I/O and capacity, the SQL test is looking for latency performance.
This test uses SQL Server 2014 running on Windows Server 2012 R2 guest VMs, and is stressed by Quest’s Benchmark Factory for Databases. While our traditional usage of this benchmark has been to test large 3,000-scale databases on local or shared storage, in this iteration we focus on spreading out four 1,500-scale databases evenly across the MSA 2052 (two VMs per controller).
SQL Server Testing Configuration (per VM)
- Windows Server 2012 R2
- Storage Footprint: 600GB allocated, 500GB used
- SQL Server 2014
- Database Size: 1,500 scale
- Virtual Client Load: 15,000
- RAM Buffer: 48GB
- Test Length: 3 hours
- 2.5 hours preconditioning
- 30 minutes sample period
SQL Server OLTP Benchmark Factory LoadGen Equipment
- Dell PowerEdge R730 Virtualized SQL 4-node Cluster
- Eight Intel E5-2690 v3 CPUs for 249GHz in cluster (two per node, 2.6GHz, 12-cores, 30MB Cache)
- 1TB RAM (256GB per node, 16GB x 16 DDR4, 128GB per CPU)
- 4 x Emulex 16GB dual-port FC HBA
- 4 x Emulex 10GbE dual-port NIC
- VMware ESXi vSphere 6.5 / Enterprise Plus 8-CPU
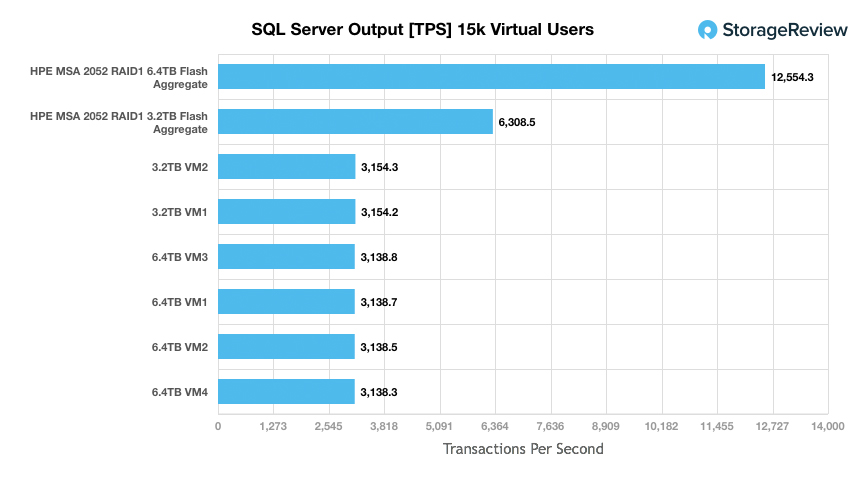
We measured the performance of two SQL Server configurations. One leveraged four 800GB SSDs, while the other used four 1.6TB SSDs. With the size of our SQL Server VMs, this meant one could fully fit two of these VMs while the other could fit four. Both SSDs are from the same model series, so the main focus on this is how the controller behaves under the increased workload. With 2VMs, we measured an aggregate TPS of 6,308, where four VMs nearly doubled that to 12,554TPS.
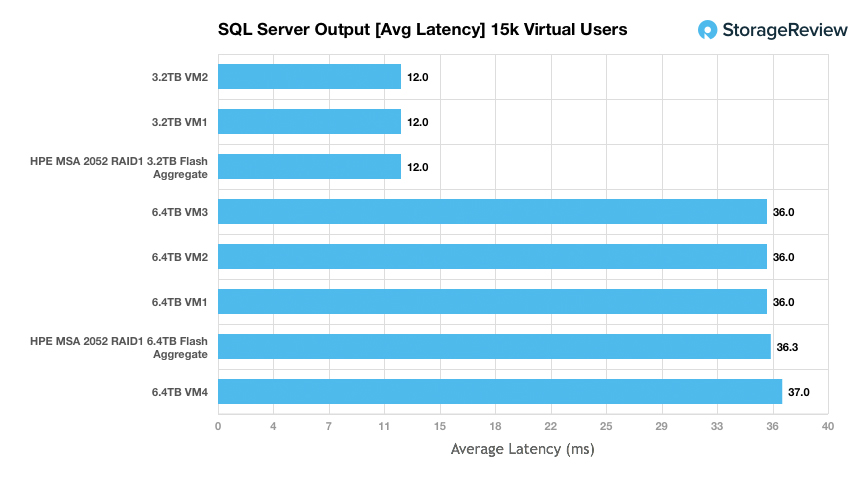
Looking at average latency, we saw the MSA 2052 really shine. With 2VMs, we measured an average latency of 12ms for each VM. To put this in perspective, the fastest all-flash array we’ve tested to date measured 9.8ms across four. As we stepped the workload up to 4VMs with the larger SSDs, latency increased to an average of 35.25ms–still very good.
Sysbench Performance
Each Sysbench VM is configured with three vDisks, one for boot (~92GB), one with the pre-built database (~447GB), and the third for the database under test (270GB). From a system-resource perspective, we configured each VM with 16 vCPUs, 60GB of DRAM and leveraged the LSI Logic SAS SCSI controller. Load gen systems are Dell R730 servers; we use four in this review, with 1-2VMs per host.
Dell PowerEdge R730 Virtualized MySQL 4 node Cluster
- 8 Intel E5-2690 v3 CPUs for 249GHz in cluster (Two per node, 2.6GHz, 12-cores, 30MB Cache)
- 1TB RAM (256GB per node, 16GB x 16 DDR4, 128GB per CPU)
- 4 x Emulex 16GB dual-port FC HBA
- 4 x Emulex 10GbE dual-port NIC
- VMware ESXi vSphere 6.5 / Enterprise Plus 8-CPU
Sysbench Testing Configuration (per VM)
- CentOS 6.3 64-bit
- Storage Footprint: 1TB, 800GB used
- Percona XtraDB 5.5.30-rel30.1
- Database Tables: 100
- Database Size: 10,000,000
- Database Threads: 32
- RAM Buffer: 24GB
- Test Length: 3 hours
- 2 hours preconditioning 32 threads
- 1 hour 32 threads
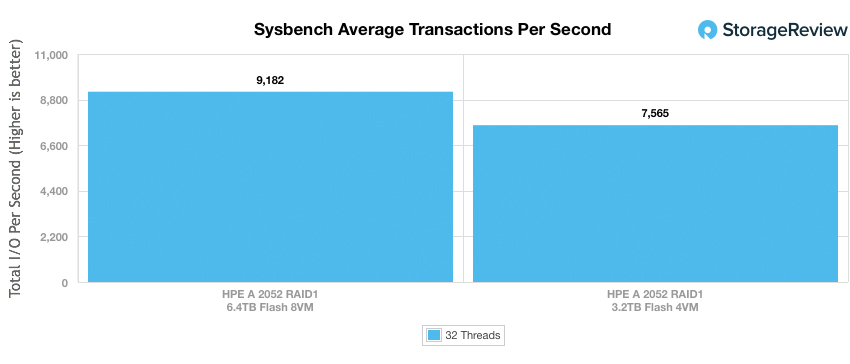
The HPE MSA 2052 offered exceptional performance in our Sysbench MySQL performance, putting out quite a lot of performance at a 4VM workload. To put this in perspective, this entry-priced array offered higher performance out of the gate than two of our recently reviewed all-flash arrays. As we ramped up the workload with higher capacity SSDs, we did see performance scale to 9,182TPS. At this stage, the controllers still has some head-room left in them, which is great for future expansion. However, adding additional SSDs would make the cost-profile of the array get too lopsided.
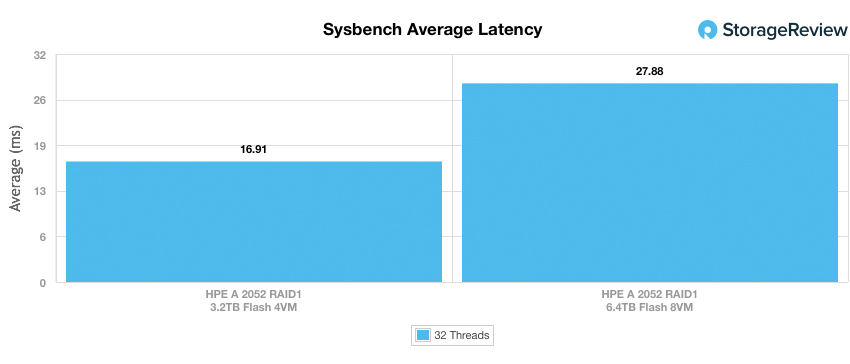
Average latency in both of our 4VM and 8VM workloads measured 16.91 and 27.88ms respectively.
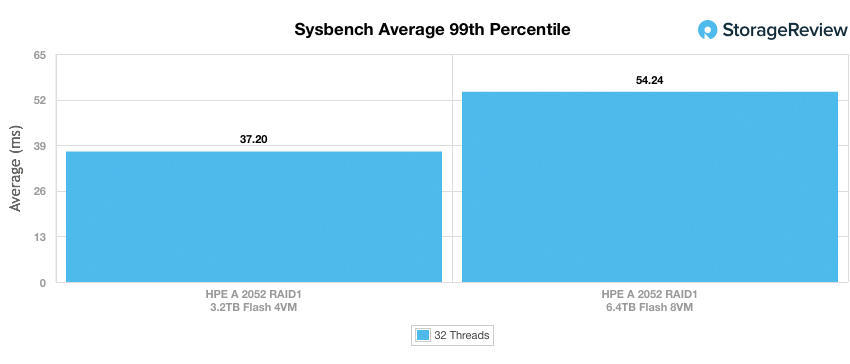
Looking at how well the array handled itself under load, we look at our 99th percentile latency at both 4VM and 8VM workload levels. In this case, the MSA 2052 maintained its composure, with values of 37.20ms at 4VM and 54.24ms at 8VM. These weren’t too far off from the leading all-flash arrays we’ve reviewed recently.
VDBench Workload Analysis
When it comes to benchmarking storage arrays, application testing is best, and synthetic testing comes in second place. While not a perfect representation of actual workloads, synthetic tests do help to baseline storage devices with a repeatability factor that makes it easy to do apples-to-apples comparison between competing solutions. These workloads offer a range of different testing profiles ranging from “four corners” tests, common database transfer size tests, as well as trace captures from different VDI environments. All of these tests leverage the common vdBench workload generator, with a scripting engine to automate and capture results over a large compute testing cluster. This allows us to repeat the same workloads across a wide range of storage devices, including flash arrays and individual storage devices. On the array side, we use our cluster of Dell PowerEdge R730 servers:
Profiles:
- 4K Random Read: 100% Read, 128 threads, 0-120% iorate
- 4K Random Write: 100% Write, 64 threads, 0-120% iorate
- 64K Sequential Read: 100% Read, 16 threads, 0-120% iorate
- 64K Sequential Write: 100% Write, 8 threads, 0-120% iorate
- Synthetic Database: SQL and Oracle
- VDI Full Clone and Linked Clone Traces
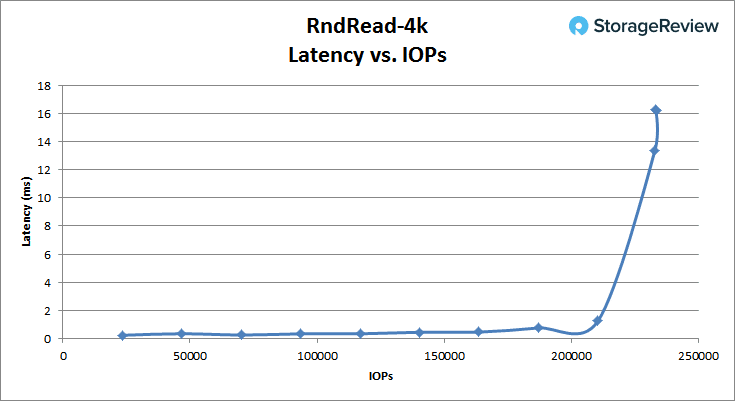
The HPE MSA 2052 performed very well in our first synthetic profile looking at 4K random read performance. The unit maintained sub-1ms latency past 187k IOPS, going over that threshold above 200k IOPS, and offering peak throughput at 233k IOPS, with an average latency of 16.2ms.
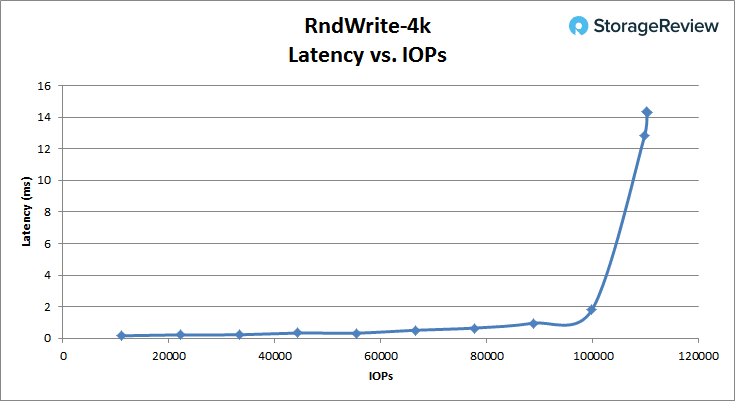
4K random-write performance was also very strong on the MSA 2052, with sub-1ms latency through 90K IOPS, where it finally topped out at 110K IOPS with an average latency of 14.3ms.
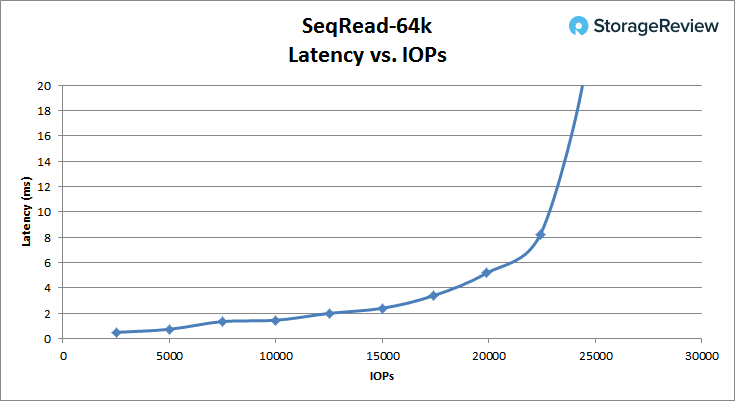
The HPE MSA 2052 handled itself well with large-block transfers as we saw in our 64K sequential read test. The MSA 2052 offered over 5000 IOPS of performance under 1ms of latency, and topped out at 24.5K IOPS at 20.8ms. In terms of read bandwidth, it peaked out at 1.53GB/s.
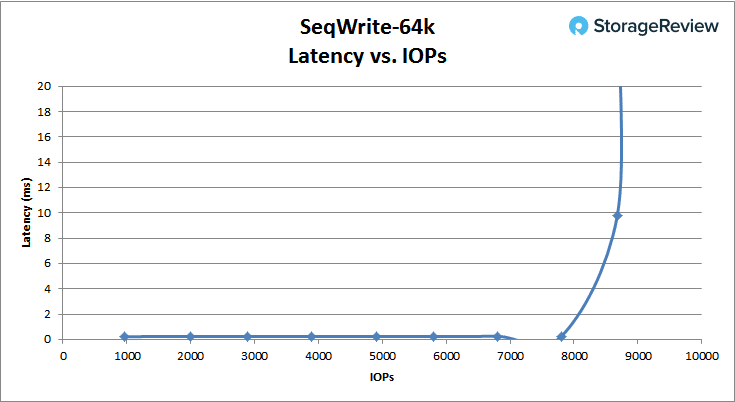
The MSA 2052 had no problem ingesting large sequential data streams, as we saw under .25ms average latency up through 7,800 IOPS. At its peak, we saw write bandwidth top out at 9,200 IOPS or 572MB/s, with an average latency of 24.3ms.
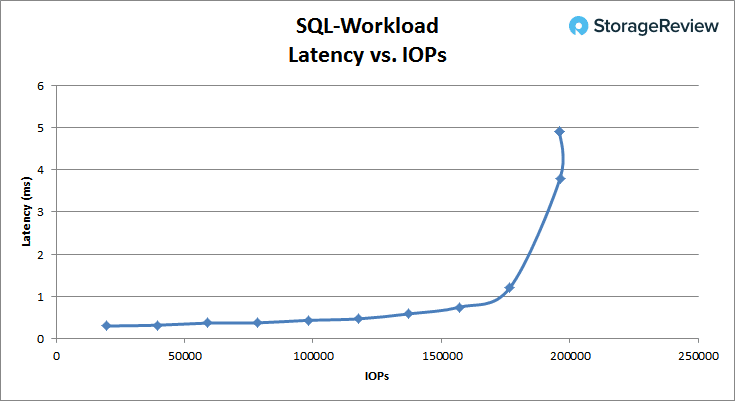
In our SQL server approximation workload, we measured sub-1ms average latency up through 170k IOPS, where the array continued to go up to a peak of 195K IOPS at 4.89ms latency.
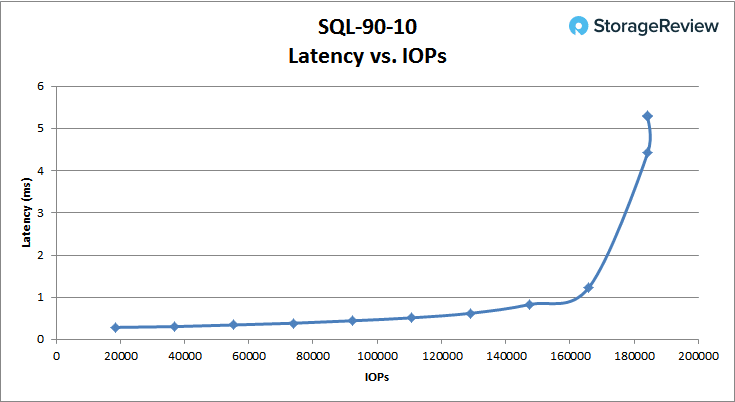
In our SQL 90/10 workload, the MSA 2052 maintained sub-1ms latency through 160K IOPS, before topping out at 184K IOPS with an average latency of 5.3ms.
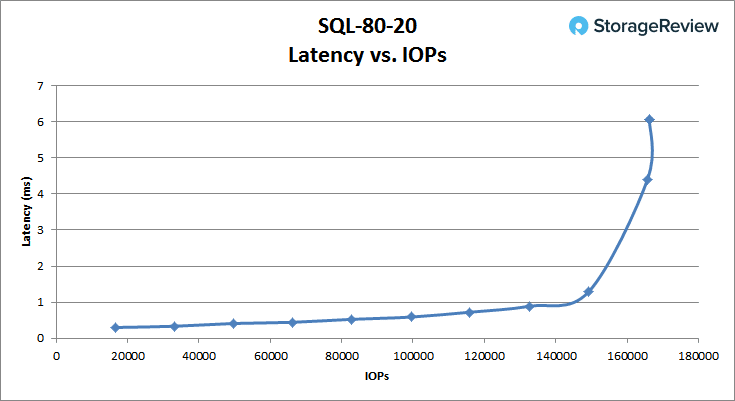
Looking at SQL 80/20, we measured sub-1ms latency through 145K IOPS where performance continued to climb after that to 166K IOPS at 6.1ms average latency.
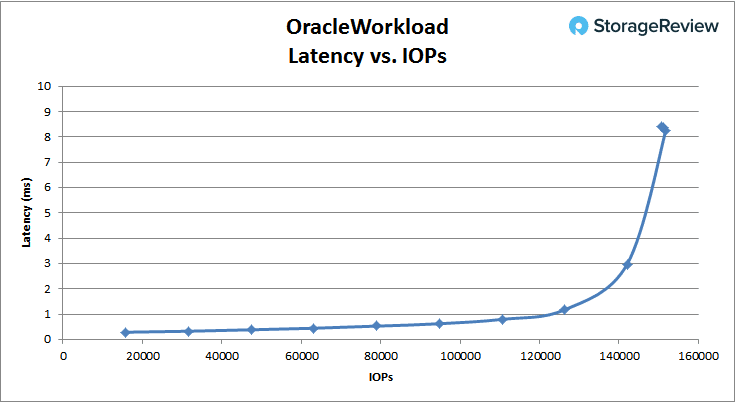
In our Oracle workload profile, the MSA 2052 maintained its sub-1ms latency up through 120K IOPS, before topping out at 151.7k IOPS at 8.3ms latency.
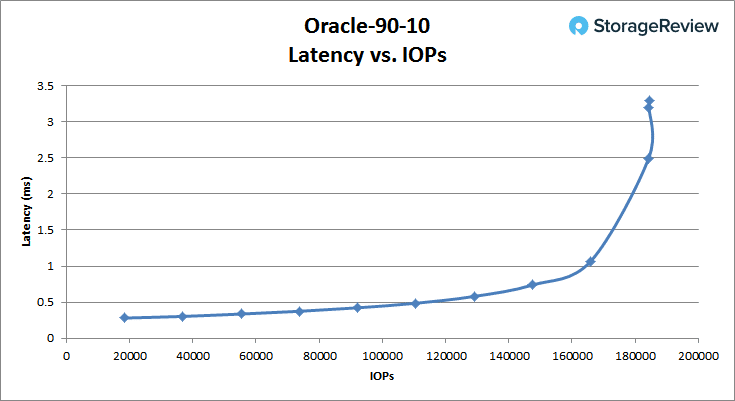
With a larger read-spread, the MSA 2052 maintained low-latency performance up through 160K IOPS before crossing over 1ms. After it breached 1ms, the throughput continued to rise up to 184.3K IOPS at 3.3ms latency.
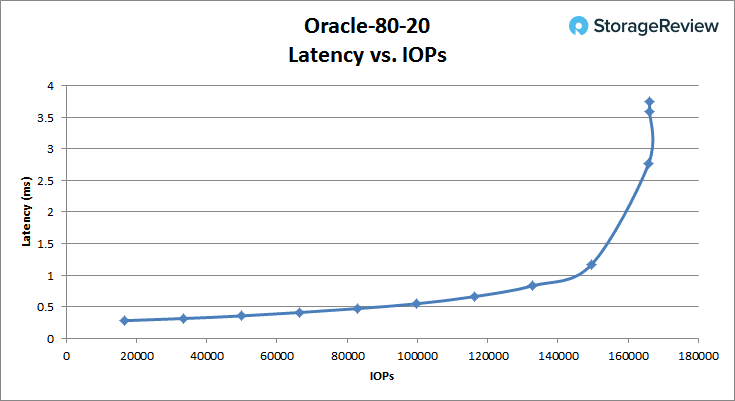
With a slight decrease in its read-ratio, the MSA 2052 still offered strong performance, this time passing over 1ms of latency at just over 140k IOPS. Performance continued to increase up to a peak of 166K IOPS at 3.74ms latency.
Looking at our VDI Full-Clone boot profile, the MSA 2052 maintained sub-1ms latency up through about 65K IOPS, before topping out at 116.7K IOPS at 8.9ms latency.
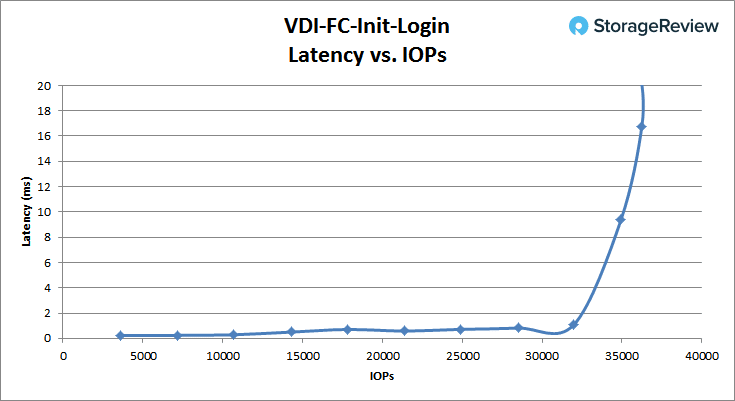
Switching to our Initial Login profile, we find sub-1ms performance up to around 31K IOPS, before quickly jumping to 16.8ms latency with a peak throughput of 36.2K IOPS.
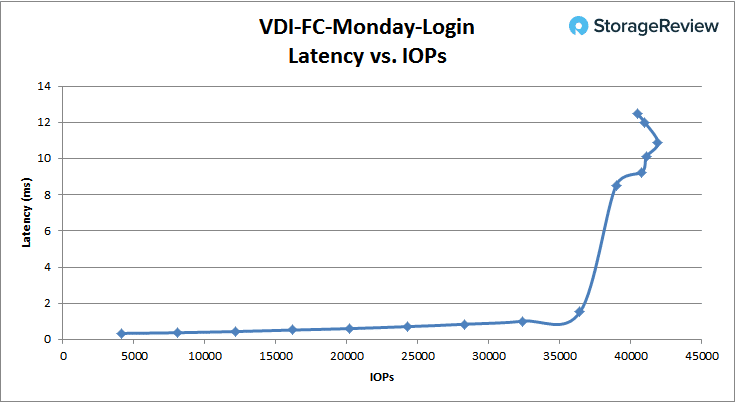
Our last Full-Clone VDI profile looked at a Monday Login profile, which saw performance go up to 32k IOPS while maintaining a latency at or below 1ms. Performance continued to increase up to 41.9k IOPS with a latency of 10.9ms.
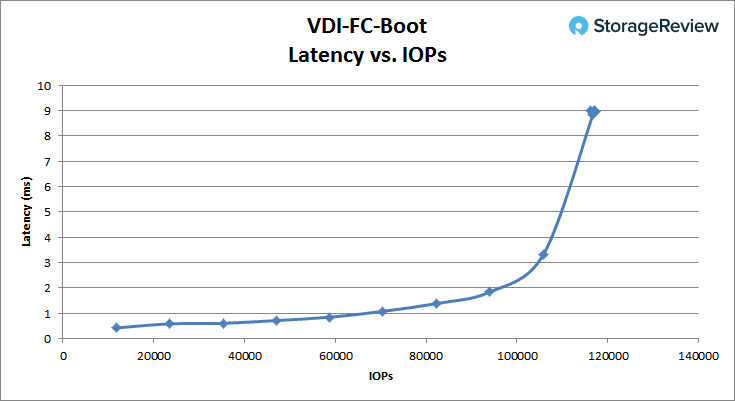
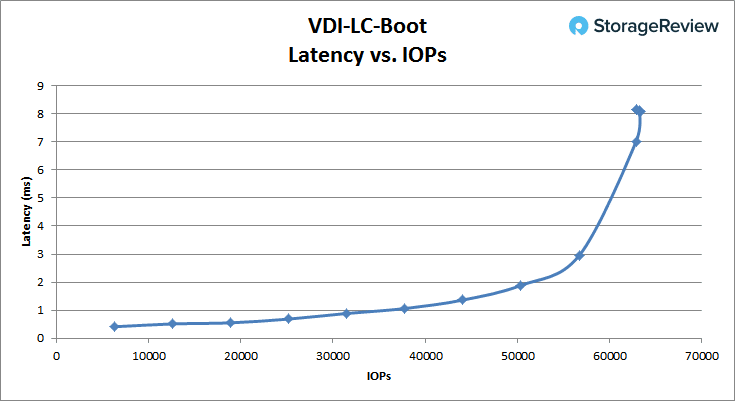
Changing from full to linked-clones in our VDI boot profile, we measured sub-1ms latency up through 32K IOPS. The unit eventually topped out at 63.3K IOPS with an average latency of 8.1ms.
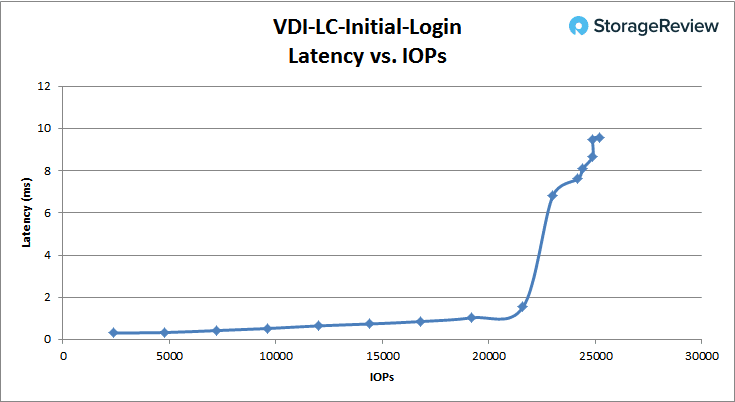
In our linked-clone Initial Login profile, we measured latency under 1ms up through about 19K IOPs, before latency peaked at 9.5ms with a speed of 24.9k IOPS.
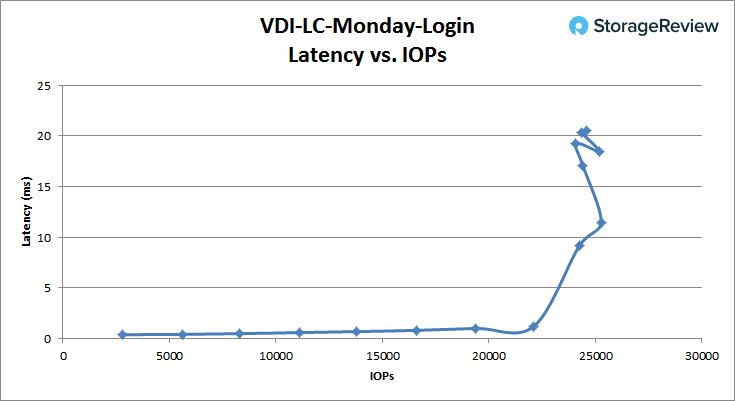
Our final linked-clone VDI workload profile measured Monday Login performance, where the MSA 2052 maintained up to around 21K IOPS with sub-1ms latency, before topping out at 25.3K IOPS at 11.5ms latency.
Conclusion
The MSA 2052 continues the lengthy heritage that MSA has offered SMBs and midmarket customers for years. While there’s quite a bit of excitement and marketing push to all-flash arrays, the truth of the matter is that for many businesses, the value and performance profile a well-executed hybrid can bring to the table is more than sufficient. In this class of storage, successful results are as much about meeting application needs with enough performance as they are about having a system that’s reliable and easy to manage. The MSA 2052 easily hits on both fronts, while also being affordable.
Performance shouldn’t be undervalued though, even in a system where performance isn’t the lead feature. That said, the 200,000+ IOPS HPE quotes is not insignificant. In our tests with the MSA 2052, we not only met those figures but, in some cases, far exceeded them. In our four-corners synthetic workloads, we measured 233K IOPS read and 110K IOPS write measuring 4K random performance of hot-data sitting inside the flash tier. Across the board, the array offered exceptional low-latency performance, and in all areas offered strong sub-1ms latency with a broad usable throughput band. Although, as many of our readers understand, synthetic performance data only shows part of the story.
In our application workloads, we saw fantastic performance. In Sysbench MySQL TPC-C, the MSA 2052 offered tons of performance out of the gate with a 4VM workload, exceeding the transactional speeds of full-fledge all-flash arrays at the same scale. We saw a similar trend with a smaller 2VM scale of our SQL Server workload, measuring 12ms average. Moving those workloads up in scale to 8VMs of Sysbench or 4VMs of SQL Server, the performance still increased, but you do run into a TCO problem without the benefits of data reduction to lower the price per GB.
Overall, the HPE MSA 2052 fits into an interesting position in the SMB/midmarket segment. Its price with two SSDs and full licensing is slightly under $10K at street, where you can then add additional spinning media or flash as needed. While we’ve tested boxes that can certainly outperform the MSA 2052, nothing comes close in this price bracket. Our configuration with four SSDs will be more expensive, especially when opting for the higher capacity drives. Even in that case, however, the MSA 2052 provides great value when the buyer properly sizes and leverages caching or tiering, backed up by relatively inexpensive HDDs. One day flash will take over, even in entry arrays targeted for the SMB. But today, the cost profile isn’t there yet and businesses with more modest needs shouldn’t worry about being all flash, as the HPE MSA 2052 delivers a highly capable, functional and cost-effective solution.
Pros
- Leverages a small amount of flash for excellent performance gains
- Enterprise connectivity (8/16Gb Fibre Channel and 10G iSCSI)
- Hardened and trusted platform
- Aggressive starting price point
Cons
- Reaches flash economic limitations with only mixed-use SSDs supported today
Bottom Line
The HPE MSA 2052 brings almost all of the benefits of flash to the SMB and midmarket in an array that’s time-tested, fully-featured and brings to bear a cost/performance profile that’s unrivaled based on what we’ve reviewed in this market segment.

HPE MSA 2052 SAN Storage Product Page


 Amazon