

The Kingston A1000 is a high-performance, budget NVMe SSD that uses the standard M.2 2280 form factor with a PCIe Gen3 x2 interface. While there are higher-performance options available now such as the KC1000, which was the company’s first dabble in the PCIe NVMe market, the A1000 is more in line with Kingston’s usual budget-friendly, price per performance storage products.
Leveraging an 4-channel Phison E8 controller, the consumer-grade drive features 4 cores and enough DRAM to satisfy end-users who work with HD video production and is ideal for PC enthusiasts and gamers. The A1000 also uses Toshiba’s 256Gb BiCS 3D TLC NAND. The A1000 is quoted to deliver upwards of 1,500MB/s and 1,000MB/s in sequential reads and write, respectively, and 120,000 IOPS 100,000 IOPS in random reads and writes.
Available in capacities of 240GB, 480GB and 960GB, the A1000 is backed by a limited five-year warranty and the company’s comprehensive tech support.
Kingston A1000 Specifications
| Form factor | M.2 2280 |
| Capacity | 240GB, 480GB and 960GB |
| Interface | NVMe |
| NAND | Toshiba 256Gb BICs 3D TLC NAND |
| Operating Temperature | 0°C to 70°C |
| Performance | |
| Sequential read | 240GB — up to 1,500 / 800MB/s
480GB — up to 1,500 / 900MB/s 960GB — up to 1,500 / 1000MB/s |
| Random 4K Read/Write | 240GB — up to 100,000/80,000 IOPS
480GB — up to 100,000/90,000 IOPS 960GB — up to 120,000/100,000 IOPS |
| Endurance | |
| Total Bytes Written (TBW) | 240GB — 150TB
480GB — 300TB 960GB — 600TB |
| Vibration operating | 2.17G Peak (7-800Hz) |
| Vibration non-operating | 20G Peak (20-1000Hz) |
| Power | |
| Idle | 11W |
| Average | .99W |
| Max (read) | 4.95W |
| Warranty | 5-year warranty with free technical support |
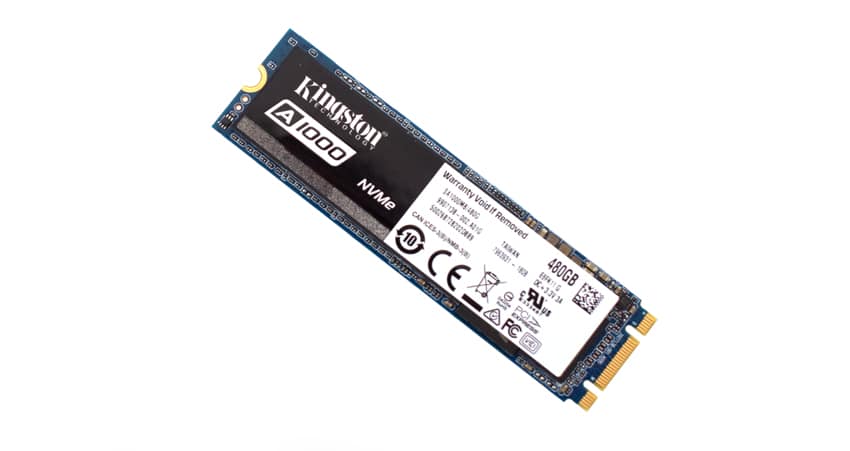
Design and build
The Kingston A000 is of the M.2 form factor and, like all drives of this kind, can be installed in a PCI Express socket via the M.2 2280 or the half-height, half-length add-in card for more flexibility when building a system.
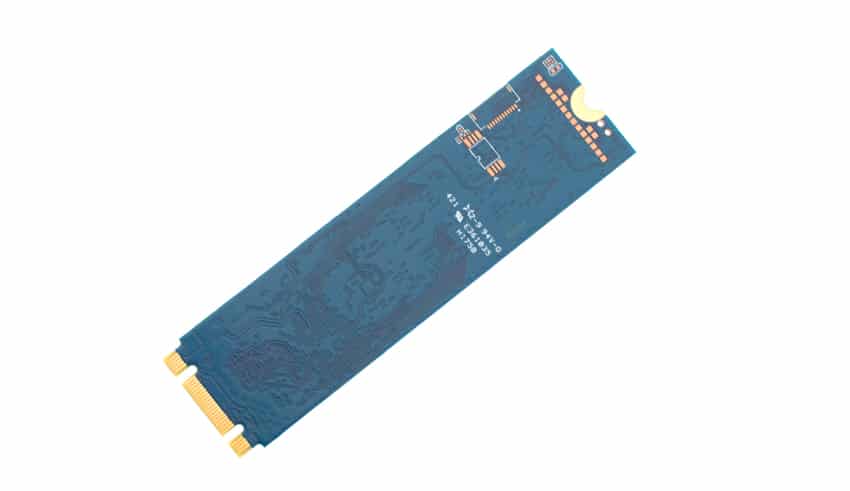
The NAND packs and controller resides on one of the sides of the SSD, the former of which is covered by a sticker that displays the usual certifications. The other side is a blank, blue PCB.
Performance
Testbed
The test platform leveraged in these tests is a Dell PowerEdge R740xd server. We measure SAS and SATA performance through a Dell H730P RAID card inside this server, although we set the card in HBA mode only to disable the impact of RAID card cache. NVMe is tested natively through an M.2 to PCIe adapter card. The methodology used better reflects end-user workflow with the consistency, scalability and flexibility testing within virtualized server offers. A large focus is put on drive latency across the entire load range of the drive, not just at the smallest QD1 (Queue-Depth 1) levels. We do this because many of the common consumer benchmarks don’t adequately capture end-user workload profiles.
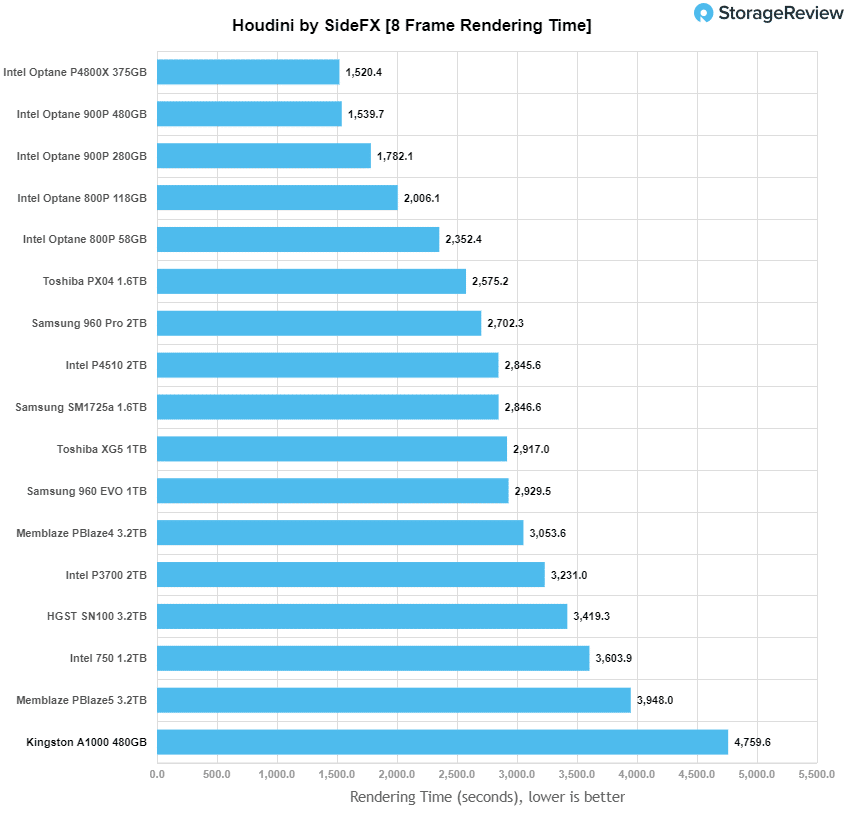
Houdini by SideFX
The Houdini test is specifically designed to evaluate storage performance as it relates to CGI rendering. The test bed for this application is a variant of the core Dell PowerEdge R740xd server type we use in the lab with dual Intel 6130 CPUs and 64GB DRAM. In this case we installed Ubuntu Desktop (ubuntu-16.04.3-desktop-amd64) running bare metal. Output of the benchmark is measured in seconds to complete, with fewer being better.
The Maelstrom demo represents a section of the rendering pipeline that highlights the performance capabilities of storage by demonstrating its ability to effectively use the swap file as a form of extended memory. The test does not write out the result data or process the points in order to isolate the wall-time effect of the latency impact to the underlying storage component. The test itself is composed of five phases, three of which we run as part of the benchmark, which are as follows:
- Loads packed points from disk. This is the time to read from disk. This is single threaded, which may limit overall throughput.
- Unpacks the points into a single flat array in order to allow them to be processed. If the points do not have dependency on other points, the working set could be adjusted to stay in-core. This step is multi-threaded.
- (Not Run) Process the points.
- Repacks them into bucketed blocks suitable for storing back to disk. This step is multi-threaded.
- (Not Run) Write the bucketed blocks back out to disk.
Looking at the performance of rendering time (where less is better), the Kingston drive ranked at the bottom of the chart. It recorded 4,759.6ms, which is significantly higher in time compared to the next best drive.
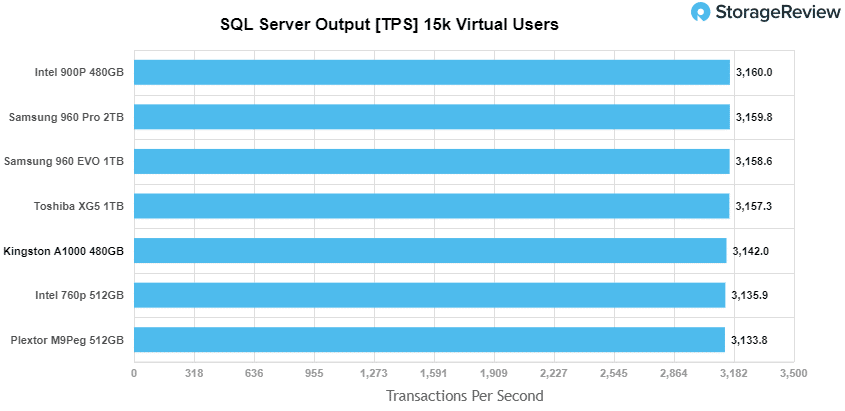
SQL Server Performance
We use a lightweight virtualized SQL Server instance to appropriately represent what an application developer would use on a local workstation. The test is similar to what we run on storage arrays and enterprise drives, just scaled back to be a better approximation for behaviors employed by the end user. The workload employs the current draft of the Transaction Processing Performance Council’s Benchmark C (TPC-C), an online transaction processing benchmark that simulates the activities found in complex application environments.
The lightweight SQL Server VM is configured with three vDisks: 100GB volume for boot, a 350GB volume for the database and log files, and a 150GB volume used for the database backup we recover after each run. From a system resource perspective, we configure each VM with 16 vCPUs, 32GB of DRAM and leverage the LSI Logic SAS SCSI controller. This test uses SQL Server 2014 running on Windows Server 2012 R2 guest VMs and is stressed by Dell’s Benchmark Factory for Databases.
SQL Server Testing Configuration (per VM)
- Windows Server 2012 R2
- Storage Footprint: 600GB allocated, 500GB used
- SQL Server 2014
- Database Size: 1,500 scale
- Virtual Client Load: 15,000
- RAM Buffer: 24GB
- Test Length: 3 hours
- 2.5 hours preconditioning
- 30 minutes sample period
When looking at SQL Server Output, the A1000 drive recorded mid-range performance of 3,142 TPS.
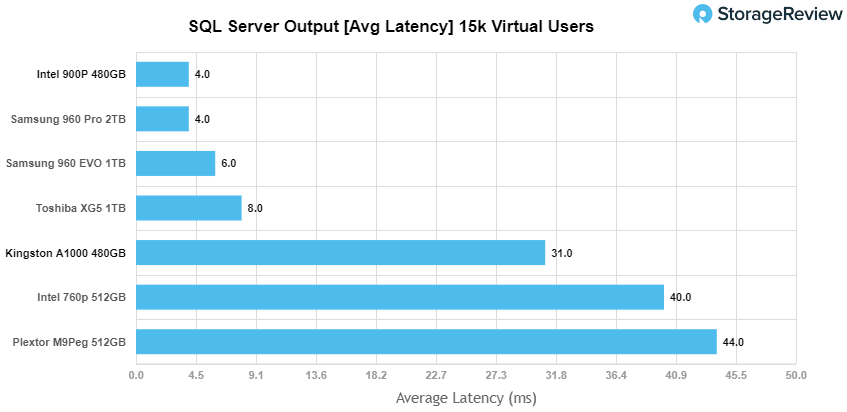
In average latency, the A1000 again placed in the lower-middle part of the leaderboard with 31ms; though it was much slower than the next best performing drive.
VDBench Workload Analysis
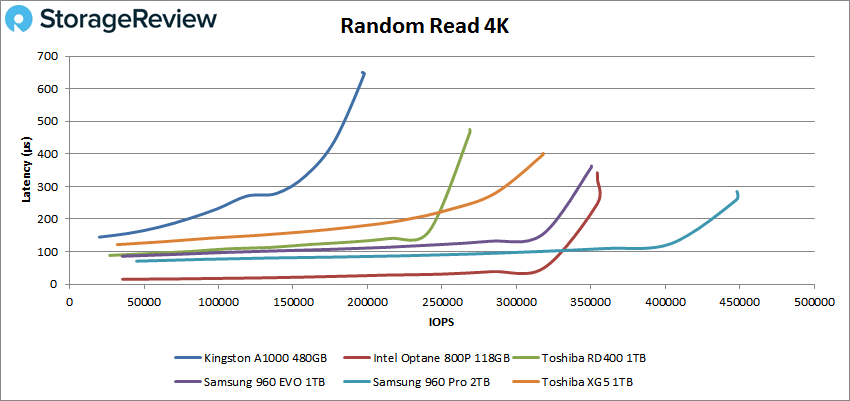
In our first VDBench Workload Analysis, we looked at random 4K read performance. Here, the A1000 was able to maintain sub-millisecond latency throughout the test, peaking at around 197,900 and 645μs. These results were well below the other tested SSDs.
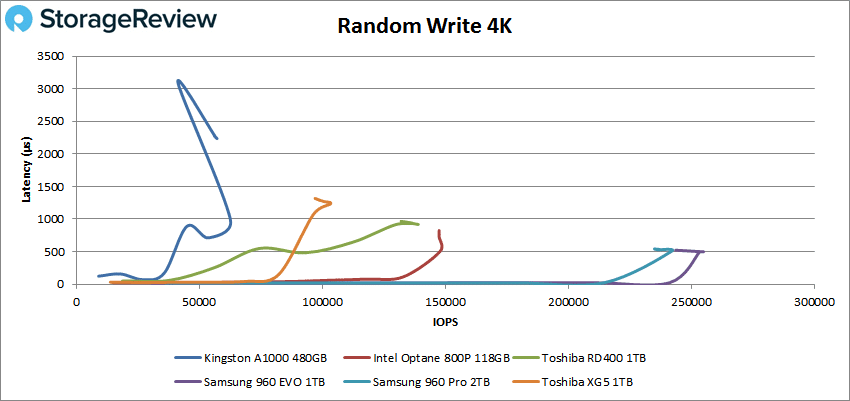
In random 4K write performance, the Kingston A1000 was able to maintain sub-millisecond latency only until roughly 62,631 IOPS. The drive started hit 3.1ms in latency at the 41,256 IOPS mark, but then shot down to 2.24ms at the end of the test. Again, these were poor numbers compared to the other drives.
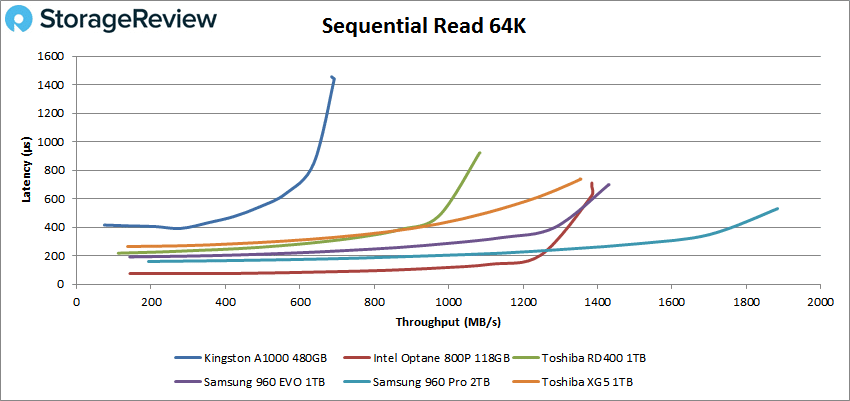
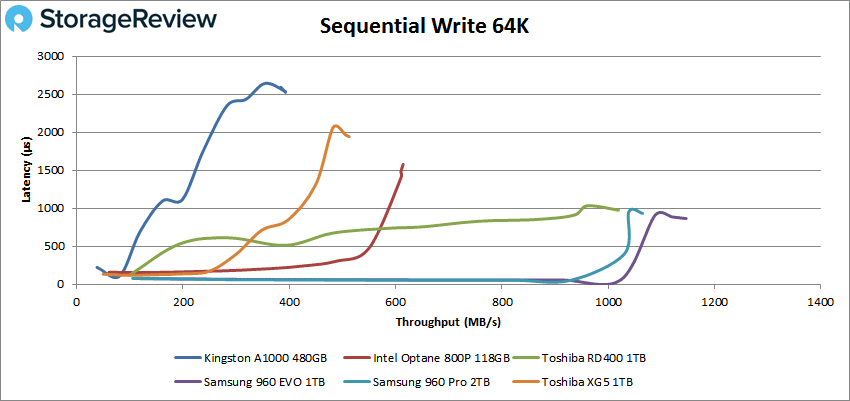
Moving to sequential performance, we first looked at the 64K benchmarks. Here, the A1000 maintained sub-millisecond latency until roughly 9,000 IOPS or 640MB/s while peaking at 11,084 IOPS (685.3MB/s) and 1.46ms latency. All other drives were able to reach the 1GB/s mark.
In sequential 64K write, the A1000 maintained sub-millisecond latency until just the 2,589 IOPS mark or 160MB/s while peak performance was recorded at 6,200 IOPS or 393MB/s with a latency of 2.53ms.
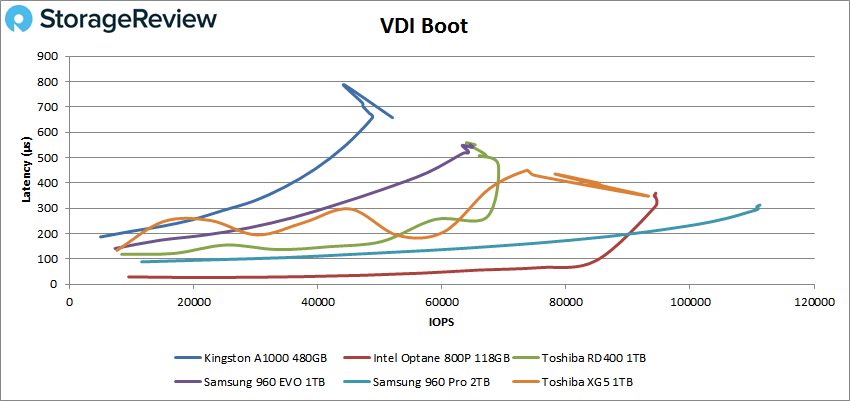
Next, we looked at our VDI benchmarks, which are designed to tax the drives even further. These tests include Boot, Initial Login, and Monday Login. Looking at the Boot test, the A1000 hit a latency spike around the 48,778 IOPS mark, while having a peak IOPS at 52,040 IOPS at 657μs.
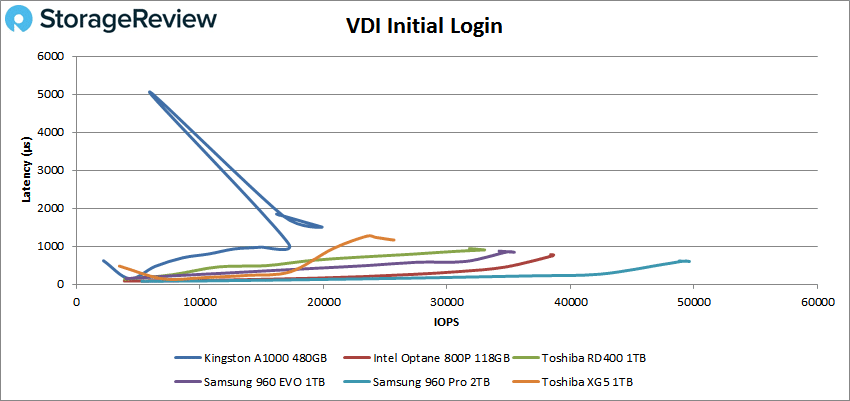
For the VDI Initial Login, the A1000 recorded a huge latency spike at 17,164 IOPS, which reached over 5ms. It hit a peak IOPS of just under 20,000 and 1.5ms latecny, well behind the rest of the tested SSDs.
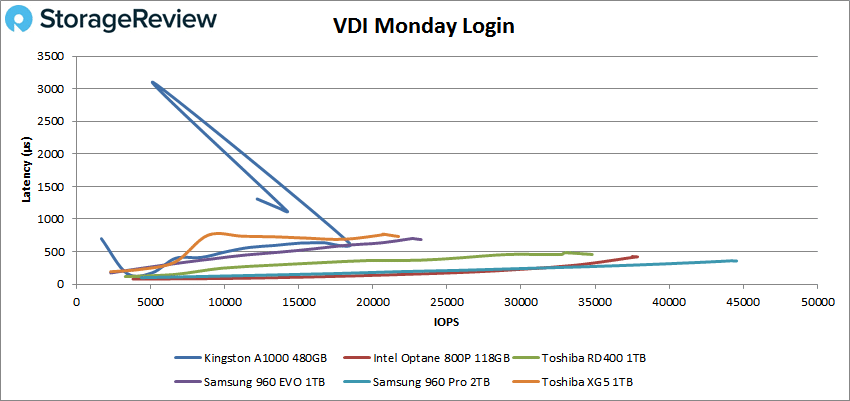
For the final VDI Monday Login, the A1000 had decent performance until it hit the 13,370 IOPS, where it continued its trend of having a severe latency spike, this time reaching 3.1ms; the rest of the drives didn’t surpass the 0.5ms mark.
Conclusion
The Kingston A1000 is an NVMe consumer SSD that uses the M.2 2280 form factor and comes equipped with an 4-channel Phison E8 controller. Consumers that don’t have an M.2 slot available can populate it inside a half-height, half-length add-in card. It comes. This budget-grade NVMe consumer SSD that, as you saw from the charts above, got easily overwhelmed when compared to higher-end drives. This was expected, of course.
Looking at the details of its performance, we start at our test/dev SQL server benchmark where the A1000 recorded 3,142 TPS and a latency of 31.0ms, both of which landed at the lower mid part of the leaderboard. During our VDBench test, the new Kingston drive had entry-level performance in our 4k random read (maintained sub-millisecond latency throughout the test, peaking at around 197,900 and 0.645μs.and 3.53ms of latency) and 64k sequential read (maintained sub-millisecond latency until roughly 9,000 IOPS while peaking at 11,084 IOPS or 685.3MB/s). The rest of the VDBench and VDI benchmarks saw more of the same, placing the A1000 well behind the other tested SSDs.
Though it revealed underwhelming numbers, Kingston’s new budget-friendly PCIe NVMe drive performed as expected. Kingston doesn’t make any bold performance claims with the drive, marketing the A1000 as a new drive targeted at mass market consumers who simply want to upgrade their system. In that, they succeeded. The A1000 goes for just $220 for the 480GB model, which is just slightly less than the much higher performing Samsung 960 EVO. With a more aggressive price point once it’s been out a while, the A1000 will be a more attractive option and should have enough performance to handle most lightweight end user workloads.
Bottom Line
The Kingston A1000 is an affordable NVMe drive and has potential for those looking to upgrade their system for light workloads without breaking the bank.


 Amazon