

Samsung’s latest enterprise SATA SSDs are its two new lines, the PM863 and SM863. The SM863 is built all in-house at Samsung using all Samsung components. The SM863 is designed more for write intensive applications, where as the PM863 is designed more for read-intensive applications. The SM863 utilizes Samsung’s V-NAND technology giving the SSD higher density with a lower footprint. The drive comes in five capacities ranging from 120GB to 1.92TB.
Samsung first showcased its new line of SSDs back at CES in January this year. While the drives have been available for enterprises for a bit they are now also being marketing to small to medium businesses. The SM863 is ideal for applications such as mail servers, data warehousing, and high performance computing that draw more on the write side of storage. The SM863 is built for high endurance and sustained IOPS consistency. The drives also have tantalum capacitors for power loss protection making them an attractive choice for data centers where they are on 24/7 (the drive also has built-in thermal guard protection to prevent overheating). The SM863 drives have an advanced error correcting code (ECC) Engine to proactively find and correct signal discrepancies in real time.
While the drive does come with a long list of benefits, it also makes some pretty large performance claims. The larger capacity drives claim speeds of 520 MB/s sequential read and 485 MB/s sequential write. The random performance is quoted at 97,000 IOPS read and 29,000 IOPS write. All while consuming little power and offering a reliability of 2 million hours MTBF.
The Samsung SM863 comes with a 5-year warranty and starts at $140 for the 120GB model. For our review we will be looking at the 960GB model.
Samsung SM863 SSD specifications:
- Form factor: 2.5”
- Capacities:
- 120GB (MZ-7KM120Z)
- 240GB (MZ-7KM240Z)
- 480GB (MZ-7KM480Z)
- 960GB (MZ-7KM960Z)
- 1.92TB (MZ-7KM1T9Z)
- Interface: SATA 6Gb/s
- Controller: In-house Samsung Mercury
- NAND: Samsung 2bit-VNAND
- Performance:
- 120GB
- Sequential Read: 500 MB/s
- Sequential Write: 460 MB/s
- Random Read: 97,000 IOPS
- Random Write: 12,000 IOPS
- CAS Latency: 100
- TBW: 770
- 240GB
- Sequential Read: 520 MB/s
- Sequential Write: 485 MB/s
- Random Read: 97,000 IOPS
- Random Write: 20,000 IOPS
- CAS Latency: 100
- TBW: 1,540
- 480GB
- Sequential Read: 520 MB/s
- Sequential Write: 485 MB/s
- Random Read: 97,000 IOPS
- Random Write: 26,000 IOPS
- CAS Latency: 10
- TBW: 3,080
- 960GB
- Sequential Read: 520 MB/s
- Sequential Write: 485 MB/s
- Random Read: 97,000 IOPS
- Random Write: 28,000 IOPS
- CAS Latency: 100
- TBW: 6,160
- 1.92TB
- Sequential Read: 520 MB/s
- Sequential Write: 485 MB/s
- Random Read: 97,000 IOPS
- Random Write: 29,000 IOPS
- CAS Latency: 100
- TBW: 12,320
- 120GB
- Performance:
- Power:
- Consumption (W) read/write: 2.4W/3.1W
- Voltage: 5V ± 5%
- MTBF: 2M
- Environmental:
- Operating Temperature: 0°C to 70°C
- Operating Humidity: 5% to 95%, non-condensing
- Environmental:
- Dimensions (W x H x D): 3.94″ x 2.76″ x 0.39″
- Weight: .14 lbs.
- Warranty: 5-year
Design and build
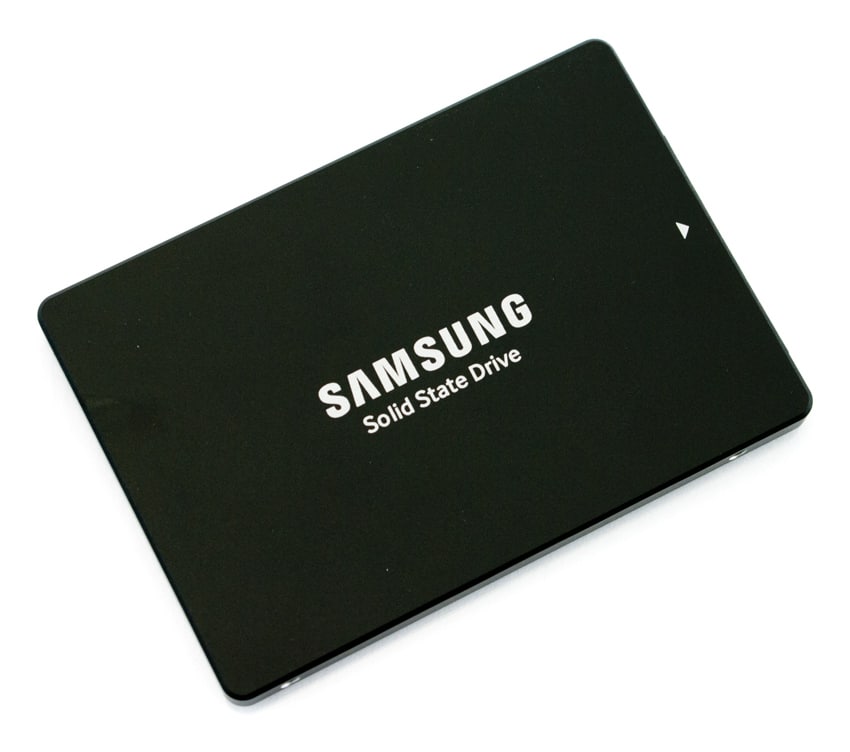
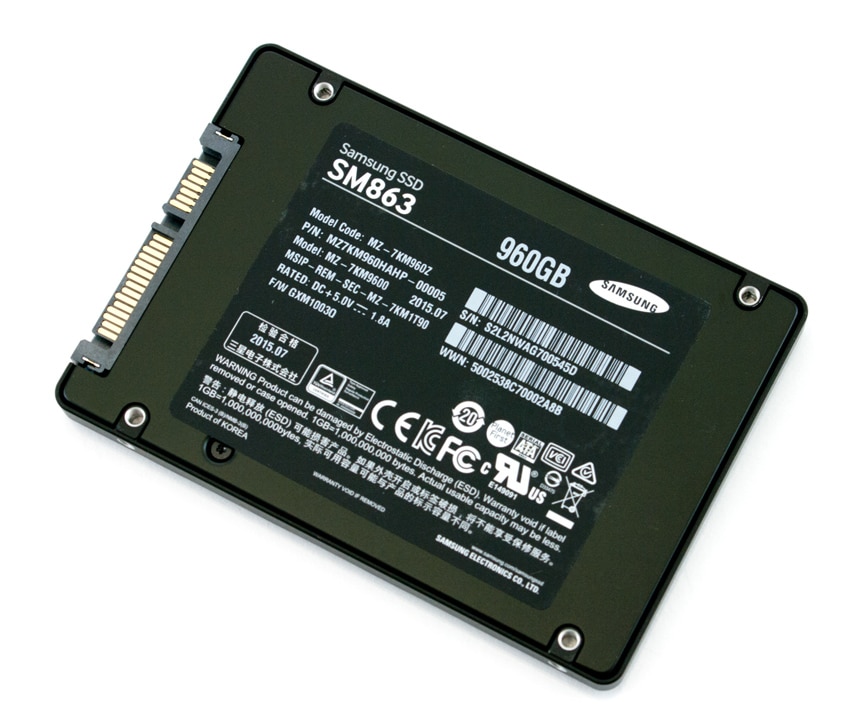
When it comes to design, Samsung knows what works for them and sticks to it. The SM863 looks very similar to the rest of the SSDs they produce. It has a minimalistic, slim design with a flat black top with Samsung branding. The bottom of the drive features a label with all the key information about the drive.
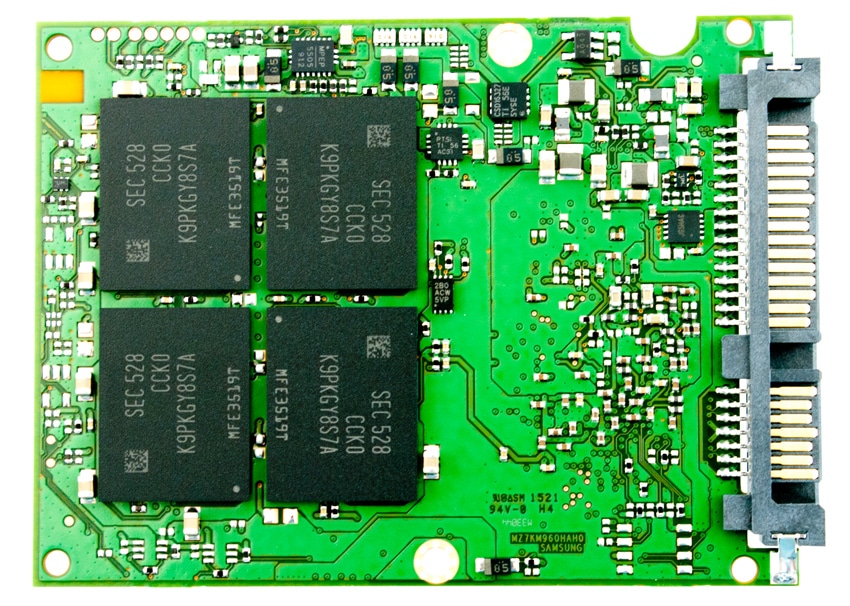
Inside the Samsung SM863 SSD, one can see the highly vertically integrated components, from the Samsung V-NAND to the Samsung SSD controller. The heart of the drive is Samsung’s Mercury controller.
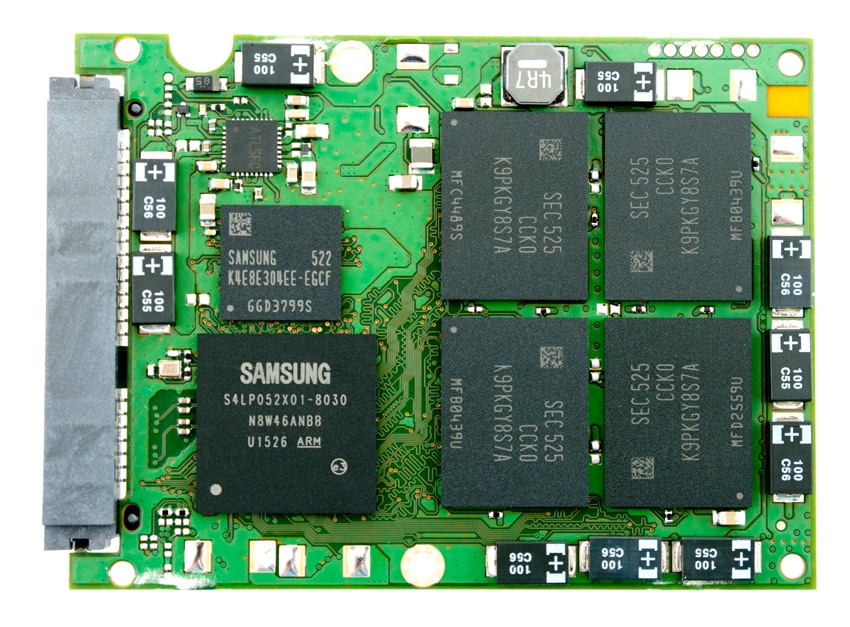
The capacity of the drive comes from eight 128GB Samsung 2bit-VNAND chips. Four on each side of the PCB.
Testing Background and Comparables
The StorageReview Enterprise Test Lab provides a flexible architecture for conducting benchmarks of enterprise storage devices in an environment comparable to what administrators encounter in real deployments. The Enterprise Test Lab incorporates a variety of servers, networking, power conditioning, and other network infrastructure that allows our staff to establish real-world conditions to accurately gauge performance during our reviews.
We incorporate these details about the lab environment and protocols into reviews so that IT professionals and those responsible for storage acquisition can understand the conditions under which we have achieved the following results. None of our reviews are paid for or overseen by the manufacturer of equipment we are testing. Additional details about the StorageReview Enterprise Test Lab and an overview of its networking capabilities are available on those respective pages.
Application Workload Analysis
In order to understand the performance characteristics of enterprise storage devices, it is essential to model the infrastructure and the application workloads found in live production environments. Our first three benchmarks for the Samsung SM863 are therefore the MarkLogic NoSQL Database Storage Benchmark, MySQL OLTP performance via SysBench and Microsoft SQL Server OLTP performance with a simulated TCP-C workload.
Our MarkLogic NoSQL Database environment requires groups of four SSDs with a usable capacity of at least 200GB, since the NoSQL database requires roughly 650GB of space for its four database nodes. Our protocol uses an SCST host and presents each SSD in JBOD, with one allocated per database node. The test repeats itself over 24 intervals, requiring 30-36 hours total. MarkLogic records total average latency as well as interval latency for each SSD.
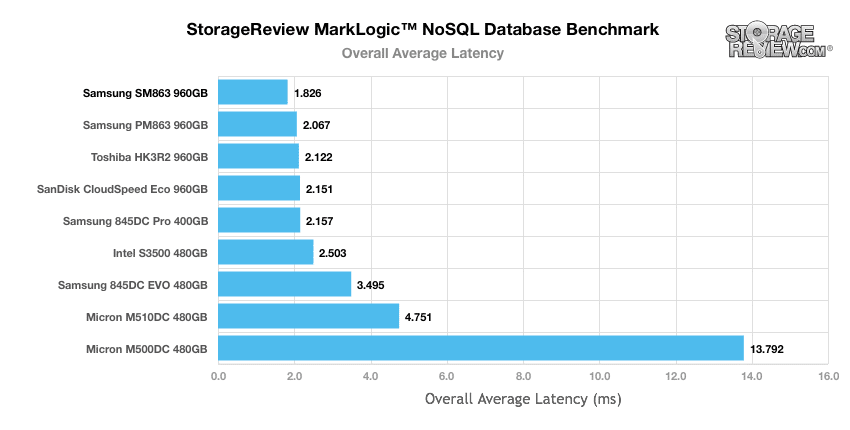
In our overall average latency tests using our MarkLogic NoSQL database benchmark, the Samsung SM863 was the top performer with a latency of 1.826ms. It beat out all of the other drives including the new PM863.
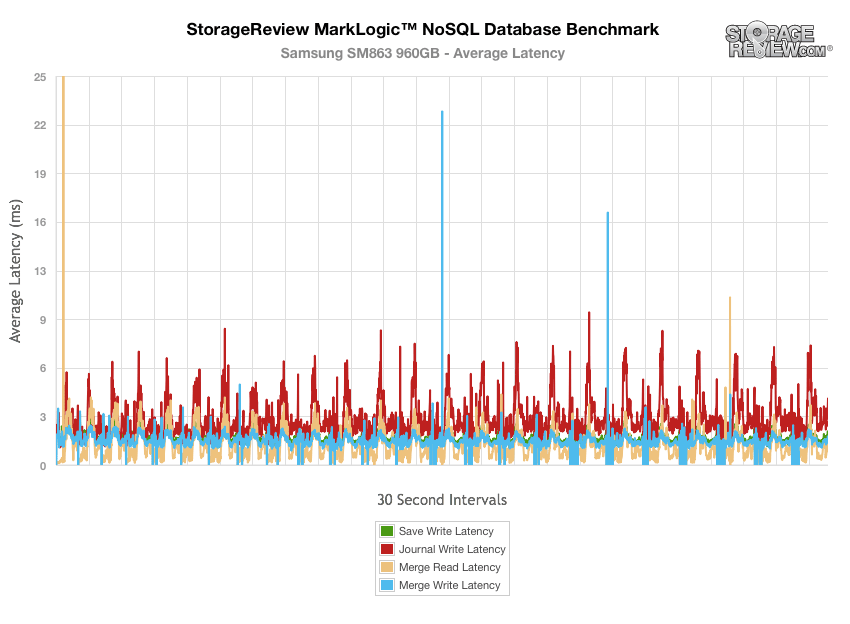
Moving to the average latency part of our MarkLogic NoSQL tests, the SM863 showed only a few major spikes (the max reaching just 23ms in merge write latency), with the vast major of the latency tests performing under 9ms.
StorageReview’s Microsoft SQL Server OLTP testing protocol employs the current draft of the Transaction Processing Performance Council’s Benchmark C (TPC-C), an online transaction processing benchmark that simulates the activities found in complex application environments. The TPC-C benchmark comes closer than synthetic performance benchmarks to gauging the performance strengths and bottlenecks of storage infrastructure in database environments. Our SQL Server protocol uses a 685GB (3,000 scale) SQL Server database and measures the transactional performance and latency with a 30,000 VU Load.
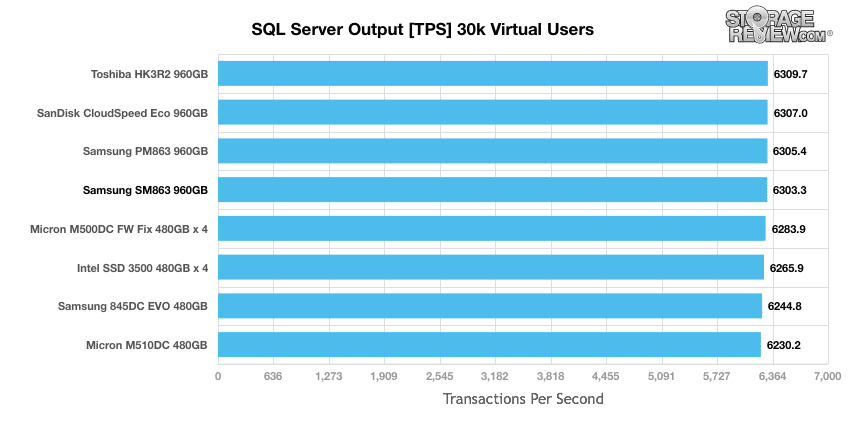
When looking at SQL Server Output, the SM863 once again gives a strong performance. Overall the drive came in fourth at 6,303.3 TPS but it was within 6 TPS of the drive the came out on top, the HK3R2.
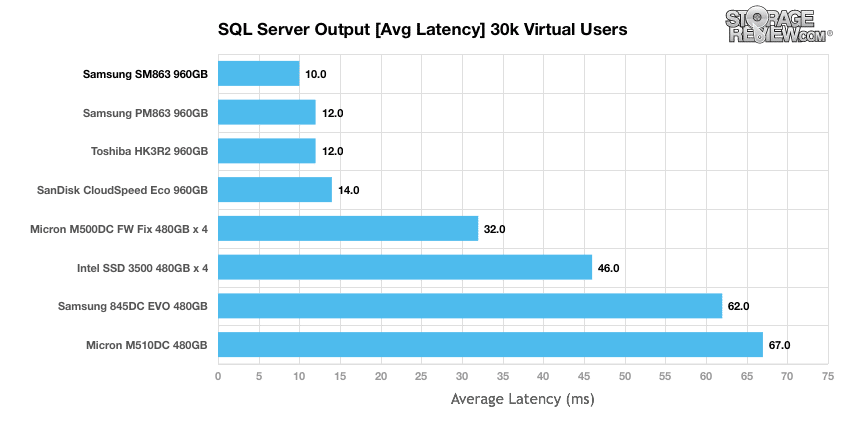
With average latency the SM863 once again took the top spot with a latency of 10ms.
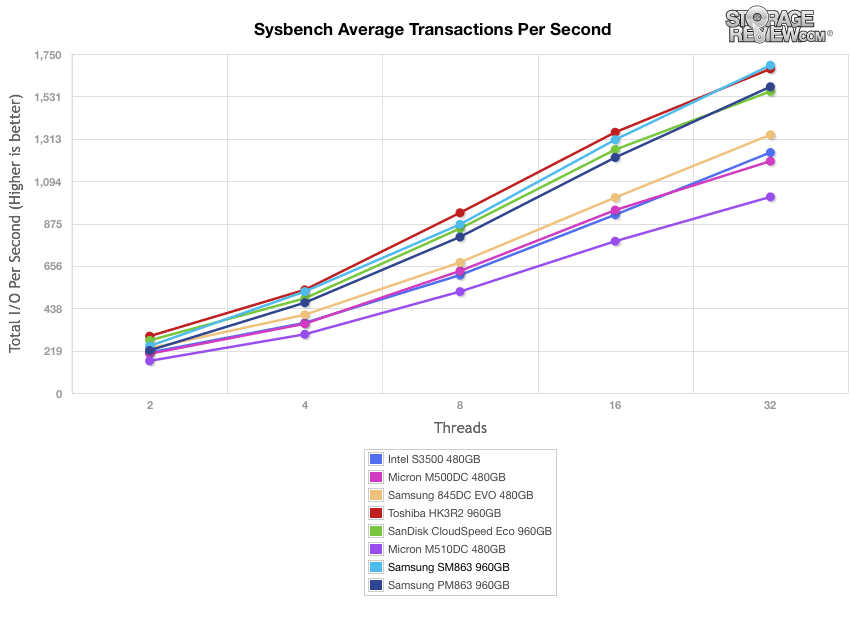
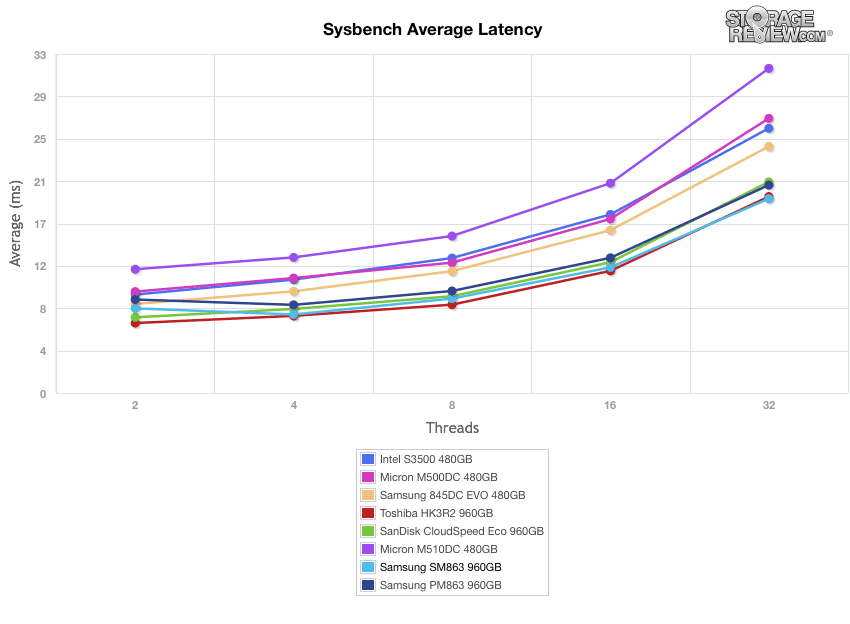
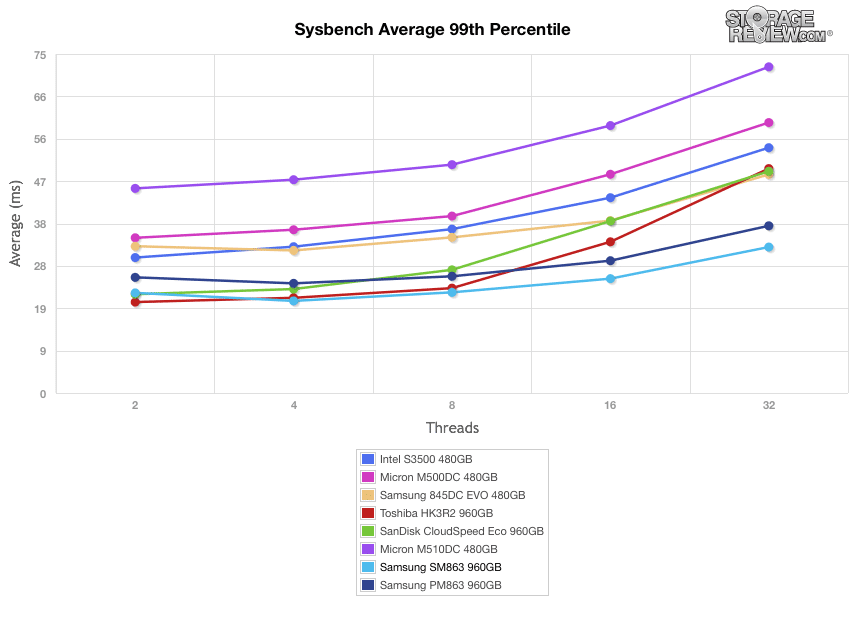
The next application benchmark consists of a Percona MySQL OLTP database measured via SysBench. This test measures average TPS (Transactions Per Second), average latency, as well as average 99th percentile latency over a range of 2 to 32 threads. Percona and MariaDB are using the Fusion-io flash-aware application APIs in the most recent releases of their databases, although for the purposes of this comparison we test each device in their “legacy” block-storage modes.
In our average transactions per second benchmark, the SM863 started off a trailing some of the other drives but quickly took and maintained the lead peaking at 1,692 IOPS.
With our SysBench average latency we see similar results to the above, with the SM863 starting off near the middle and then pulling ahead, finishing with an average latency of 18.91ms just beating out the HK3R2.
The Sysbench Average 99th Percentile plot highlights worst-case latency performance for our comparables. With this test both Samsung drives fare outperformed the rest of the pack with the SM863 once again coming out on top with the overall lowest latency, finishing at 32.29ms.
Enterprise Synthetic Workload Analysis
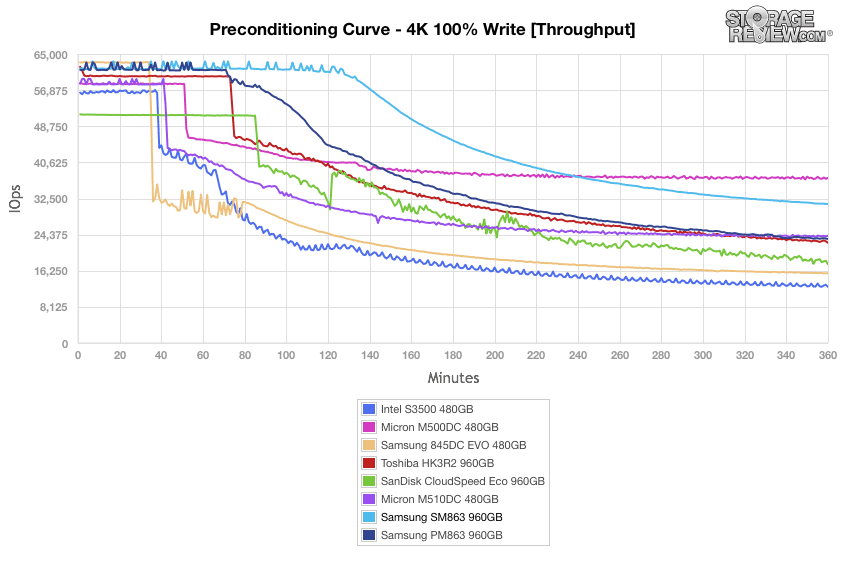
Flash performance varies as the drive becomes conditioned to its workload, meaning that flash storage must be preconditioned before each of the fio synthetic benchmarks in order to ensure that the benchmarks are accurate. Each of the comparable drives are secure erased using the vendor’s tools and preconditioned into steady-state with a heavy load of 16 threads and an outstanding queue of 16 per thread.
- Preconditioning and Primary Steady-State Tests:
- Throughput (Read+Write IOPS Aggregate)
- Average Latency (Read+Write Latency Averaged Together)
- Max Latency (Peak Read or Write Latency)
- Latency Standard Deviation (Read+Write Standard Deviation Averaged Together)
Once preconditioning is complete, each device is then tested in intervals across multiple thread/queue depth profiles to show performance under light and heavy usage. Our synthetic workload analysis for the Samsung SM863 uses two profiles which are widely used in manufacturer specifications and benchmarks.
- 4k
- 100% Read and 100% Write
- 8k
- 70% Read/30% Write
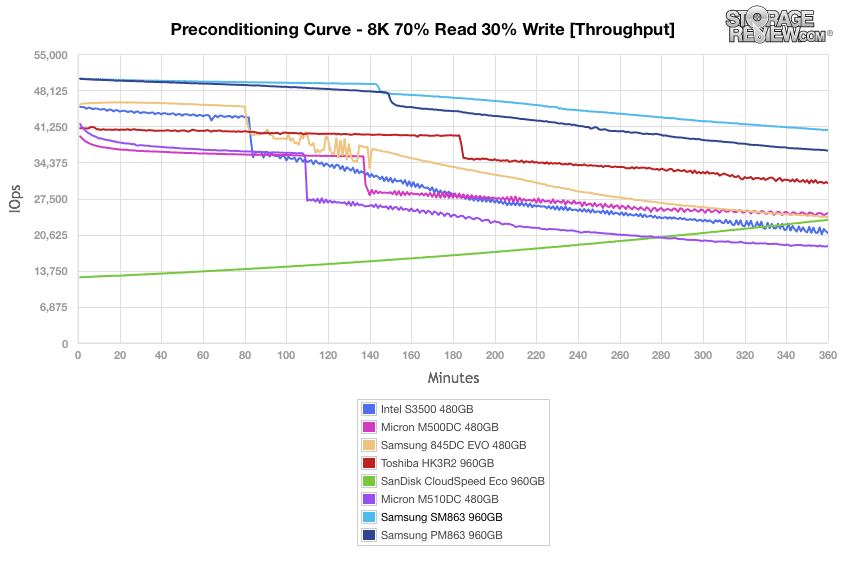
In our throughput 4k write preconditioning test, the SM863 started off as the strongest performer with burst performance around 62,000 IOPS. However it dropped down to around 31,000 IOPS in steady state and the Micron DC500 took the top spot at around 37,000 IOPS in a steady state.
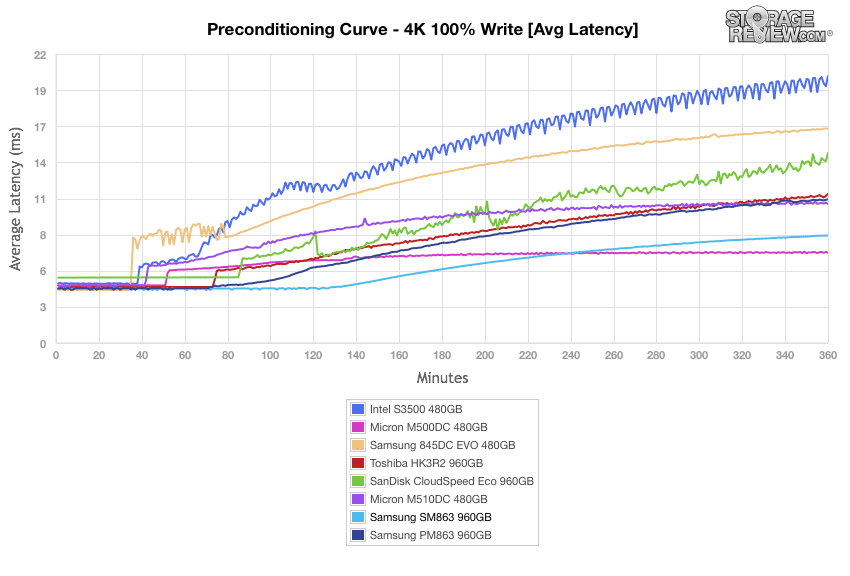
The average latency in the 4K preconditioning gives us similar placement to the above. The SM863 starts off strong around 4ms but goes up to around 8ms in a steady state once again falling being the DC500.
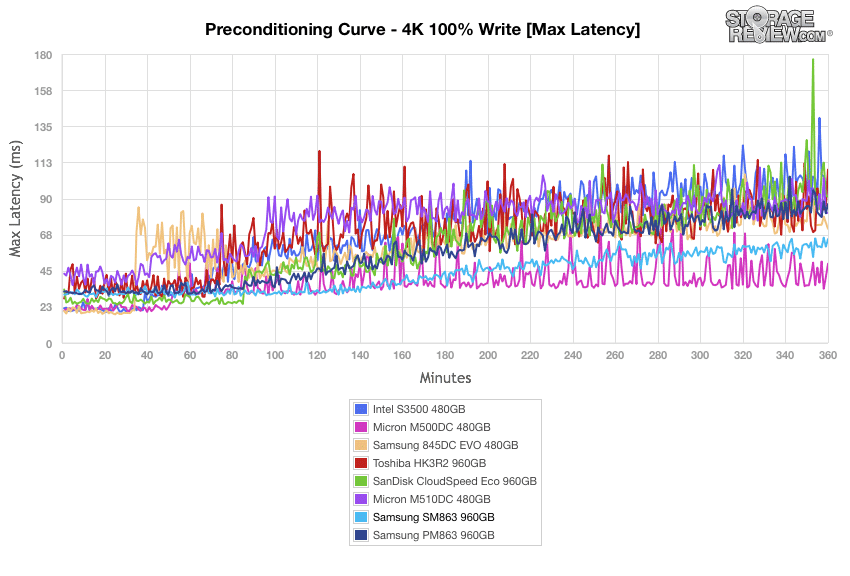
Max latency continues on the pattern of the SM863 landing in second to the DC500. This time the SM863 had a higher latency, around 60ms, but it was more consistent than the DC500, that jumped between the low 30ms to the high 60ms.
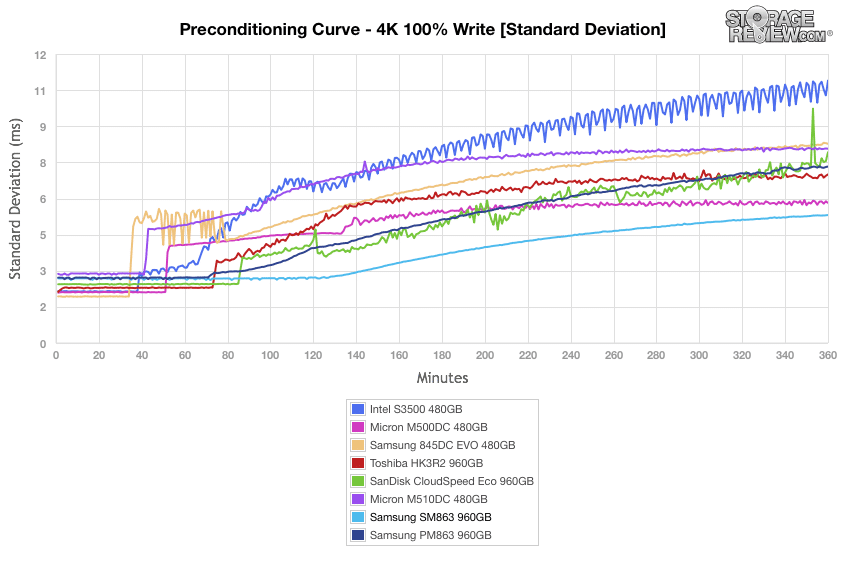
Standard deviation calculations make it easier visualize the consistency of the SM863’s latency performance results. Here we see the SM863 take the top spot running around 5ms in a steady state, beating all other drives including the DC500.
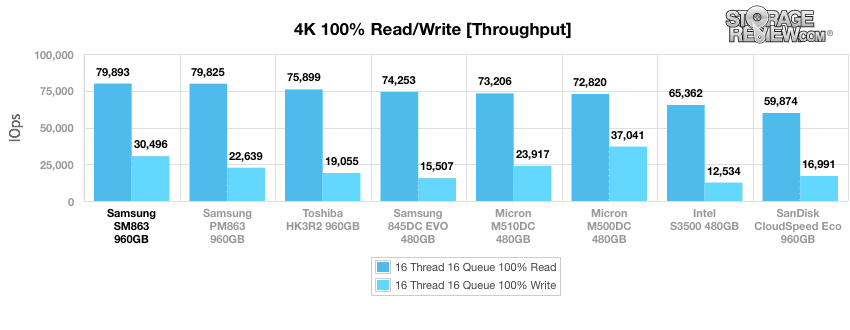
Once the enterprise drives have been conditioned, we then put them through our primary 4k synthetic benchmarks (16 Thread 16 Queue 100%). In our throughput test, the SM863 placed top on read performance with 79,893 IOPS, making it the highest performer SATA enterprise SSD so far tested. It placed second in writer performance with 30,496 IOPS.
Average latency painted a similar picture with the SM863 having the best read speed at 3.203ms (barely being the PM863 at 3.206ms) and the second best writer performance at 8.393ms.
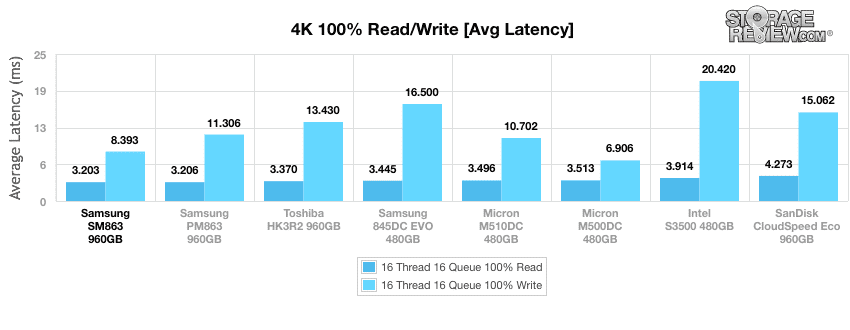
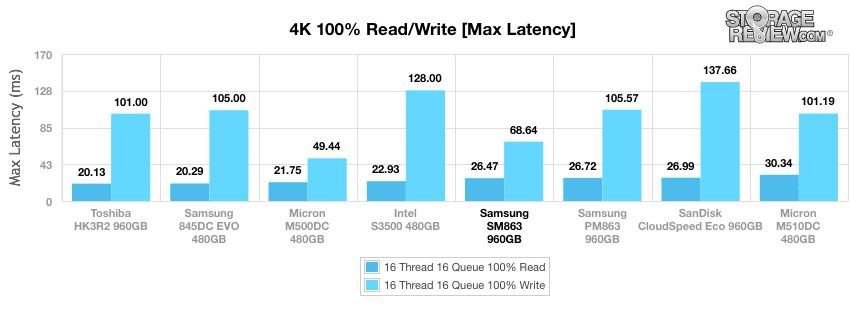
Maximum latency is the first time that the SM863 didn’t finish near the top. Here the drive fell to the middle to bottom with a read latency of 26.47ms however it was second once more with a write latency of 68.64ms.
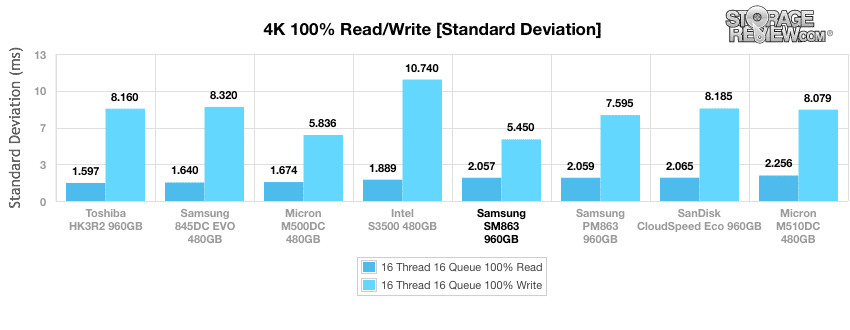
Standard deviation shows us the same placement as maximum latency with the SM863 having a read latency of 2.057ms and a write latency of 5.45ms, placing it once again in second on write.
Our next workload uses 8k transfers with a ratio of 70% read operations and 30% write operations. The SM863 started out near the top around 50,000 IOPS and came out in first place with a steady state around 40,000 IOPS.
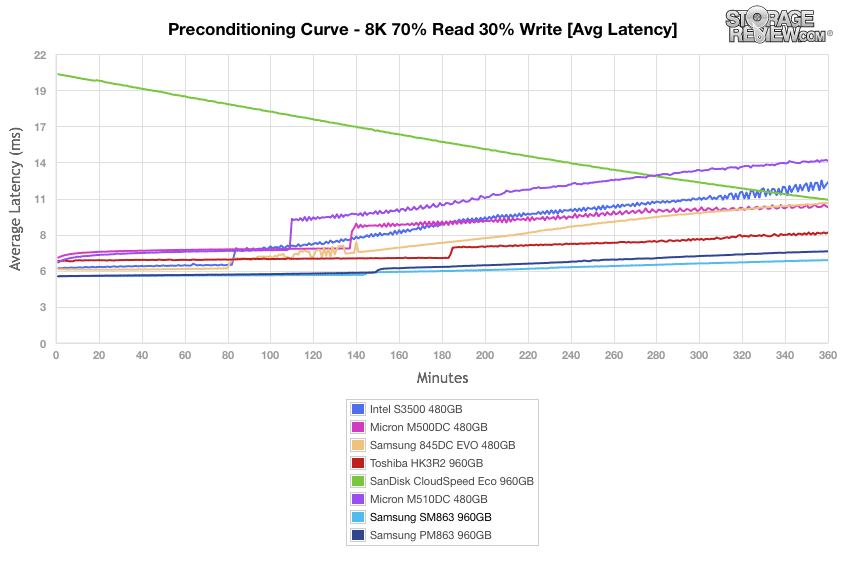
With average latency, the SM863 maintains its lead with a latency around 6ms in a steady state.
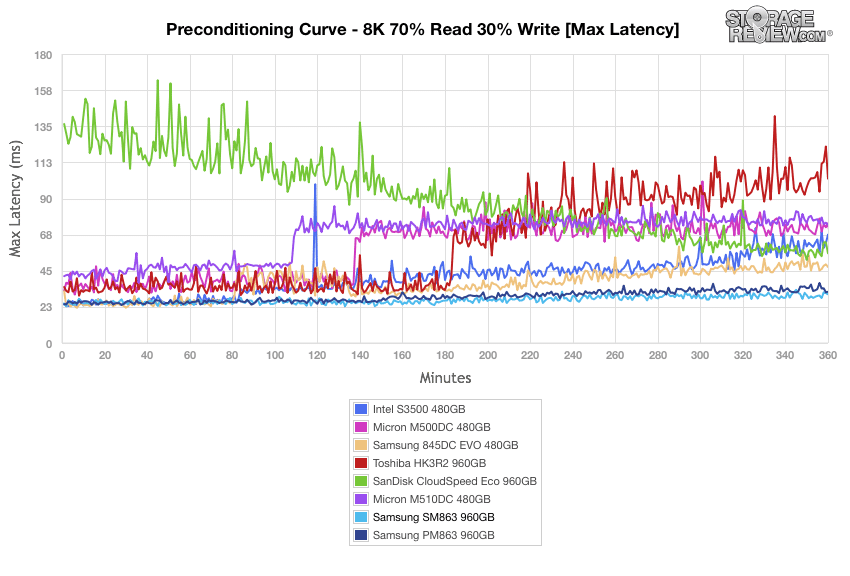
Looking at max latency the SM863 and the PM863 duke it out for the top spot, however the SM863 is able to eek past the PM863 throughout most of the benchmark. Its latency hovered in the low 30ms while the PM863 hovered in the mid 30ms.
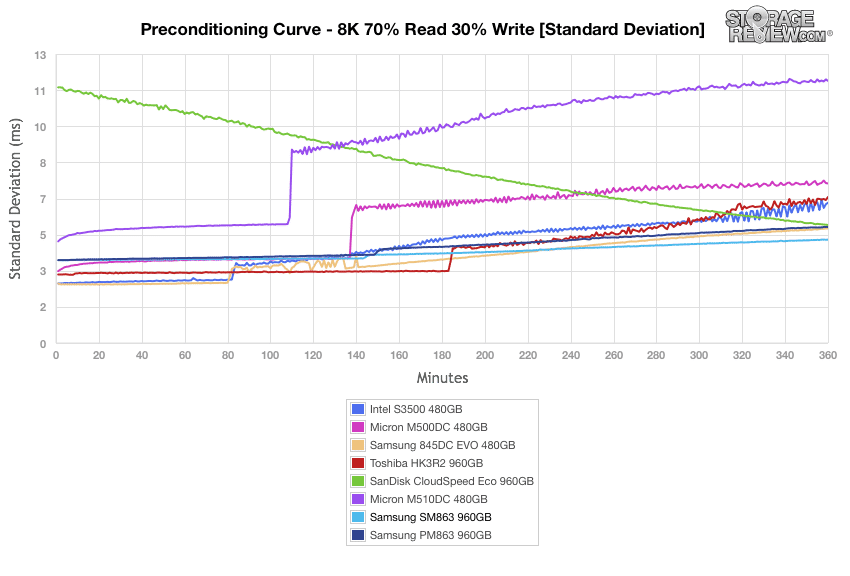
With standard deviation the SM863 ran about in the middle of the pack through the first part of the test before gradually pulling ahead and taking the top spot at round 5ms.
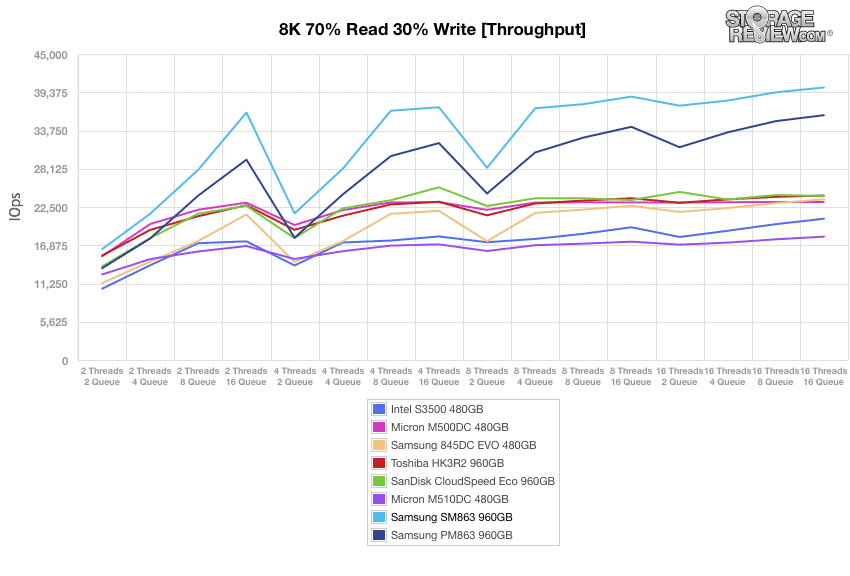
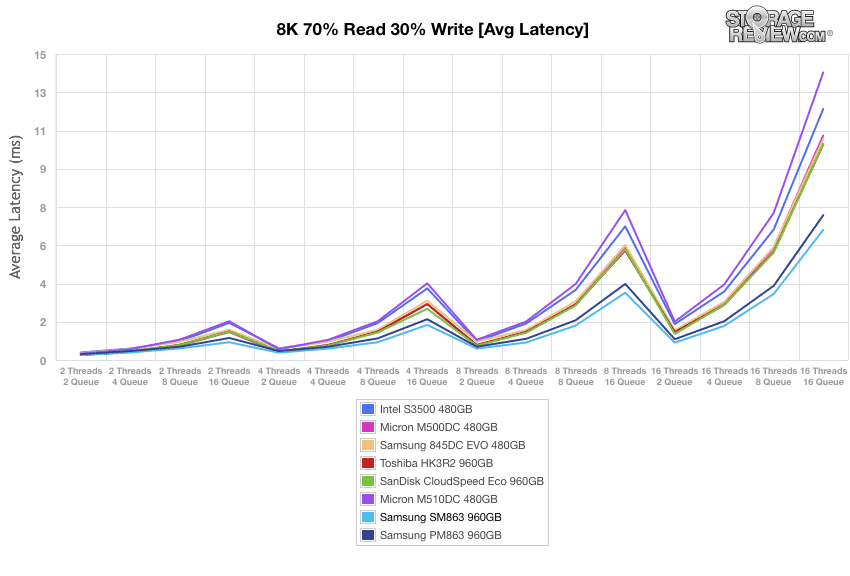
Once the drives are preconditioned, the 8k 70/30 throughput benchmark varies workload intensity from 2 threads and 2 queue up to 16 threads and queue of 16. Here we see the SM863 blow away the other drives peaking at 40,079 IOPS.
Switching over to average latency we see similar results with Samsung’s newest drive running much better than the other drives tested with the SM863 once again taking the top spot with the overall lowest latency through a majority of the test.
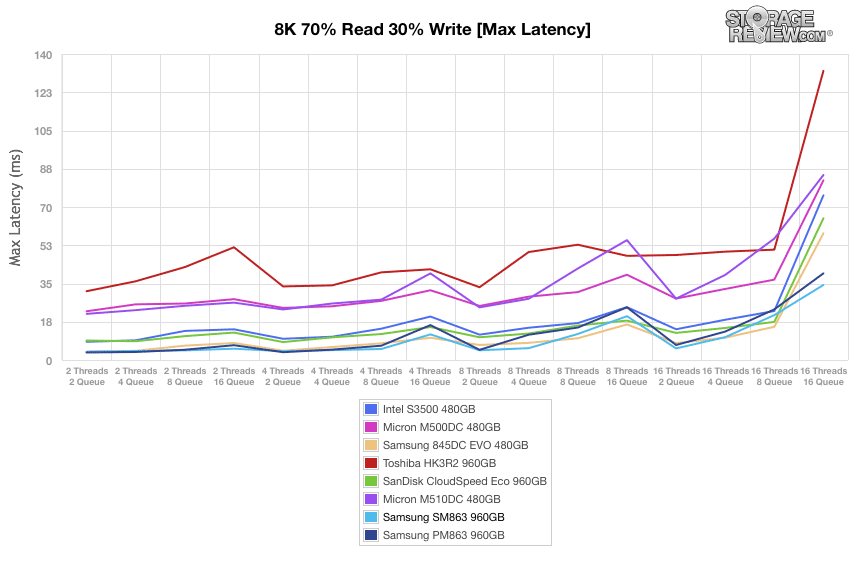
With max latency all three of the Samsung drives tested did well with theSM863 pulling ahead at the end and taking the top spot once again.
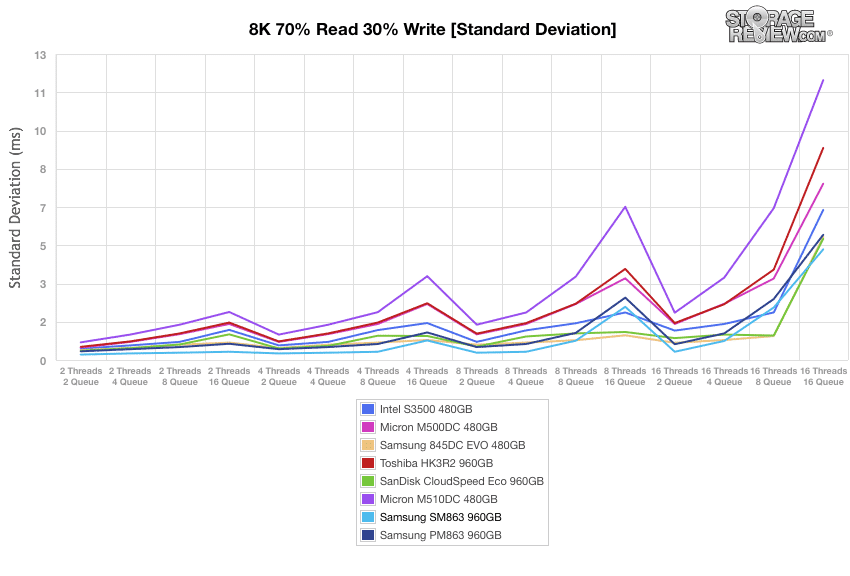
Looking at standard deviation, the SM863 did have the lowest latency in the terminal queue depth it did trail some of the other drives throughout the test.
Conclusion
Samsung has released a new SSD series aimed at both enterprise as well as smaller data centers, the SM863. The SM863 is a write-intensive drive that is built for high-endurance, high-performance, and low power consumption. The SM863 sustained IOPS performance, built-in thermal guard protection to prevent overheating, and comes with tantalum capacitors for power loss protection. On the performance claims, the SM863 is claimed to reach speeds of up to 520MB/s on read and 485MB/s on write with a read performance up to 97,000 IOPS. The drive comes in a high capacity of up to 1.92TB and comes with a 5-year warranty.
Looking at performance, the SM863 showed us some pretty impressive numbers. In our application workload analysis, the SM863 had extremely low latency in both overall and average latency in our MarkLogic test. In our SQL server the drive had the lowest latency at 10ms. In our SysBench test the SM863 came out on top on all three tests. Switching over to synthetic benchmarks the SM863 continued its winning streak with a throughput read performance of 79,893 IOPS, an average read latency of 3.203ms, and a standard deviation write latency of 5.45ms. In our 8K 70/30 the SM863 came out on top each time, in some instances being much better than all other drives except for the PM863.
Pros
- High capacity model of 1.92TB
- Excellent overall performance in 8K 70/30 synthetic tests
- Very low latency in application tests
Cons
- None
The Bottom Line
The Samsung SM863 is a write-intensive SATA SSD that comes with lots of capacity and performance making it a smart choice in small to large data centers.
Samsung SSDs at Amazon

 Amazon