

The SanDisk CloudSpeed Eco launched in March of last year as part of the consolidation and rebranding of their line of SATA enterprise SSDs. The enterprise SATA family includes four models covering the gamut of use case needs. For its part, the CloudSpeed Eco is designed for the popular entry-enterprise category, which comprises mostly read-intensive workloads in scenarios including boot drive duty, web serving, media streaming, and performance read tier in hyperscale data centers. The CloudSpeed Eco comes in capacities of up to 960GB with cMLC NAND and supports a drive write per day over the three-year warrantied life.
SanDisk quotes data transfer rates of up to 475/450 MB/s sequential read/write and up to 80K/14K IOPS random read/write. Paired with the performance spec is a good combination of engineering, including power fail- and data path-protection features. Those features roll into what SanDisk calls their Guardian Technology Platform. This proprietary platform includes several technologies, including FlashGuard, which is designed to get a lot more usable life from MLC flash compared to its standard specifications, EverGuard, which helps to ensure the prevention of data loss or corruption in the event of an unexpected power interruption, and DataGuard, which (as the name indicates) offers users with full data path protection for peace of mind that their data will be safe during the entire data path cycle as well as the ability to recover data from failed page and NAND blocks.
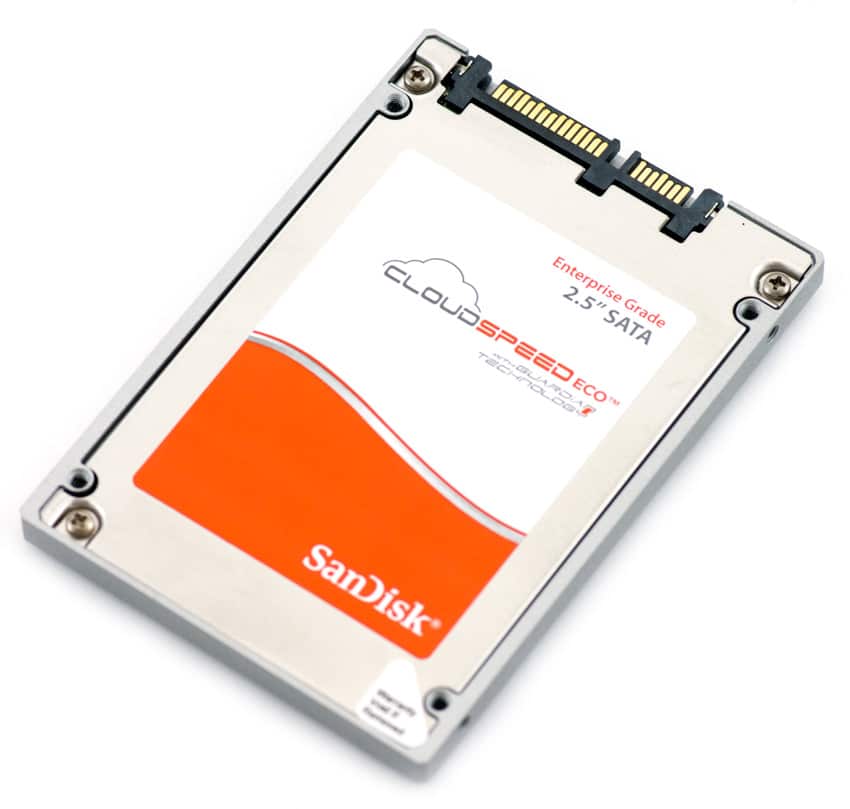
The SanDisk CloudSpeed Eco comes in capacities of 240GB, 480GB, and 960GB in a 7mm form factor with a SATA interface. Our review examines four of the 960GB SSDs.
CloudSpeed Eco 2.5” SATA SSDs Specifications
- Interface: SATA 6Gb/s
- Sequential Read/Write: Up to 450/400 MB/s
- Random Read/Write IOPS: 80K/14K IOPS
- Access Time: < 2.0ms
- Capacities:
- SDLFNDAR-240G-1HA1: 240GB
- SDLFNDAR-480G-1HA1: 480GB
- SDLFNCAR-960G-1HA1: 960GB
- NAND: 19nm cMLC
- Data Reliability (BER): 1 unrecoverable error in 1017 bits read
- MTBF: 2M hours
- Data Fail Recovery: Recover up to 1 NAND flash erase block of data
- Power Fail Recovery: High-reliability backup-power circuitry
- Temperature Monitoring: Performance throttling upon warning/critical temperature
- Warranty: Lesser of 3 years or maximum endurance used
- DWPD (Random Workload): 1 DWPD
- Power
- VCC: 5V ± 5%
- Active (Typ.): 5.2W
- Idle: 2.2W
- Environmental
- Shock (operating): 100g @ 1.0ms, 1 shock along each axis, X, Y, Z in each direction
- Vibration (operating): 2.17g rms 7-800Hz
- Operating Temperature: 0⁰ C to 70⁰ C (internal)
- Storage Temperature: -40⁰ C to 95⁰ C
- Humidity: 5% to 95% non-condensing, relative humidity**
- Altitude: -200ft to 10,000ft
- Mechanical
- Length: 100.2mm
- Width: 69.85mm
- Height: 7mm
- Warranty: Lesser of 3 years or maximum endurance used
Design and build
The design of the CloudSpeed Eco is virtually identical to that of SanDisk’s other CloudSpeed lines. It is comprised of an all-metal enclosure and uses the SanDisk branding colors (red and white) on the SSD sticker with basic information as well as the SanDisk and CloudSpeed logos on the front of the drive. Enterprise SSDs usually use an ultra-minimalistic (and mostly unattractive) look and feel, as function is their primary concern over design. So it’s nice to see a fairly slick design for a change, even though it matters little.
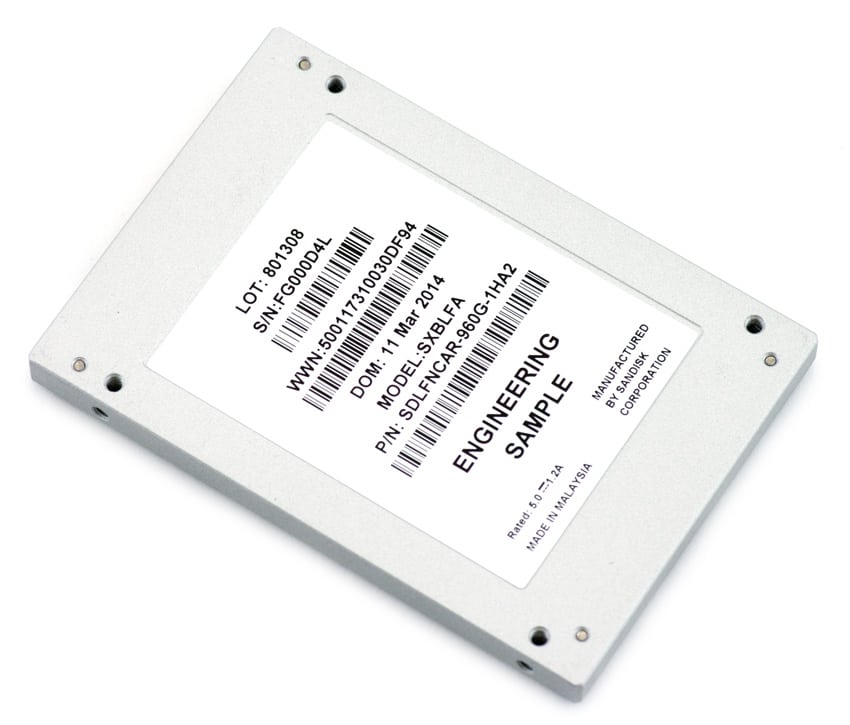
The side profiles have four screw holes, which allow for easy mounting of the CloudSpeed Eco. In addition, the drive is held together by four screws on each corner of the front panel. Once removed, the drive can be opened up.
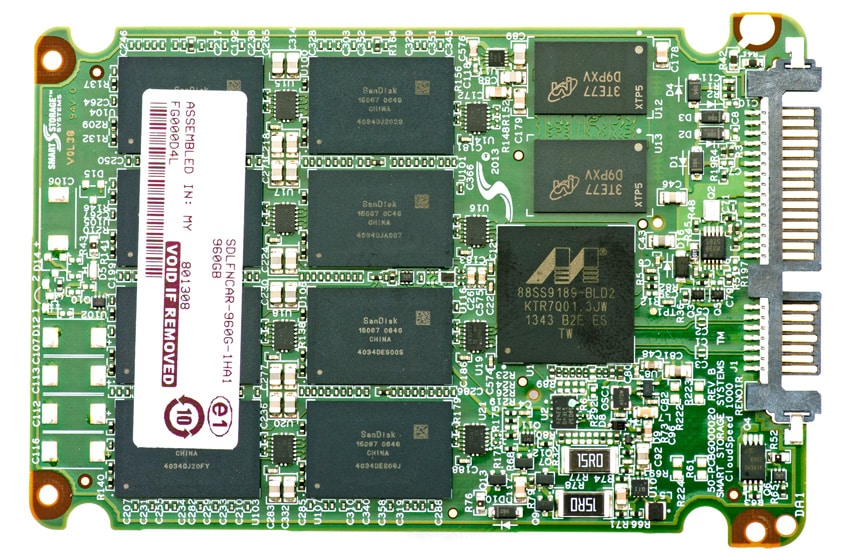
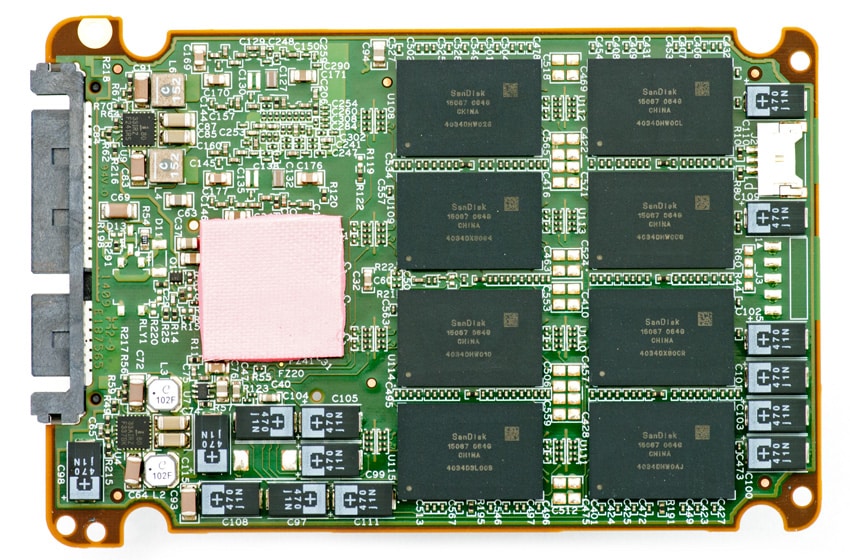
The CloudSpeed Eco uses a Marvell 9189 controller for all capacities and uses 19nm cMLC NAND.
Testing Background and Comparables
The StorageReview Enterprise Test Lab provides a flexible architecture for conducting benchmarks of enterprise storage devices in an environment comparable to what administrators encounter in real deployments. The Enterprise Test Lab incorporates a variety of servers, networking, power conditioning, and other network infrastructure that allows our staff to establish real-world conditions to accurately gauge performance during our reviews.
We incorporate these details about the lab environment and protocols into reviews so that IT professionals and those responsible for storage acquisition can understand the conditions under which we have achieved the following results. None of our reviews are paid for or overseen by the manufacturer of equipment we are testing. Additional details about the StorageReview Enterprise Test Lab and an overview of its networking capabilities are available on those respective pages.
SAS and SATA enterprise SSDs are benchmarked on our second-generation enterprise testing platform based on a Lenovo ThinkServer RD630. This testing platform includes the latest interconnect hardware such as the LSI 9207-8i HBA as well as I/O scheduling optimizations geared towards best-case flash performance. For synthetic benchmarks, we utilize FIO version 2.0.10 for Linux and version 2.0.12.2 for Windows.
- 2x Intel Xeon E5-2620 (2.0GHz, 15MB Cache, 6-cores)
- Intel C602 Chipset
- Memory – 16GB (2x 8GB) 1333MHz DDR3 Registered RDIMMs
- Windows Server 2008 R2 SP1 64-bit, Windows Server 2012 Standard, CentOS 6.3 64-bit
- 100GB Micron RealSSD P400e Boot SSD
- LSI 9211-4i SAS/SATA 6.0Gb/s HBA (For boot SSDs)
- LSI 9207-8i SAS/SATA 6.0Gb/s HBA (For benchmarking SSDs or HDDs)
- Mellanox ConnectX-3 10GbE PCIe 3.0 Adapter
- Mellanox ConnectX-3 InfiniBand PCIe 3.0 Adapter
Application Workload Analysis
In order to understand the performance characteristics of enterprise storage devices, it is essential to model the infrastructure and the application workloads found in live production environments. Our first three benchmarks of the Toshiba HK3R2 are therefore the MarkLogic NoSQL Database Storage Benchmark, MySQL OLTP performance via SysBench and Microsoft SQL Server OLTP performance with a simulated TCP-C workload.
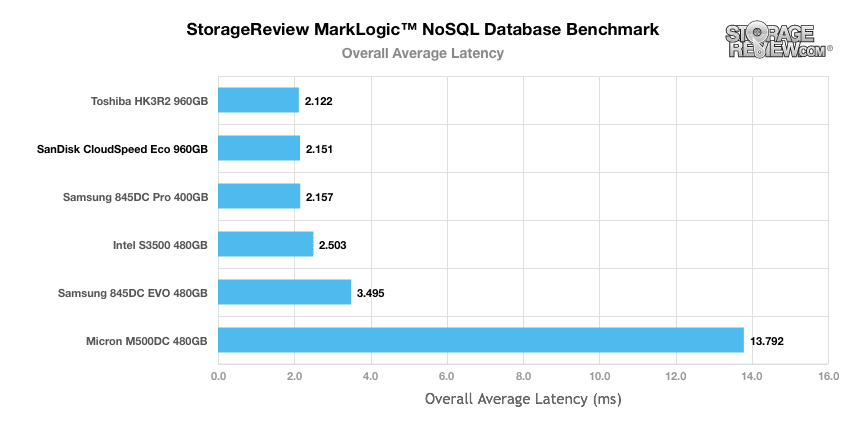
Our MarkLogic NoSQL Database environment requires groups of four SSDs with a usable capacity of at least 200GB, since the NoSQL database requires roughly 650GB of space for its four database nodes. Our protocol uses an SCST host and presents each SSD in JBOD, with one allocated per database node. The test repeats itself over 24 intervals, requiring 30-36 hours total. MarkLogic records total average latency as well as interval latency for each SSD. In our overall average latency tests using our MarkLogic NoSQL database benchmark, the CloudSpeed Eco performed well under par, placing last among our comparables with 54.298ms.
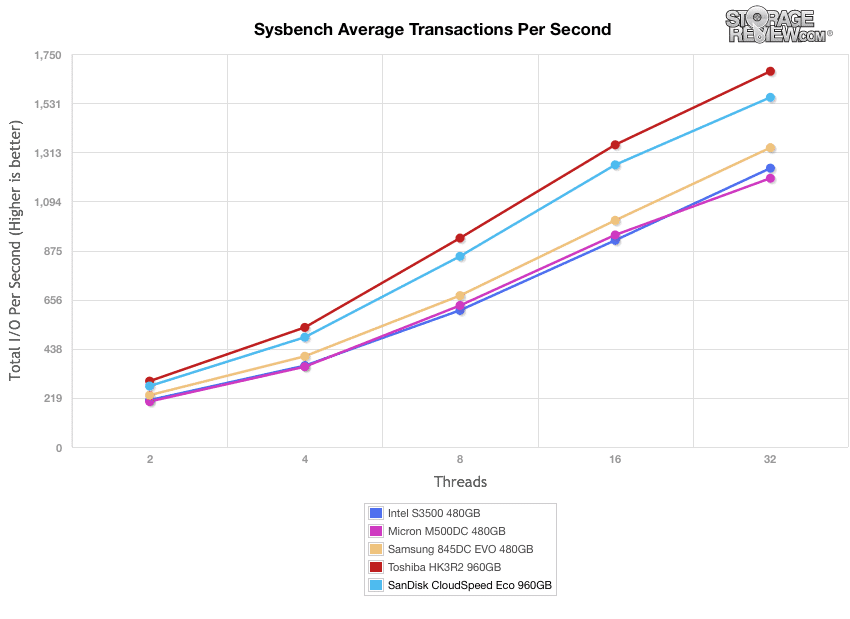
Our next application benchmark consists of a Percona MySQL OLTP database measured via SysBench. In this configuration, we use a group of Lenovo ThinkServer RD630s as database clients and the database environment stored on a single drive. This test measures average TPS (Transactions Per Second), average latency, as well as average 99th percentile latency over a range of 2 to 32 threads. Percona and MariaDB are using the Fusion-io flash-aware application APIs in the most recent releases of their databases, although for the purposes of this comparison we test each device in their “legacy” block-storage modes. In our average TPS benchmark, the SanDisk CloudSpeed Eco had an initial IOPS of 271.4 and ended with 1,556.99 IOPS, taking 2nd place among the comparables. The Toshiba HK3R2 took top honors with 1,673.23 IOPS.
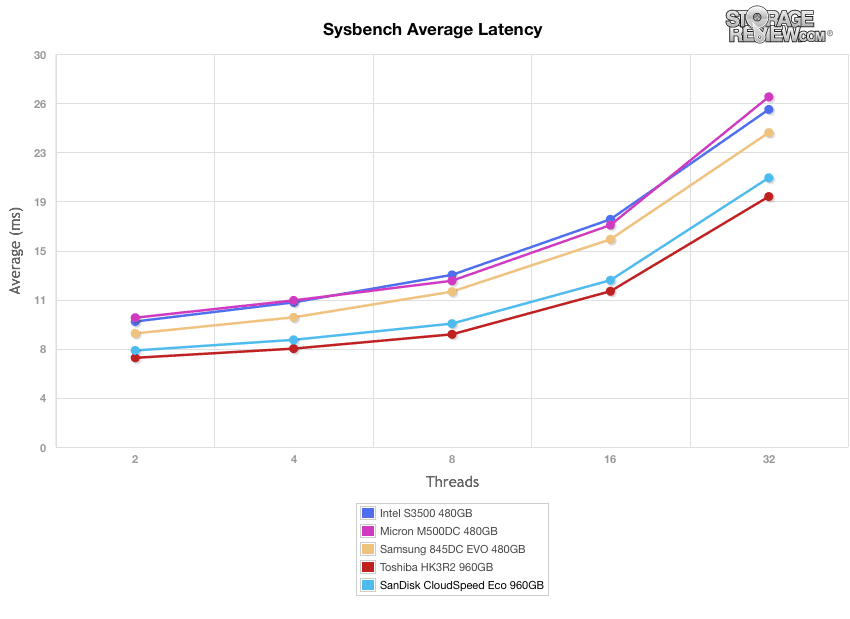
Our Sysbench Average Latency benchmark shows the SanDisk CloudSpeed Eco posting 20.55ms by 32T. The top performer was the Toshiba HK3R2, which hovered around the 19ms mark by the end.
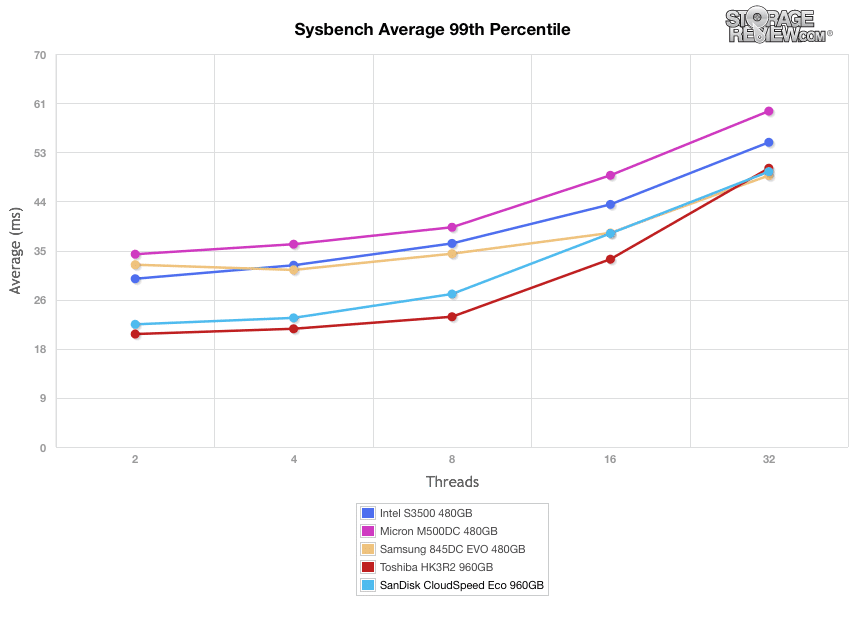
In our worst-case MySQL latency scenario (99th percentile), the SanDisk CloudSpeed Eco showed a respectable 49.05ms. Though it was only good enough for 3rd place, the discrepancy between the top three was negligible.
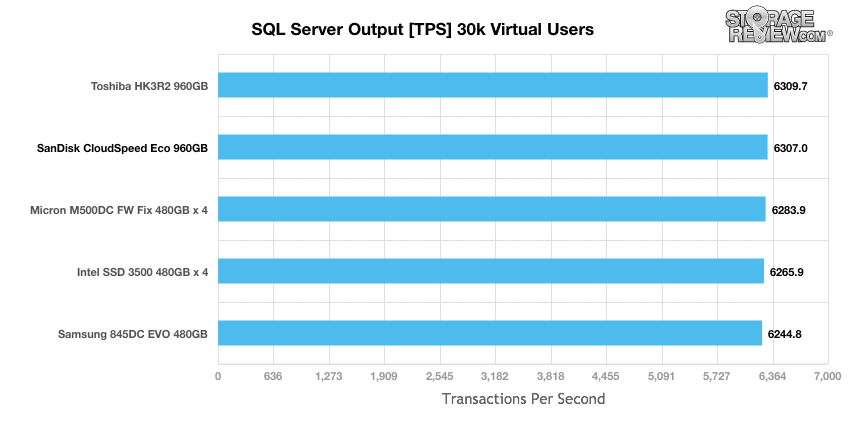
StorageReview’s Microsoft SQL Server OLTP testing protocol employs the current draft of the Transaction Processing Performance Council’s Benchmark C (TPC-C), an online transaction processing benchmark that simulates the activities found in complex application environments. The TPC-C benchmark comes closer than synthetic performance benchmarks to gauging the performance strengths and bottlenecks of storage infrastructure in database environments. Our SQL Server protocol uses a 685GB (3,000 scale) SQL Server database and measures the transactional performance and latency with a 30,000 VU Load. When looking at SQL Server Output, the CloudSpeed Eco boasted only 6,307TPS, which was second-to-last on our leaderboard and just behind the Toshiba HK3R2.
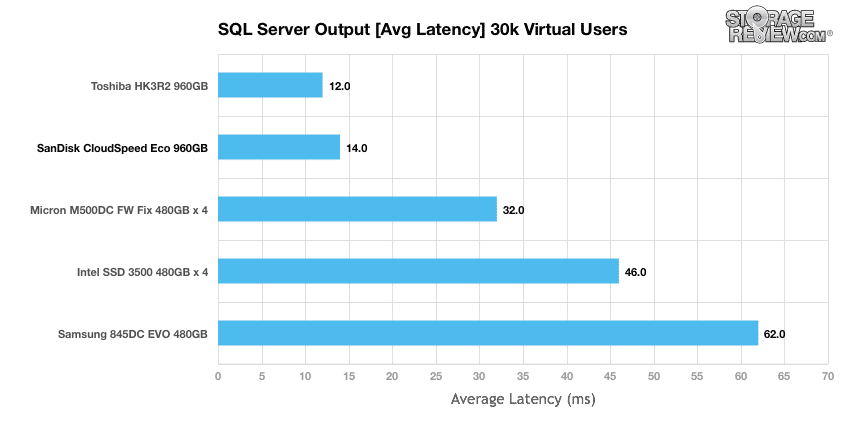
Results of our average latency under a 30k VU showed a very good 14ms, just behind the Toshiba HK3R2 once again.
Synthetic Workload Analysis
Our synthetic benchmark protocols each begin by preconditioning the target storage into steady-state with the same workload that will be used to test the device. The preconditioning process uses a heavy load of 16 threads with an outstanding queue of 16 per thread.
- Preconditioning and Primary Steady-State Tests:
- Throughput (Read+Write IOPS Aggregate)
- Average Latency (Read+Write Latency Averaged Together)
- Max Latency (Peak Read or Write Latency)
- Latency Standard Deviation (Read+Write Standard Deviation Averaged Together)
Once preconditioning is complete, each device being compared is then tested across multiple thread/queue depth profiles to show performance under light and heavy usage. Our synthetic workload analysis for the Toshiba HK3R2 uses 4k and 8k profiles, which are widely used in manufacturer specifications and benchmarks.
- 4k Profile
- 100% Read and 100% Write
- 8K Profile
- 70% Read, 30% Write
- 100% 8K
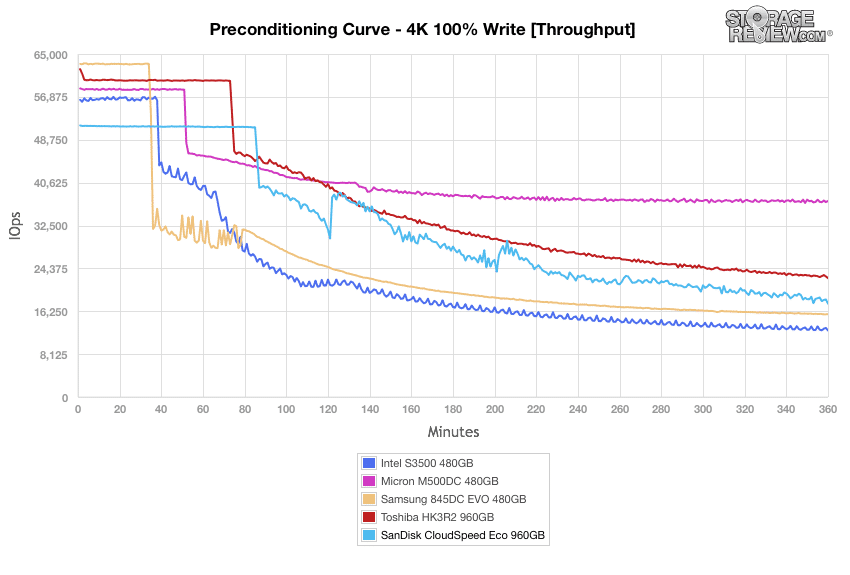
During our 4K preconditioning process, the CloudSpeed Eco showed middle-of-the-pack results throughout the tests. In our throughput benchmark, it hovered around 51,000 IOPS at first, then eventually hit 17,885 IOPS by the end (third place).
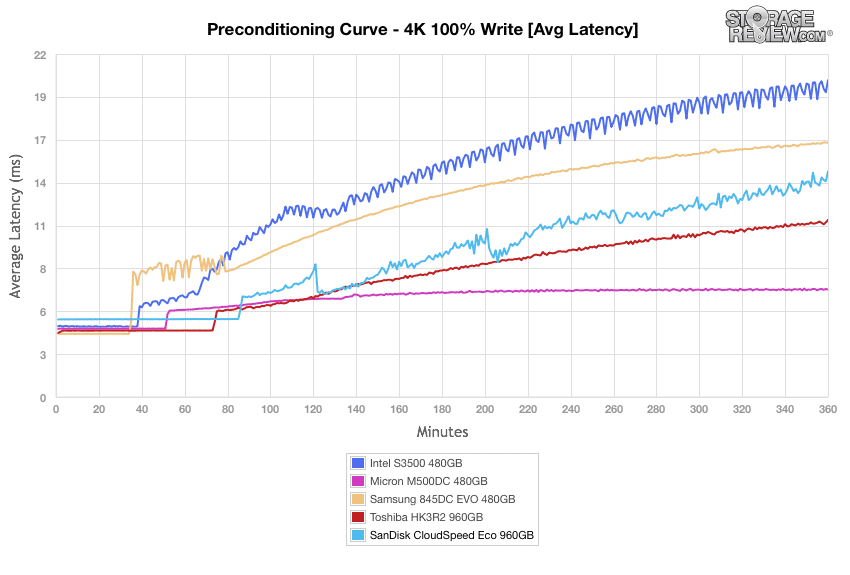
In our average latency tests, the CloudSpeed Eco kept pace with the rest of the comparables throughout the test, going no higher than 14.5ms in latency.
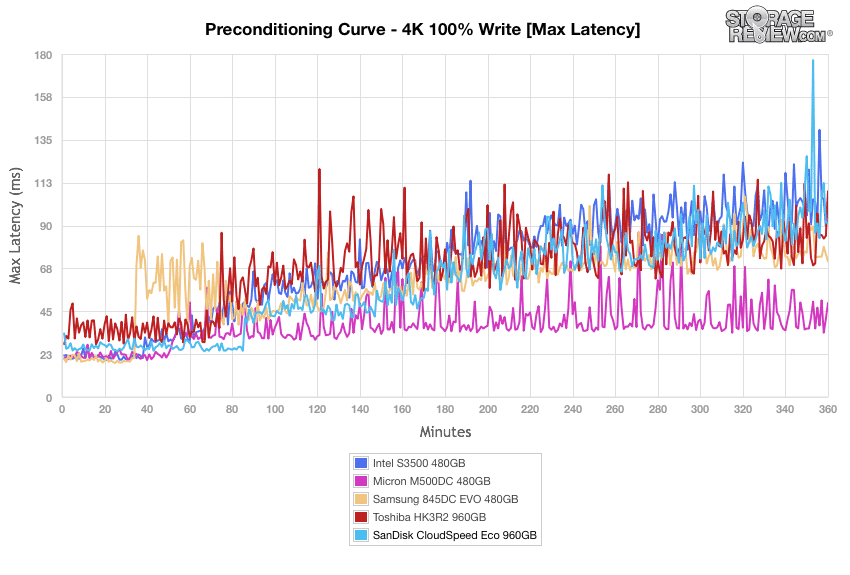
When looking at max latency, the CloudSpeed Eco showed spikes reaching almost 126ms, which was much higher than the top-performing enterprise drive (Micron M500DC).
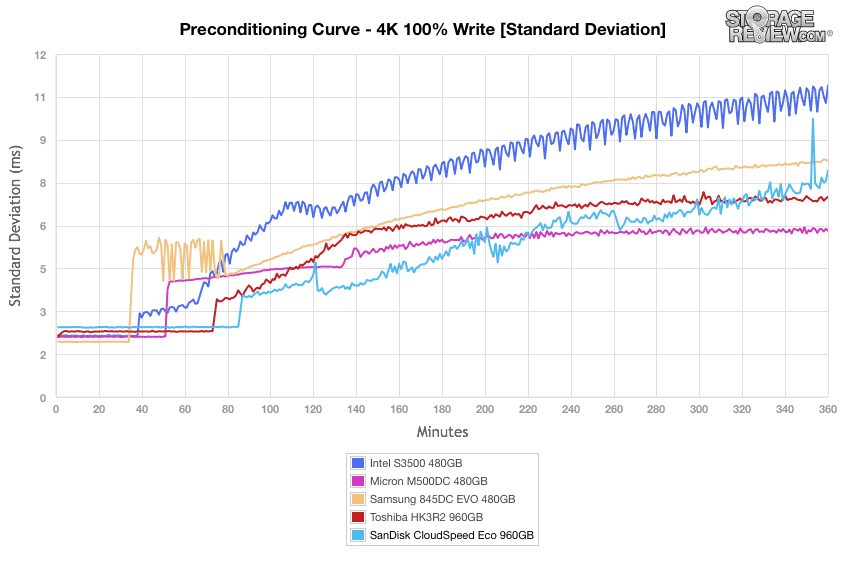
The CloudSpeed Eco posted fairly good results in the standard deviation benchmark of our 4k preconditioning test, hovering around the 7ms mark towards the end.
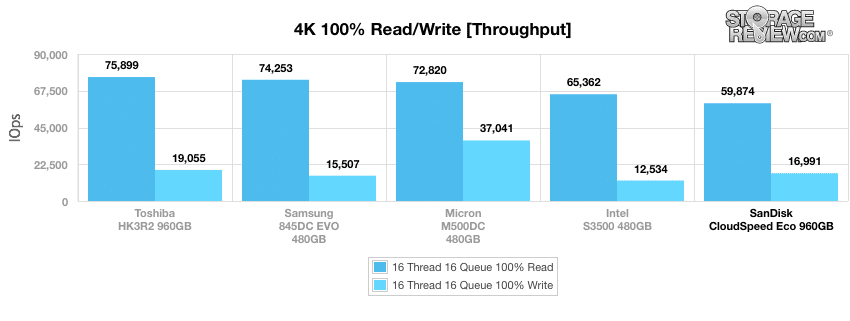
During the primary 4k synthetic benchmarks, the CloudSpeed Eco continued its sub-par performance. When looking at throughput, the SanDisk drive posted 59,874 IOPS read (last place) and 16,991 IOPS write (3rd).
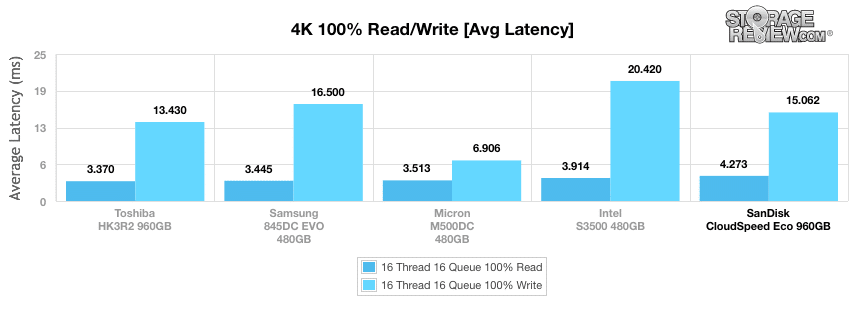
When moving to average latency, the CloudSpeed Eco showed 4.273ms (last) read and 15.062ms write (3rd). The top performer here was once again the Toshiba HK3R2.
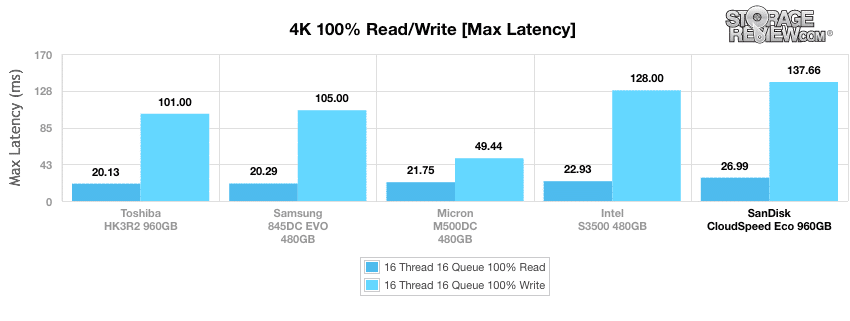
The performance from our CloudSpeed Eco during the maximum latency benchmark showed 137.66ms write (last) and 26.99ms read (last). Again, rankings remained static throughout our 4K profile.
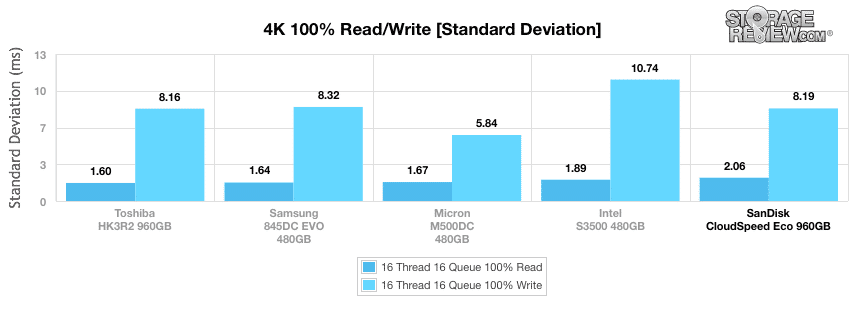
Calculating the standard deviation of the 4k latency results show the CloudSpeed with 8.185ms write (3rd) and 2.065ms read (last).
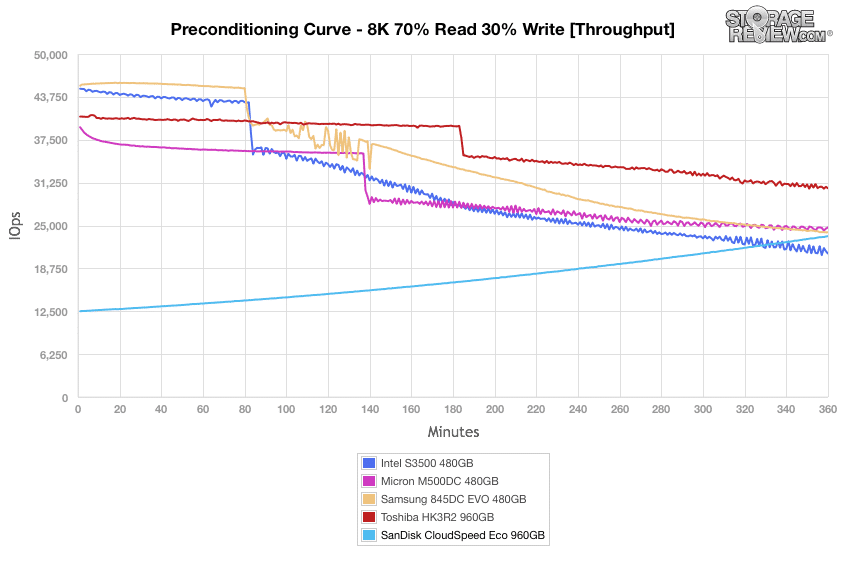
Our next workload uses 8k transfers with a ratio of 70% read operations and 30% write operations. Here, the CloudSpeed Eco showed weaker results across the board compared to the other drives. In our throughput benchmark, it started out very weak in its burst stage, gradually ended up at 23,454 IOPS by the end. The first place Toshiba HK3R2 posted 30,417 IOPS.
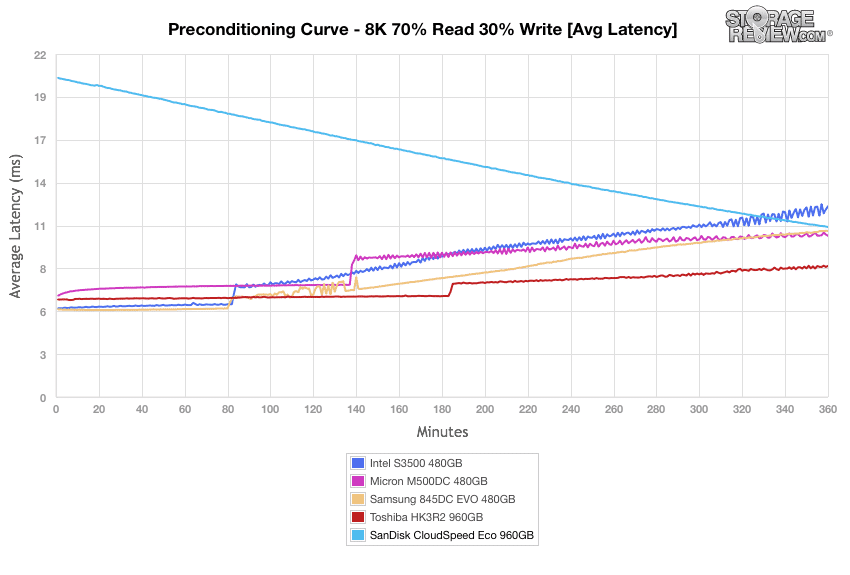
Average latency calculations for the 8k 70/30 preconditioning have the CloudSpeed mirroring that of its throughput performance; it started out extremely poorly and gradually reached approximately 11ms (4th place). The top performer was the HK3R2 once again.
The CloudSpeed Eco showed very poor results at the beginning of the max latency benchmark, though it seemed to level off a bit at the end.
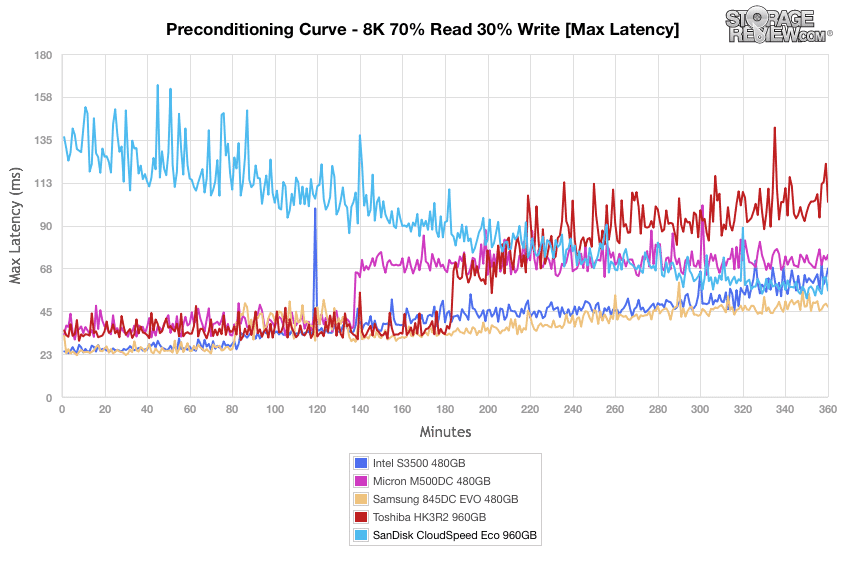
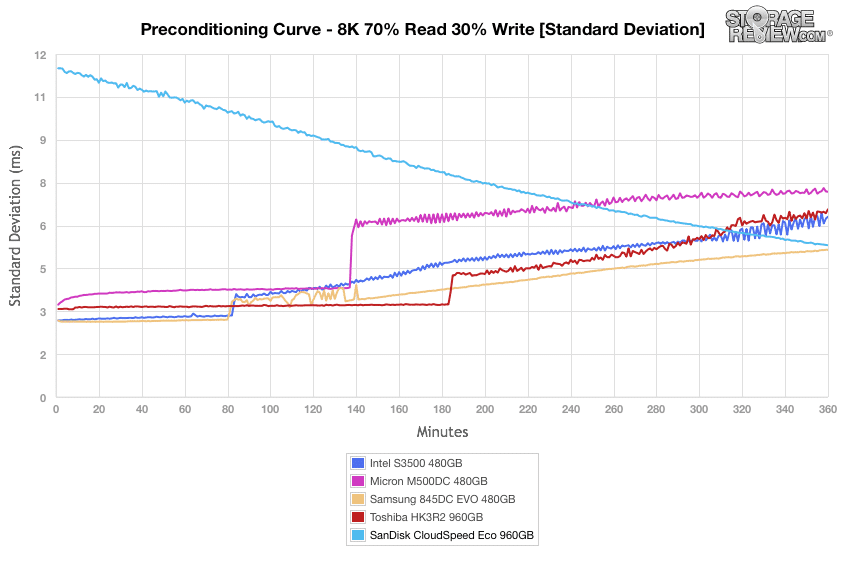
The standard deviation of our 8k latency benchmark showed significantly weaker results at the initial stage of our test (12ms compared to an average of 3ms for its comparables), though the SanDisk drive ended up taking 2nd place once it settled down.
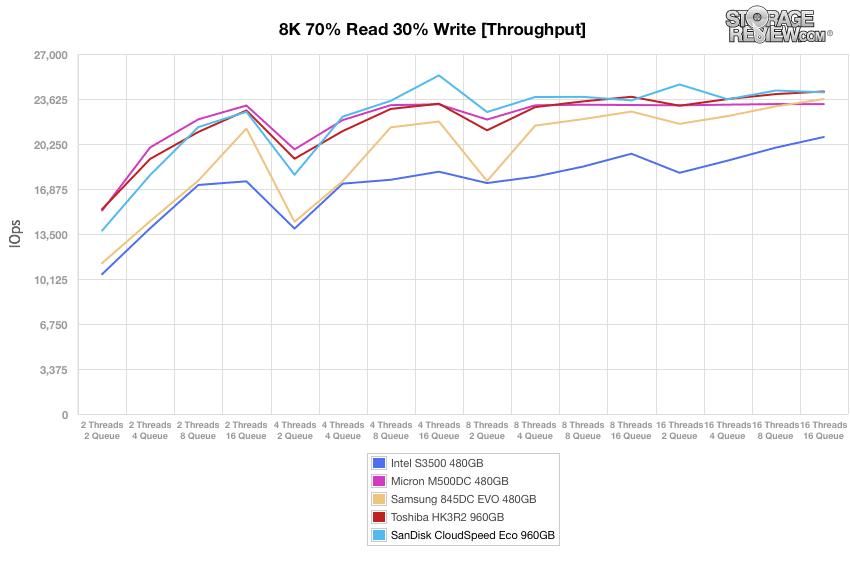
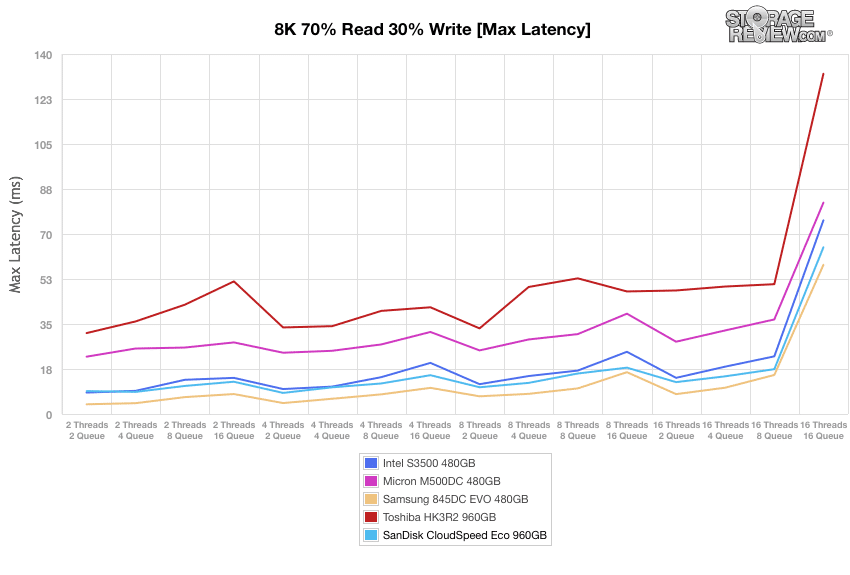
Once the drives are preconditioned, the 8k 70/30 throughput benchmark varies workload intensity from 2 threads and 2 queue up to 16 threads and 16 queue. In these tests, the results of the SanDisk drive were significantly improved, ranking it among the top two drives on our leaderboards. In our throughput benchmark, the CloudSpeed Eco posted 24,127 IOPS by 16T/16Q, which was second place, just behind the HK3R2 960GB.
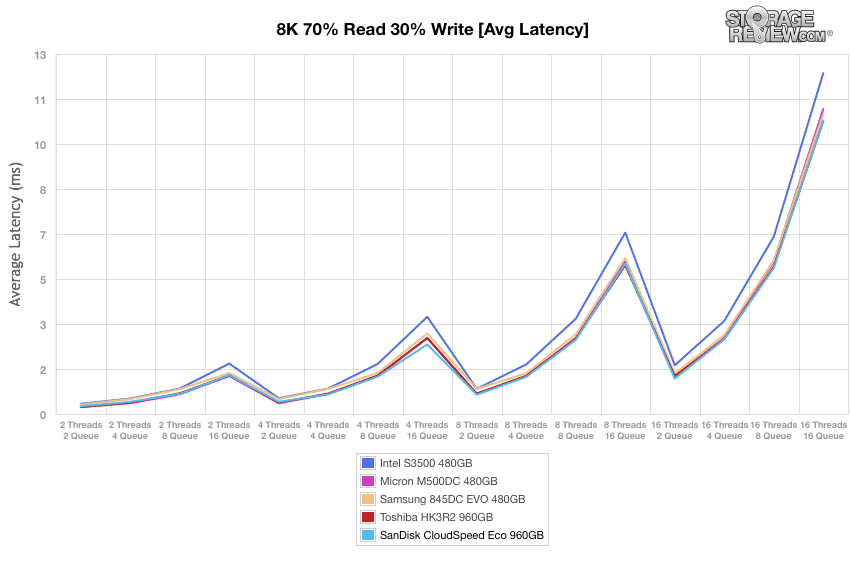
Our average latency tests showed similar results, with the CloudSpeed Eco taking 2nd place (10.6ms 16T/16Q) and the HK3R2 taking first place (10.57ms 16T/16Q).
In our max latency test, the CloudSpeed Eco posted good numbers again with 64.84ms by 16T/16Q, this time beating the HK3R2, which had a 16T/16Q result of 120.84ms (4th). The Samsung 845DC was the top SSD here (58.01ms).
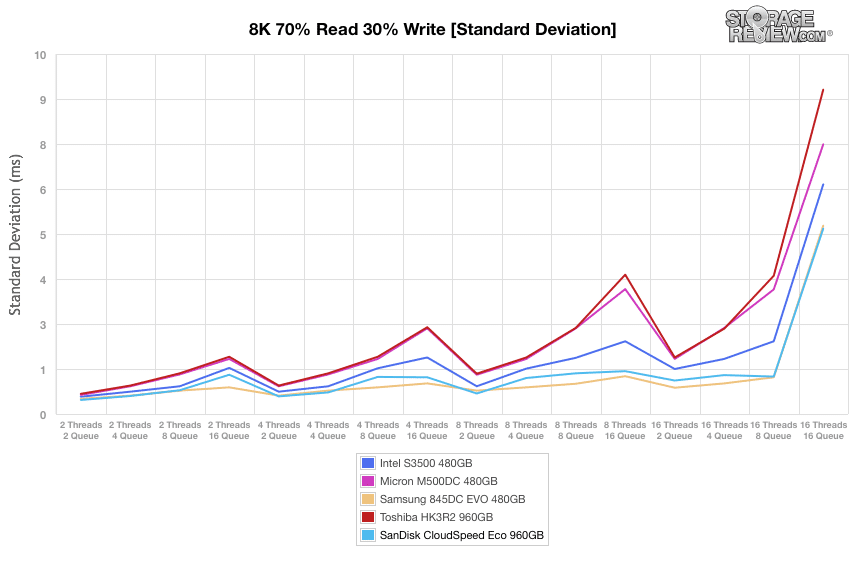
Our very last test looks at standard deviation. Here, the SanDisk CloudSpeed Eco posted excellent results (5.15ms by 16T/16Q), making it the top performer. The Samsung 845DC trailed close behind with 5.23ms at 16T/16Q.
Conclusion
The SanDisk CloudSpeed Eco is entry-enterprise SSD designed for use cases such as boot drive duty, web serving, media streaming and performance read tier in hyperscale cloud data center server and storage environments. Though it showed some lackluster performance in a few of our tests, SanDisk has made up for this in part due to its great reliability features and power efficiency for read-centric workloads, which allow it to be used in server scenarios where data integrity, system functionality, and the device’s relatively low cost outweigh performance. This is accomplished specifically through their Guardian Technology Platform, which provides the CloudSpeed Eco with of a suite of enterprise features and endurance enhancement technologies (including FlashGuard, EverGuard, and DataGuard) to help make the drives ready for the enterprise.
Looking into the specifics of its performance, the CloudSpeed Eco landed across the board; in some workloads it was a top contender and in others it was a bit messy. An example of the latter was during our application benchmarking, particularly in our overall average latency tests using our MarkLogic NoSQL database benchmark, where the SanDisk drive placed last among our comparables with 54.298ms. To put this into perspective, the next best drive (Micron M500DC) scored 13.79ms. Our other MarkLogic benchmark (average latency) told a similar story, as it showed latency spikes reaching almost 600ms towards the end of the test. On the flip side, the drive did very well in SQL Server tests, taking the second spot in this drive class.
When looking at 4K preconditioning benchmarks, the CloudSpeed Eco had the weakest overall performance of our enterprise drives. This trend continued when moving on to our primary 4k synthetic benchmarks, particularly when looking at read activity. That being said, the performance of the CloudSpeed Eco picked up significantly when we put it through our primary 8K profile (70% Read, 30% Write), where it consistently placed at the top of our leaderboards in both latency and throughput.
When considering all of the performance data, it’s clear that the CloudSpeed Eco is a mixed bag, both in application and synthetic testing. The drive does offer a deep pool of data integrity and reliability features, so that’s a big plus and it did very well in SQL. Unless the drive has a cost advantage or the workload matches closely to where it did well though, the inconsistent performance is a concern in an otherwise very crowded entry-enterprise market.
Pros
- Guardian Technology platform offers a great set of reliability features
- Good performance during 8K benchmarks
- Strong performance in SQL Server
Cons
- Weak MarkLogic NoSQL performance
- Inconsistent performance profile
Bottom Line
The SanDisk CloudSpeed Eco offers a very useful suite of reliability and data integrity functionality, but its imbalanced performance ultimately hurts the overall story.


 Amazon