

Huawei launched the ES3000 V3 NVMe enterprise SSD in 2016, their first NVMe drive for the enterprise. Overall, the drive was a good first effort as NVMe was just finding its way into the most demanding applications in the data center. This summer, Huawei has built on the foundation of the V3 family with the ES3000 V5 portfolio. The product announcement came at Interop, where Huawei revealed several details of the upcoming drive, which will be generally available in Q4 this year. Compared to the V3, the V5 drives bring increased capacity, performance, and reliability to the table.
The ES3000 V5 drives are built on 64-layer TLC NAND and the latest generation of Huawei's in-house controller. The drives come in capacities up to 8TB in a U.2 form factor. Huawei engineers believe they've pushed the V5 nearly to the interface limit, driving 3.5 GB/s read bandwidth. Furthermore, the drives can post 3.2 GB/s write and IOPS over 825K. Huawei is quoting the ES3000 V5 series to have some fairly serious endurance as well, with up to 3 DWPD for 5 years and at the highest, up to 35.04PB written.
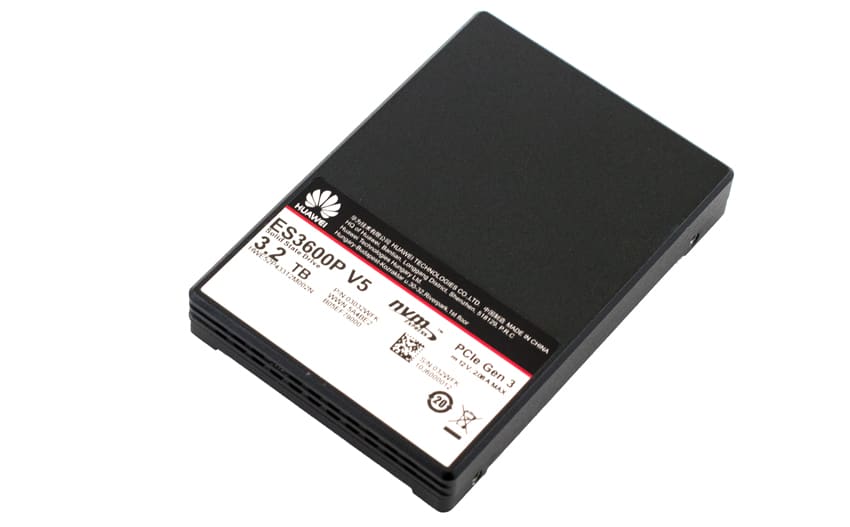
Our review model is the 3.2TB capacity U.2 form factor ES3600P V5. The Series has two models, the ES3500P V5 and ES3600P V5. While the ES3600P V5 has smaller raw capacities, it offers better write performance and higher endurance. It should be noted that our model is pre-production but was tested with near final firmware build.
Huawei ES3000 V5 Specifications
| Model | ES3500P V5 | ES3600P V5 |
| Form Factor | U.2 | |
| Interface | NVMe 1.3 | |
| NAND | 3D TLC | |
| Capacity | 1TB, 2TB, 4TB, 8TB | 800GB, 1.6TB, 3.2TB, 6.4TB |
| Performance | ||
| Sequential Read/Write |
1TB: 3500/1000 MB/s 2TB: 3500/1900 MB/s 4TB: 3500/3200 MB/s 8TB: 3500/2600 MB/s |
800GB: 3500/1000 MB/s 1.6TB: 3500/1900 MB/s 3.2TB: 3500/3200 MB/s 6.4TB: 3500/3050 MB/s |
| Random Read/Write |
1TB: 420k/63k IOPS 2TB: 740k/90k IOPS 4TB: 825k/110k IOPS 8TB: 825k/150k IOPS |
800GB: 420k/115k IOPS 1.6TB: 740k/195k IOPS 3.2TB: 825k/300k IOPS 6.4TB: 825k/250k IOPS |
| Average Read/Write latency | 88μs/14μs | |
| Power Consumption | ||
| Idle | 5W | |
| Max | 21W | |
| Endurance | ||
| DWPD | 1 for 5 years | 3 for 5 years |
| TBW |
1TB: 1.825PBW 2TB: 3.65PBW 4TB: 7.3PBW 8TB: 14.6PBW |
800GB: 4.38PBW 1.6TB: 8.76PBW 3.2TB: 17.52PBW 6.4TB: 35.04PBW |
| Reliability | ||
| MTBF | 2.5 million hours | |
| AFR | ≤0.35% | |
| UBER | 10-18 | |
| Temperature | ||
| Non-operational | -40°C to +70°C | |
| Operational | 0°C to 70°C (U.2) | |
| Weight | < 182 g | |
Design and Build
The Huawei ES3600 V5 is a U.2 SSD with a 2.5” form factor. The drive is largely black metal with a sticker on the front indicating information such as model number and capacity, as well as company branding.
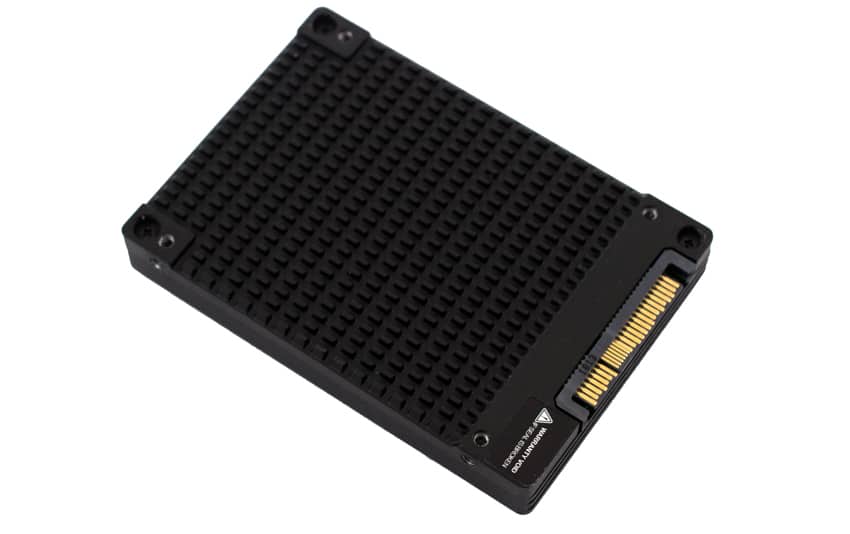
The bottom of the drive is covered in a heat sink.
Performance
Testbed
Our Enterprise SSD reviews leverage a Lenovo ThinkSystem SR850 for application tests and a Dell PowerEdge R740xd for synthetic benchmarks. The ThinkSystem SR850 is a well-equipped quad-CPU platform, offering CPU power well in excess of what's needed to stress high-performance local storage. Synthetic tests that don't require a lot of CPU resources use the more traditional dual-processor server. In both cases, the intent is to showcase local storage in the best light possible that aligns with storage vendor maximum drive specs.
Lenovo ThinkSystem SR850
- 4 x Intel Platinum 8160 CPU (2.1GHz x 24 Cores)
- 16 x 32GB DDR4-2666Mhz ECC DRAM
- 2 x RAID 930-8i 12Gb/s RAID Cards
- 8 NVMe Bays
- VMware ESXI 6.5
Dell PowerEdge R740xd
- 2 x Intel Gold 6130 CPU (2.1GHz x 16 Cores)
- 16 x 16GB DDR4-2666MHz ECC DRAM
- 1x PERC 730 2GB 12Gb/s RAID Card
- Add-in NVMe Adapter
- Ubuntu-16.04.3-desktop-amd64
Testing Background and Comparables
The StorageReview Enterprise Test Lab provides a flexible architecture for conducting benchmarks of enterprise storage devices in an environment comparable to what administrators encounter in real deployments. The Enterprise Test Lab incorporates a variety of servers, networking, power conditioning, and other network infrastructure that allows our staff to establish real-world conditions to accurately gauge performance during our reviews.
We incorporate these details about the lab environment and protocols into reviews so that IT professionals and those responsible for storage acquisition can understand the conditions under which we have achieved the following results. None of our reviews are paid for or overseen by the manufacturer of equipment we are testing. Additional details about the StorageReview Enterprise Test Lab and an overview of its networking capabilities are available on those respective pages.
Comparables for this review:
- Memblaze PBlaze5 3.2TB
- Memblaze PBlaze4 3.2TB
- Intel P3700 2TB
- Intel P4500 2TB
- HGST SN100 3.2TB
- Toshiba PX04 1.6TB
Application Workload Analysis
In order to understand the performance characteristics of enterprise storage devices, it is essential to model the infrastructure and the application workloads found in live-production environments. Our benchmarks for the Huawei ES3600P V5 are therefore the MySQL OLTP performance via SysBench and Microsoft SQL Server OLTP performance with a simulated TCP-C workload. For our application workloads, each drive will be running 2-4 identically configured VMs.
SQL Server Performance
Each SQL Server VM is configured with two vDisks: 100GB volume for boot and a 500GB volume for the database and log files. From a system-resource perspective, we configured each VM with 16 vCPUs, 64GB of DRAM and leveraged the LSI Logic SAS SCSI controller. While our Sysbench workloads tested previously saturated the platform in both storage I/O and capacity, the SQL test is looking for latency performance.
This test uses SQL Server 2014 running on Windows Server 2012 R2 guest VMs, and is stressed by Quest's Benchmark Factory for Databases. StorageReview’s Microsoft SQL Server OLTP testing protocol employs the current draft of the Transaction Processing Performance Council’s Benchmark C (TPC-C), an online transaction-processing benchmark that simulates the activities found in complex application environments. The TPC-C benchmark comes closer than synthetic performance benchmarks to gauging the performance strengths and bottlenecks of storage infrastructure in database environments. Each instance of our SQL Server VM for this review uses a 333GB (1,500 scale) SQL Server database and measures the transactional performance and latency under a load of 15,000 virtual users.
SQL Server Testing Configuration (per VM)
- Windows Server 2012 R2
- Storage Footprint: 600GB allocated, 500GB used
- SQL Server 2014
- Database Size: 1,500 scale
- Virtual Client Load: 15,000
- RAM Buffer: 48GB
- Test Length: 3 hours
- 2.5 hours preconditioning
- 30 minutes sample period
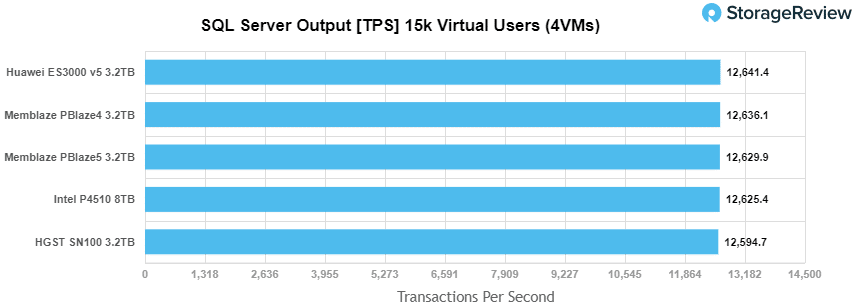
For our SQL Server transactional benchmark, the Huawei ES3600P V5 came out on top of the test with a score of 12,641.4 TPS. While all scores were fairly close, within 47 TPS of each other, the ES3600P V5 was able to beat out the others.
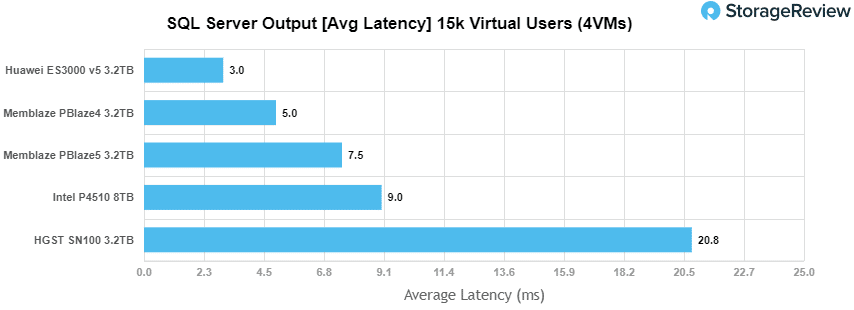
With SQL average latency, we see another impressive performance by the Huawei drive with only 3ms latency, better than the rest of the pack.
Sysbench Performance
The next application benchmark consists of a Percona MySQL OLTP database measured via SysBench. This test measures average TPS (Transactions Per Second), average latency, and average 99th percentile latency as well.
Each Sysbench VM is configured with three vDisks: one for boot (~92GB), one with the pre-built database (~447GB), and the third for the database under test (270GB). From a system resource perspective, we configured each VM with 16 vCPUs, 60GB of DRAM and leveraged the LSI Logic SAS SCSI controller.
Sysbench Testing Configuration (per VM)
- CentOS 6.3 64-bit
- Percona XtraDB 5.5.30-rel30.1
- Database Tables: 100
- Database Size: 10,000,000
- Database Threads: 32
- RAM Buffer: 24GB
- Test Length: 3 hours
- 2 hours preconditioning 32 threads
- 1 hour 32 threads
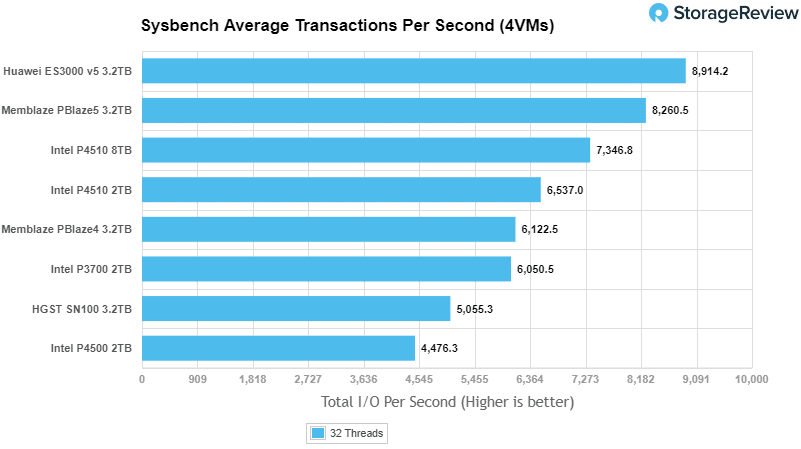
With the Sysbench transactional benchmark, the Huawei ES3600P V5 once again led the pack with 8,914.2 TPS, about 650 TPS higher than the next competitor, the Memblaze PBlaze5.
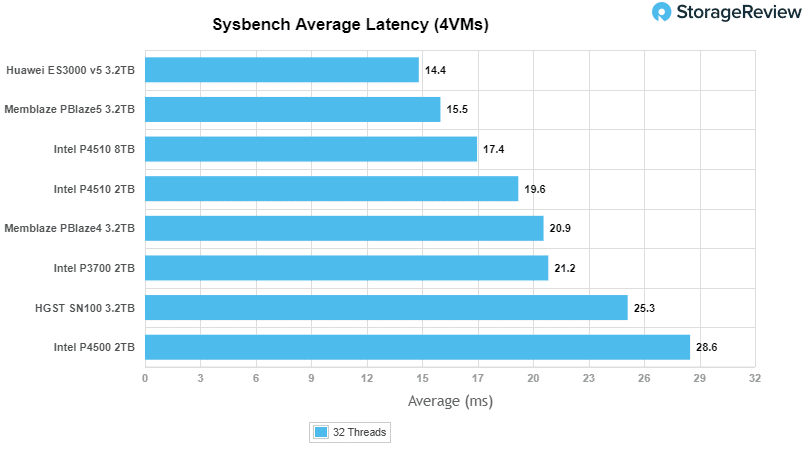
Sysbench average latency had the Huawei drive continuing to beat out the other drives with only 14.4ms in latency.
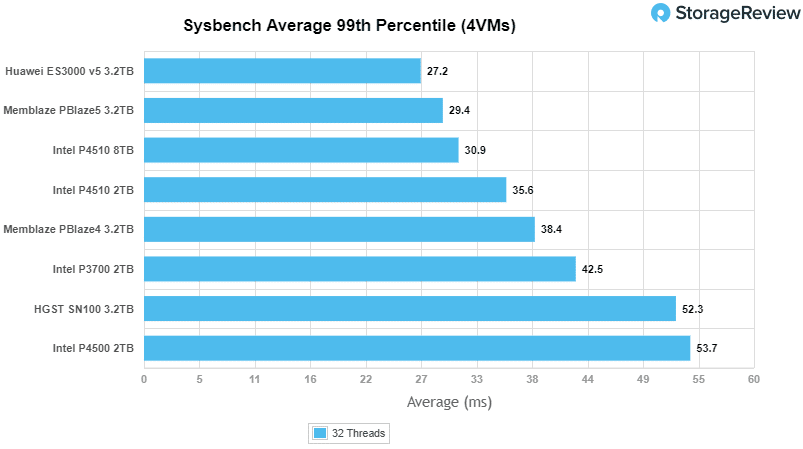
Our worst-case scenario latency benchmark once again had the ES3600P V5 place better than the other SSDs with only 27.2ms.
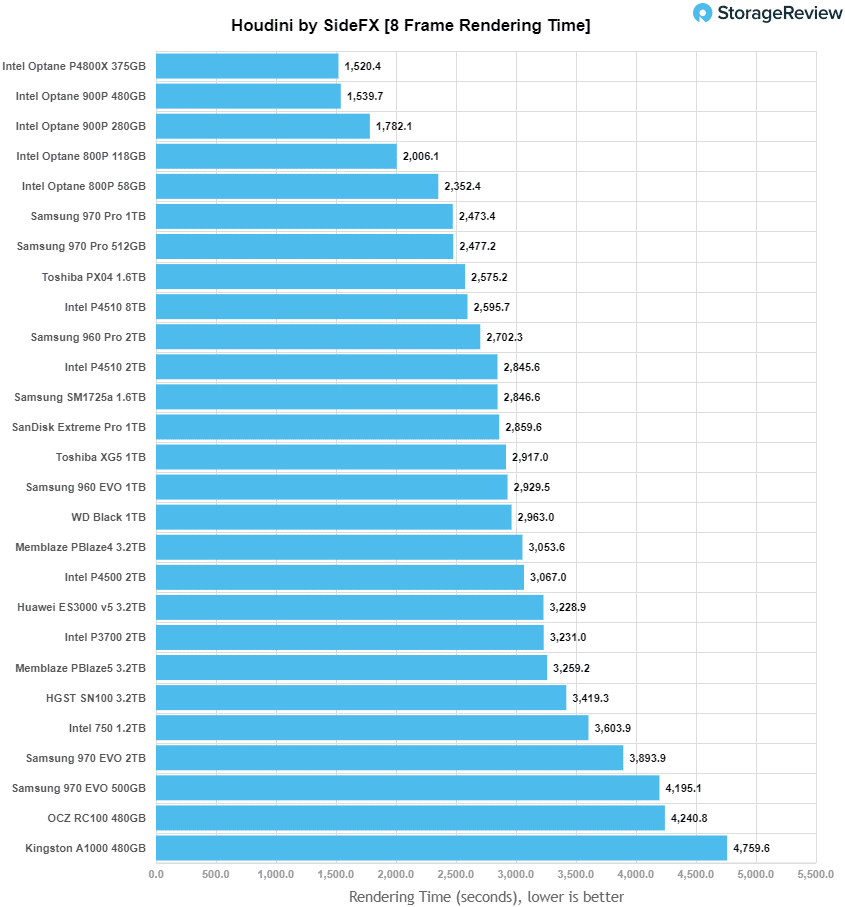
Houdini by SideFX
The Houdini test is specifically designed to evaluate storage performance as it relates to CGI rendering. The test bed for this application is a variant of the core Dell PowerEdge R740xd server type we use in the lab with dual Intel 6130 CPUs and 64GB DRAM. In this case, we installed Ubuntu Desktop (ubuntu-16.04.3-desktop-amd64) running bare metal. Output of the benchmark is measured in seconds to complete, with fewer being better.
The Maelstrom demo represents a section of the rendering pipeline that highlights the performance capabilities of storage by demonstrating its ability to effectively use the swap file as a form of extended memory. The test does not write out the result data or process the points in order to isolate the wall-time effect of the latency impact to the underlying storage component. The test itself is composed of five phases, three of which we run as part of the benchmark, which are as follows:
- Loads packed points from disk. This is the time to read from disk. This is single threaded, which may limit overall throughput.
- Unpacks the points into a single flat array in order to allow them to be processed. If the points do not have dependency on other points, the working set could be adjusted to stay in-core. This step is multi-threaded.
- (Not Run) Process the points.
- Repacks them into bucketed blocks suitable for storing back to disk. This step is multi-threaded.
- (Not Run) Write the bucketed blocks back out to disk.
The Houdini test was the first time that the Huawei ES3600P V5 didn’t take first place. Here it placed roughly in the middle of the non-Optane drives with a score of 3,228.9 seconds.
VDBench Workload Analysis
When it comes to benchmarking storage devices, application testing is best, and synthetic testing comes in second place. While not a perfect representation of actual workloads, synthetic tests do help to baseline storage devices with a repeatability factor that makes it easy to do apples-to-apples comparison between competing solutions. These workloads offer a range of different testing profiles ranging from "four corners" tests, common database transfer size tests, to trace captures from different VDI environments. All of these tests leverage the common vdBench workload generator, with a scripting engine to automate and capture results over a large compute testing cluster. This allows us to repeat the same workloads across a wide range of storage devices, including flash arrays and individual storage devices. Our testing process for these benchmarks fills the entire drive surface with data, then partitions a drive section equal to 25% of the drive capacity to simulate how the drive might respond to application workloads. This is different than full entropy tests which use 100% of the drive and take them into steady state. As a result, these figures will reflect higher-sustained write speeds.
Profiles:
- 4K Random Read: 100% Read, 128 threads, 0-120% iorate
- 4K Random Write: 100% Write, 64 threads, 0-120% iorate
- 64K Sequential Read: 100% Read, 16 threads, 0-120% iorate
- 64K Sequential Write: 100% Write, 8 threads, 0-120% iorate
- Synthetic Database: SQL and Oracle
- VDI Full Clone and Linked Clone Traces
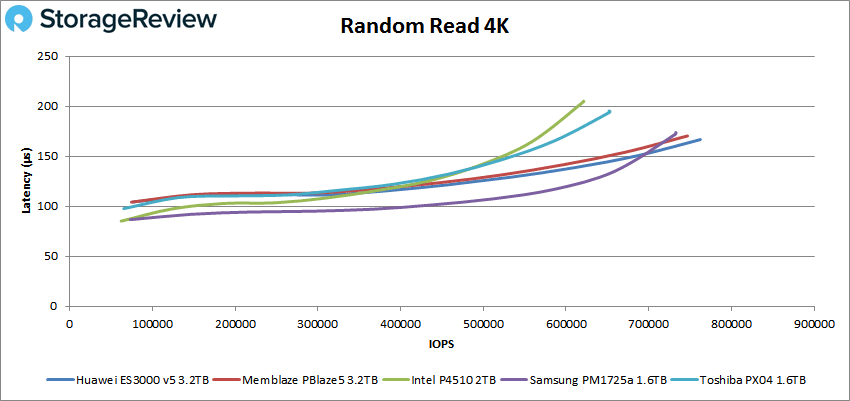
In our first VDBench Workload Analysis, Random 4K Read, the Huawei ES3600P V5 had sub-millisecond latency performance throughout. The drive was able to eek past the others to pull out a top spot with peak performance of 762,307 IOPS with the lowest latency of 167μs.
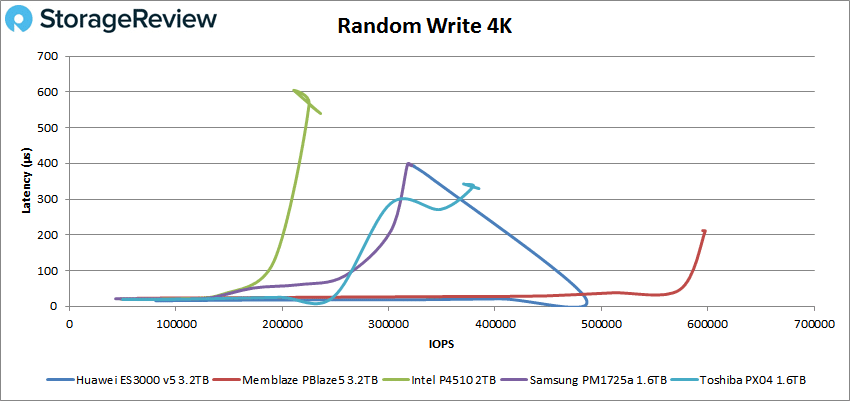
For 4K random writes, the Huawei drive did not perform nearly as well. The drive started strong with a peak performance of about 485K IOPS at 23μs latency before spiking way up in latency and dropping quite a bit in performance, and finishing tied at fourth with 321,814 IOPS and a latency of 395μs.
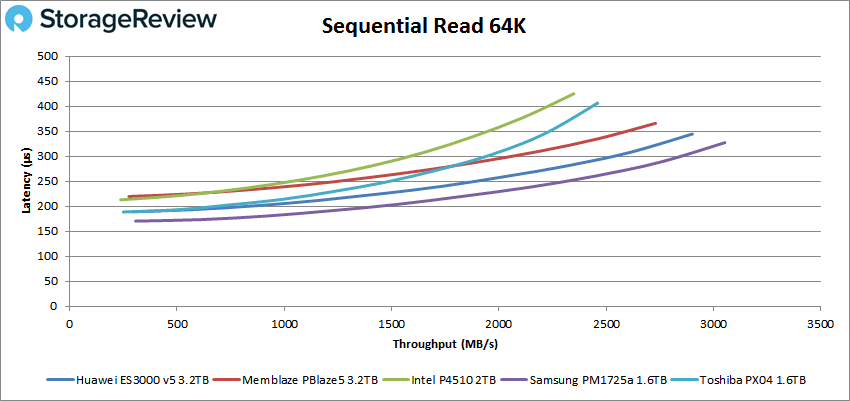
Switching over to sequential workloads, the Huawei drive had another strong performance in our 64K read, coming in second with a peak score of 46,371 IOPS or 2.9GB/s with a latency of 344μs.
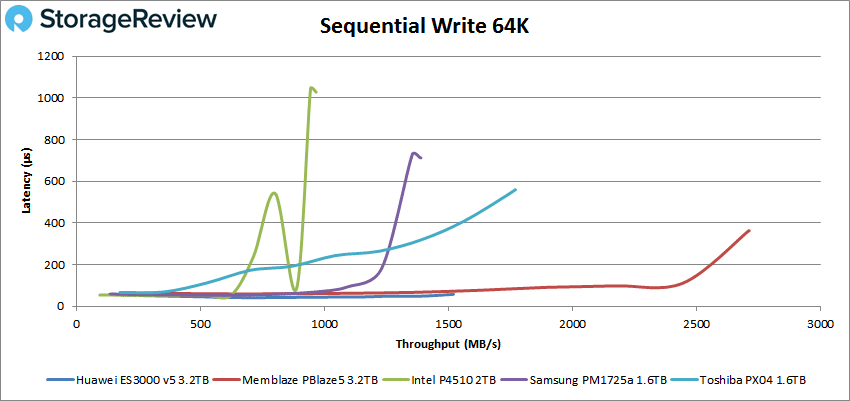
For 64K sequential write, the Huawei drive showed extremely low latency of 57.8μs but placed third with 24,312 IOPS or 1.63GB/s.
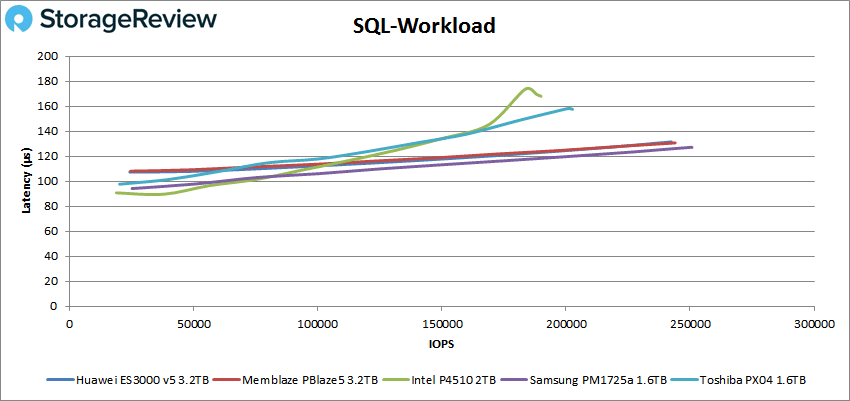
Next, we look at our SQL tests. Here the Huawei ES3600P V5 came in third with a peak performance of 242,373 IOPS with a latency of 132μs.
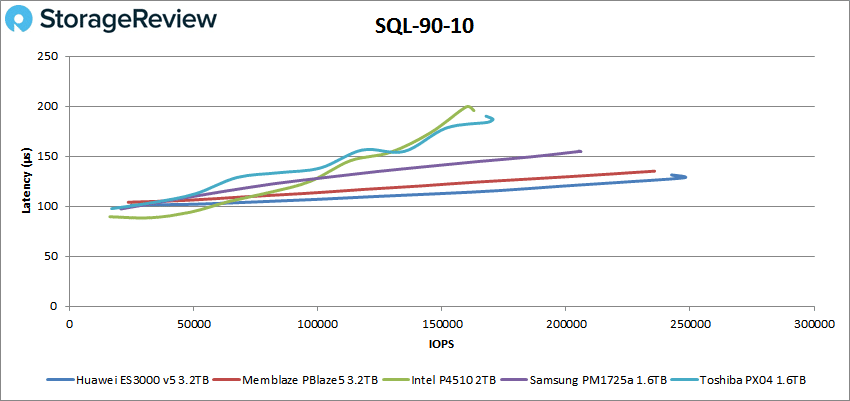
For our SQL 90-10, the Huawei drive once again took the lead with peak performance of 247,718 IOPS with a latency of 131μs.
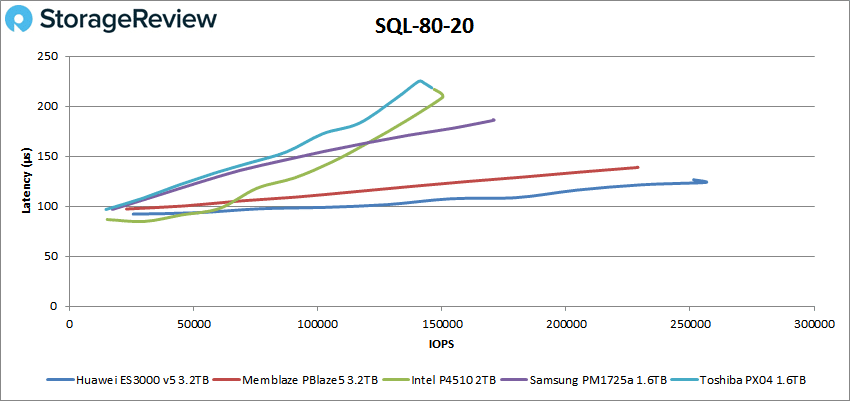
The Huawei drive retained the lead in the SQL 80-20 with a peak performance of 256,219 IOPS and a latency of 124μs.
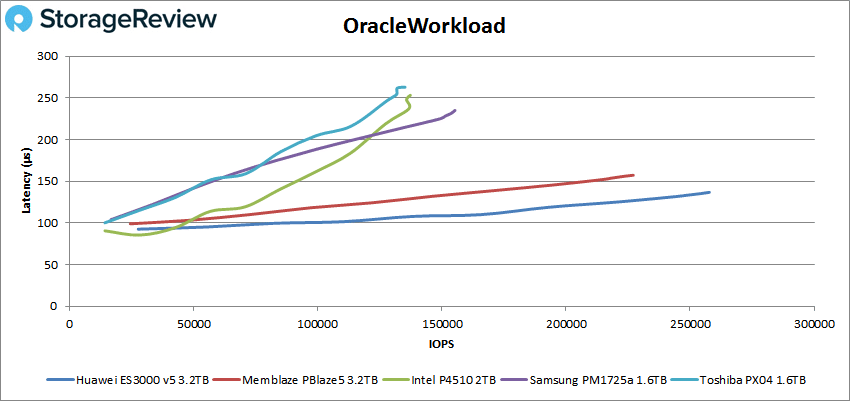
For our Oracle tests, the Huawei ES3600P V5 again showed strong performance throughout. For the first test, the drive was the top performer with a peak performance of 257,775 IOPS and a latency of 137μs.
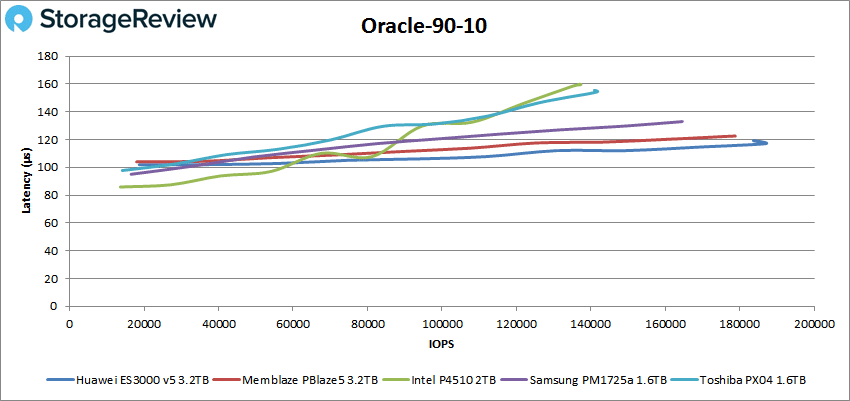
The Oracle 90-10 showed the drive staying in the lead with a peak performance of 186,914 IOPS and a latency of 117μs.
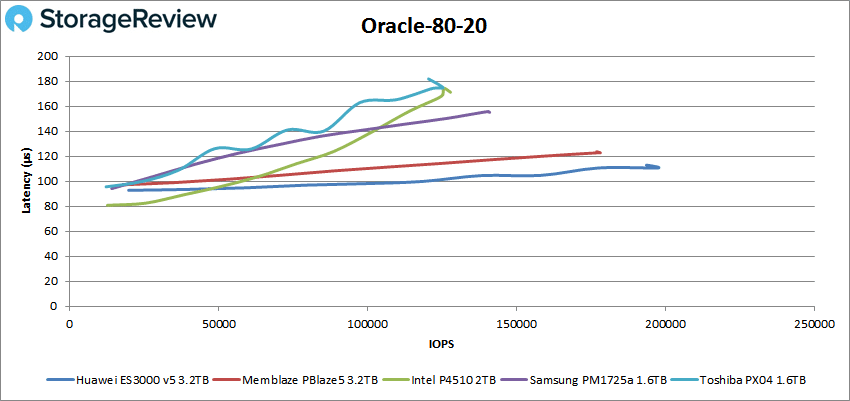
The Huawei continued its top spot on the Oracle 80-20 with a peak score of 197,479 IOPS and a latency of 111μs.
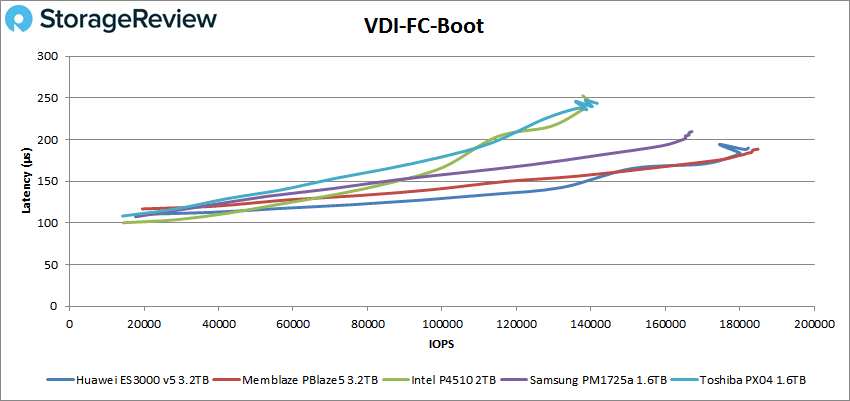
Next, we switched over to our VDI clone test, Full and Linked. For VDI Full Clone Boot, the Huawei battled it out for the top spot with Memblaze PBlaze5, though it landed in second place with a peak score of 181,408 IOPS and a latency of 190μs.
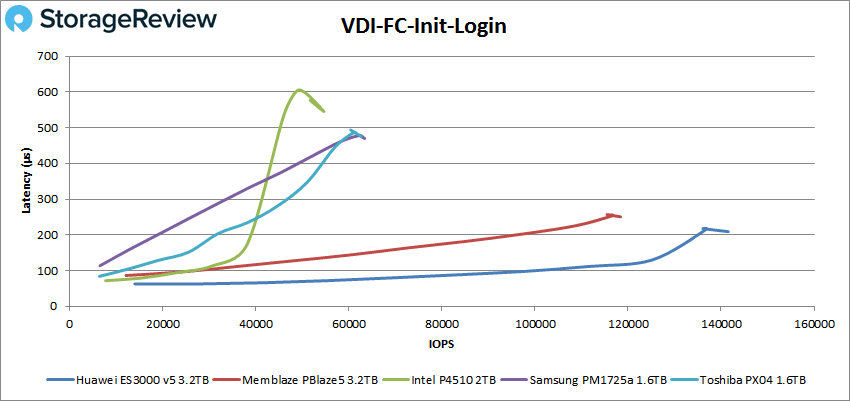
For VDI FC Initial Login, the Huawei drive once again took the top spot with 141,531 IOPS and latency of 209μs.
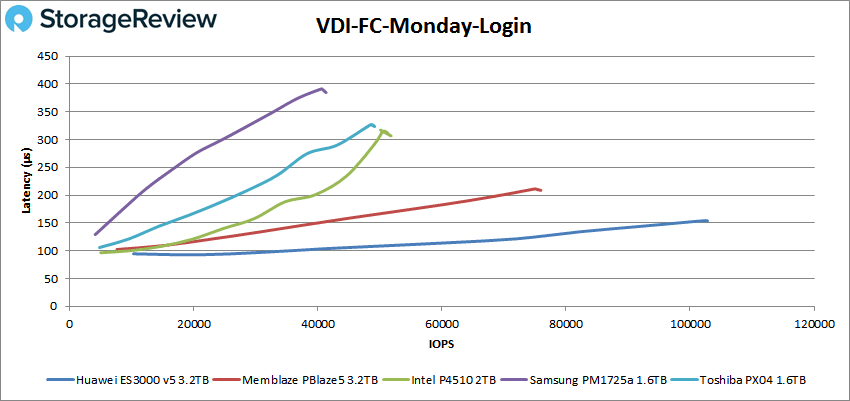
For VDI FC Monday login, the Huawei showed its greatest lead yet with 102,448 IOPS, over 25K IOPS higher than the next closest drive. It had a peak latency of only 154μs.
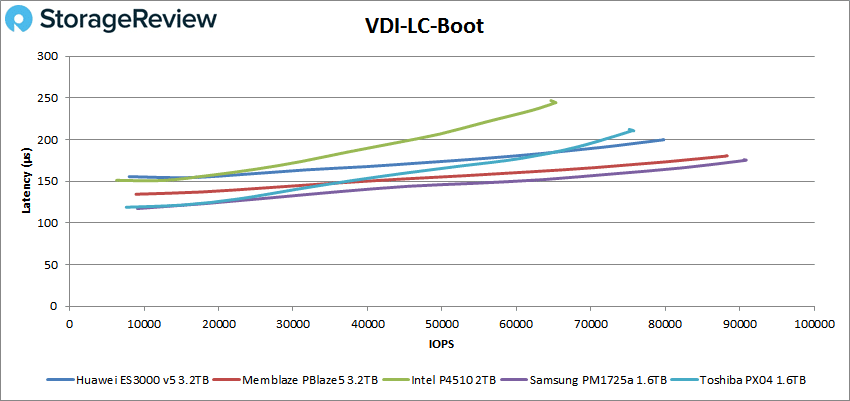
Switching over to Linked Clone (LC), in the boot test the Huawei drive stumbled a bit and found itself in third with peak performance of 79,488 IOPS with a latency of 200μs.
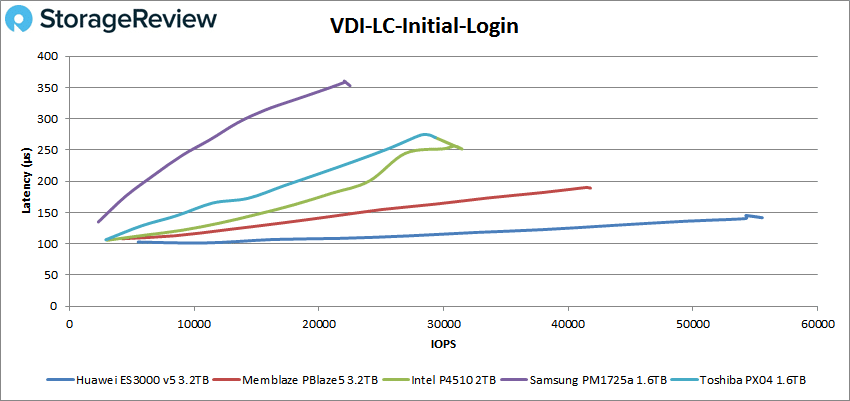
The Huawei drive jumped firmly back in the lead in the VDI LC Initial Login with a peak performance of 55,572 IOPS and a latency of 142μs.
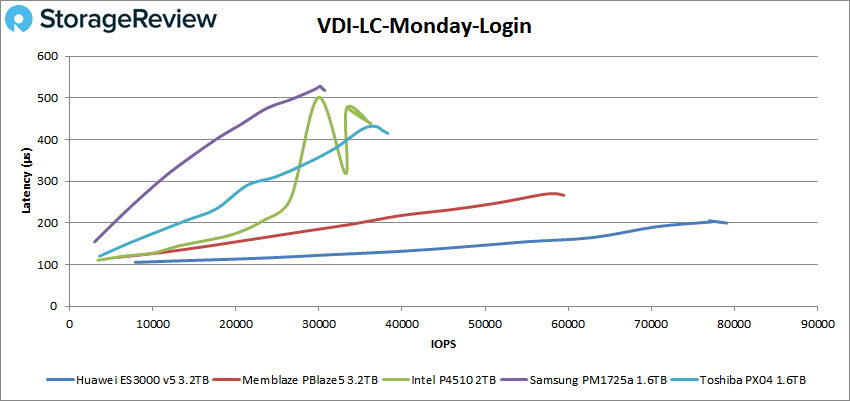
Finally, for our VDI LC Monday Login, the Huawei drive had a peak performance of 79,090 IOPS and a latency of 200μs, taking the top spot once again.
Conclusion
Huawei’s updated ES3000 line, V5, is a large step up from their first NVMe enterprise drive, the ES3000 V3. This new NVMe SSD leverages 64-Layer 3D TLC NAND and ranges in capacities form 800GB to 8TB. The drive uses Huawei’s latest generations of ASIC controllers and has potential speeds of 3.5GB/s sequential read and up to 825K IOPS random read. The drive is designed to be used in databases, for distributed storage, Big Data, content caching, HCI, and CAD/CAM.
Looking at performance in our application workload analysis, the Huawei ES3600P V5 dominated all the tests except Houdini. In our SQL Server test, the drive hit 12,641.4 TPS with an average latency of 3ms. In our Sysbench tests, the ES3000 V5 had 8,914.2 TPS, an average latency of 14.4ms, and a worst-case scenario latency of 27.2ms. In our Houdini test by SideFX, the drive landed about in the middle of the pack with 3,228.9 seconds.
For our VDBench benchmarks, the Huawei ES3600P V5 performed very well or at the top spot in most of the benchmarks. Highlights include 762K IOPS random read, 2.9GB/s sequential read, and 1.63GB/s sequential write (and an extremely low latency of 57.8μs). In our SQL workloads, the Huawei took the top spot in both 90-10 and 80-20 with 247K IOPS and 256K IOPS, respectively. The drive had top performance across all of our Oracle tests and very strong performance in our VDI Clone test; in particular, in the Initial and Monday Login where it took top place in both Linked and Full Clone tests. While we tend to look at overall performance here, it is interesting to note just how low some of the latencies were in these tests: 57.8μs in the 64K write, 124μs in SQL 80-20, 117μs in Oracle 90-10, 111μs in Oracle 80-20, and only 142μs in VDI Linked Clone Initial Login. If latency is something that may be a concern for one’s business, the Huawei ES3000 V5 can more than handle it.
Throughout our testing, the new ES3000 V5 posted tremendous scores across the board, taking huge leads in our MySQL and SQL Server database benchmarks. Overall, the newly released V5 model sets the bar even higher for upcoming NVMe SSDs and gives arrays capable of leveraging NVMe drives a fantastic option to consider.


 Amazon