

The Lenovo ThinkStation P920 is a tower workstation with the potential for tons of power. The workstation can be equipped with dual Intel Xeon processors for up to 28 cores. Along with that, at the top end it can be fitted with up to 2TB of DDR4, 2666MHz of RAM, and up to three NVIDIA Quadro P6000’s, an exclusive to this workstation. Lenovo offers off the shelf and build your own models.
For engineers, the workstation they choose has to be able to power some of the most resource intensive applications for design. The P920 is easy to setup, deploy, and manage, and while that it not necessarily a must, it sure is nice. The P920 has ISV certification from all the major vendors. If users need more storage or power the workstation is easy to enhance and optimize through the Lenovo Performance Tuner and Lenovo Workstation Diagnostics apps.
The Lenovo ThinkStation P920 comes with a three year warranty and can be picked up off the shelf for as little as $1,579. The P920 is highly customizable and that can dramatically change the price.
Lenovo ThinkStation P920 Tower Specifications
| Form factor | Tower |
| Processor | Up to Dual Intel Platinum, Gold, Silver, and Bronze (up to 28 cores, up to 3.6 GHz per CPU) |
| Memory | Up to 2TB DDR4 2666 MHz, 16 DIMMs |
| Chipset | Intel C621 |
| Storage | |
| Max | Up to 12 total drives Up to 4 internal storage bays Max onboard M.2 = 2 (4 TB) Max 3.5″ HDD = 6 (60 TB) Max 2.5″ SSD = 10 (20 TB) |
| Drive Media Supported | 3.5″ SATA HDD 7200 rpm up to 10 TB 2.5″ SATA HDD up to 1.2 TB 2.5″ SATA SSD up to 2 TB M.2 PCIe SSD up to 1 TB |
| Removable Storage | 9-in-1 media card (standard) 15-in-1 media card reader (optional) 9.5 mm Slim ODD (optional) |
| RAID supported | 0, 1, 5, 6, 10 |
| Graphics | Up to 3 x NVIDIA Quadro GV100 or P6000 Up to 2 x NVIDIA Quadro RTX 6000 |
| Ports | |
| Front | 4 x USB 3.1 Gen 1 (Type A) Microphone Headphone 2 x USB-C/Thunderbolt 3 (optional) |
| Rear | 4 x USB 3.1 Gen 1 (Type A) 2 x USB 2.0 USB-C (optional) Thunderbolt 3 (optional) Serial Parallel 2 x PS/2 2 x Ethernet Audio line-in Audio line-out Microphone-in eSATA (optional) Firewire (optional) |
| Expansion Slots | 5 x PCIe x16 3 x PCIe x4 |
| Dimension (WxDxH) | 7.9” x 24.4” x 17.6” (200 mm x 620 mm x 446 mm) |
| Warranty | 3-year |
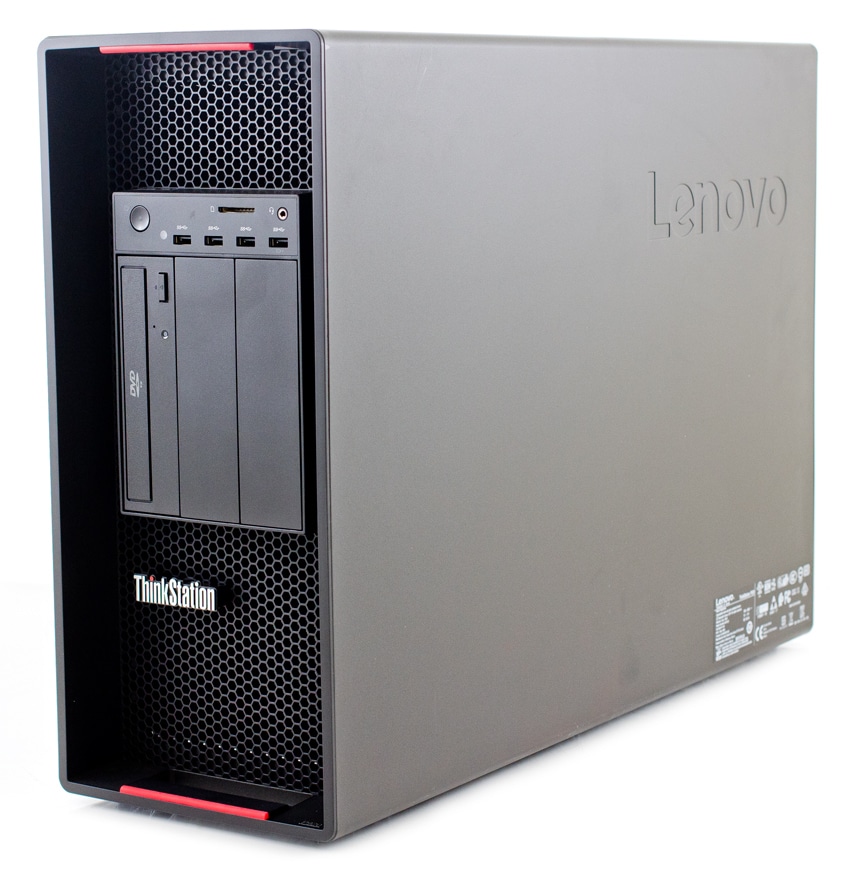
Design and Build
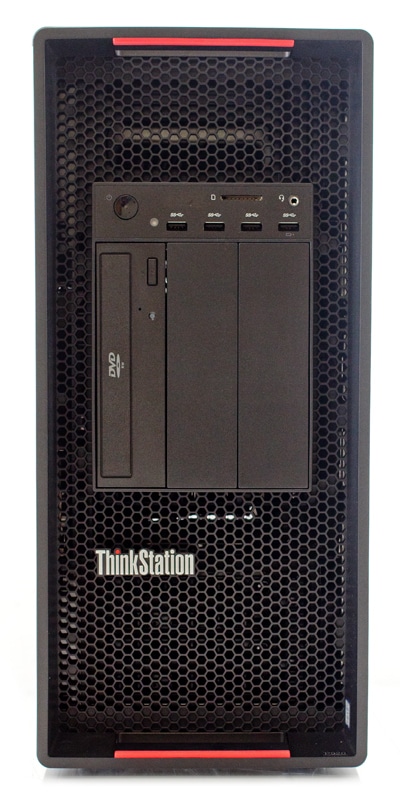
The Lenovo ThinkStation P920 is a tower form factor workstation that it built like a tank. The outside is black metal with red highlights and Lenovo branding. The front of the workstation is mostly ventilation with the power button, four USB 3.1 ports, two audio ports, and a removable media port. Below that is an optical drive.
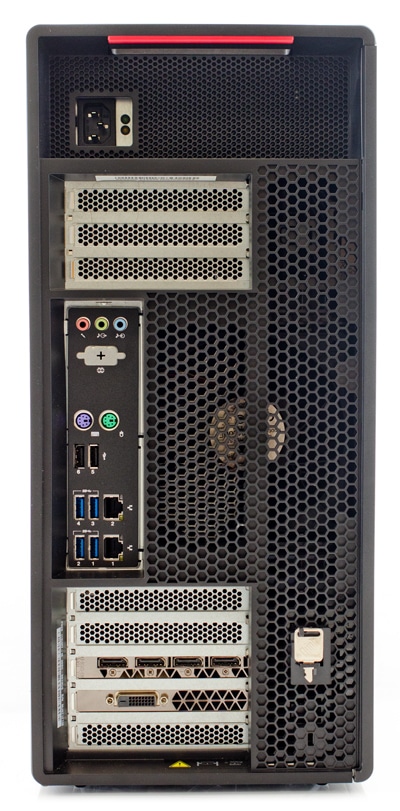
Flipping around to the rear we again see ventilation predominantly taking up the device. At the top is the power supply with LED indicator lights. In the middle are the bulk of the ports including mouse, keyboard, audio in and out, six USB, and networking ports. There are also eight PCIe slots.
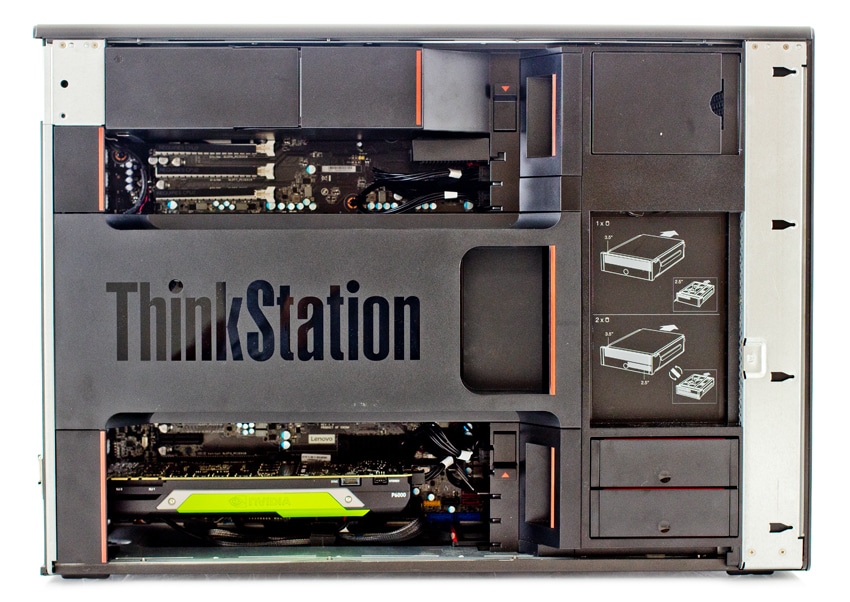
Opening up the workstation gives us a quick and easy look at what has been installed, under Lenovo’s airflow covers. Here users have easy access to the CPUs and can add more GPUs if need be. The airflow directors help out quite a bit as well, allowing the workstation to keep within its acceptable cooling envelope without having to over-drive airflow. During our exhaustive testing, noise levels were kept to a minimum, and you really only felt heat coming out from the workstation. It wasn’t uncommon to verify the unit was turned on by looking at the front LEDs or peering at an internal fan because it was so quiet.
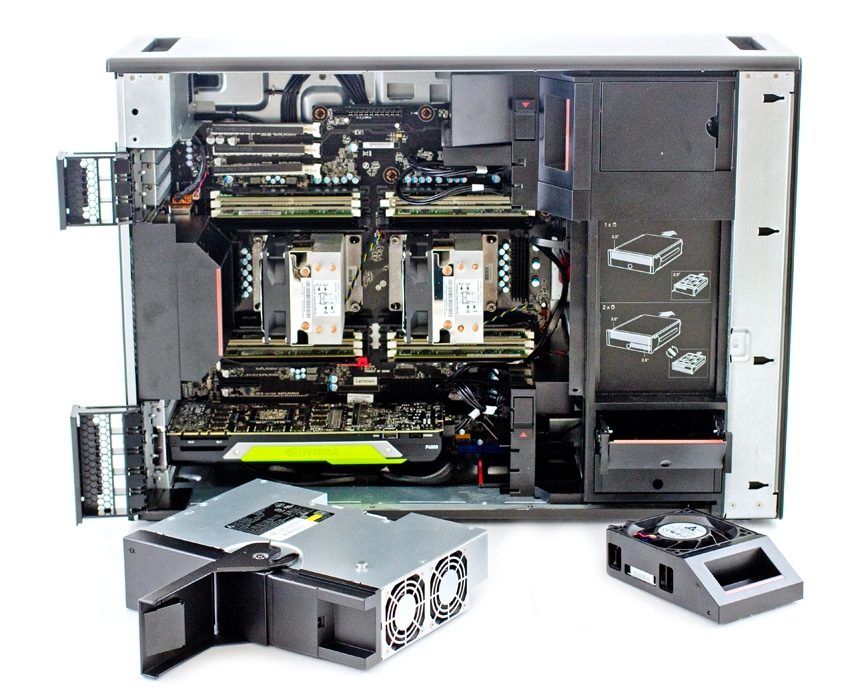
The P920 is very modular and allows for quick and easy replacements and additions inside. One needs to simply pull on one of the red tabs and slide the piece out that needs to be added to or changed. The cover to the CPUs and RAM also pops right off for easy access.
Performance
In order to test the Lenovo ThinkStation P920, we put it through a series of benchmarks to demonstrate how it performs when confronted with resource-intensive workloads and compared with the Lenovo ThinkPad P72 just for a frame of reference. While at first this seems like an odd choice for comparison, the P72 being a mobile workstation and the P920 being a desktop, however, both leverage the new benchmarks and it is a good place to see how a more powerful desktop stacks up to a mobile workstation. This is not a “which one is better” scenario.
Our Lenovo ThinkStation P920 Configuration:
- 2 x Intel Xeon Gold 5118 2.3Ghz CPUs
- 8 x 8GB DDR4-2666Mhz RAM
- NVIDIA P6000 GPU
- 1TB Samsung SM961 M.2 NVMe SSD
- Windows 10 Pro
The P920 will serve as our testbed for future GPU tests as well as some consumer units. Recently we used to in several GPU tests for the new NVIDIA Quadro RTX GPUs. The results of those tests follow.
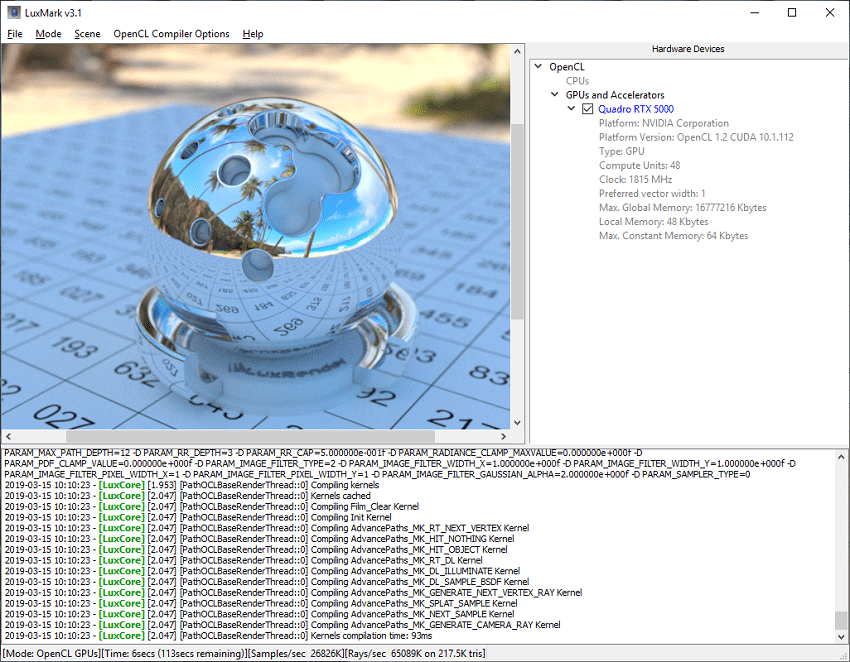
Our first benchmark is the LuxMark cross-platform OpenCL benchmark tool. LuxMark is based on the LuxCore API, and offered as a promotional component of the LuxCoreRender suite. It uses a new micro-kernel based OpenCL path tracer as the rendering more for its benchmark, offering a unique way to stress the GPU installed in a given workstation.
| LuxMark | |
|---|---|
| GPUs | Results |
| P920 P4000 | 15,303 |
| P920 P5000 | 13,170 |
| P920 P6000 | 21,297 |
| P920 RTX 4000 | 28,338 |
| P920 RTX 5000 | 29,404 |
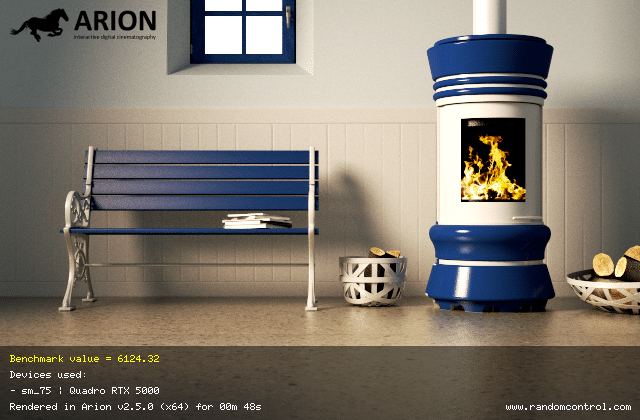
Next up is Arion, a CUDA benchmarking tool, developed by RandomControl that allows workstations to stress CPUs or GPUs in a rendering application. ArionBench is a software tool based on Arion 2 Technology that puts CPU/GPUs under heavy stress through the task of simulating the flow of light in a 3D scene.
| Arion | |
|---|---|
| GPUs | Results |
| P920 P4000 | 1,865 |
| P920 P5000 | 2,738 |
| P920 P6000 | 3,731 |
| P920 RTX 4000 | 4,484 |
| P920 RTX 5000 | 6,193 |
Our next benchmark leverages SolidWorks 2019 and four 3D models covering an Audi R8, a construction digger, a jet engine as well as a ralley car. Solidworks is an industry-leading GPU-accelerated 3D CAD modeling application that operates on Windows-based systems. SolidWorks is developed by Dassault Systèmes and is used by over two million engineers and more than 165,000 companies worldwide. For benchmarking purposes we leverage the new “performance pipeline” feature inside SolidWorks 2019. This architecture provides a more responsive, real-time display especially for large models. It takes advantage of modern OpenGL (4.5) and hardware-accelerated rendering to maintain a high level of detail and frame rate when you pan, zoom, or rotate large models.
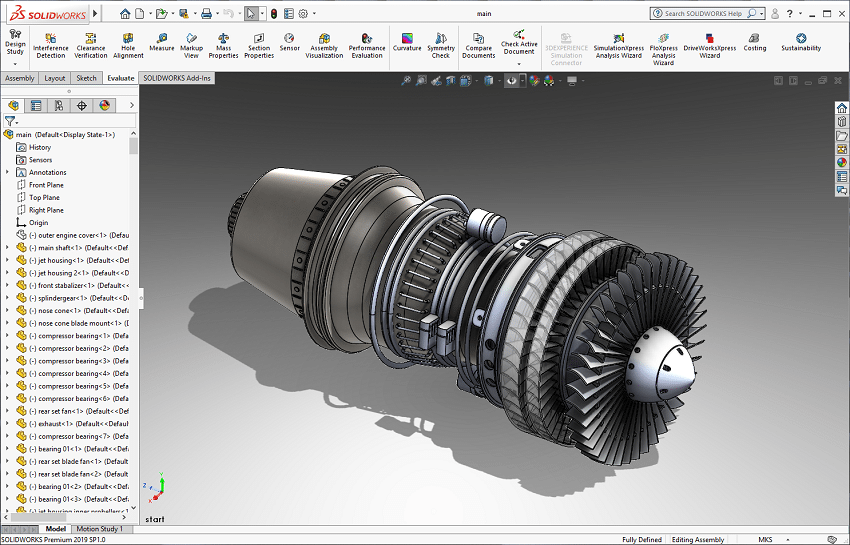
After each model is rendered our script rotates each model five times and measures the time required to complete this task. It then divides that by the number of frames rendered and calculates the average frames per section (FPS) score.
| Solidworks | |
|---|---|
| Solidworks R8 | Average FPS |
| P920 P4000 | 198.0232 |
| P920 P5000 | 214.9254 |
| P920 P6000 | 217.9745 |
| P920 RTX 4000 | 211.1824 |
| P920 RTX 5000 | 208.8849 |
| Solidworks Digger | Average FPS |
| P920 P4000 | 186.4832 |
| P920 P5000 | 211.9595 |
| P920 P6000 | 230.9774 |
| P920 RTX 4000 | 259.6056 |
| P920 RTX 5000 | 294.2529 |
| Solidworks Jet Engine | Average FPS |
| P920 P4000 | 163.0573 |
| P920 P5000 | 198.5351 |
| P920 P6000 | 210.411 |
| P920 RTX 4000 | 220.6897 |
| P920 RTX 5000 | 283.2206 |
| Solidworks Rally Car | Average FPS |
| P920 P4000 | 205.6225 |
| P920 P5000 | 219.0114 |
| P920 P6000 | 218.4922 |
| P920 RTX 4000 | 214.4253 |
| P920 RTX 5000 | 217.256 |
The next benchmark is SPECviewperf 13, the worldwide standard for measuring graphics performance based on professional applications. SPECviewperf 13 runs 9 benchmarks it calls viewsets, all of which represent graphics content and behavior from actual applications. These viewsets include: CATIA, Creo, Energy, Maya, Medical, Showcase, Siemens NX, and Solidworks.
| SPECviewperf 13 | ||
|---|---|---|
| Viewsets | ThinkPad P72 | ThinkStation P920 |
| 3dsmax-06 | 153.14 | 153.3 |
| catia-05 | 252.76 | 242.6 |
| creo-02 | 222.95 | 214.74 |
| energy-02 | 35.68 | 22.01 |
| maya-05 | 232.12 | 265.82 |
| medical-02 | 55.51 | 68.64 |
| showcase-02 | 70.38 | 132.59 |
| snx-03 | 344.37 | 673.18 |
| sw-04 | 156.88 | 128.86 |
The P920 ran neck-and-neck with the P72 through about half the test and far surpassed it in the rest.
Additionally, we also ran SPECworkstation3, which is a specialized benchmark designed for testing all key aspects of workstation performance; it uses over 30 workloads to test CPU, graphics, I/O, and memory bandwidth. The workloads fall into broader categories such as Media and Entertainment, Financial Services, Product Development, Energy, Life Sciences, and General Operations. We are going to list the broad-category results for each, as opposed to the individual workloads. The results are an average of all the individual workloads in each category.
Here, the ThinkStation highlighted the difference of desktop versus mobile a bit more coming out way ahead of the P72.
| SPECworkstation3 | ||
|---|---|---|
| Category | ThinkPad P72 | ThinkStation P920 |
| M&E | 1.93 | 2.85 |
| ProdDev | 1.82 | 3.04 |
| LifeSci | 1.61 | 3.23 |
| Energy | 1.18 | 2.07 |
| FSI | 1.58 | 4.79 |
| GeneralOps | 1.46 | 1.79 |
| GPU Compute | 2.53 | 3.06 |
The next test we look at is IOMeter. All IOMeter figures are represented as binary figures for MB/s speeds. We tested both our typical IOMeter test and a 16QD workload to further tax the system.
Our first test measures 2MB sequential performance. Here the P920 had 1.19GB/s read and 1.42GB/s write. In 16QD the workstation had 3.1GB/s read and 1.56GB/s write. During random 2MB performance the P920 showed 1.07GB/s read and 1.4GB/s write. 16QD had the workstation hit 3.02GB/s read and 1.53GB/s write. In 4K random throughput the workstation had 4,618 IOPS read and 6,251 IOPS write and in 16QD it was able to hit 81,533 IOPS read and 103,253 IOPS write.
| IOMeter | ||
|---|---|---|
| Storage | Local SSD | 16QD Local SSD |
| 2MB Sequential Read | 1.19GB/s | 3.1GB/s |
| 2MB Sequential Write | 1.42GB/s | 1.56GB/s |
| 2MB Random Read | 1.07GB//s | 3.02GB/s |
| 2MB Random Write | 1.4GB/s | 1.53GB/s |
| 4K Random Read | 4,618 IOPS | 81,533 IOPS |
| 4K Random Write | 6,251 IOPS | 103,253 IOPS |
Next up is the Environmental Systems Research Institute (Esri) benchmark. Esri is a supplier of Geographic Information System (GIS) software. Esri’s Performance Team designed their PerfTool add-in scripts to automatically launch the ArcGIS Pro. This application uses a “ZoomToBookmarks” function to browse various pre-defined bookmarks and create a log file with all the key data points required to predict the user experience. The script automatically loops the bookmarks three times to account for caching (memory and disk cache). In other words, this benchmark simulates heavy graphical use that one might see through Esri’s ArcGIS Pro software.
The tests consist of three main datasets. Two are 3-D city views of Philadelphia, PA and Montreal, QC. These city views contain textured 3-D multipatch buildings draped on a terrain model and draped aerial images. The third dataset is a 2-D map view of the Portland, OR region. This data contains detailed information for roads, landuse parcels, parks and schools, rivers, lakes, and hillshaded terrain.
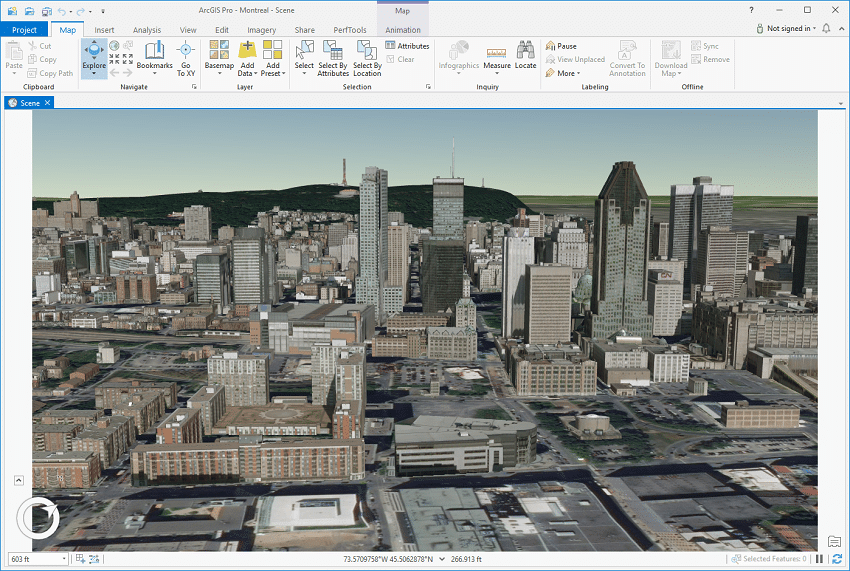
Looking at drawtime of the Montreal model, the Lenovo ThinkStation P920 with the P6000 showed an average drawtime of 00:01:31.081, while average and minimum FPS showed 521.55 and 190.34, respectively.
| ESRI ArcGIS Pro 2.3 Montreal | |
|---|---|
| Drawtime | Average |
| P920 Quadro P4000 | 00:01:31.084 |
| P920 Quadro P5000 | 00:01:31:082 |
| P920 Quadro P6000 | 00:01:31.081 |
| P920 Quadro RTX 4000 | 00:01:31.284 |
| P920 Quadro RTX 5000 | 00:01:31.067 |
| P72 Quadro 5200 | 00:01:31.638 |
| Average FPS | Average |
| P920 Quadro P4000 | 432.327 |
| P920 Quadro P5000 | 489.889 |
| P920 Quadro P6000 | 521.551 |
| P920 Quadro RTX 4000 | 502.395 |
| P920 Quadro RTX 5000 | 527.636 |
| P72 Quadro 5200 | 189.05 |
| Minimum FPS | Average |
| P920 Quadro P4000 | 164.546 |
| P920 Quadro P5000 | 194.218 |
| P920 Quadro P6000 | 190.336 |
| P920 Quadro RTX 4000 | 180.699 |
| P920 Quadro RTX 5000 | 190.775 |
| P72 Quadro 5200 | 83.02 |
Next up is our Philly model, where the ThinkStation P920 with the P6000 showed an average drawtime of 00:01:01.245, while average and minimum FPS showed 469.88 and 207.88, respectively.
| ESRI ArcGIS Pro 2.3 Philly | |
|---|---|
| Drawtime | Average |
| P920 Quadro P4000 | 00:02:53.928 |
| P920 Quadro P5000 | 00:01:01.109 |
| P920 Quadro P6000 | 00:01:01.245 |
| P920 Quadro RTX 4000 | 00:01:00.231 |
| P920 Quadro RTX 5000 | 00:01:01.111 |
| P72 Quadro 5200 | 00:01:01.079 |
| Average FPS | Average |
| P920 Quadro P4000 | 304.340 |
| P920 Quadro P5000 | 451.826 |
| P920 Quadro P6000 | 469.879 |
| P920 Quadro RTX 4000 | 434.170 |
| P920 Quadro RTX 5000 | 531.315 |
| P72 Quadro 5200 | 248.3 |
| Minimum FPS | Average |
| P920 Quadro P4000 | 160.152 |
| P920 Quadro P5000 | 212.910 |
| P920 Quadro P6000 | 207.879 |
| P920 Quadro RTX 4000 | 196.825 |
| P920 Quadro RTX 5000 | 224.341 |
| P72 Quadro 5200 | 114.32 |
Our last model is of Portland. Here, the P920 with he P6000 had an average drawtime of 00:00:32.552. Average FPS showed 2,343.95 while Minimum FPS showed 1,282.05.
| ESRI ArcGIS Pro 2.3 Portland | |
|---|---|
| Drawtime | Average |
| P920 Quadro P4000 | 00:00:32.426 |
| P920 Quadro P5000 | 00:00:32.310 |
| P920 Quadro P6000 | 00:00:32.552 |
| P920 Quadro RTX 4000 | 00:00:32.646 |
| P920 Quadro RTX 5000 | 00:00:32.541 |
| P72 Quadro 5200 | 00:00:32.196 |
| Average FPS | Average |
| P920 Quadro P4000 | 2,051.053 |
| P920 Quadro P5000 | 2,057.395 |
| P920 Quadro P6000 | 2,343.948 |
| P920 Quadro RTX 4000 | 2,821.928 |
| P920 Quadro RTX 5000 | 2,783.547 |
| P72 Quadro 5200 | 1,921.69 |
| Minimum FPS | Average |
| P920 Quadro P4000 | 1,179.974 |
| P920 Quadro P5000 | 1,189.524 |
| P920 Quadro P6000 | 1,282.045 |
| P920 Quadro RTX 4000 | 1,083.260 |
| P920 Quadro RTX 5000 | 1,007.309 |
| P72 Quadro 5200 | 763.11 |
Conclusion
The Lenovo ThinkStation P920 is the company’s latest tower workstation that is designed with the most resource intensive applications in mind. Not only is the workstation easy to setup and deploy it comes with several configuration options including up to 2TB of DDR4, 2666MHz of RAM, and up to three NVIDIA Quadro P6000’s. The P920 also makes up part of the company’s AI workstations when equipped with the new NVIDIA Quadro RTX GPUs.
As the testbed for both our client reviews and GPU reviews going forward, we tested several GPUs in the workstation both in order to complete our NVIDIA Quadro RTX reviews (4000 and 5000) and also three Pascal architecture GPUs for a baseline. For GPU reviews we ran LuxMark, Arion, Solidworks, and as we will get into in the next paragraph, ESRi. The results of the NVIDIA GPUs in the P920 are listed above with a more in-depth look at the new RTX cards in the above linked reviews.
For this review we tested the Lenovo ThinkStation P920 with the NVIDIA Quadro P6000 GPU. For comparison purposes we ran it against a Lenovo ThinkPad P72. Not exactly an apples to apples test but it does give potential buyers an idea of what to expect when going from a high-end Lenovo mobile workstation to a high-end tower workstation. SPECviewperf 13 showed the two workstations running fairly close with each being better than the other in about half the tests. Moving on to SPECworkstation3 we see the P920 pull ahead of the mobile workstation quite a bit. And on our ESRi benchmarks it is not surprising to see the more powerful workstation with Average FPS and minimum FPS so much higher than the mobile workstation’s numbers.
While there were no comparisons, we also tested the P920 in IOMeter under both light and heavy queue depth conditions. The workstation was able to hit numbers as high as 3.1GB/ sequential read, 1.56GB/s write, and 103K IOPS 4K random write in 16QD. In a lower 1QD configuration we saw numbers as high as 1.42GB/s sequential write, 1.19GB/s read, and throughput as high as 6,251 IOPS 4K random write.
Overall the Lenovo ThinkStation P920 is an incredibly powerful workstation that can handle the needs of almost any workload. With minimal changes, such as swapping the graphics card to one of the new NVIDIA Quadro RTX GPUs, you can change it into a powerful AI workstation as well.


 Amazon