

Last month NetApp announced its latest midrange all-flash array with the EF600. While the EF600 is aimed at the same market as the EF570, it is not a replacement. While the EF570 does support NVMe, the EF600 is end-to-end NVMe, which brings new levels of flexibility and performance not previously seen in the midrange. Aside from the performance and price to performance ratio, the EF600 offers a level of future proofing that will be able to hit the demands of tomorrow without the need for forklift upgrades.
Jumping straight to performance, the EF600 claims 2 million IOPS, up to 44GB/s for bandwidth, and latency under 100μs in certain workloads. This level of performance opens the array to new performance-sensitive workloads such as Oracle databases, real-time analytics, on top of high performance parallel FS such as BeeGFS and Spectrum Scale. The performance profile is largely derived from the EF600’s end-to-end NVMe implementation. This also allows the array to support 100Gb NVMe over InfiniBand, 100Gb NVMe over RoCE, and 32Gb NVMe over FC that will be more important down the road. On top of that, the EF600 can pack up to 367TB of capacity into its 2U form factor
The EF600 is built on five generations of NetApp hardware that has proven itself to be reliable. From an availability standpoint, the EF600 offers six 9’s and automated failover with advanced monitoring. The array can detect an issue before a drive fail. In the event of a failure, the array’s Dynamic Disk Pool technology can do faster drive rebuilds than with RAID5 or RAID6. Through SANtricity (that is optimized for flash), the EF600 can provide several data protection options such as dynamic capacity, dynamic segment size migration, dynamic RAID-level migration, and it comes with non-disruptive firmware updates.
NetApp AFA EF600 Specifications
| Form Factor | 2U |
| System memory | Up to 128GB |
| Storage | |
| Maximum raw capacity | 360TB |
| Maximum drives | 24 |
| Drive Types supported | SSD 1.9TB, 3.8TB, 7.6TB 3.8TB FIPS 1.9TB, 3.8TB, 7.6TB, 15.3TB FDE |
| Host I/O ports | Optional add-on I/O ports: 16 ports 32Gb FC 16 ports 32Gb NVMe over FC 8 ports 100Gb NVMe over InfiniBand 8 ports 100Gb NVMe over RoCE Ethernet |
| System Management | SANtricity System Manager 11.60 (web- based, on-box) |
| Performance | |
| IOPS | 2 million |
| Average Latency | <100μs up to 200,000 4K random write IOPS <100μs up to 150,000 4K random read IOPS <250μs up to 2,000,000 4K random read IOPS |
| Sustained throughput | Up to 44GB/s |
| Physical | |
| Dimensions HxWxD | 3.43 x 9.02 x 17.6 in (8.7 x 48.3 x 44.7 cm) |
| Weight | 53.66lb (24.34kg) |
| kVA | Typical: 0.979 Maximum: 1.128 |
| Watts | Typical: 979.09 Maximum: 1,128 |
| BTU | Typical: 3348 Maximum: 3,859.128 |
NetApp AFA EF600 Build and Design
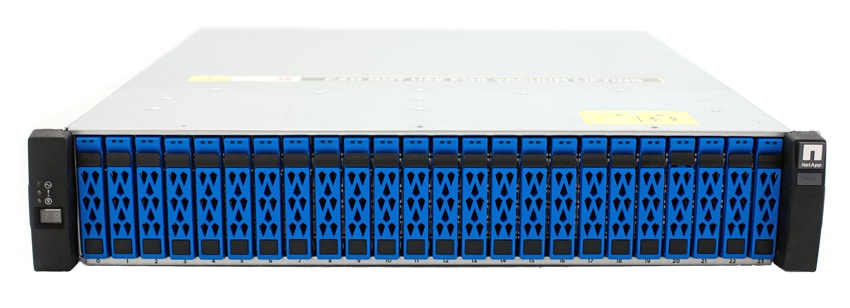
The NetApp AFA EF600 is a 2U array that comes with the standard look of all the other NetApp arrays: same stylish bezel with NetApp branding. Beneath the bezel are the 24 drive bays running vertically across the front of the array. As previously noted, NetApp has switched to a bright blue drive bay more in line with their branding. The power button and LED indicators are on the left of the device.
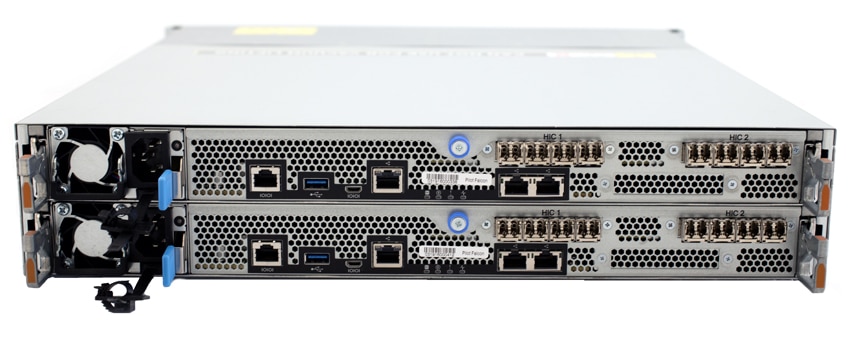
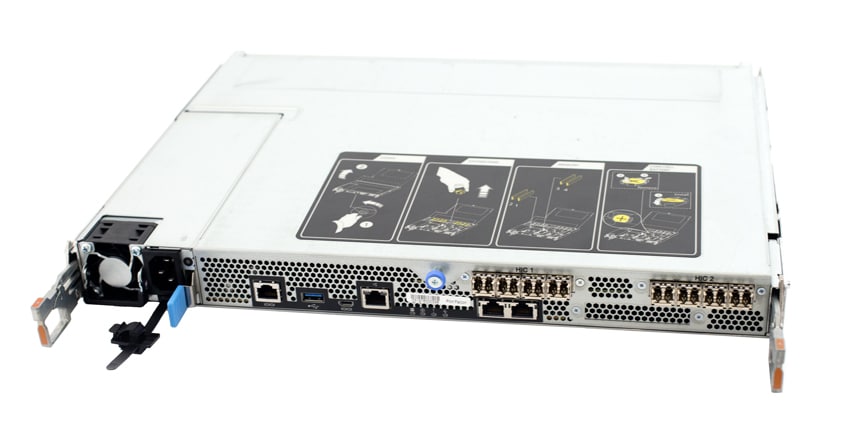
Moving around to the rear of the device we see the mirror image of the controllers, one on top of the other. From left to right there are the PSU, a RJ45 port, USB 3.0 port, a management port, two networking ports, with the upper right taken up with FC connectors for the NVMe over FC in this case.
NetApp AFA EF600 Management
The new EF600 supports the NetApp SANtricity OS 11.XX software bundles which include the controller firmware, IOM firmware, and SANtricity System Manager used to operate the E-Series and EF-Series storage arrays. SANtricity System Manager will give you assistance simplifying the management workflow; the GUI looks and feels fresh, with a simple on-box web Interface and easy terminology.
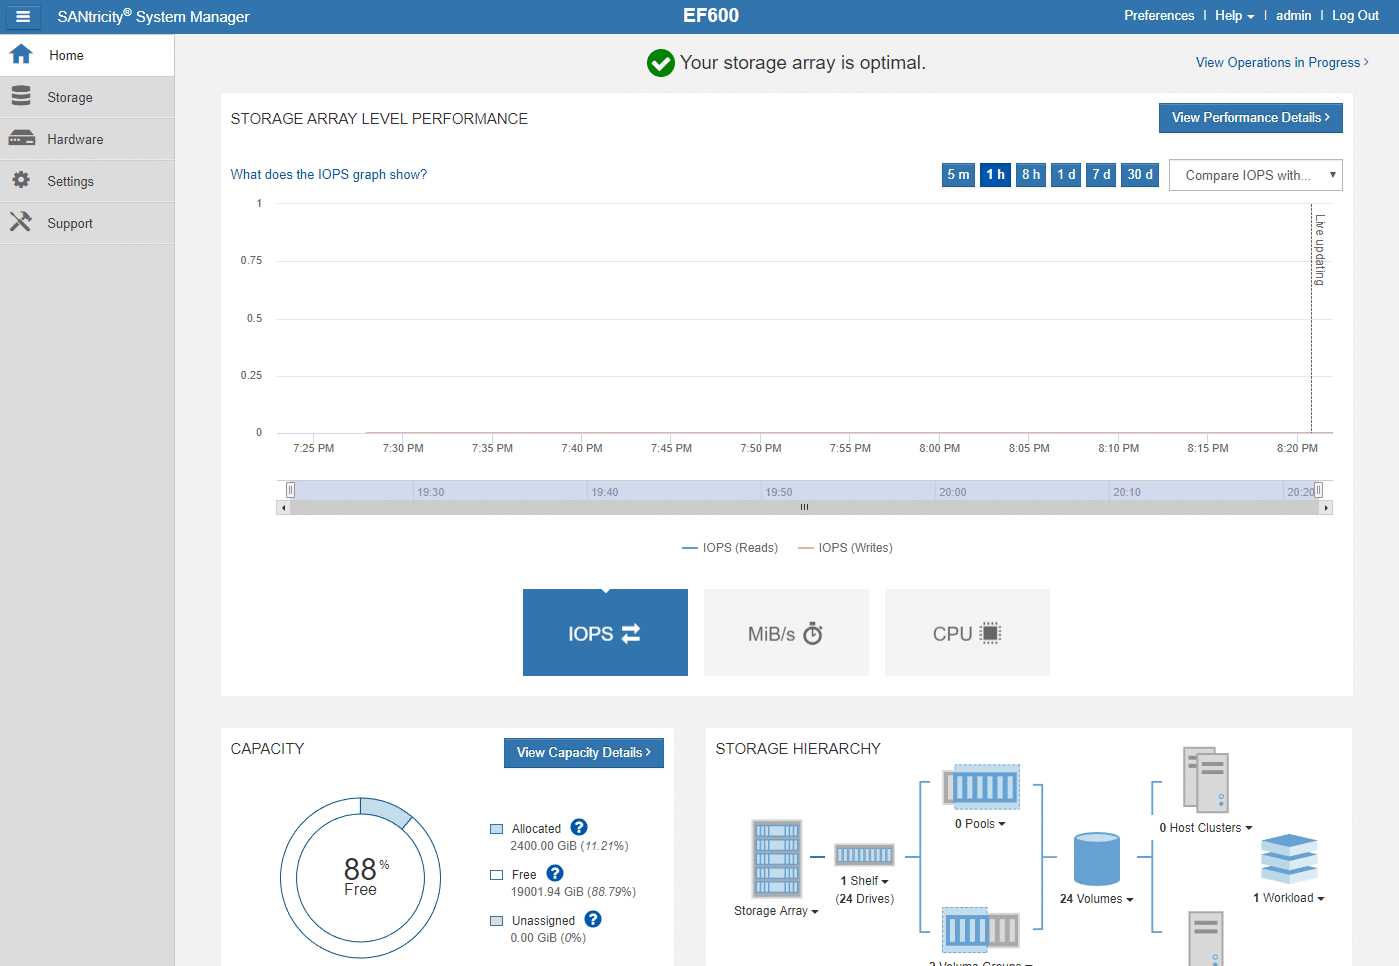
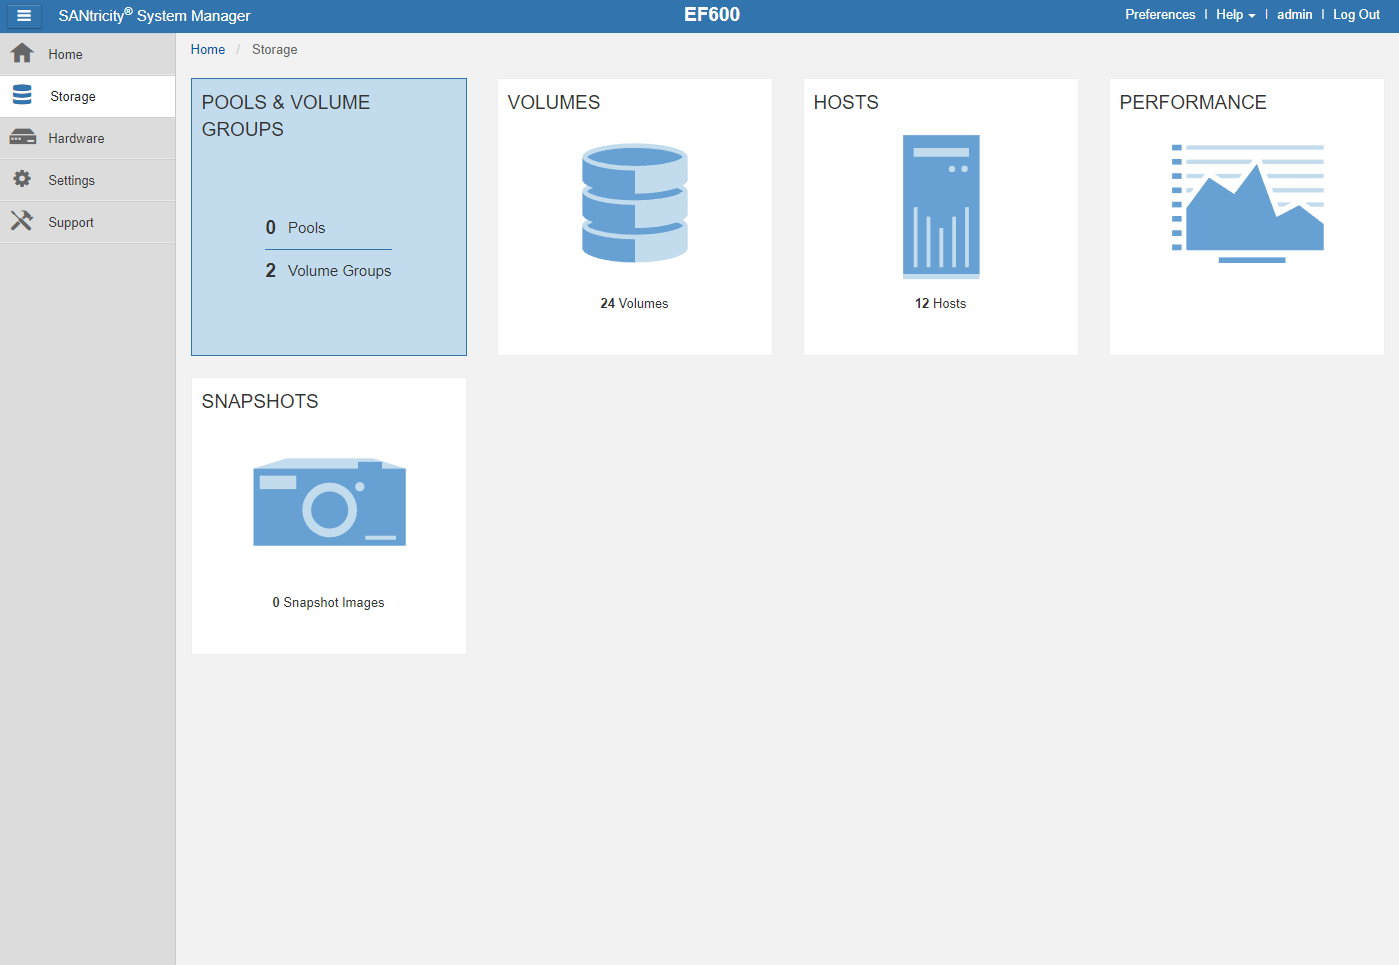
When you log into System Manager, the Home tab, is the first screen displayed; here you will see the dashboard in the main body of the GUI. No matter what tab you are on, you will always see the general options available on the top-right corner of the GUI; including Preferences, Help, Log Out and, also the currently logged user. And on the left panel, the primary system tabs are presented, Home, Storage, Hardware, Settings, and Support.
In the dashboard, you can take a look at critical areas summarizing the state and health of the storage array. On the top, the notifications area shows you the systems status and components; the performance area, shows key metrics including IOPS, MiB/S, and CPU; the capacity area let you see allocated system capacity; and the storage hierarchy area, provides you an organized view of the various hardware components and storage objects managed by the storage array.
Moving down to the Storage tab, you get to the major system categories, where the configuration of Pools & Volumes Groups, Volumes, Hosts, Performance, and Snapshots are displayed. Some of these will be detailed in the below sections.
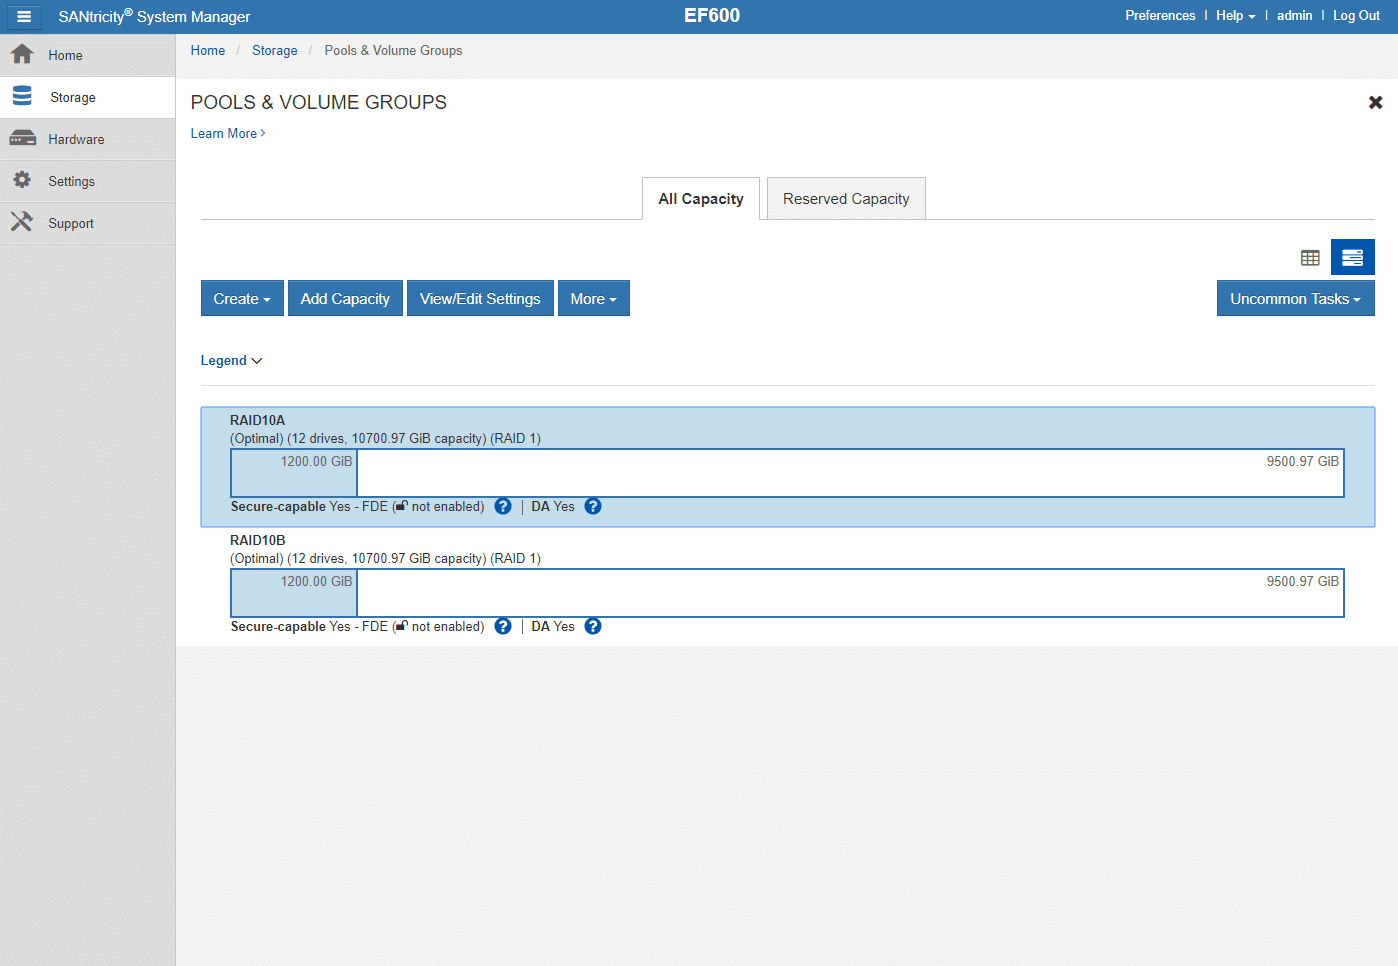
The Pools & Volume Groups page shows the pools and volume groups that have been created in the system; allows editing existing ones or creating new ones from unassigned drives. This page also shows the total capacity, used capacity, the number of drives, RAID configuration, and other statistics of those Pools or Volume Groups.
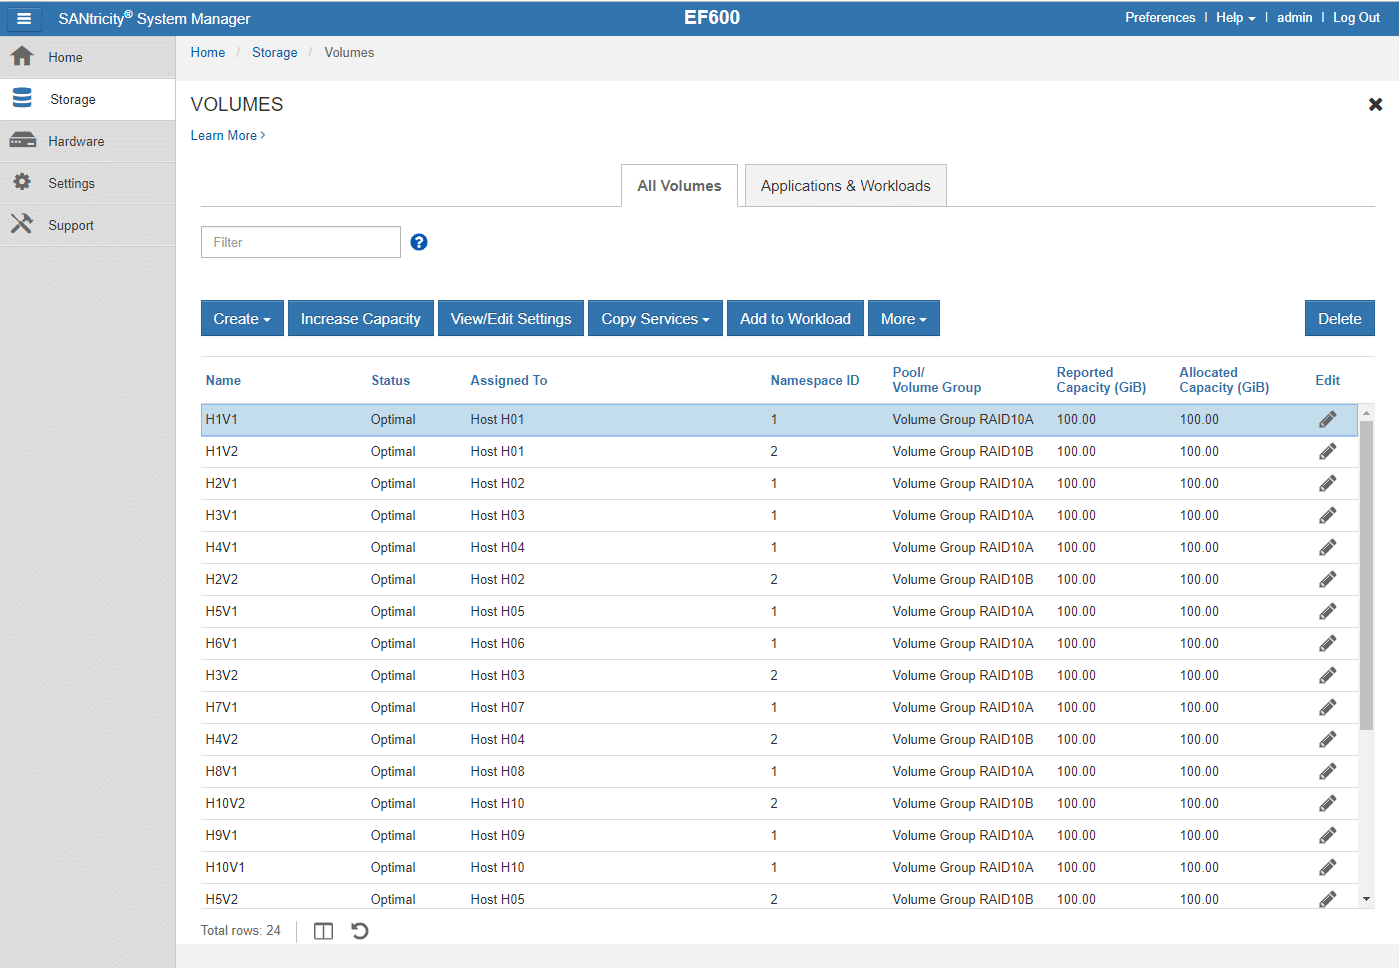
The Volumes page shows the volumes that have been configured. For each volume, the page show status, assigned hosts, pool or volume group they belong, reported capacity, allocated capacity, and other information. This is also the area where you can create or edit volumes, or, define workloads per application.
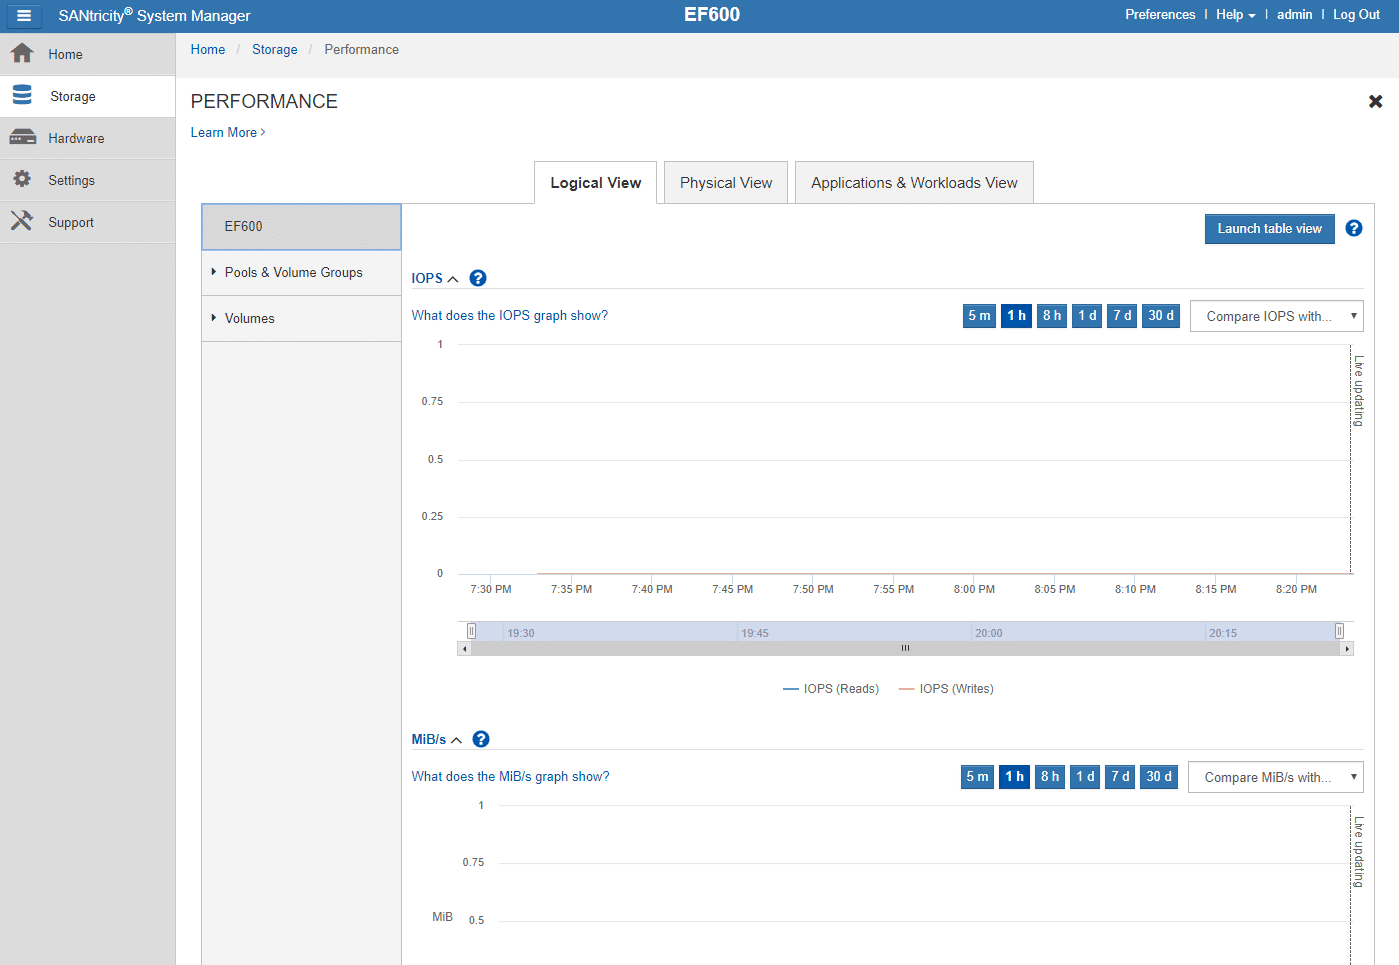
The Performance page provides multiple ways to monitor the performance of the storage array. From the Logical View tab you to define the components you want to monitor, including the whole system, Pool, Volume Group, or single Volume. You can also monitor other key areas of storage array using the Physical and Applications & Workloads View. The Performance page can also be accessed from the Home page by clicking on View Performance Details.
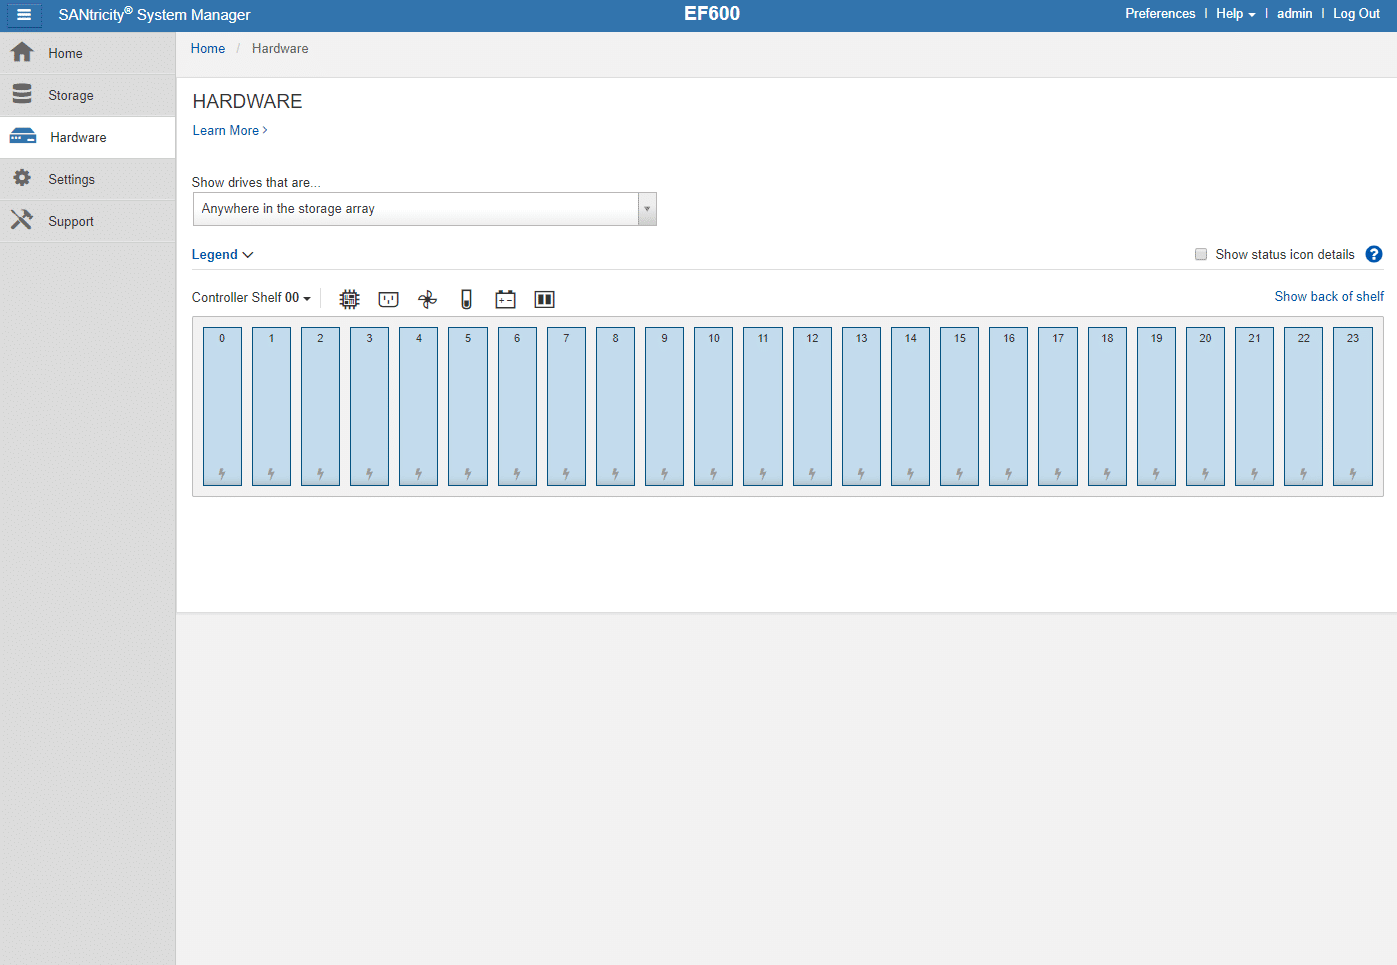
The next tab, the Hardware one, is where you can manage the physical shelves, controllers, and drives that are installed in the storage array. This page shows the drivers that are anywhere in the storage array; you can also change this view to show drivers per pool or volume group.
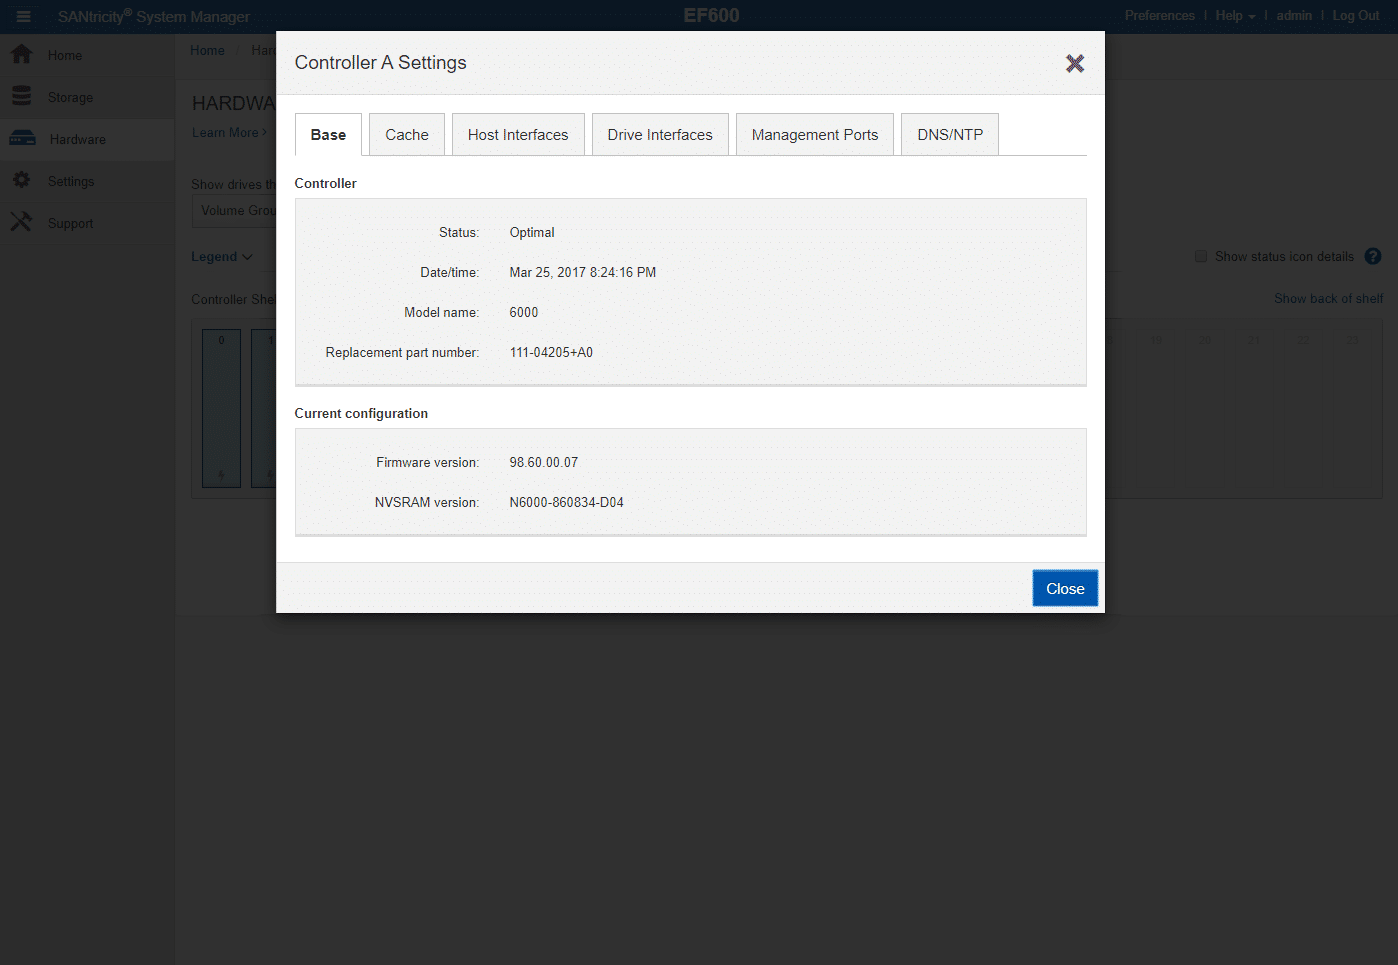
Clicking on the Controller icon, under the Controller Shelf area, allows you to select and see the Controller A or Controller B Settings. From this window, you can move over different tabs, Base, Cache, Host Interfaces, Drive Interfaces, Management Ports, and DNS/NTP to see detailed information of the controller.
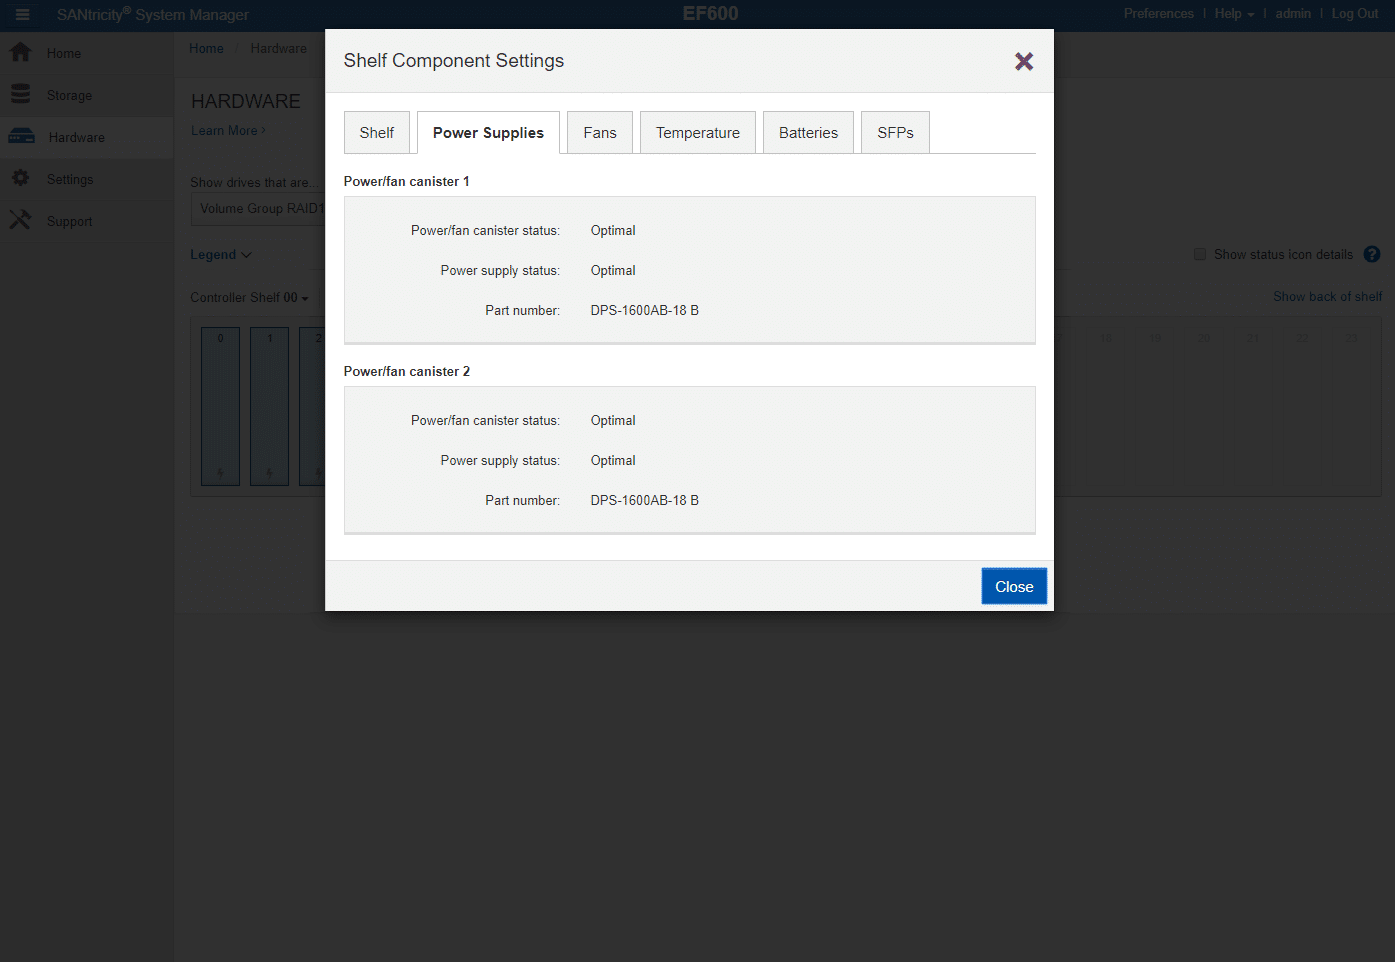
Clicking on any of the other icons, also under the Controller Shelf area, brings up the Shelf Component Settings window. This area is great to monitor the status and settings related to the shelf components, including Power Supplies, Fans, Temperature, Batteries, and SFPs information.
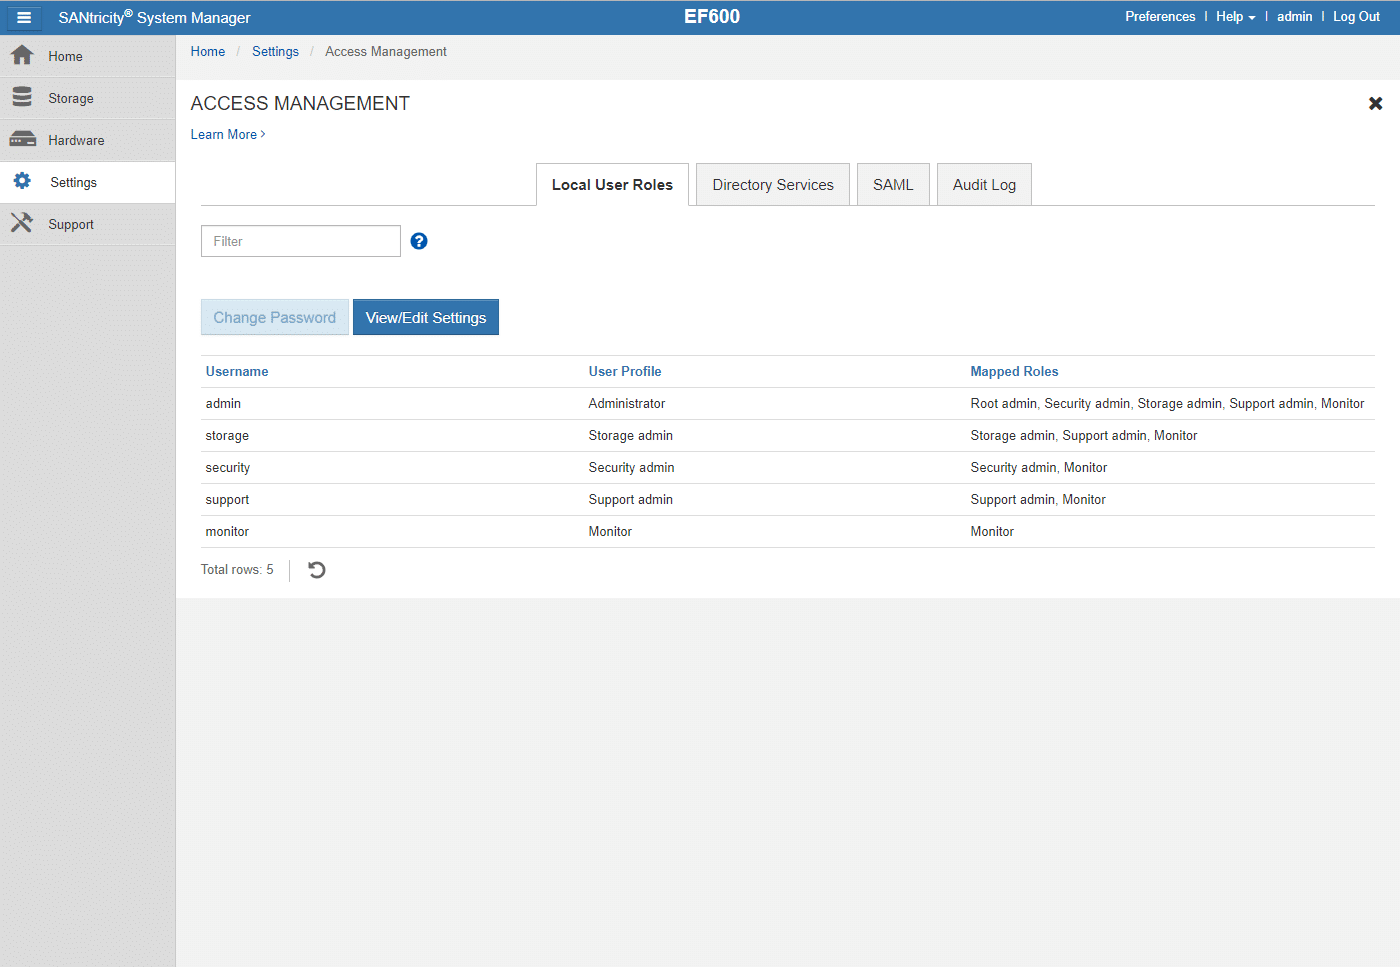
In the Settings tab, is where you can configure alerts to notify if there is an issue with the storage array. This area is also where you can change system settings such as the storage array name, authenticate users, import certificates, and perform other system-wide functions.
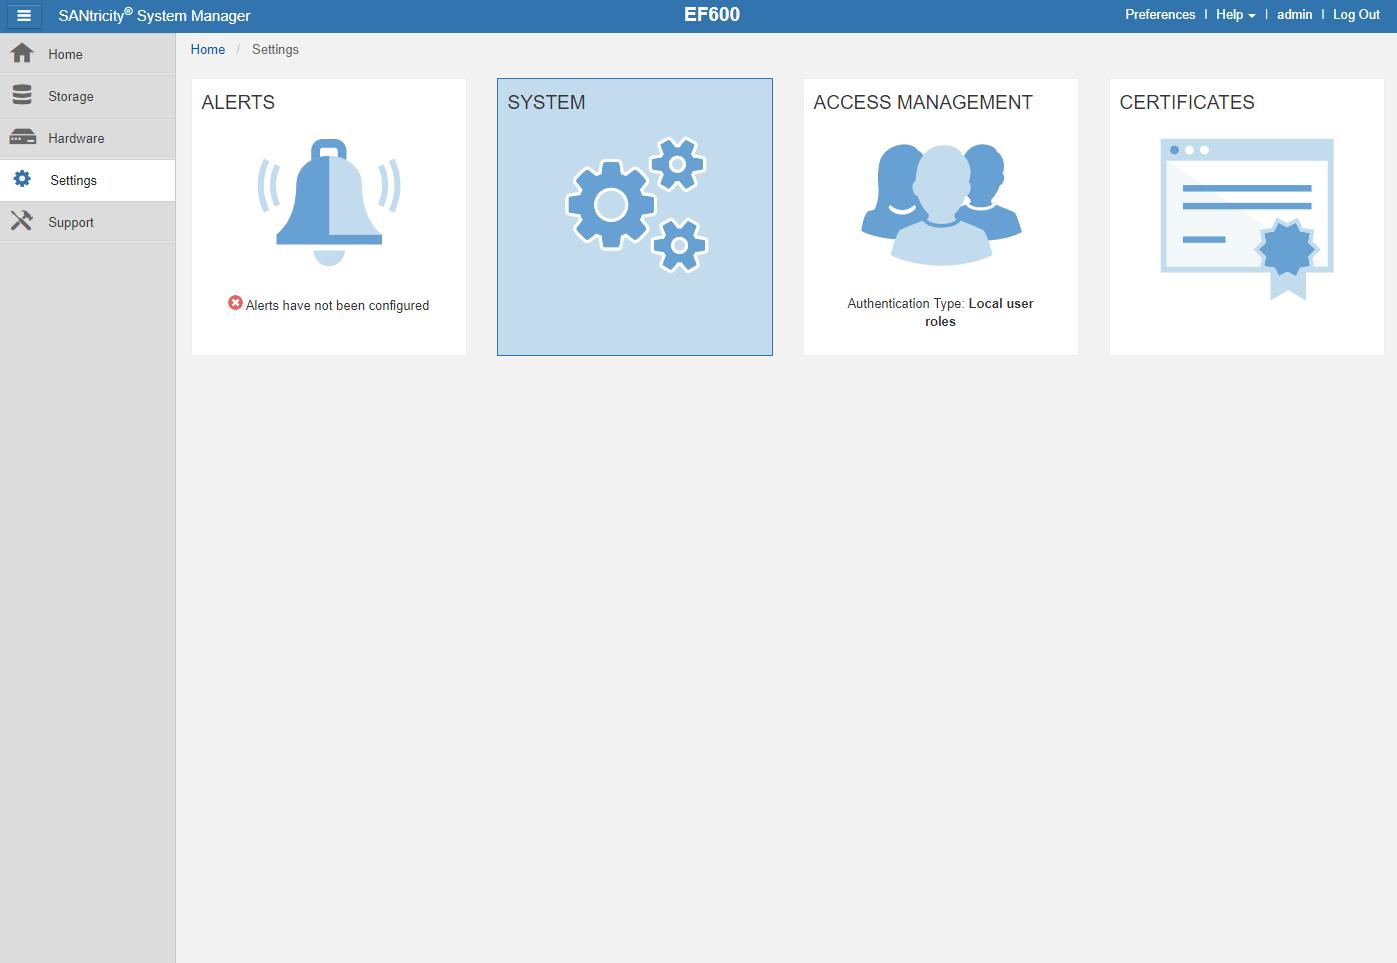
Access Management is where you can establish user authentication in the system. From this area, you can manage passwords, local users, configure permissions, add directory server, and other access management configurations. Authentication methods include RBAC (role-based access control), Directory Services, and Security Assertion Markup Language (SAML) 2.0.
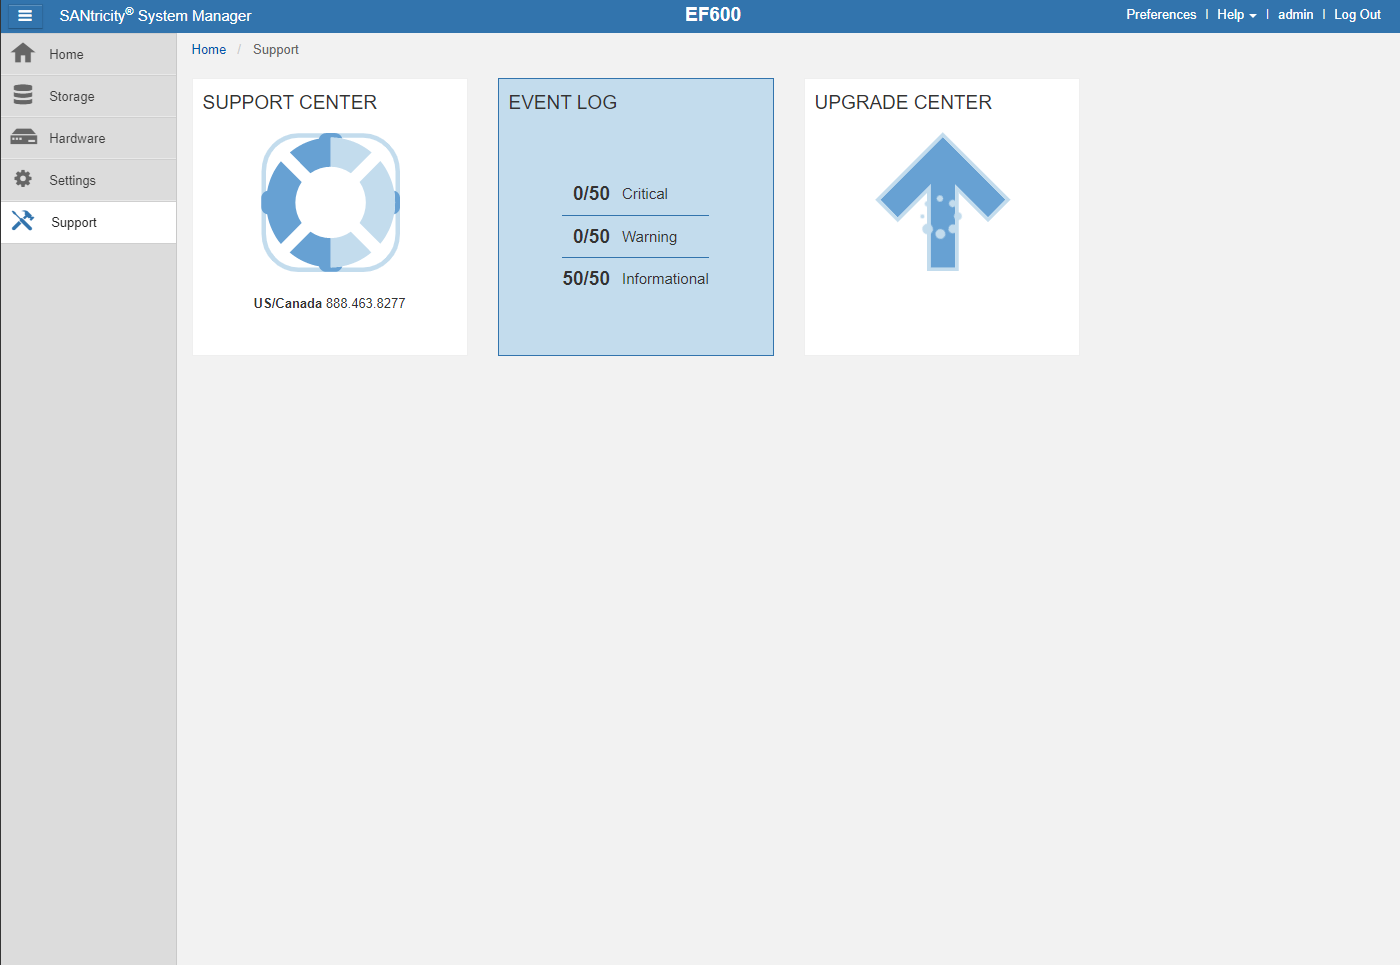
The last tab, the Support one, allows you to perform diagnostic and gather key information that might be requested by technical support; if you are having issues with the storage array. Here you can use the event log to see historical records of the storage array; also carry out system updates.
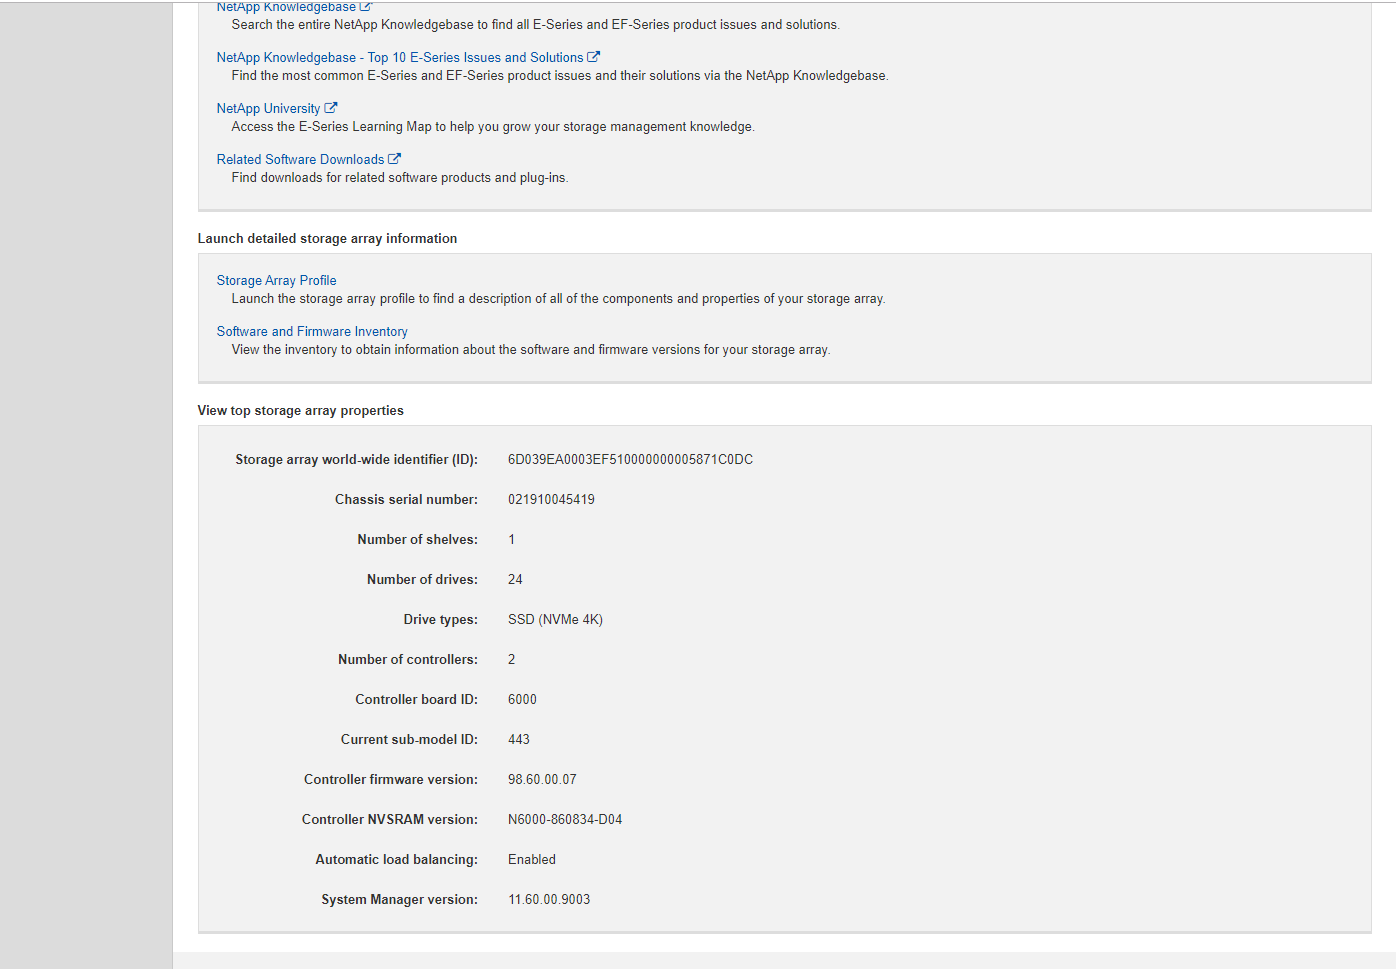
Scrolling-down in the Support Center area, you can look at the top storage array properties, such as storage array world-wide identifier chassis serial number, number of shelves, number of drives, drive type, number of controllers, controller firmware version, system management version, and other system information.
NetApp AFA EF600 Configuration
The NetApp EF600 was supplied with 24 NVMe SSDs, all of which are 1.92TB Samsung models. For storage specifically, we leveraged RAID10 which is commonly used by customers purchasing this storage array. With 24 drives and a two-controller layout, we split them into two volume groups of twelve drives. From those two volume groups, we allocated one volume each for each host (two volumes per host balanced across both controllers) that were 100GB in size. With 12 compute hosts, that gave us a total working dataset size of 24 x 100GB or 2.4TB.
For the back-end connectivity, the EF600 currently supports NVMeoF only, with FCP support coming. The system was supplied with all 32Gb FC optics and for this review we updated our 12 hosts to the latest Emulex 32Gb dual-port HBAs. While we have traditionally tested AFA's in VMware, to benchmark NVMeoF performance we ran with a bare-metal installation of SLES 12 SP4 on each host. We leveraged all 16 32Gb ports (eight per controller) attached to our dual-switch FC fabric powered by Brocade G620 switches. In aggregate, this allowed for a theoretical 512Gb bandwidth from the storage array (64GB/s) where our dual-port 12-host cluster supports 768Gb or 96GB/s peak.
VDBench Workload Analysis
When it comes to benchmarking storage arrays, application testing is best, and synthetic testing comes in second place. While not a perfect representation of actual workloads, synthetic tests do help to baseline storage devices with a repeatability factor that makes it easy to do apples-to-apples comparison between competing solutions. These workloads offer a range of different testing profiles ranging from "four corners" tests, common database transfer size tests, as well as trace captures from different VDI environments. All of these tests leverage the common vdBench workload generator, with a scripting engine to automate and capture results over a large compute testing cluster. This allows us to repeat the same workloads across a wide range of storage devices, including flash arrays and individual storage devices.
Profiles:
- 4K Random Read: 100% Read, 128 threads, 0-120% iorate
- 4K Random Write: 100% Write, 64 threads, 0-120% iorate
- 64K Sequential Read: 100% Read, 16 threads, 0-120% iorate
- 64K Sequential Write: 100% Write, 8 threads, 0-120% iorate
- Synthetic Database: SQL and Oracle
- VDI Full Clone and Linked Clone Traces
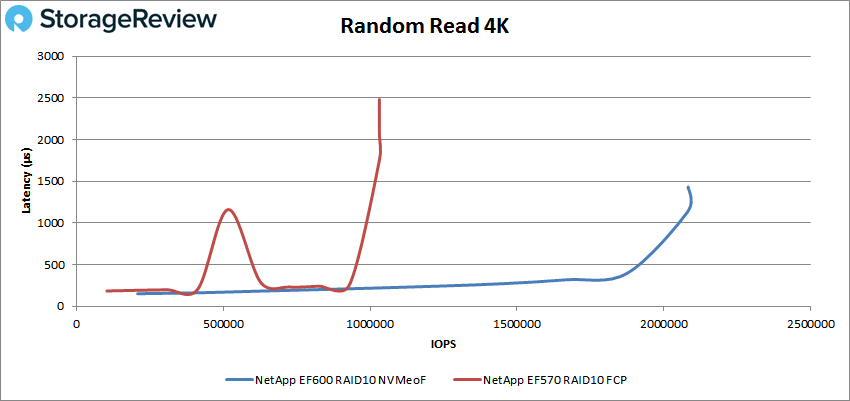
Our VDBench tests were set side by side using the EF600 on NVMeoF and the EF570 on FC. With random 4K read, the EF600 started at 206,592 with a latency of 192.7μs and stayed under 1ms until it reaches about 2,082,389 IOPS; it peaked at 2,082,693 with a latency of 1.4ms. The EF570 started at 103,330 with a latency of 184μs. The EF570 spikes twice, and after the first peak, it stayed under 1ms until hits 929,562 IOPS, then it reaches a maximum of 1,031,613 IOPS with a latency of 2.5ms.
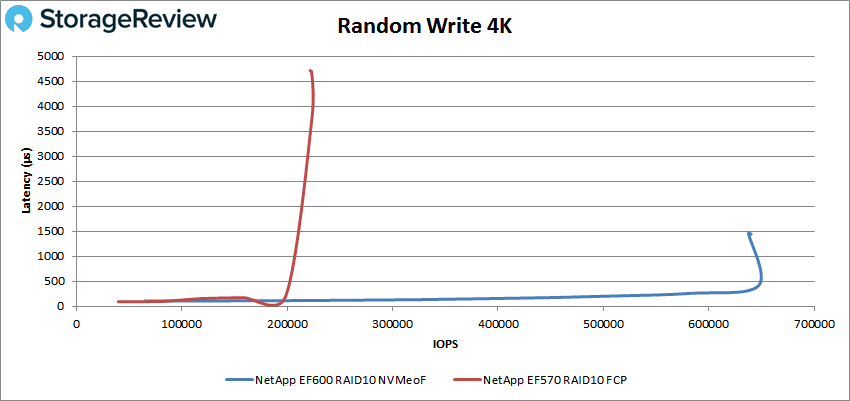
Looking at 4K write performance, again both subsystems started with ultra-low latency, under 100μs. The EF600 performed well under 1ms until about 640,171 IOPS, where the array also hit its peak. This was a marked difference compared to the EF570’s peak performance of 222,416 IOPS with a latency of 4.7ms.
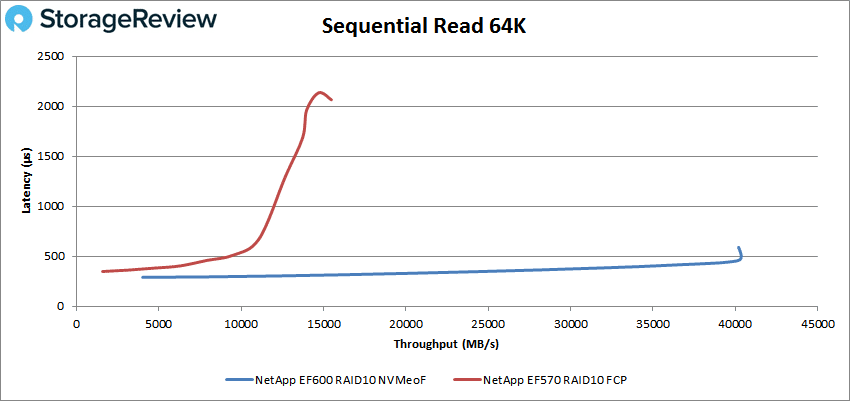
Switching over to sequential workloads, we look at peak 64K read performance, and here the EF600 started under 500μs at 128,713 IOPS or 4GB/s and peaked at 643,152 IOPS or 40.2GB/s with 458μs latency; showing a steady latency over the overall performance. The EF570 also started under 500μs and stayed under 1ms until hits 202,776 IOPS or 12.67GB/s, and then it quickly reached a peak 247,692 IOPS or 15.48GB/s with a latency of 2ms.
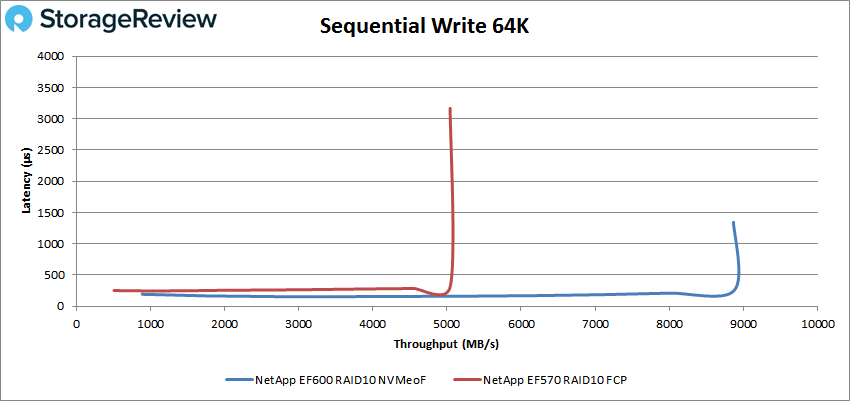
In 64K write, both arrays started with sub-millisecond latency under 250μs and kept a steady latency just before reaching its peak performance. The EF600 peaked at 141,859 IOPS or 8.87GB/s with a latency of 1.3ms. The EF570 performance peaked at 80,675 or 5GB/s at 3.2ms latency.
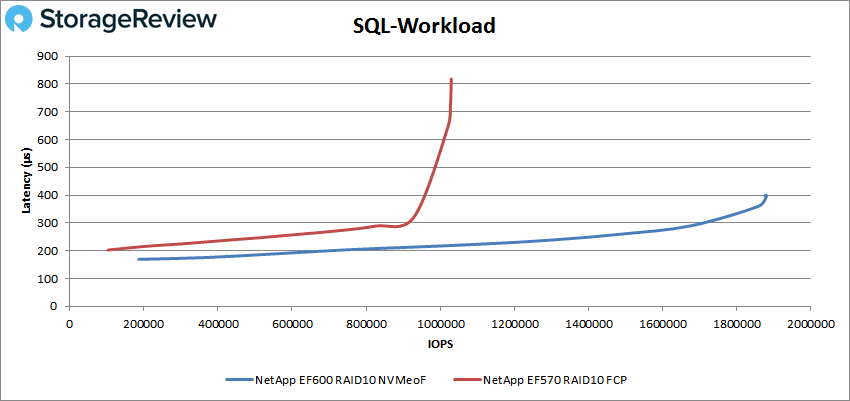
Our next set of tests are our SQL workloads: SQL, SQL 90-10, and SQL 80-20. In the SQL both arrays started below 200μs and stayed under 1ms even after reaching peak performance. With the EF600 we saw a peak at 1,880,526 IOPS at 398μs latency. And the EF570 had a peak at 1,029,910 IOPS with a latency of 818μs.
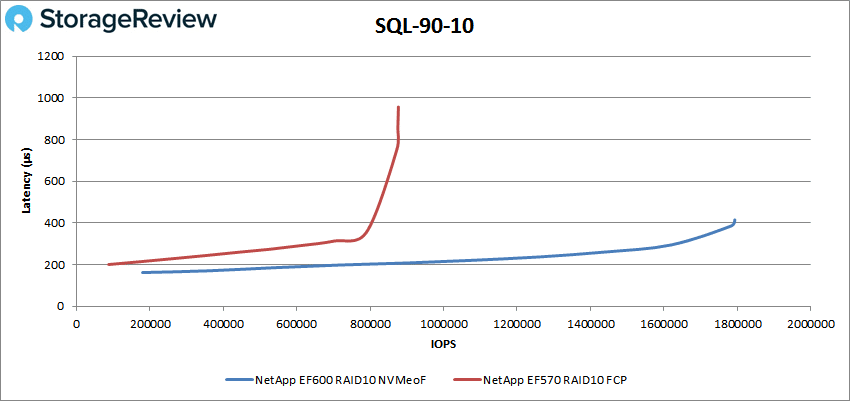
With SQL 90-10, we saw both arrays started and kept performance under 1ms latency. The EF600 peaked at 1,784,866 IOPS with a latency of 387μs, while the EF570 marked only half of EF600’s performance, peaking at 875,340 IOPS at 853μs latency.
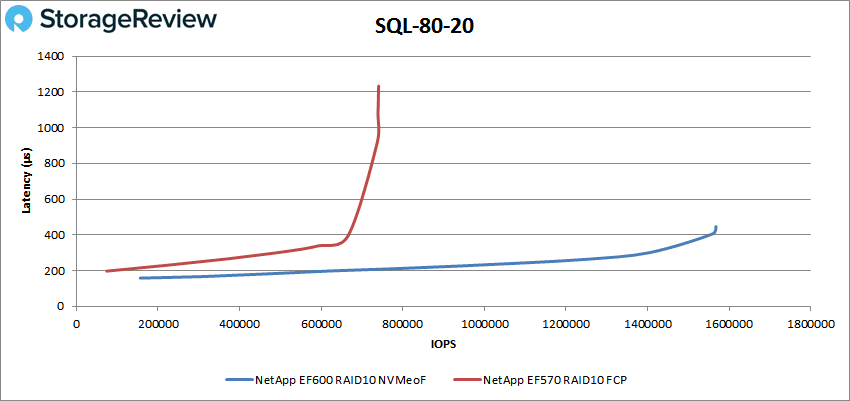
With SQL 80-20, we again saw similar staring point for latency in both arrays, over 200μs. The EF600 started at 156,264 IOPS and peaking at 1,559,733 IOPS with a latency of 406μs. The EF570 started at 73,990 IOPS and went on to peak at 739,139 IOPS with a latency of 1.1ms.
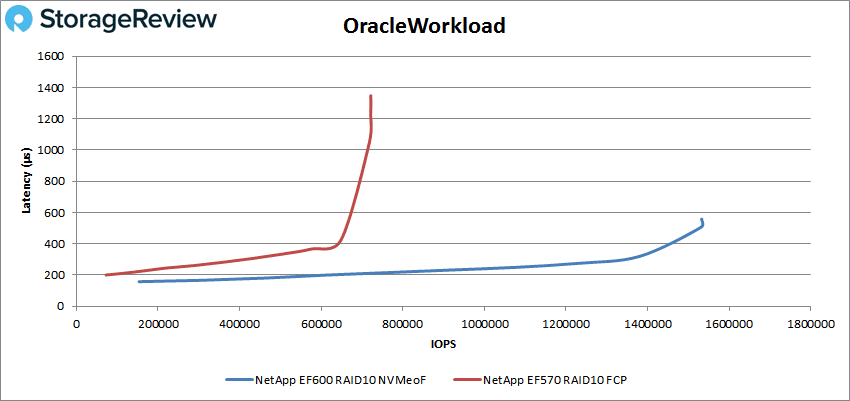
Our next batch of benchmarks are our Oracle workloads: Oracle, Oracle 90-10, and Oracle 80-20. With Oracle, the EF600 started at 153,376 IOPS with 158μs latency and keeping under sub-millisecond latency, going on to peak at 1,531,381 IOPS with a latency of 507μs. This is compared to the EF570’s peak of 718,141 IOPS at 1.2ms latency.
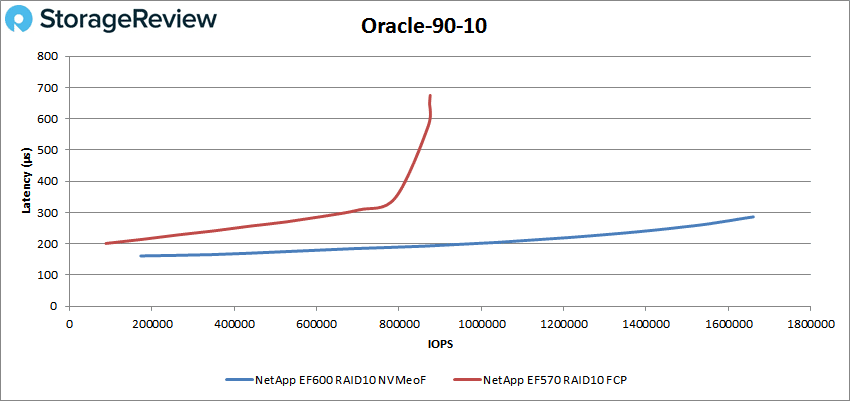
In Oracle 90-10, the EF600 started at 172,788 IOPS at a latency of 161μs and stayed under 1ms during the whole test, and it goes on to peak at 1,660,486 IOPS with a latency of 286μs. The EF570, on the other hand, had a peak performance of 874,181 IOPS with a latency of 650μs.
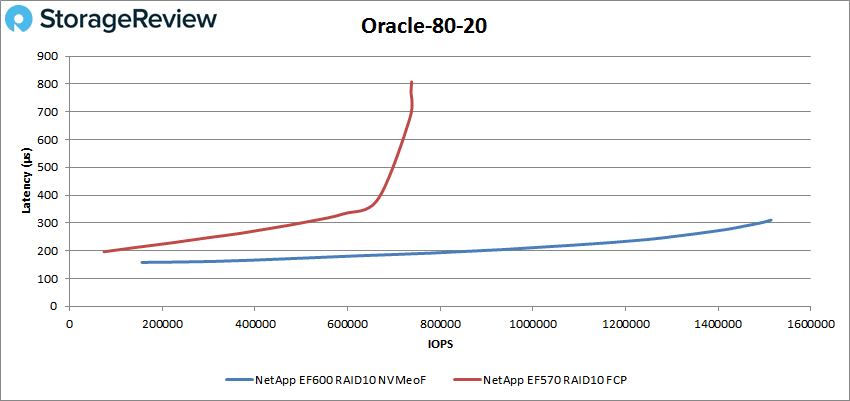
For Oracle 80-20, the EF600 started at 156,113 IOPS at a latency of 158μs staying under sub-millisecond latency up until the end of the test. The EF600 went on to peak at 1,514,221 IOPS with a latency of 310μs. This was about twice the EF570’s 735,093 IOPS with 681μs latency.
Conclusion
The NetApp AFA EF600 is an end-to-end NVMe array aimed at the midrange. The array is only 2U but can pack up to 367TB of capacity in its small frame and quotes performance that would rival much larger enterprise arrays. This includes 2 million IOPS, up to 44GB/s for bandwidth, and latency under 100μs. The array also comes with some built-in futureproofing with the support of 100Gb NVMe over InfiniBand, 100Gb NVMe over RoCE, FCP support, and 32Gb NVMe over FC. Like all NetApp arrays, the EF600 comes with high availability and several built-in data protection capabilities.
Looking at performance, we compared the EF600 running NVMe-oF versus the EF570 over FCP. This wasn’t designed to show which is better, but more to illustrate what one can expect from the two units. For 4K random read the EF600 had over double the peak performance of the EF570 at over 2 million IOPS and nearly half the latency at only 1.4ms. For 4K write the EF600 had nearly 3x the peak performance (640K IOPS) at one-third the latency (about 1.5ms). With our 64K sequential workloads we saw peak performance of 40.2GB/s read and 8.87GB/s write about 2.6x faster on reads and 1.8x faster on writes. For SQL the EF600 had peak scores of 1.88 million IOPS, 1.78 million IOPS for SQL90-10 and 1.56 million IOPS for SQL 80-20 all at sub-millisecond latency. With our Oracle tests the EF600 hit 1.53 million IOPS, 1.66 million IOPS on Oracle 90-10, and 1.51 million IOPS in Oracle 80-20, again all under 1ms latency.
The AFA EF600 is yet another impressive array from NetApp. The EF600 gives midrange users the capacity they need, as well as very high transactional performance with low latency. For customers that don't need the data-reduction or the rich data-services the ONTAP side of the house offers, the EF600 fits the role of offering high-performance for targeted applications that can benefit from the latest NVMe SSD and data transport technologies. Ultimately the EF600 won't be for everyone but that's not the intent, it's clearly not a Swiss Army Knife. NetApp's intent with the EF600 is a litlte more tactical; that is to provide a hardened platform capable of taking applications that tend to fall outside the usual virtualization hot spots, and drive faster time-to-enterprise-value. The EF600 will accelerate AI, ML and database workloads, offering actionable insights to the business faster than ever before in this category of storage. For that performance to price benefit and the reliability this fifth generation EF provides, the EF600 earns the NetApp EF family another StorageReview Editor's Choice Award.
Sign up for the StorageReview newsletter


 Amazon