

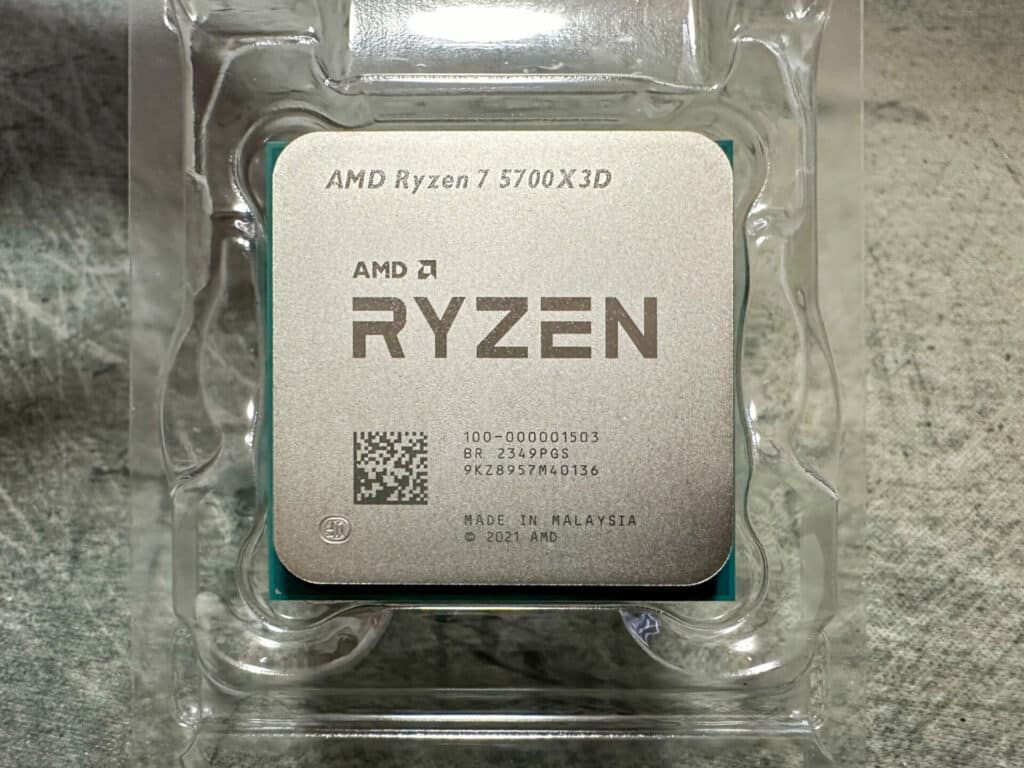
AMD recently released an exciting extension to the life of its AM4 platform with new Ryzen 5000 Series desktop processors. These processors, including the Ryzen 7 5700X3D with its powerful 3D V-Cache technology, are designed to boost gaming performance significantly.
| Model | Cores/Threads | Boost/Base Frequency | Total Cache | TDP | NPU | SEP |
|---|---|---|---|---|---|---|
| AMD Ryzen 7 5700X3D | 8C/16T | Up to 4.1GHz / 3.0GHz | 100MB | 105W | N/A | $249 |
| AMD Ryzen 7 5700 | 8C/16T | Up to 4.6GHz / 3.7GHz | 20MB | 65W | N/A | $175 |
| AMD Ryzen 5 5600GT | 6C/12T | Up to 4.6GHz / 3.6GHz | 19MB | 65W | N/A | $140 |
| AMD Ryzen 5 5500GT | 6C/12T | Up to 4.4GHz / 3.6GHz | 19MB | 65W | N/A | $125 |
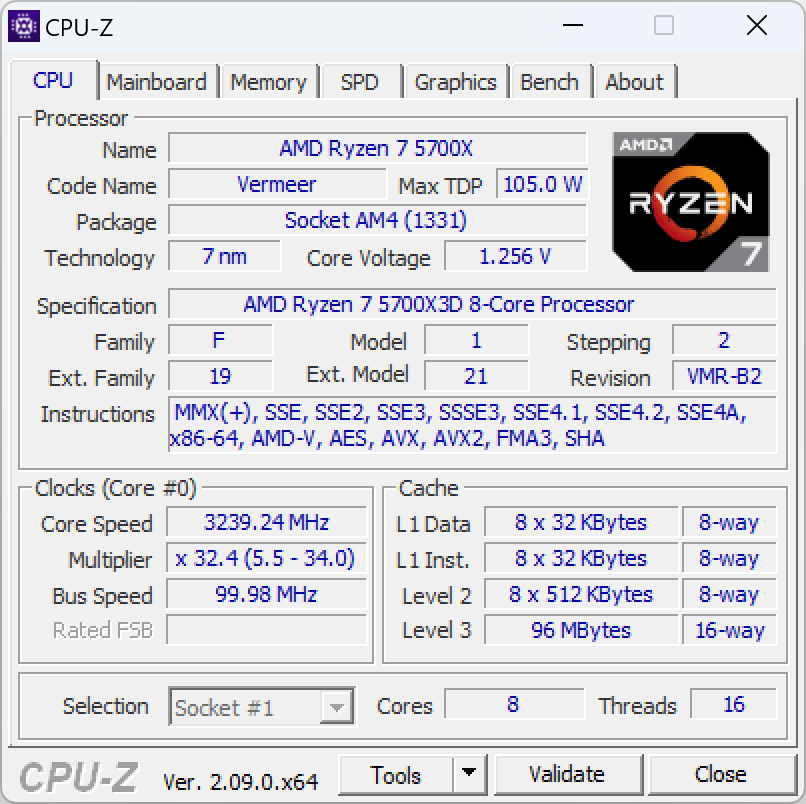
AMD Ryzen 5700x3D Specifications
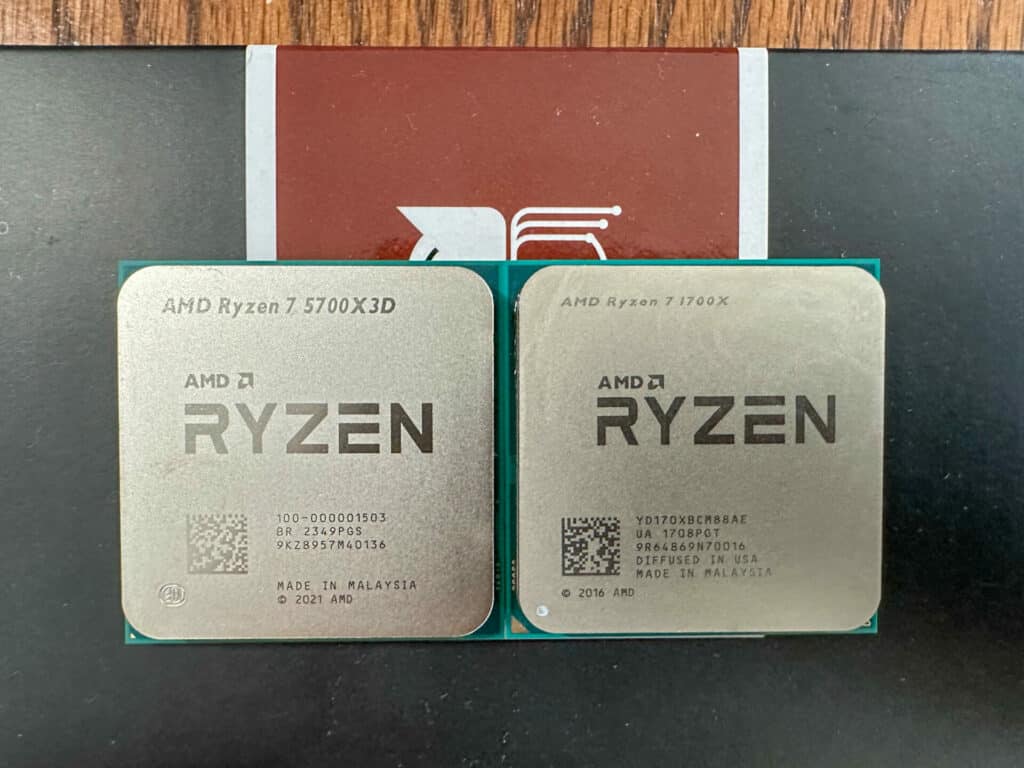
When we mentioned that we had an old AMD 1700x in our Edge Lab, our friends at AMD took matters into their own hands and provided a drop-in upgrade for the platform, the top SKU AMD Ryzen 7 5700x3D. We conducted the standard test suite and included the newly released 8000G APU for comparison.
| Ryzen 7 5700x3D | Ryzen 7 8700G | Ryzen 5 8600G | Ryzen 7 1700X | |
|---|---|---|---|---|
| Architecture | Zen 3 | Zen 4 | Zen 4 | Zen |
| Socket | AM4 | AM5 | AM5 | AM4 |
| CPU Cores | 8 | 8 | 6 | 8 |
| CPU Threads | 16 | 16 | 12 | 16 |
| Base Clock | 3.0GHz | 4.2GHz | 4.2GHz | 3.4GHz |
| Max Boost Clock | Up to 4.1GHz | Up to 5.1GHz | Up to 5.0GHz | Up to 3.8GHz |
| L1 Cache | 512KB | Not Listed | Not Listed | 768KB |
| L2 Cache | 4MB | 8MB | 6MB | 4MB |
| L3 Cache | 96MB | 16MB | 16MB | 16MB |
| Default TDP | 105W | 65W | 65W | 95W |
| AMD Configurable TDP (cTDP) | N/A | 45-65W | 45-65W | N/A |
| Memory Type | DDR4 | DDR5 | DDR5 | DDR4 |
| Memory Channels | 2 | 2 | 2 | 2 |
| Max Memory | Unlisted | 256GB | 256GB | 64GB |
| PCIe Version | PCIe 4.0 | PCIe 4.0 | PCIe 4.0 | PCIe 3.0 |
| PCIe Lanes (Total / Usable) | 24/20 | 20/16 | 20/16 | 20/16 |
| Graphics Model | N/A | Radeon 780M | Radeon 760M | N/A |
| Graphics Core Count | N/A | 12 | 8 | N/A |
| Graphics Frequency | N/A | 2900MHz | 2800MHz | N/A |
| DirectX Version | N/A | 12 | 12 | N/A |
| AI Engine Brand Name | N/A | AMD Ryzen AI | AMD Ryzen AI | N/A |
| AI Engine Performance | N/A | Up to 16 TOPS | Up to 16 TOPS | N/A |
| Launch Date | Q1 2024 | Q1 2024 | Q1 2024 | Q1 2017 |
| Complete Spec Sheets | R7 5700x3D | R7 8700G | R5 8600G | R7 1700X |
Test Platform
Faithfully running as a media server for several years, we had an AM4 platform just begging to be upgraded.
Key Specifications:
- AMD Ryzen 5700x3D(upgraded from 1700x)
- Corsair Vengeance RGB Pro 32Gb DDR4 3600Mhz(ran at 3200Mhz)
- MSI Xx370 Gaming Pro Carbon
- Corsair H110i AIO Liquid Cooler
- Noctua Fans
- Kioxia XG8 2TB m.2 Boot Drive
- Windows 11 Professional (debloated)
All of the tests for the AM4 platform were recorded back to back on the same OS installation, with the only change being the CPU. Default “AI” overclock and maximum stable memory bandwidth were used.
AMD Ryzen 7 5700x3D Performance
Focusing on the generational improvement from Zen to the latest and last Zen3 AM4 platform, we saw some remarkable performance lifts in the test rig. Thanks to the sizeable 100MB of Cache on the CPU, you get some pretty interesting results if your workload can take advantage of it.
3DMark CPU Profile
The 3DMark CPU Profile is a benchmarking tool tailored to gauge CPU performance through a series of custom simulations. This benchmark includes six distinct tests, each employing the same workload but with varying threading capacity. These tests are meticulously designed to challenge the CPU across different threading levels — 1, 2, 4, 8, 16, and up to the maximum available threads of a given system.
| 3DMARK CPU Profile | Ryzen 7 5700x3D | Ryzen 7 8700G w/ Radeon 780M |
Ryzen 5 8600G w/ Radeon 760M |
Ryzen 7 1700X (NVIDIA P6000 GPU) |
|---|---|---|---|---|
| Max Threads | 6,784 | 8,256 | 6,333 | 4,298 |
| 16 Threads | 6,780 | 8,244 | 6,268 | 4,299 |
| 8 Threads | 5,978 | 7,002 | 5,518 | 3,556 |
| 4 Threads | 3,198 | 3,878 | 3,641 | 1,877 |
| 2 Threads | 1,618 | 2,066 | 1,855 | 958 |
| 1 Thread | 862 | 1,044 | 903 | 485 |
3DMark GPU Tests
3DMark Night Raid is a DirectX 12 benchmark tailored for devices with internal graphics, and Fire Strike is a DirectX 11 benchmark designed for gaming PCs. Fire Strike includes two graphics tests, one physics test, and a combined test for the CPU and GPU simultaneously.
| 3DMark Test | Ryzen 7 5700x3D (NVIDIA P6000 GPU) |
Ryzen 7 8700G w/ Radeon 780M |
Ryzen 5 8600G w/ Radeon 760M |
Ryzen 7 1700X (NVIDIA P6000 GPU) |
|---|---|---|---|---|
| Fire Strike Physics | 27,329 | 25,421 | 20,798 | 18,851 |
| Fire Strike GPU | 27,445 | 8,628 | 7,458 | 27,142 |
| Fire Strike Overall | 25,261 | 7,856 | 6,954 | 20,886 |
| Night Raid CPU | 15,175 | 17,550 | 13,873 | 9,591 |
| Night Raid GPU | 114,239 | 35,503 | 30,900 | 64,344 |
| Night Raid Overall | 57,719 | 30,779 | 26,095 | 34,662 |
Geekbench 6
Geekbench 6 is a cross-platform benchmark that measures the performance of a system and provides a score for comparison. It is designed to work on multiple platforms and provides a consistent performance measure across many devices, from smartphones and tablets to desktops and servers.
| Geekbench 6 | Ryzen 7 5700x3D (NVIDIA P6000 GPU) |
Ryzen 7 8700G w/ Radeon 780M |
Ryzen 5 8600G w/ Radeon 760M |
Ryzen 7 1700X (NVIDIA P6000 GPU) |
|---|---|---|---|---|
| Single Core | 2,001 | 2,663 | 2,552 | 1,104 |
| Multi-Core | 10,225 | 14,168 | 11,887 | 5,783 |
| GPU Score | 66,176 | 26,049 | 29,957 *(Vulkan) | 61,871 |
*The 8600G had some issues through our OpenCL tests, which have since been fixed with driver updates. Keep updated with the latest drivers and firmware on your system, and if you build one of these, as usual with any new platform, plan on the first thing being BIOS and driver updates directly from AMD and your motherboard manufacturer and not rely on Windows Update.
Maxon Cinebench
Cinebench is a widely used benchmarking tool that measures the performance of CPUs and GPUs using Maxon Cinema 4D for rendering. It provides a score that can compare the performance of different systems and components. We ran four popular versions of Cinebench so you can compare the results on popular leaderboards online.
| Test | Ryzen 7 5700x3D (NVIDIA P6000 GPU) |
Ryzen 7 8700G | Ryzen 5 8600G | Ryzen 7 1700X (NVIDIA P6000 GPU) |
|---|---|---|---|---|
| Cinebench R15 | ||||
| CPU (Multi Core) | 2,260 | 2,836 | 2,135 | 1,517 |
| CPU (Single Core) | 227 | 292 | 283 | 143 |
| MP Ratio | 9.95 | 9.70x | 7.54x | 10.61x |
| Cinebench R20 | ||||
| CPU | 5,249 | 6,882 | 5,016 | 3,431 |
| Cinebench R23 | ||||
| CPU (Multi Core) | 13,535 | 17,535 | 13,305 | 8,761 |
| CPU (Single Core) | 1,356 | 1,829 | 1,767 | 918 |
| MP Ratio | 9.89 | 9.59x | 7.53x | 9.55x |
| Cinebench 2024 | ||||
| CPU (Multi Core) | 799 | 987 | 770 | 510 |
| CPU (Single Core) | 86 | 109 | 107 | 56 |
| MP Ratio | 9.28 | 9.05x | 7.18x | 9.09x |
y-cruncher
And, of course, our old favorite, y-cruncher 0.8.3.9532, a multi-threaded and scalable program that can compute Pi and other mathematical constants to trillions of digits. Since its launch in 2009, it has become a popular benchmarking and stress-testing application for overclockers and hardware enthusiasts.
It is worth noting here the 8000G Series is more for reference, as this benchmark depends highly on memory bandwidth, and the 5700x3D uses DDR4, the same as the 1700X, while the 8000G series uses much faster DDR5
| y-cruncher Total Computation Time (seconds) (Lower is Better) |
Ryzen 7 5700x3D (NVIDIA P6000 GPU) |
Ryzen 7 8700G | Ryzen 5 8600G | Ryzen 7 1700X (NVIDIA P6000 GPU) |
|---|---|---|---|---|
| 1 Billion | 39.502 | 26.376 | 32.303 | 88.851 |
| 2.5 Billion | 114.119 | 79.157 | 90.525 | 252.187 |
| 5 Billion | 258.047 | 172.172 | 199.562 | 560.745 |
7Zip Compression Benchmark
The popular 7-Zip utility has a built-in memory benchmark demonstrating the CPU’s performance. We run this test at a 128MB dictionary size with ten passes.
| 7-Zip Compression Benchmark (Higher is better) | Ryzen 7 5700x3D (NVIDIA P6000 GPU) |
Ryzen 7 8700G | Ryzen 5 8600G | Ryzen 7 1700X (NVIDIA P6000 GPU) |
|---|---|---|---|---|
| Current CPU Usage | 782% | 548% | 337% | 1,495% |
| Current Rating / Usage | 9.089 GIPS | 15.803 GIPS | 20.427 GIPS | 2.435 GIPS |
| Current Rating | 71.039 GIPS | 85.766 GIPS | 68.792 GIPS | 36.404 GIPS |
| Resulting CPU Usage | 777% | 536% | 331% | 1,496% |
| Resulting Rating / Usage | 9.175 GIPS | 16.003 GIPS | 20.670 GIPS | 2.427 GIPS |
| Resulting Rating | 71.275 GIPS | 85.766 GIPS | 68.431 GIPS | 36.316 GIPS |
| Decompressing | ||||
| Current CPU Usage | 1,597% | 1,576% | 1,178% | 1,574% |
| Current Rating / Usage | 6.267 GIPS | 7.413 GIPS | 7.564 GIPS | 3.932 GIPS |
| Current Rating | 100.103 GIPS | 116.835 GIPS | 89.074 GIPS | 61.897 GIPS |
| Resulting CPU Usage | 1,585% | 1,581% | 1,173% | 1,574% |
| Resulting Rating / Usage | 6.322 GIPS | 7.375 GIPS | 7.548 GIPS | 3.905 GIPS |
| Resulting Rating | 100.214 GIPS | 116.640 GIPS | 88.568 GIPS | 61.473 GIPS |
| Total Rating | ||||
| Total CPU Usage | 1,181% | 1,059% | 752% | 1,535% |
| Total Rating / Usage | 7.749 GIPS | 11.689 GIPS | 14.109 GIPS | 3.166 GIPS |
| Total Rating | 85.744 GIPS | 101.203 GIPS | 78.500 GIPS | 48.894 GIPS |
Blender OptiX
Blender OptiX is an open-source 3D modeling application. This benchmark was run using the Blender Benchmark CLI utility. The score is samples per minute, with higher being better.
| Blender 4.0 CPU Samples Per Minute (Higher is Better) |
Ryzen 7 5700x3D | Ryzen 7 8700G | Ryzen 5 8600G | Ryzen 7 1700X |
|---|---|---|---|---|
| Monster | 90.094 | 111.940 | 79.492 | 59.600 |
| Junkshop | 62.115 | 47.413 | 57.776 | 38.152 |
| Classroom | 45.660 | 57.928 | 41.863 | 30.614 |
Luxmark
Next is LuxMark, an OpenCL GPU benchmarking utility. The APU’s integrated graphics put up some impressive numbers for what it was. Unfortunately, we could not get a clean, valid run on the 8600G.
| Luxmark (Higher is Better) |
Ryzen 7 5700x3D NVIDIA P6000 |
Ryzen 7 8700G w/ Radeon 780M |
Ryzen 5 8600G w/ Radeon 760M |
Ryzen 7 1700X NVIDIA P6000 |
|---|---|---|---|---|
| Food | 2,109 | 749 | N/A | 2,035 |
| Hall Bench | 5,467 | 1,824 | N/A | 5,096 |
SPECviewperf 2020
Our next test is SPECviewperf 2020, the worldwide standard for measuring graphics performance of professional applications under the OpenGL and Direct X application programming interfaces. The viewsets (or benchmarks) represent graphics content and behavior from actual applications without having to install the applications themselves.
| SPECviewperf (Higher is Better) |
Ryzen 7 5700x3D NVIDIA P6000 |
Ryzen 7 8700G w/ Radeon 780M |
Ryzen 5 8600G w/ Radeon 760M |
Ryzen 7 1700X NVIDIA P6000 |
|---|---|---|---|---|
| 3dsmax-07 | 71.68 | 19.22 | 18.09 | 70.79 |
| Catia-06 | 61.77 | 21.27 | 21.76 | 53.06 |
| Creo-03 | 93.06 | 24.71 | 25.82 | 77.2 |
| Energy-03 | 26.06 | 9.47 | 7.1 | 25.94 |
| Maya-06 | 186.74 | 40.93 | 35.37 | N/A |
| Medical-03 | 42.08 | 10.34 | 7.05 | 42.32 |
| Snx-04 | 318.32 | 55.76 | 47.18 | N/A |
| Solidworks-05 | 94.82 | 22 | 18.57 | 94.69 |
Blackmagic RAW
The last test, the Blackmagic RAW speed test, tested the decoding speed of Blackmagic RAW frames.
| Blackmagic RAW (Higher is Better) |
Ryzen 7 5700x3D NVIDIA P6000 |
Ryzen 7 8700G w/ Radeon 780M |
Ryzen 5 8600G w/ Radeon 760M |
Ryzen 7 1700X NVIDIA P6000 |
|---|---|---|---|---|
| 8K CPU | 45 FPS | 57 FPS | 45 FPS | 21 FPS |
Conclusion
AMD continues to impress, releasing a CPU in 2024 for a platform released in 2016. But if you have been keeping up with GPU upgrades and have a decent platform already built on the aging AM4 platform, for $250, and performance on par with the 8600G in non-memory bound tasks, you can get a worthy upgrade to bring relevance back to the build.
We could see a clear performance increase demonstrated across the test suite. It was straightforward to make the change; a simple BIOS update and some fresh thermal paste was all it took. We will also be doing some additional testing on this platform to put it into homelab service, so stay tuned on our YouTube for that.


 Amazon