

The Dell EMC PowerEdge R740xd was released a bit over three years ago when the company upgraded its PowerEdge server line from Broadwell to Xeon SP. The R740xd was an offshoot of the R740, an “extreme disk” version with more storage options. We reviewed the Dell EMC PowerEdge R740xd and liked it quite a bit. In fact, we gave it our Editor’s Choice award and we use a group of eight as the backbone of nearly all our enterprise tests. Fast forward to last year and the dawn of the 2nd Gen Intel Xeon Scalable CPU. We also upgraded our labs R740xd with the new processors and explained it in detail here. Today we are going to look at some more of the NVMe storage options that can be used with this upgraded R740xd server.
Like all things PowerEdge, the R740xd is highly configurable. On the NVMe side there are several options. First up is the front bays. Depending on how the server was configured at purchase, users can use all of the front bays for 2.5” NVMe SSDs. For maximizing bandwidth, users can configure the front bays to be 12 NVMe SSDs and 12 SAS SSDs. In groups of 4, the NVMe SSDs can be mapped to one of the CPUs through PCI Extender cards. If max NVMe storage capacity on the front is more your thing, all 24 bays can be filled with NVMe SSDs mapping 12 each to PCIe switches to allow the system to overprovision PCIe lanes to more NVMe drives while persevering I/O slots, therefore enabling low latency CPU access to twelve devices per CPU.
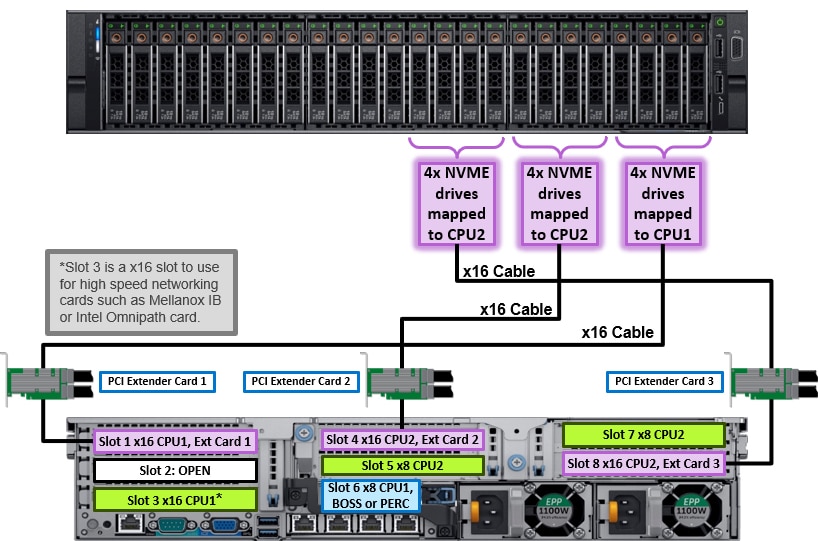
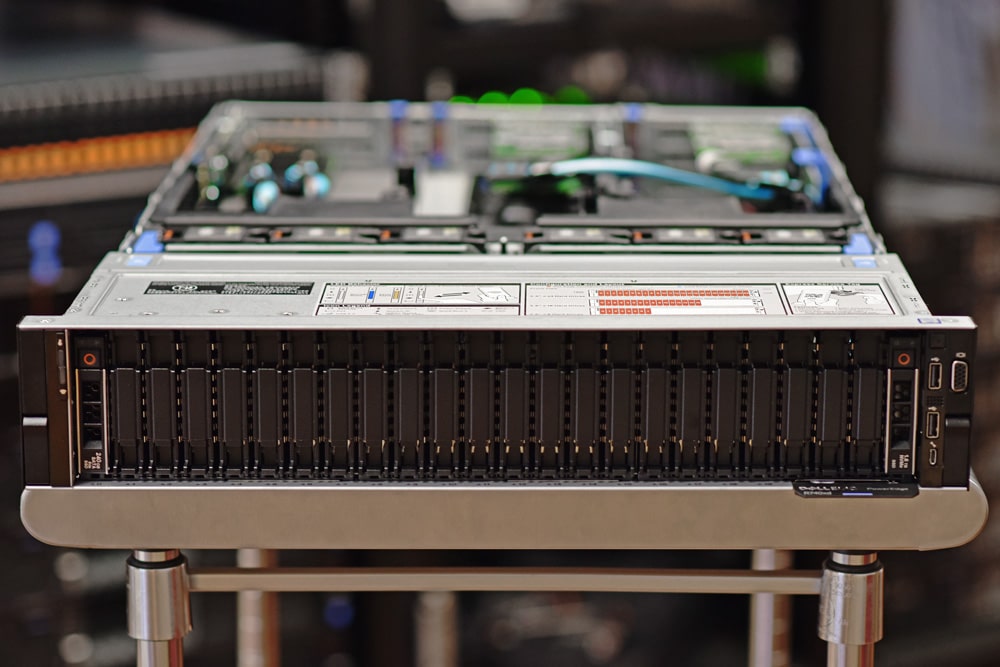
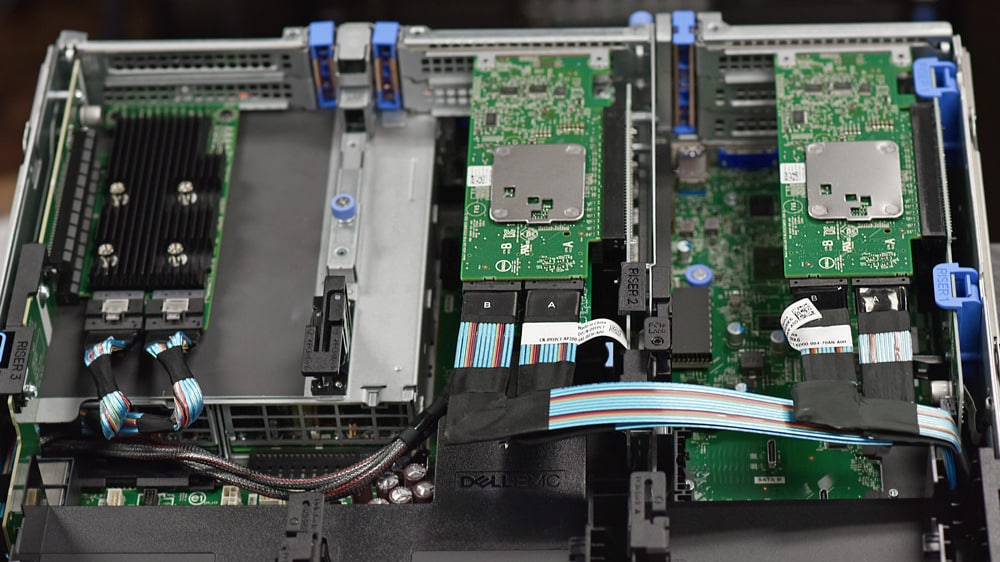
For this review we are essentially looking at a build configured in the first option above. We loaded 12 Micron 9300 NVMe (3.84TB) SSDs in the front bays. This uses three PCIe bridge cards in three of the rear slots. While this will give us better storage performance it will take away some options like adding GPUs, FPGAs, or even more storage in the back. Dell has provided the above graphic to give readers a better visualization of how they laid it out.
Dell EMC PowerEdge R740xd Server Specifications
| Processor | Up to two 2nd Generation Intel Xeon Scalable processors with up to 28 cores per processor |
| Form Factor | 2U Rack Server |
| Operating System | Canonical Ubuntu Server LTS Citrix Hypervisor Microsoft Windows Server with Hyper-V Red Hat Enterprise Linux SUSE Linux Enterprise Server VMware ESXi |
| Dimensions & Weight | Height 86.8m (3.4”) Width 434mm (17.1″) Depth 737.5mm (29.0″) Weight 33.1kg (73.0lbs.) |
| Memory | |
| DIMM Speed | Up to 2933MT/s |
| Memory Type | RDIMM LRDIMM NVDIMM DCPMM (Intel Optane DC persistent memory) |
| Memory Module Slots | 24 DDR4 DIMM slots (12 NVDIMM or 12 DCPMM only) Supports registered ECC DDR4 DIMMs only |
| Maximum RAM | RDIMM 1.53TB LRDIMM 3TB NVDIMM 192GB DCPMM 6.14TB (7.68TB with LRDIMM) |
| Management | |
| Embedded / At-the-Server | iDRAC9 iDRAC RESTful API with Redfish iDRAC Direct Quick Sync 2 BLE/wireless module |
| Consoles | OpenManage Enterprise OpenManage Power Center |
| Mobility | OpenManage Mobile |
| Tools | Dell EMC RACADM CLI Dell EMC Repository Manager Dell EMC System Update Dell EMC Server Update Utility Dell EMC Update Catalogs iDRAC Service Module OpenManage Server Administrator OpenManage Storage Services |
| OpenManage Integrations | BMC Truesight Microsoft System Center RedHat Ansible Modules VMware vCenter |
| OpenManage Connections | IBM Tivoli Netcool/OMNIbus IBM Tivoli Network Manager IP Edition Micro Focus Operations Manager I Nagios Core Nagios XI |
| Ports | |
| Network Options | 4 x 1GbE 2 x 10GbE + 2 x 1bGE 4 x 10GbE 2 x 25GbE |
| Front Ports | 1 x Dedicated iDRAC direct USB 2 x USB 2.0 1 x USB 3.0 (optional) 1 x VGA |
| Rear Ports | 1 x Dedicated iDRAC network port 1 x Serial 2 x USB 3.0 1 x VGA |
| Storage Controllers | Internal Controllers: PERC H330, H730P, H740P, HBA330 External Controllers (RAID): H840, 12 Gbps SAS HBA Software RAID: S140 Internal Boot: Boot Optimized Storage Subsystem (BOSS): HWRAID 2 x M.2 SSDs 240GB, 480 GB Internal Dual SD Module |
| Accelerators | Up to three 300W or six 150W GPUs Up to three double-wide FPGAs or four single-wide FPGAs GPU and FPGA options available only on 24 x 2.5” drive chassis. Up to two GPUs are supported on NVMe configurations. |
| Storage | |
| Front Bays | Up to 24 x 2.5” SAS/SSD/NVMe, max 184TB Up to 12 x 3.5” SAS, max 192TB |
| Mid Bay | Up to 4 x 3.5” SAS, max 64TB Up to 4 x 2.5” SAS/SSD, max 30.72TB |
| Rear Bays | Up to 4 x 2.5” SAS/SSD, max 30.72TB Up to 2 x 3.5” SAS, max 32TB |
| Security | Cryptographically signed firmware Secure Boot Secure Erase Silicon Root of Trust System Lockdown (requires OpenManage Enterprise) TPM 1.2/2.0, TCM 2.0 optional |
| Power Supplies | 495W Platinum 750W Platinum 750W Titanium 750W 240VDC 1100W Platinum 1100W 380VDC 1600W Platinum 2000W Platinum 2400W Platinum 1100W -48VDC Gold Hot plug power supplies with full redundancy option Up to 6 hot plugs fans with full redundancy |
| Slots | |
| PCIe | 8 x Gen3 slots (4 x 16) |
| Video Card | 1 x VGA |
Configuration for this review
- CPU 2 x Intel Scalable Platinum 8280
- DRAM 12 x 32GB DDR4-2933MHz
- Storage 12 x Micron 9300 3.84TB U.2 NVMe SSDs
Performance
SQL Server Performance
StorageReview’s Microsoft SQL Server OLTP testing protocol employs the current draft of the Transaction Processing Performance Council’s Benchmark C (TPC-C), an online transaction processing benchmark that simulates the activities found in complex application environments. The TPC-C benchmark comes closer than synthetic performance benchmarks to gauging the performance strengths and bottlenecks of storage infrastructure in database environments.
Each SQL Server VM is configured with two vDisks: 100GB volume for boot and a 500GB volume for the database and log files. From a system resource perspective, we configured each VM with 16 vCPUs, 64GB of DRAM and leveraged the LSI Logic SAS SCSI controller. While our Sysbench workloads tested previously saturated the platform in both storage I/O and capacity, the SQL test looks for latency performance.
This test uses SQL Server 2014 running on Windows Server 2012 R2 guest VMs, and is stressed by Dell’s Benchmark Factory for Databases. While our traditional usage of this benchmark has been to test large 3,000-scale databases on local or shared storage, in this iteration we focus on spreading out four 1,500-scale databases evenly across our servers.
SQL Server Testing Configuration (per VM)
- Windows Server 2012 R2
- Storage Footprint: 600GB allocated, 500GB used
- SQL Server 2014
-
- Database Size: 1,500 scale
- Virtual Client Load: 15,000
- RAM Buffer: 48GB
- Test Length: 3 hours
- 2.5 hours preconditioning
- 30 minutes sample period
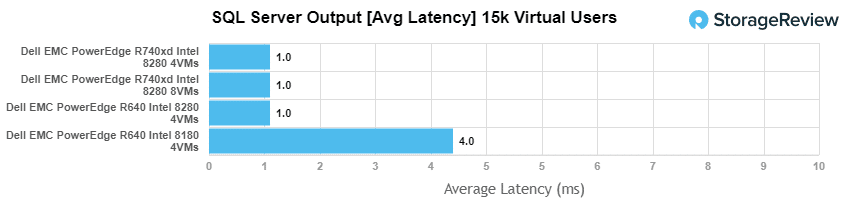
For our SQL Server benchmark we only looked at average latency this time, for the Intel Xeon Scalable 8280s the server had an aggregate score of 1ms and individual VMs all hitting 1ms. This means the Dell EMC PowerEdge R740xd with the NVMe hit the best possible score for this particular test. With the 8180 we saw an aggregate of 4ms.
Sysbench MySQL Performance
Our first local-storage application benchmark consists of a Percona MySQL OLTP database measured via SysBench. This test measures average TPS (Transactions Per Second), average latency, and average 99th percentile latency as well.
Each Sysbench VM is configured with three vDisks: one for boot (~92GB), one with the pre-built database (~447GB), and the third for the database under test (270GB). From a system resource perspective, we configured each VM with 16 vCPUs, 60GB of DRAM and leveraged the LSI Logic SAS SCSI controller.
Sysbench Testing Configuration (per VM)
- CentOS 6.3 64-bit
- Percona XtraDB 5.5.30-rel30.1
-
- Database Tables: 100
- Database Size: 10,000,000
- Database Threads: 32
- RAM Buffer: 24GB
- Test Length: 3 hours
- 2 hours preconditioning 32 threads
- 1 hour 32 threads
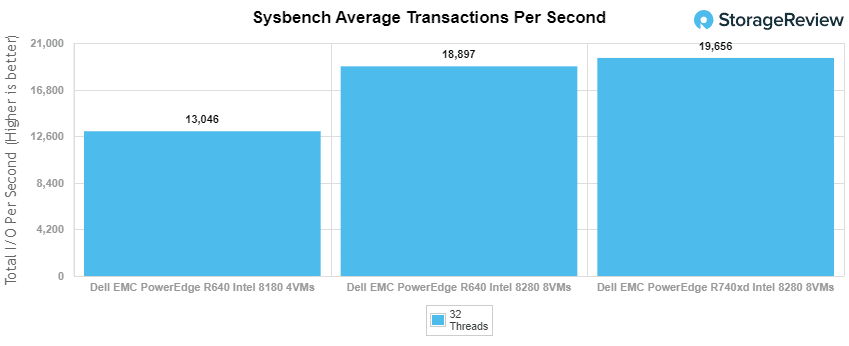
With the Sysbench OLTP we tested Intel Xeon Scalable 8280 with 4 NVMe SSDs with 8VMs in the R640 (for an aggregate score of 18,897 TPS) and with 8 NVMe SSDs with 8VMs in the R740xd (for an aggregate score of 19,656 TPS). We also tested the Intel Xeon Scalable 8180 with 4 NVMe SSDs and 4VMs for an aggregate score of 13,046 TPS.
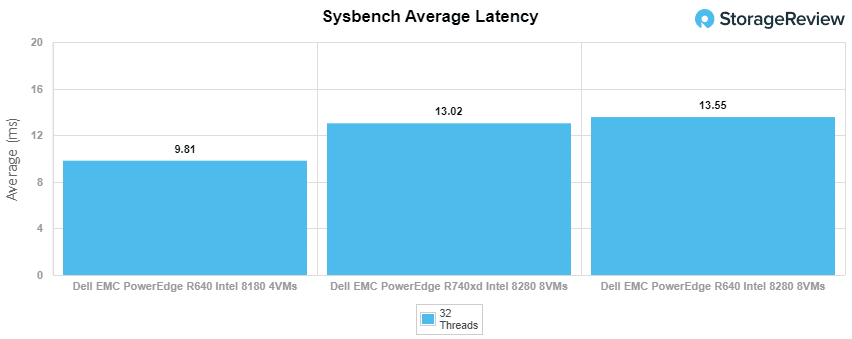
With average latency the R640 4 NVMe 8VM hit an aggregate latency of 13.55ms. For the R740xd 8 NVMe 8VM it hit an aggregate latency of 13.02ms. The R640 4 NVMe 4VM had an aggregate latency of 9.81ms.
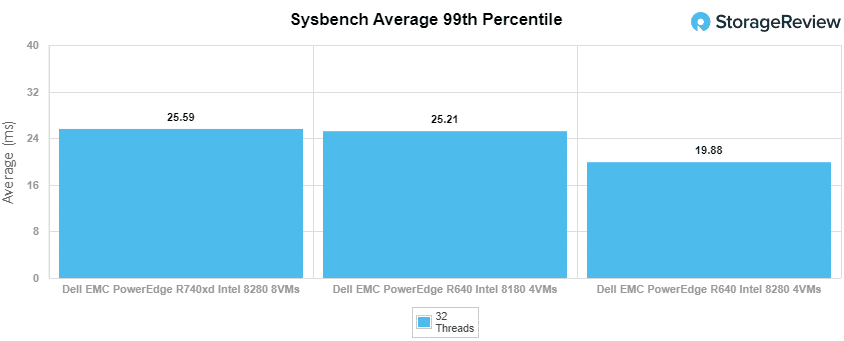
For our worst-case scenario latency (99th percentile) the R640 4 NVMe 8VM hit an aggregate latency of 25.2ms. For the R740xd 8 NVMe 8VM it hit an aggregate latency of 25.6ms. And the R640 4 NVMe 4VM had an aggregate latency of 19.9ms.
VDBench Workload Analysis
When it comes to benchmarking storage arrays, application testing is best, and synthetic testing comes in second place. While not a perfect representation of actual workloads, synthetic tests do help to baseline storage devices with a repeatability factor that makes it easy to do apples-to-apples comparison between competing solutions. These workloads offer a range of different testing profiles ranging from “four corners” tests, common database transfer size tests, as well as trace captures from different VDI environments. All of these tests leverage the common vdBench workload generator, with a scripting engine to automate and capture results over a large compute testing cluster. This allows us to repeat the same workloads across a wide range of storage devices, including flash arrays and individual storage devices.
Profiles:
- 4K Random Read: 100% Read, 128 threads, 0-120% iorate
- 4K Random Write: 100% Write, 64 threads, 0-120% iorate
- 64K Sequential Read: 100% Read, 16 threads, 0-120% iorate
- 64K Sequential Write: 100% Write, 8 threads, 0-120% iorate
- Synthetic Database: SQL and Oracle
- VDI Full Clone and Linked Clone Traces
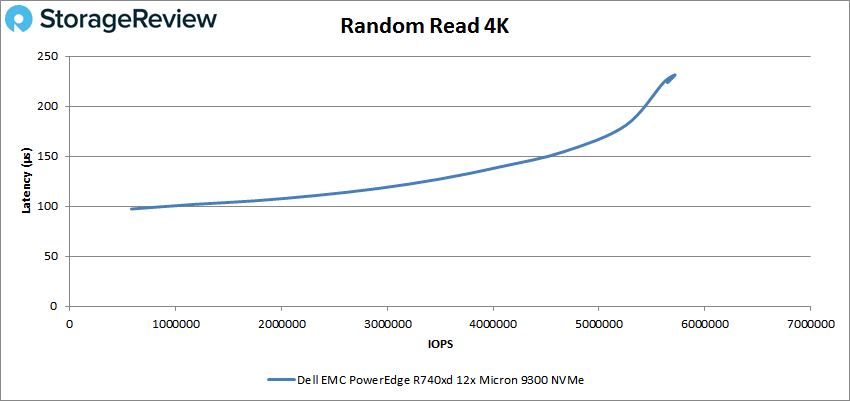
With random 4K read, the R740xd started strong with 583,280 IOPS at 97.3µs and went on to peak at 5,718,018 IOPS at a latency of only 231.4µs.
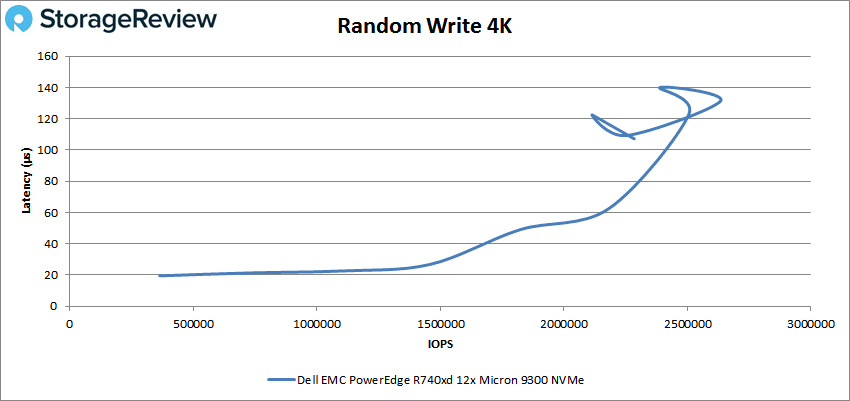
4K random write had the server start at 364,364 IOPS at only 19.5µs. The latency stayed below 100µs until near peak, which was 2,635,495 IOPS at a latency of 131.5µs before dropping off some.
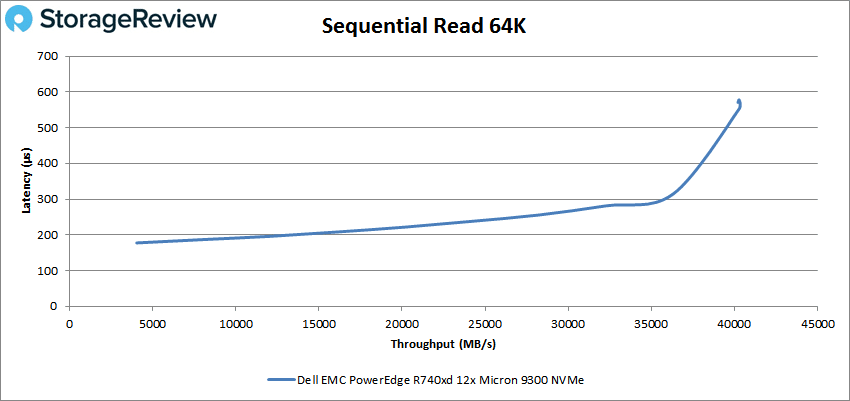
Next up is sequential workloads where we looked at 64k. For 64K read the R740xd peaked at 644,539 IOPS or 40.3GB/s at a latency of 552.8µs.
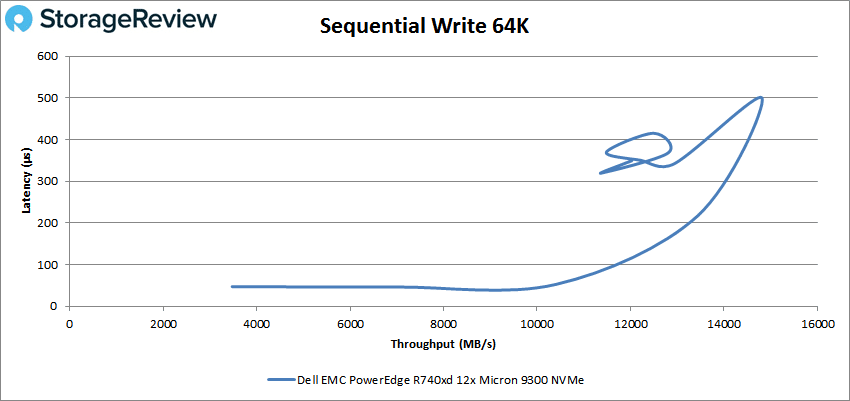
64K sequential write saw the server start at 55,601 IOPS or 3.5GB/s at a latency of 47.4µs before going on to peak at 236,987 IOPS or 14.8GB/s at a latency of 499.6µs before once again dropping off some.
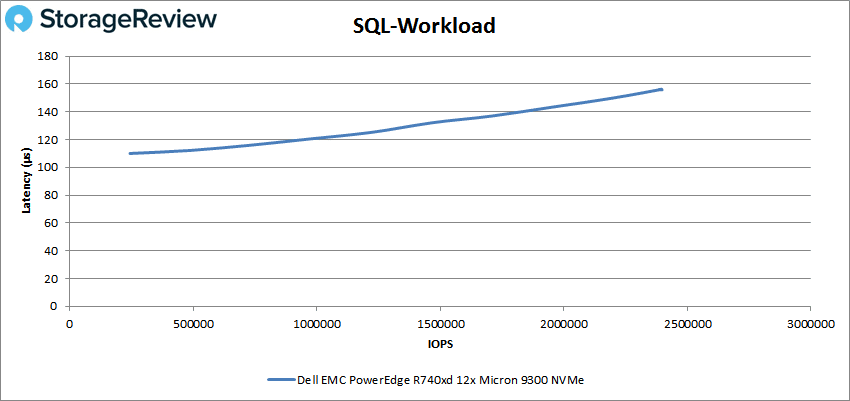
Our next set of tests are our SQL workloads: SQL, SQL 90-10, and SQL 80-20. Starting with SQL, the server peaked at 2,397,926 IOPS at a latency of 155.8µs.
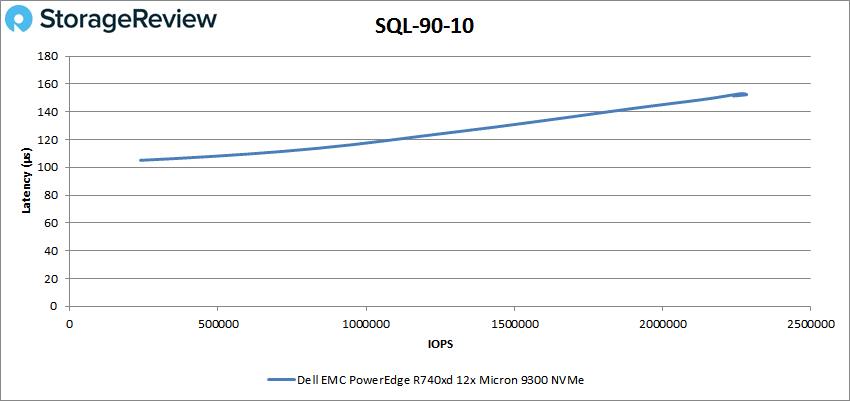
For SQL 90-10 the R740xd hit a peak of 2,283,529 IOPS at a latency of 152.4µs.
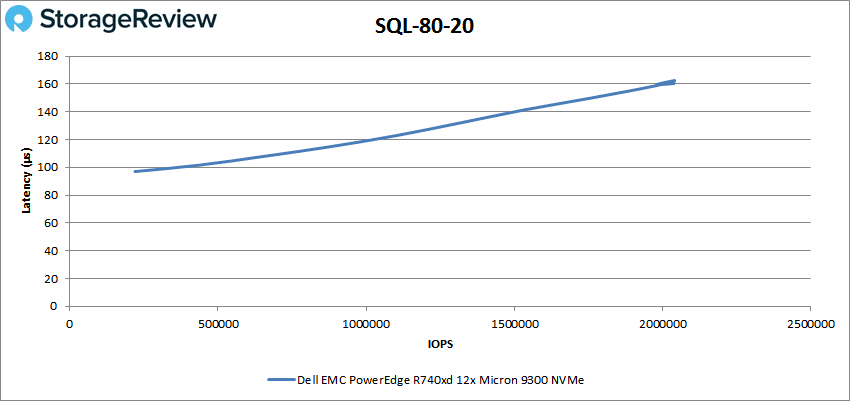
With SQL 80-20 the Dell server peaked at 2,038,981 IOPS with a latency of 160.4µs.
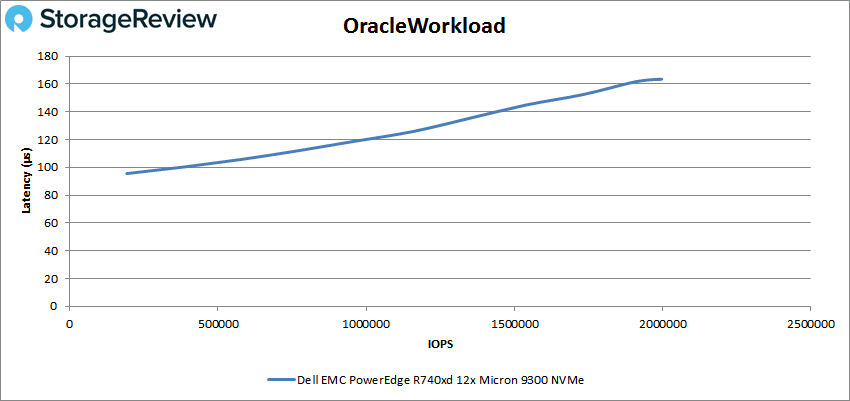
Next up are our Oracle workloads: Oracle, Oracle 90-10, and Oracle 80-20. Starting with Oracle, the server started under 100µs and went on to peak at 1,955,923 IOPS at a latency of 163.5µs.
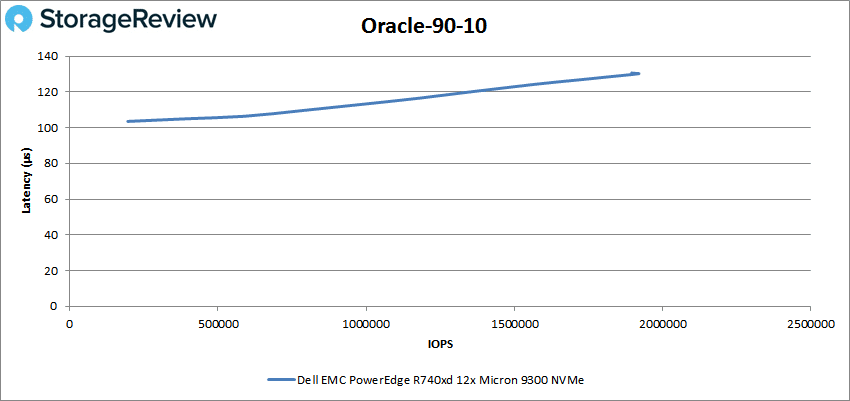
Oracle 90-10 saw a peak of 1,918,464 IOPS at a latency of 130.2µs.
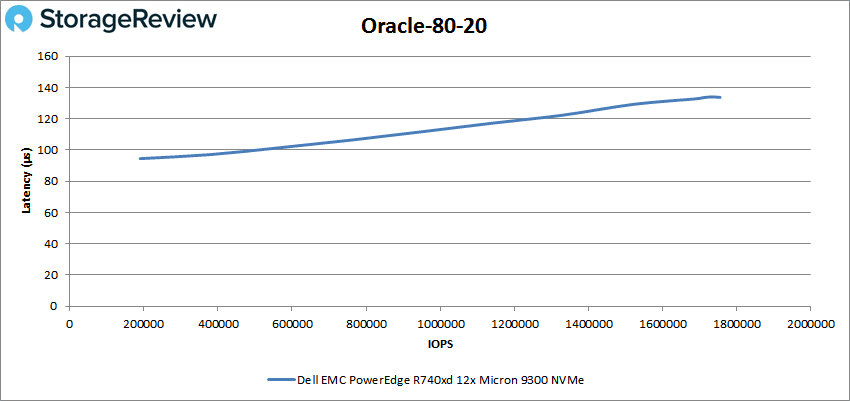
Next is Oracle 80-20 where the R740xd once again started with sub-100µs latency and peaked at 1,755,168 IOPS at a latency of 133.7µs.
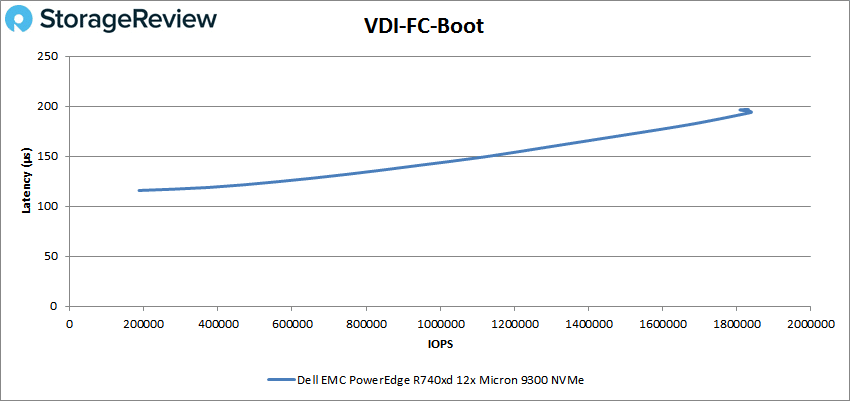
Next, we switched over to our VDI clone test, Full and Linked. For VDI Full Clone (FC) Boot, the Dell EMC PowerEdge R740xd peaked at 1,839,481 IOPS at a latency of 193.9µs.
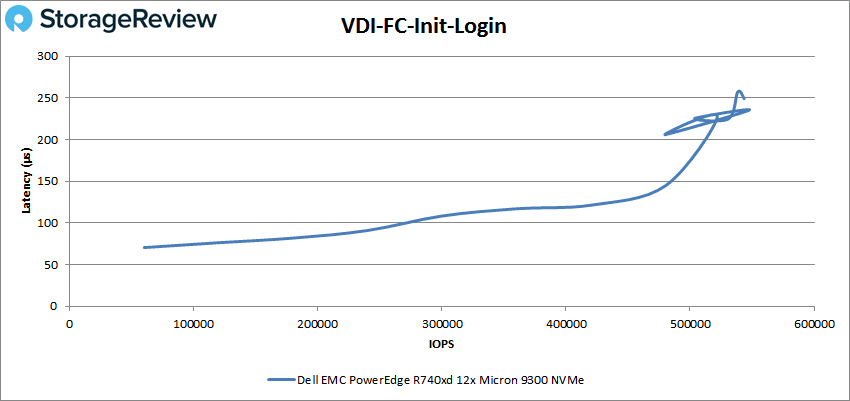
VDI FC Initial Login saw the server start below 100µs and go on to peak at 547,765 IOPS with a latency of 235.5µs.
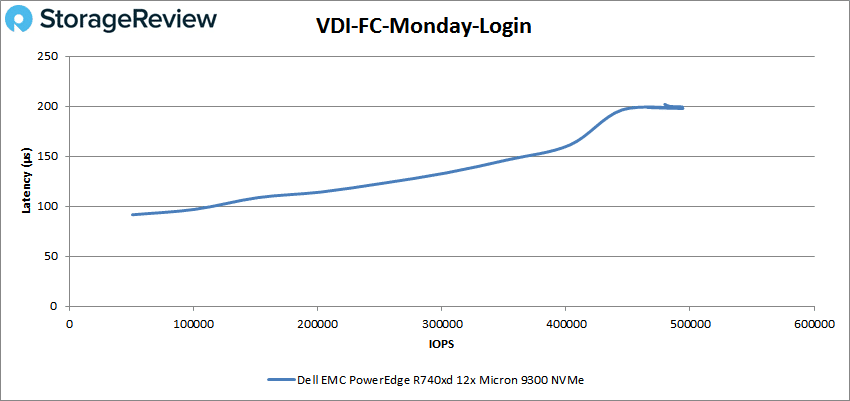
For VDI FC Monday Login the R740xd hit a peak of 493,984 IOPS at a latency of 197.7µs.
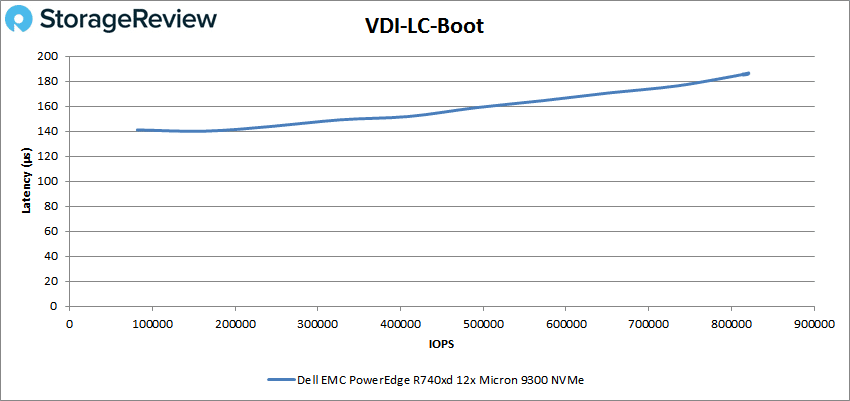
Switching to VDI Linked Clone (LC) Boot, the Dell server hit a peak of 820,857 IOPS with a latency of 185.6µs.
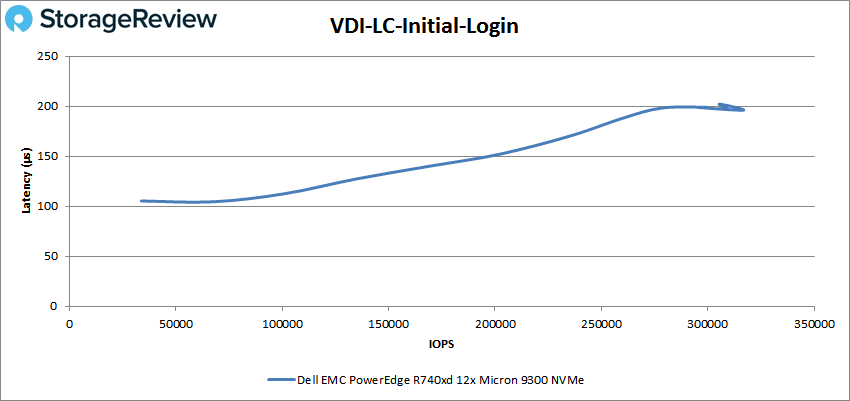
VDI LC Initial Login saw a peak of 316,762 IOPS with a latency of 196.1µs.
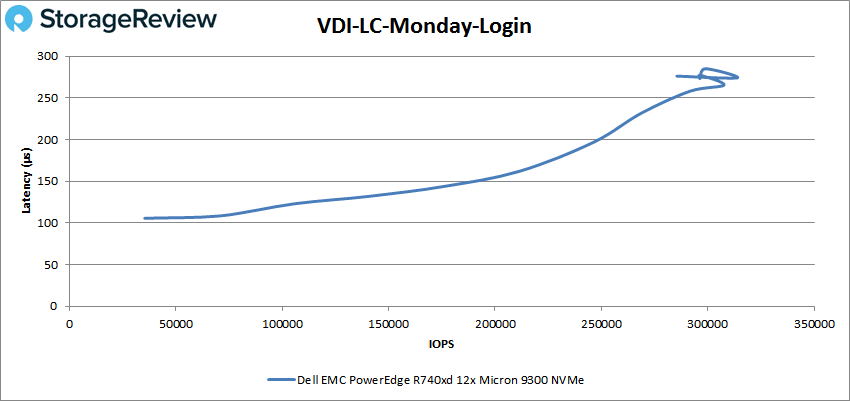
Finally, with VDI LC Monday Login had the R740xd peak at 313,815 IOPS with 274.1µs for latency.
Conclusion
For several years, the Dell EMC PowerEdge R740xd has been the backbone of several of our benchmarks. One of the largest benefits of the PowerEdge line is the configurability. In this review we look at the half NVMe configuration offered of the R740xd, equipped with 12 SATA/SAS bays and 12 NVMe bays.
In our Application Workload Analysis we tested both the Intel Xeon Scalable 8280 and 8180. For the 8280 we tested both 8 and 4 NVMe SSDs with 8VMs and 4VMs and with the 8180 we tested 4 NVMe SSDs and 4VMs. In SQL Server we just looked at latency and it was 1ms across the board for the 8280, the best score any server can get in this test. For Sysbench for the 8280 8 NVMe 8VM we saw 18,897 TPS, 13.56ms average latency and 25.2ms worse-case latency. The 8280 8 NVMe 4VM we saw 19,656 TPS, 13.02ms average latency and 25.6ms worse-case latency. And the 8180 we was 13,046 TPS, 9.81ms average latency and 19.9ms worse-case latency.
Moving on to VDbench the R740xd with NVMe was incredibly impressive. Highlights include 5.7 million IOPS for 4K read, 2.6 million IOPS for 4K write, 40.3GB/s for 64K read, and 14.8GB/s for 64K write. With SQL we saw 2.4 million IOPS, 2.3 million IOPS for SQL 90-10, and 2 million IOPS for SQL 80-20. For Oracle we saw peaks of 1.96 million IOPS, 1.9 million IOPS for Oracle 90-10, and 1.76 million IOPS for Oracle 80-20. In our VDI clone we saw 1.8 million IOPS in VDI FC boot, and then saw the performance drop below the million IOPS mark with VDI FC Initial Login of 548K IOPS, VDI FC Monday Login of 494K IOPS, VDI LC boot of 821K IOPS, VDI LC Initial Login of 317K IOPS and VDI LC Monday Login of 314K IOPS.
The highly-flexible Dell EMC PowerEdge R740xd with 12 NVMe bays had very impressive results. We saw IOPS well into the millions in most our VDBench as well as bandwidth of 40.3GB/s. In order to hit this level of performance there was a sacrifice of some PCIe expansion slots, but if high storage performance is what is needed in a server, the Dell EMC PowerEdge R740xd fits that bill.


 Amazon