

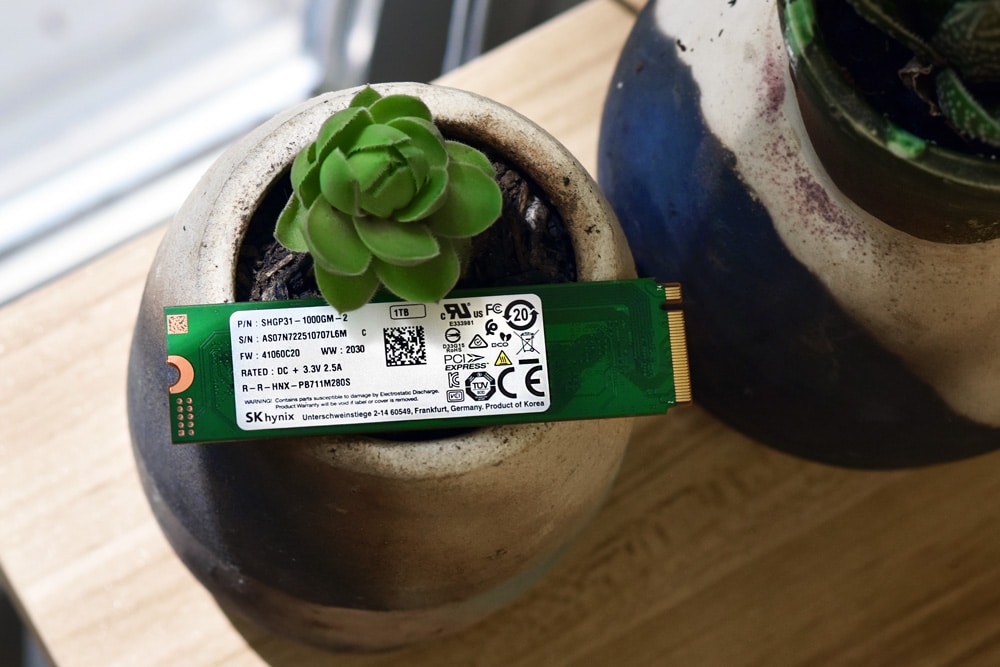
Dubbed the first 128-layer (or 4D) NAND flash-based consumer SSD, the SK hynix Gold P31 is the company’s first consumer-grade PCIe SSD to hit the US market under the SK hynix name. It features capacities of 500GB and 1TB and is targeted towards gamers, designers, and content creators.

The Gold P31 is released alongside the Platinum line (though not to be confused with the previously launched Gold S31 SATA drive). SK hynix indicates that “Platinum” and “Gold” represent two different product segments within their line of consumer SSDs, where Platinum is the company’s flagship model, Gold is the more for mainstream users.
Performance-wise, the Gold P31 is quoted to deliver up to 3.5GB/s sequential read and up to 3.2GB/s sequential write, while random performance expected to hit up to 570,000 IOPS read and 600,000 IOPS write (for both capacities) They’re able to reach these speeds due to HYPERWRITE technology, in which the company claims will accelerate sequential write speeds using SLC buffer. From endurance, the Platinum P31 offers up to 1,500 TBW with a mean time between failures (MTBF) reaching 1.5 million hours.
Backed by a 5-year warranty, the SK hynix Gold P31 is currently priced at $75.00 (500GB) and $135 (1TB).
SK hynix Gold P31 Specifications
| Model name | Gold P31 |
| SSD capacity | 1TB/500GB |
| Product Type | Internal SSD |
| Interface | PCIe NVMe Gen 3 |
| Form Factor | M.2 (2280) |
| NAND Type | 128-layer NAND |
| Controller | SK hynix Controller |
| Sequential Read | up to 3,500MB/s |
| Sequential Write | up to 3,200MB/s |
| Warranty | 5 years |
| TBW | 750TBW |
Performance
Testbed
The test platform leveraged in these tests is a Dell PowerEdge R740xd server. We measure SATA performance through a Dell H730P RAID card inside this server, although we set the card in HBA mode only to disable the impact of the RAID card cache. NVMe is tested natively through an M.2 to PCIe adapter card. The methodology used better reflects the end-user workflow with the consistency, scalability, and flexibility testing within virtualized server offers. A large focus is put on drive latency across the entire load range of the drive, not just at the smallest QD1 (Queue-Depth 1) levels. We do this because many of the common consumer benchmarks don’t adequately capture end-user workload profiles.
SQL Server Performance
Each SQL Server VM is configured with two vDisks: 100GB volume for boot and a 500GB volume for the database and log files. From a system resource perspective, we configured each VM with 16 vCPUs, 64GB of DRAM, and leveraged the LSI Logic SAS SCSI controller. While our Sysbench workloads tested previously saturated the platform in both storage I/O and capacity, the SQL test is looking for latency performance.
This test uses SQL Server 2014 running on Windows Server 2012 R2 guest VMs and is stressed by Quest’s Benchmark Factory for Databases. StorageReview’s Microsoft SQL Server OLTP testing protocol employs the current draft of the Transaction Processing Performance Council’s Benchmark C (TPC-C), an online transaction-processing benchmark that simulates the activities found in complex application environments. The TPC-C benchmark comes closer than synthetic performance benchmarks to gauging the performance strengths and bottlenecks of storage infrastructure in database environments. Each instance of our SQL Server VM for this review uses a 333GB (1,500 scale) SQL Server database and measures the transactional performance and latency under a load of 15,000 virtual users.
SQL Server Testing Configuration (per VM)
- Windows Server 2012 R2
- Storage Footprint: 600GB allocated, 500GB used
- SQL Server 2014
- Database Size: 1,500 scale
- Virtual Client Load: 15,000
- RAM Buffer: 48GB
- Test Length: 3 hours
- 2.5 hours preconditioning
- 30 minutes sample period
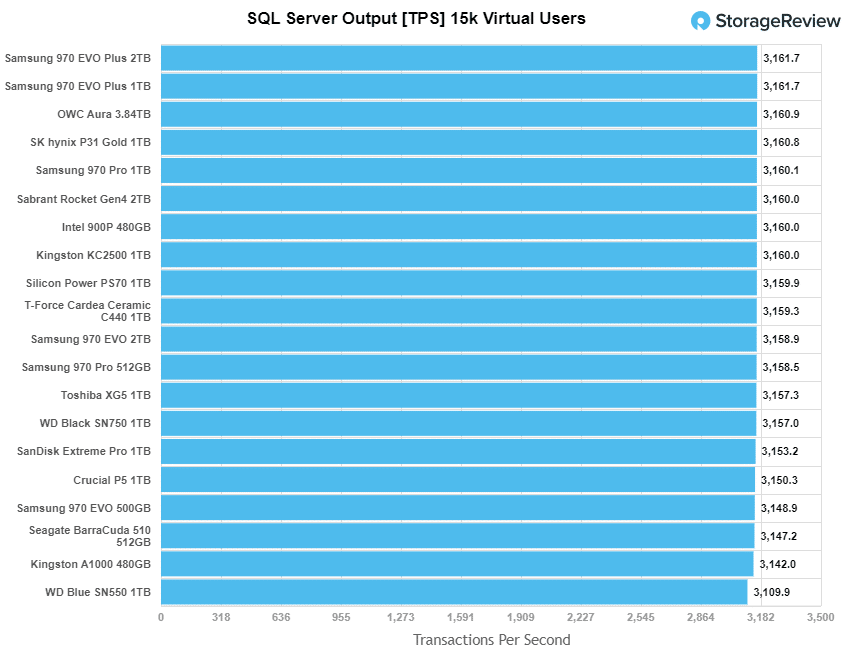
For our SQL Server transactional benchmark, the SK hynix Gold P31 posted 3,160.8 TPS, which placed it among the leaders.
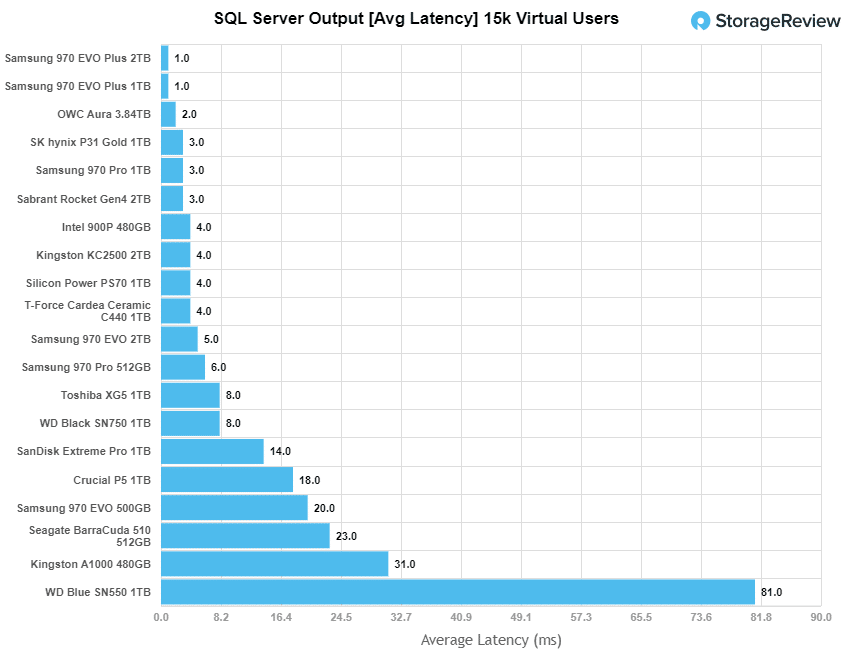
For latency, the SSK hynix Gold P31 had top-end leaderboard performance with 3.0ms, which is right there up with the leaders and tied with the premium Samsung 970 Pro.
Houdini by SideFX
The Houdini test is specifically designed to evaluate storage performance as it relates to CGI rendering. The testbed for this application is a variant of the core Dell PowerEdge R740xd server type we use in the lab with dual Intel 6130 CPUs and 64GB DRAM. In this case, we installed Ubuntu Desktop (ubuntu-16.04.3-desktop-amd64) running bare metal. The output of the benchmark is measured in seconds to complete, with fewer being better.
The Maelstrom demo represents a section of the rendering pipeline that highlights the performance capabilities of storage by demonstrating its ability to effectively use the swap file as a form of extended memory. The test does not write out the result data or process the points in order to isolate the wall-time effect of the latency impact on the underlying storage component. The test itself is composed of five phases, three of which we run as part of the benchmark, which is as follows:
- Loads packed points from disk. This is the time to read from disk. This is single-threaded, which may limit overall throughput.
- Unpacks the points into a single flat array in order to allow them to be processed. If the points do not have a dependency on other points, the working set could be adjusted to stay in-core. This step is multi-threaded.
- (Not Run) Processes the points.
- Repacks them into bucketed blocks suitable for storing back to disk. This step is multi-threaded.
- (Not Run) Writes the bucketed blocks back out to disk.
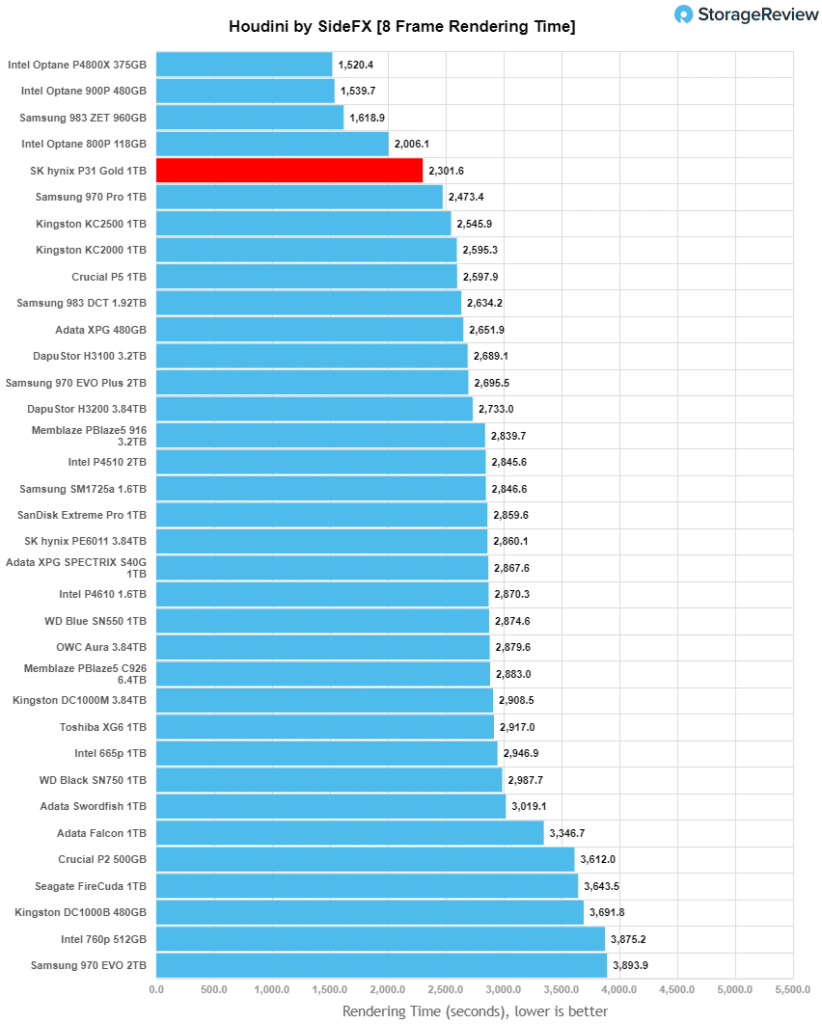
Here, we see the SK hynix Gold P31 with a very impressive score of 2,301.6 seconds, which is the fastest of any non Optane SSD we’ve tested (and noticeably better than the Samsung Pro).
VDBench Workload Analysis
When it comes to benchmarking storage devices, application testing is best, and synthetic testing comes in second place. While not a perfect representation of actual workloads, synthetic tests do help to baseline storage devices with a repeatability factor that makes it easy to do apples-to-apples comparison between competing solutions. These workloads offer a range of different testing profiles ranging from “four corners” tests, common database transfer size tests, to trace captures from different VDI environments. All of these tests leverage the common vdBench workload generator, with a scripting engine to automate and capture results over a large compute testing cluster. This allows us to repeat the same workloads across a wide range of storage devices, including flash arrays and individual storage devices. Our testing process for these benchmarks fills the entire drive surface with data, then partitions a drive section equal to 5% of the drive capacity to simulate how the drive might respond to application workloads. This is different than full entropy tests which use 100% of the drive and take them into a steady state. As a result, these figures will reflect higher-sustained write speeds.
Profiles:
- 4K Random Read: 100% Read, 128 threads, 0-120% iorate
- 4K Random Write: 100% Write, 64 threads, 0-120% iorate
- 64K Sequential Read: 100% Read, 16 threads, 0-120% iorate
- 64K Sequential Write: 100% Write, 8 threads, 0-120% iorate
Comparables for this review:
- Samsung EVO Plus 2TB
- Crucial P5 1TB
- Samsung 970 Pro 1TB
- Toshiba XG6 1TB
- WD Black 1TB
- Seagate FireCuda 510 1TB
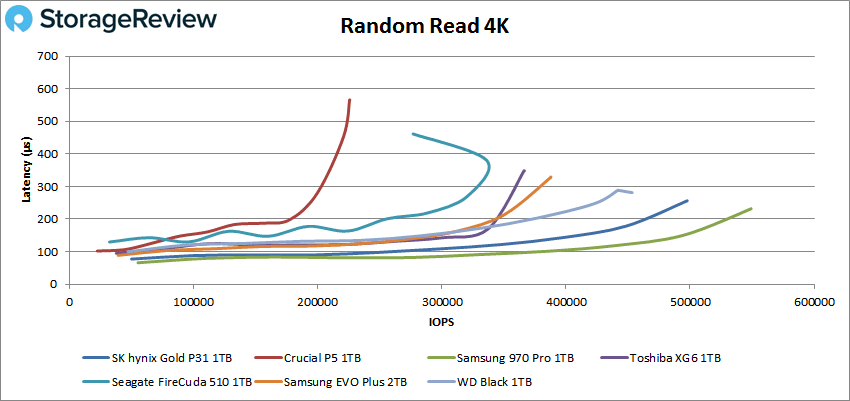
For 4K performance, the SK hynix Gold P31 found itself in second place. In reads, the drive peaked at 497,750 IOPS with a latency of just 256.1µs.
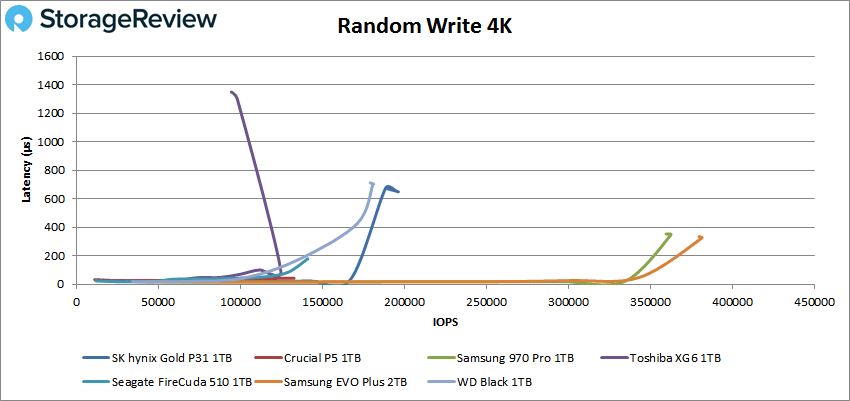
In 4K write activity, the SK hynix Gold P31 moved back down the pack with a peak of just 196,316 IOPS though it had a latency at 648.8µs before falling off a bit at the end.
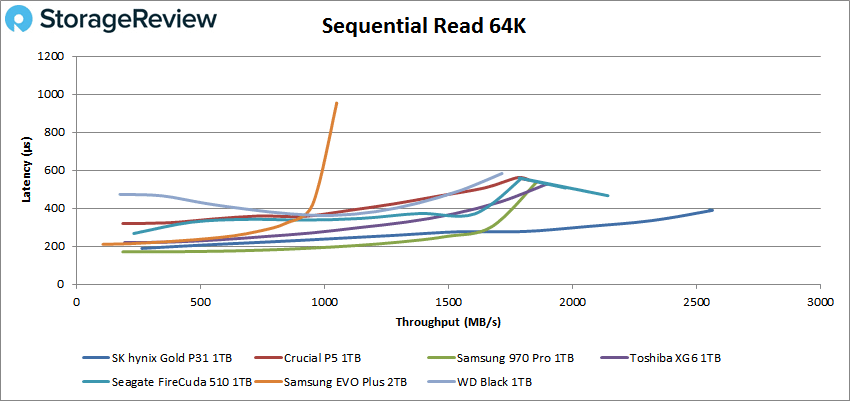
 With 64K sequential performance, the SK hynix Gold P31 showed the best performance by far, as it went on to peak at 41,005 IOPS (or 2.56GB/s) with 389.6.3µs (more than double the performance of the Samsung EVO Plus).
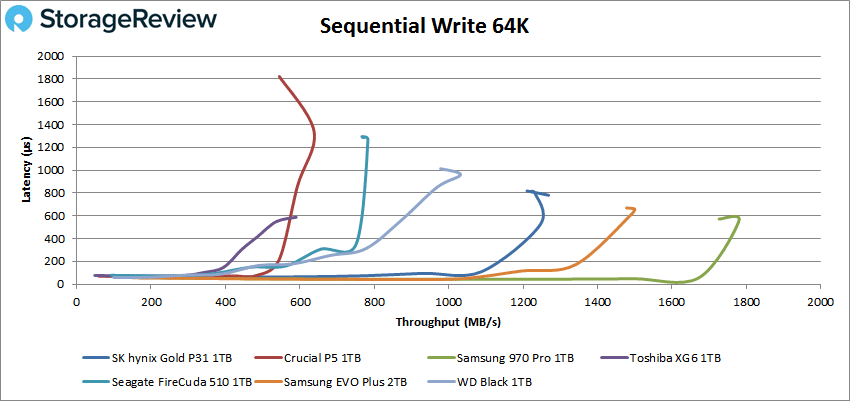
It fell back again in write performance, however. It peaked at around 20k IOPS (or 1.27GB/s) with a latency of 781ms before falling off slightly at the very end of the test.
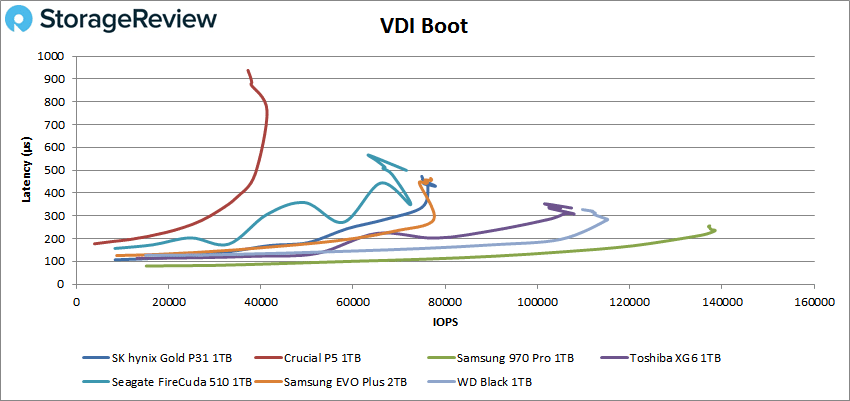
Next, we looked at our VDI benchmarks, which are designed to tax the drives even further. Here, the new SK hynix showed mid-to-upper range performance compared to the other tested drives. In Boot, the Gold P31 showed a peak of around 77,865 IOPS with a latency of 430.2µs before it dropped slightly at the very end.
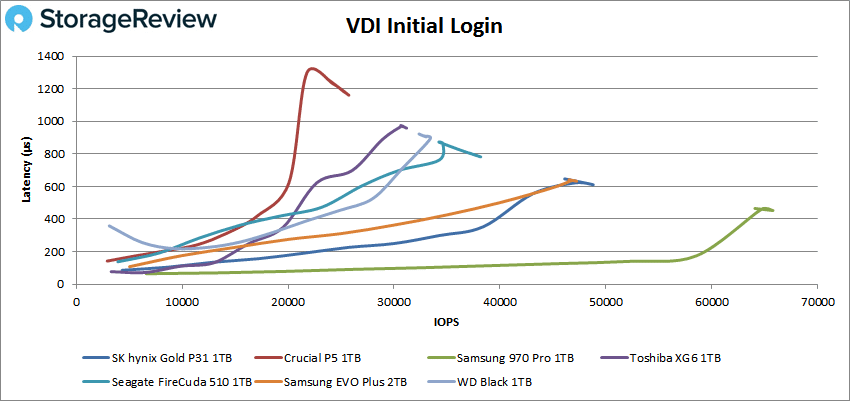
 Looking at our VDI Initial Login, the SK hynix Gold P31 showed a peak of 48,813 IOPS with a latency of 610.5µs, which was good enough for 2nd place (though still well behind the Samsung 970 Pro).
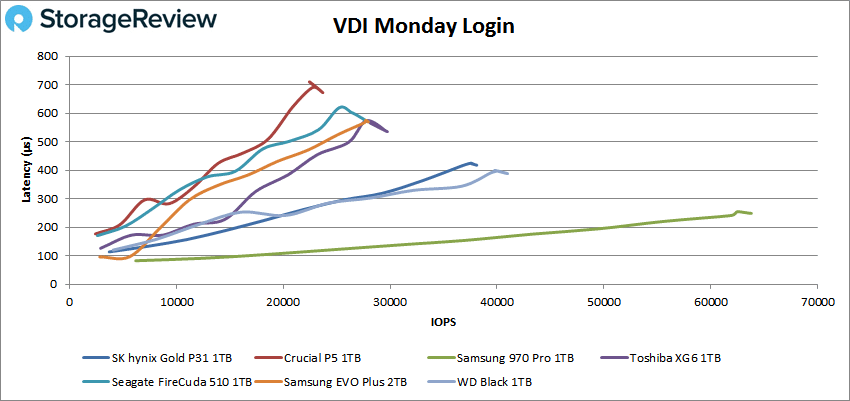
Finally, in our last test, VDI Monday Login showed the SK hynix Gold P31 SSD with a peak IOPS at 38,105 IOPS with 417.7ms in latency, just behind the WD Black.
Conclusion
Not only is the SK hynix Gold P31 the company’s first consumer-grade SSD to hit the US market, but it’s also the first non-enterprise drive to feature 128-layer NAND. Nonetheless, the SK hynix is catered towards a range of different demographics, including gamers, designers, and content creators. And based on its impressive performance, it will certainly excel in each area. Available in capacities of 500GB and 1TB, the SK hynix also features HYPERWRITE technology, offers up to 1,500 TBW, and time between failures (MTBF) is quoted to reach 1.5 million hours.
For performance, we compared the SK hynix Gold P31 to a range of similarly-classed client NVMe drive where it showed some great results. For example, it hit a pretty impressive milestone in our Houdini test results with a bar-setting 2,301.6, posting the best results we’ve seen for a non-Optane SSD. That’s quite the feat. SQL performance was also very good, placing it at the top of the leader board in both TPS and latency. Moving on to our 4K and sequential tests, the Gold P31 found itself in second place in reads with a peak performance at 497,750 IOPS and a latency of just 256.1µs. With 64K sequential performance, the SK hynix drive boasted the best performance by far, peaking at 41,005 IOPS (or 2.56GB/s) with 389.6.3µs (which was over twice the performance output of the Samsung EVO Plus). In our VDI benchmarks, the SK hynix Gold P31 slowed down a bit (though still solid), showing peaks of 77,865 IOPS in boot, 48,813 IOPS in initial login, and 38,105 IOPS in Monday login.
Though it features premium performance, its price tag certainly doesn’t reflect it. The SK hynix Gold P31 is currently priced at just $75 for the 500GB and $135 for the 1TB–well worth the cost. This is noticeably less than even the weaker-performing drives in our test, such as the Samsung EVO Plus, which goes for roughly $100 and $190 for the same capacities. With this fantastic price point and overall impressive performance, we highly recommend the SK hynix Gold P31 for those looking for an inexpensive, performance-driven consumer SSD.


 Amazon