

The Dell H975i from the PERC13 series of RAID controllers is the most substantial leap forward the company has made in hardware RAID in over a decade. While Dell has released regular updates to its PERC line, these were largely incremental, focused on controller tuning and improved bandwidth as PCIe generations advanced. But the underlying architecture remained tied to the SATA and SAS legacy that has defined enterprise RAID for years. The PERC H975i breaks that cycle decisively. Built on Broadcom’s SAS51xx line of chipsets, this controller marks a definitive transition to a flash-first, and NVMe-native design. By exclusively supporting NVMe drives and eliminating support for traditional HDD and SATA technologies, the H975i incorporates a forward-looking approach to storage infrastructure, optimized for the high-performance, low-latency demands of modern data-intensive and AI-first workloads.
Key Takeaways
- Flash-first NVMe RAID: PERC13 H975i moves off SAS/SATA entirely, built on Broadcom SAS51xx for an NVMe-native, AI-ready architecture.
- Big generational jump: PCIe Gen5 x16 with up to 16 NVMe drives per controller (32 with two) delivered 52.5 GB/s and 12.5M IOPS per controller in testing, with gains vs PERC12 including +88% read bandwidth, +318% write bandwidth, +31% 4K read IOPS, and +466% 4K write IOPS.
- AI server fit: Front-integrated design frees rear PCIe slots for GPUs, shortens MCIO runs, and enables a dedicated storage pipe per accelerator for steadier, more deterministic throughput with no CPU overhead.
- Resiliency under stress: Supercapacitor-protected cache and faster rebuilds cut time to as low as 10 min/TiB while maintaining high performance during rebuilds (up to 53.7 GB/s reads, 68 GB/s writes, 17.3M/5.33M 4K IOPS).
- End-to-end security: Hardware Root of Trust, SPDM device identity, and full-spectrum encryption that covers drives, in-flight data, and controller cache.
The PERC H975i delivers unmatched performance and architectural innovations. Leveraging a PCIe Gen 5 x16 host interface and supporting up to 16 NVMe drives (32 NVMe drives per system with two controllers), the H975i in our testing delivered a remarkable 52.5 GB/s maximum throughput and 12.5 million IOPS per controller. That represents an almost 2x performance increase in every key category compared to PERC12, which topped out at 6.9 million IOPS and 27GB/s throughput. Beyond raw performance, the PERC13 introduces a supercapacitor-based cache protection mechanism (replacing traditional battery-backed systems), ensuring data integrity without compromising operational reliability. Building on the security features of its predecessor, the H975i now extends full-spectrum encryption capabilities, encrypting data within the cache and offering comprehensive protection both in transit and at rest.
The PERC H975i emerges as a purpose-built storage accelerator designed to meet the unprecedented computational demands of AI workloads. It offers both high density and high performance, as well as low-latency storage with no CPU overhead. In practice, pairing a PCIe Gen5 RAID card that can saturate a x16 interface with a Gen5 GPU gives each accelerator its own dedicated storage pipeline. This simplifies PCIe/NUMA topology, preventing noisy-neighbor effects and keeping rebuild or background tasks isolated to that GPU’s I/O domain.
Scale this to dual RAID cards to two GPUs, and you preserve linear performance while avoiding contention on shared lanes or caches. The result is steadier input bandwidth for data-hungry training and inference (large batches, rapid shuffles, fast checkpoint reads) with tighter latency distributions under load and during rebuilds. This architecture doesn’t just push higher peak numbers; it makes throughput more deterministic, which is precisely what multi-GPU AI servers need to keep utilization high.
Dell PERC12 H965i and PERC13 H975i Specifications
| Feature | PERC12 H965i Front | PERC13 H975i Front |
|---|---|---|
| RAID Levels | 0, 1, 5, 6, 10, 50, 60 | 0, 1, 5, 6, 10, 50, 60 |
| Non-RAID (JBOD) | Yes | Yes |
| Host Bus Type | PCIe Gen4 x16 | PCIe Gen5 x16 |
| Side-band Management | I2C, PCIe VDM | I2C, PCIe VDM |
| Enclosures per Port | Not applicable | Not applicable |
| Processor / Chipset | Broadcom RAID-on-Chip, SAS4116W | Broadcom RAID-on-Chip, SAS5132W |
| Energy Pack / Power-backup | Battery | Supercapacitor |
| Local Key Management Security | Yes | Yes |
| Secure Enterprise Key Manager | Yes | Yes |
| Controller Queue Depth | 8,192 | 8,192 |
| Non-volatile Cache | Yes | Yes |
| Cache Memory | 8 GB DDR4 3200 MT/s | Integrated RAID cache |
| Cache Functions | Write-back, read-ahead, write-through, always write-back, no read-ahead | Write-back, write-through, always write-back, no read-ahead |
| Max Complex Virtual Disks | 64 | 16 |
| Max Simple Virtual Disks | 240 | 64 |
| Max Disk Groups | 64 | 32 |
| Max VDs per Disk Group | 16 | 8 |
| Max Hot-spare Devices | 64 | 8 |
| Hot-swap Devices Supported | Yes | Yes |
| Auto-Configure (Primary & Execute once) | Yes | Yes |
| Hardware XOR Engine | Yes | Yes |
| Online Capacity Expansion | Yes | Yes |
| Dedicated & Global Hot Spare | Yes | Yes |
| Supported Drive Types | NVMe Gen3 and Gen4 | NVMe Gen3, Gen4 and Gen5 |
| VD Strip Element Size | 64KB | 64KB |
| NVMe PCIe Support | Gen4 | Gen5 |
| Configuration Max NVMe Drives | 8 drives per controller | 16 drives per controller |
| Supported Sector Sizes | 512B, 512e, 4Kn | 512B, 512e, 4Kn |
| Storage Boot Support | UEFI-only | UEFI-only |
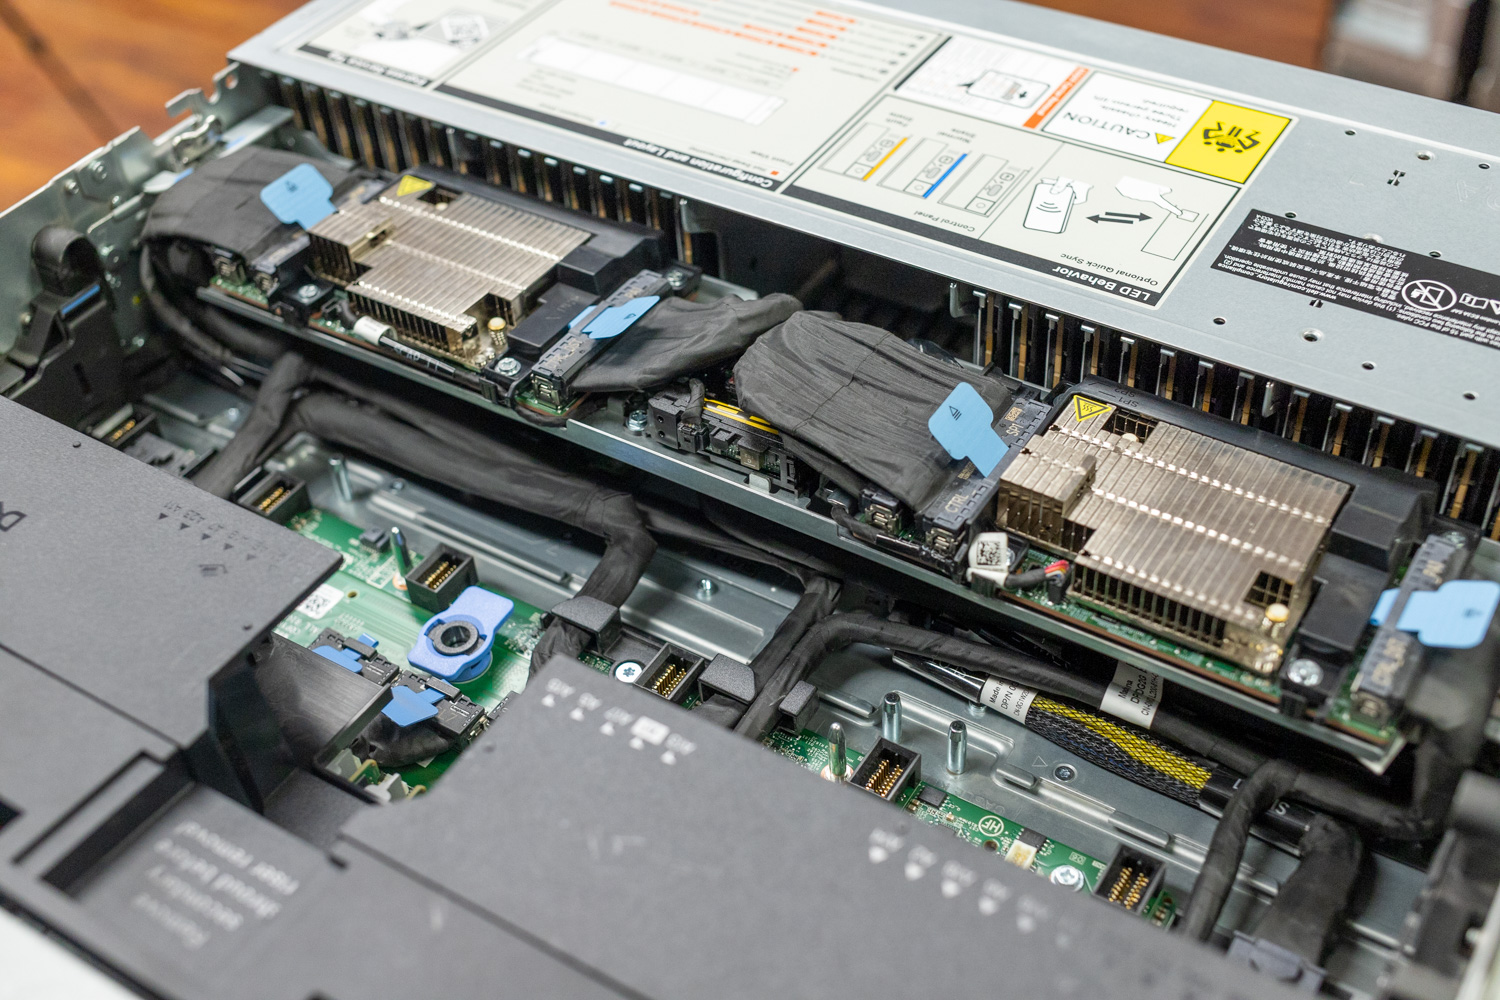
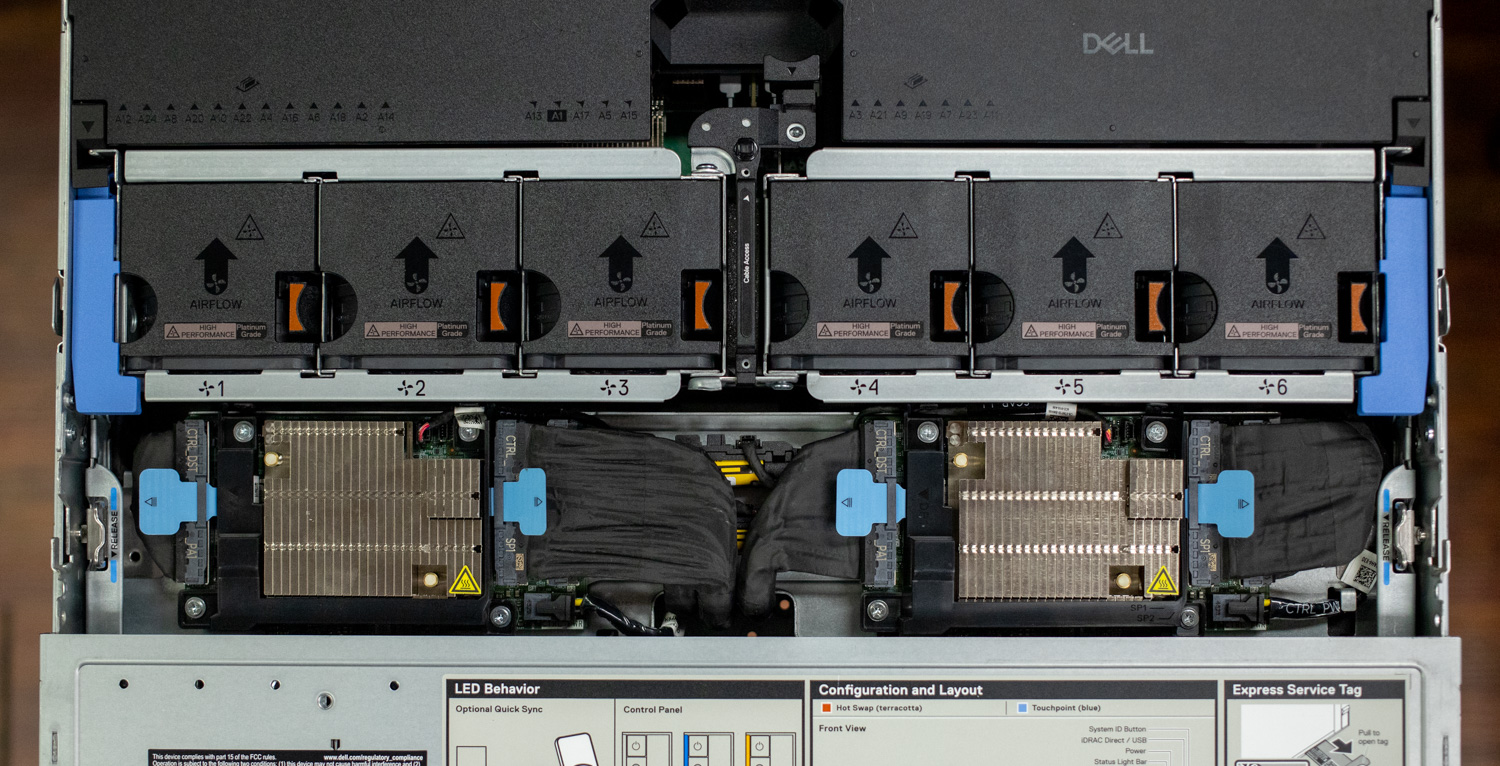
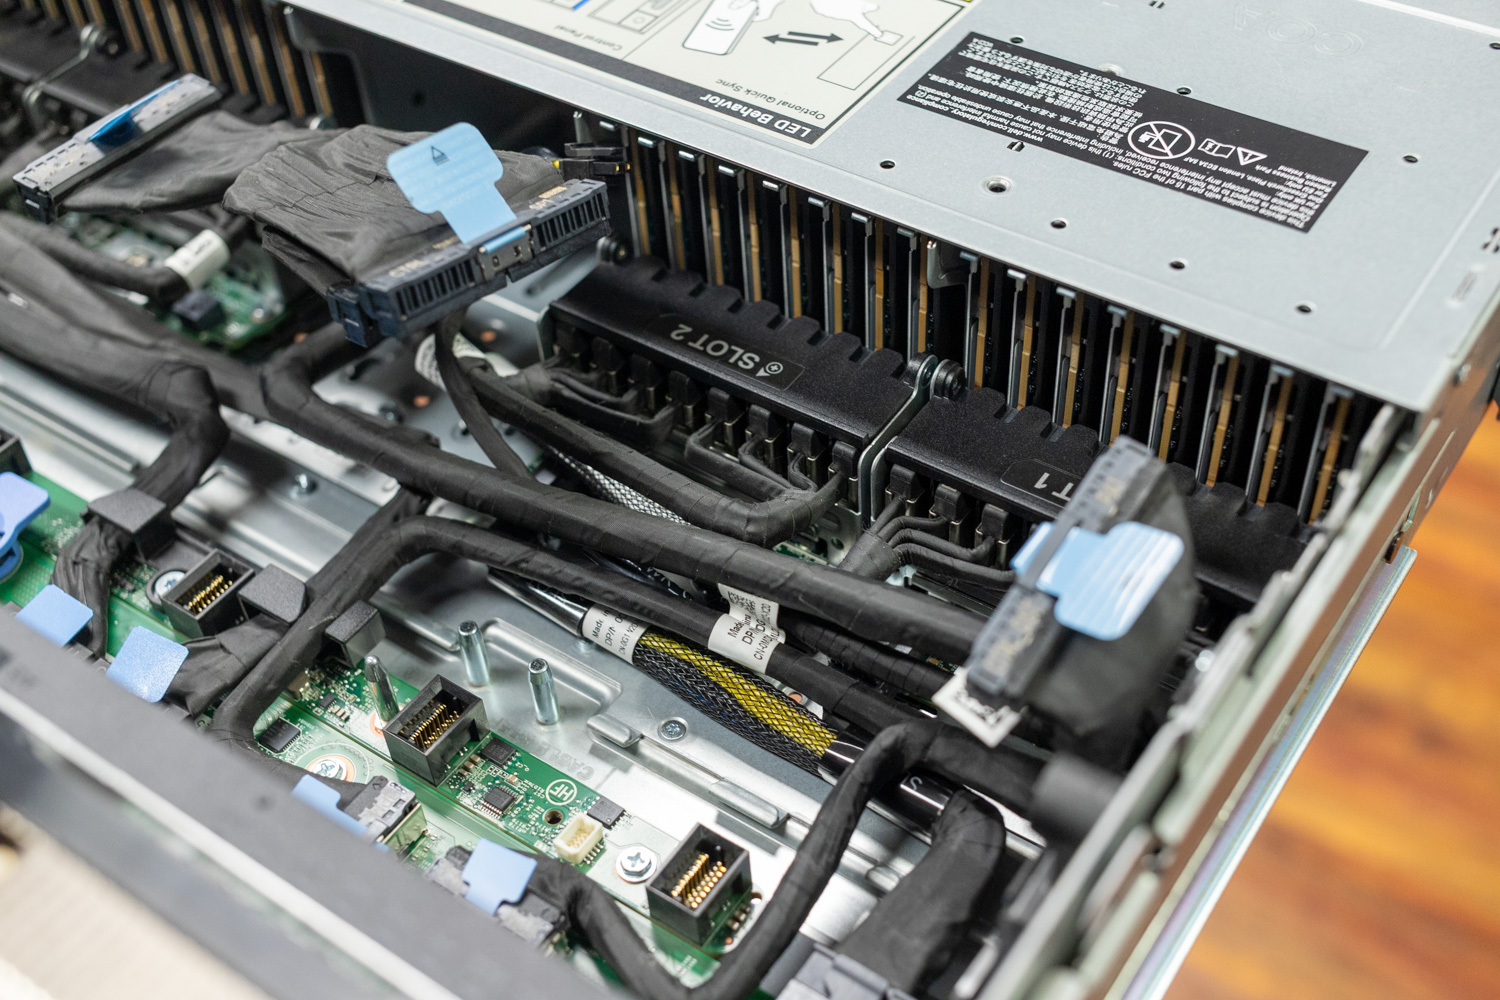
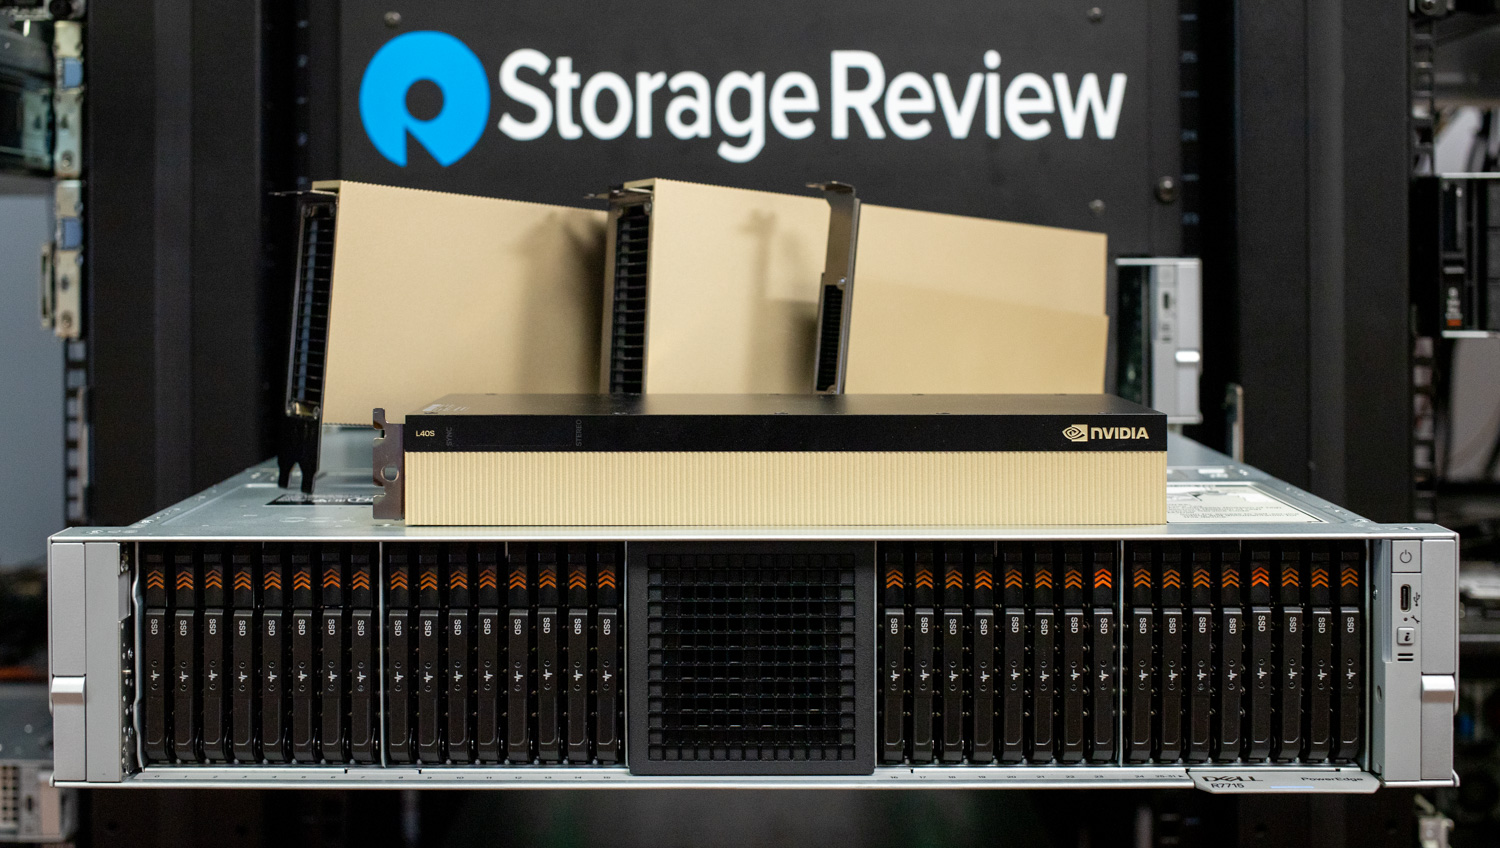
The PERC13 H975i Front controller in Dell PowerEdge servers is designed for seamless integration into the system architecture. Unlike traditional add-in cards that occupy rear PCIe slots, the H975i connects directly to the front drive backplane and interfaces with the front MCIO connectors on the motherboard through dedicated PCIe 5.0 interfaces. This integrated design preserves rear PCIe slots for high-performance GPUs and additional PCIe expansion, while significantly reducing the length of cables. This aids in maintaining signal integrity, making the system more reliable and easier to service. The result is a cleaner internal layout and improved airflow for dense, compute-intensive deployments.
The H975i implements a comprehensive security architecture that spans from silicon-level hardware attestation through full-spectrum data encryption of data in place with SED drives. At its foundation, Hardware Root of Trust establishes an immutable chain of cryptographic verification from the Internal Boot ROM through each firmware component, ensuring only authenticated Dell-certified firmware can execute on the controller. This hardware-based security extends through Security Protocol and Data Model (SPDM) implementation, where each controller contains a unique Device Identity certificate enabling iDRAC to perform real-time authentication verification. The controller extends cryptographic protection beyond traditional data-at-rest scenarios to include cache memory. It maintains encryption keys in secure memory regions that are inaccessible to unauthorized firmware. As a result, sensitive data remains protected whether residing on drives or actively being processed in cache.
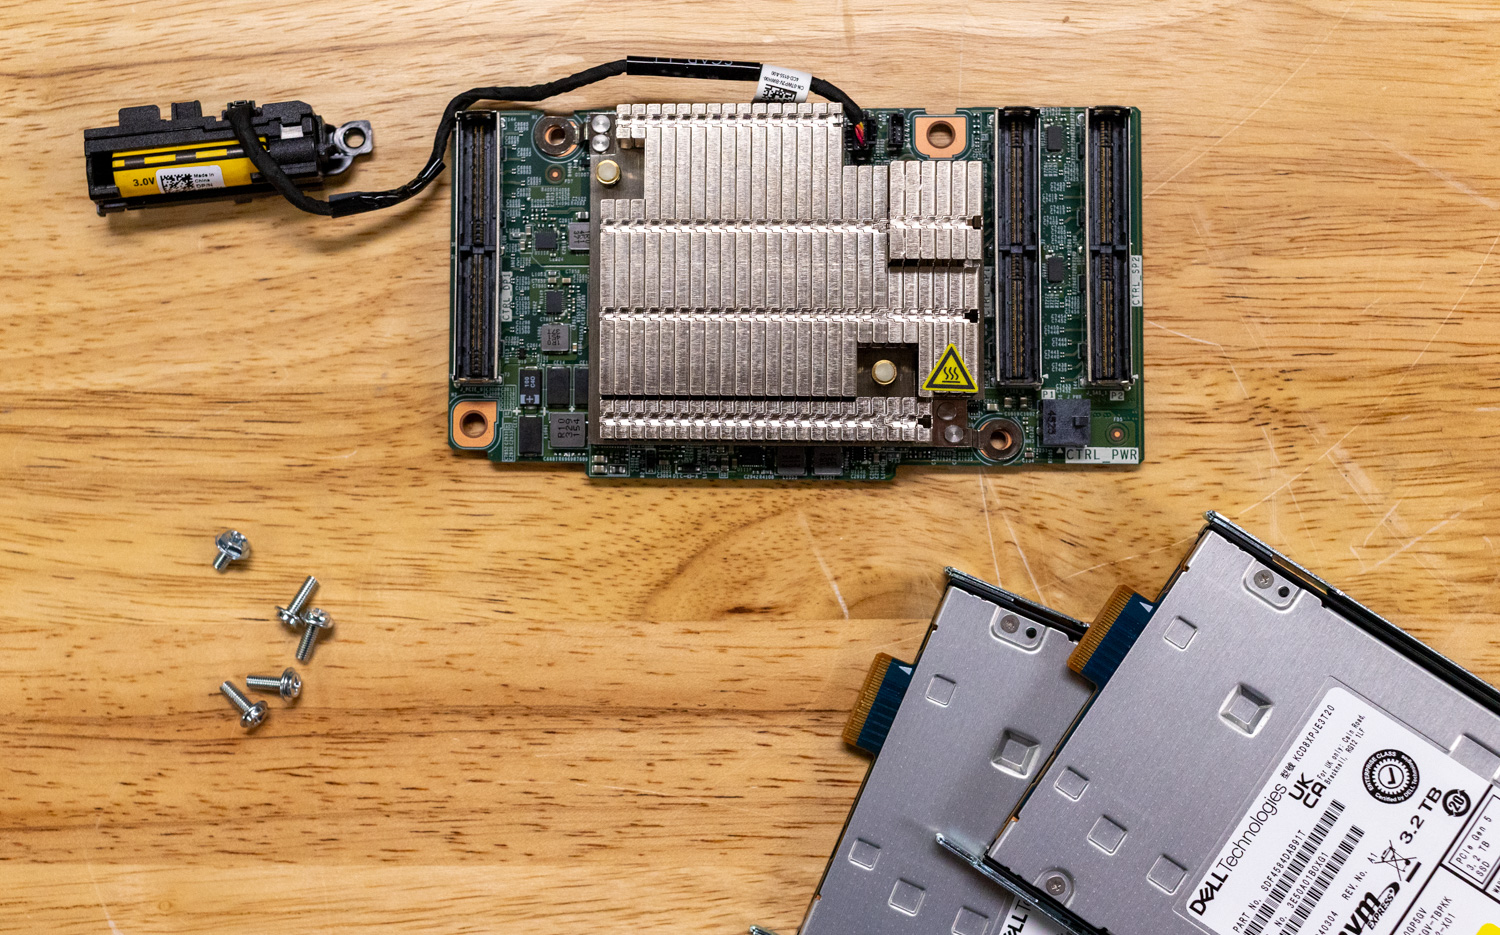
Power protection in the H975i is another significant evolution from traditional battery-backed systems through its integration of a supercapacitor. The supercapacitor provides instantaneous power delivery during unexpected power loss events, ensuring an encrypted and complete cache flush to non-volatile storage, where data remains protected indefinitely. In addition, unlike battery-based systems that require 4-8 hours for learn cycles, the H975i’s supercapacitor completes its Transparent Learn Cycle within 5-10 minutes without any performance degradation during calibration. This design eliminates the maintenance overhead and degradation concerns inherent in battery solutions, while providing superior reliability for mission-critical data protection.
Integrated Monitoring and Management
Dell’s PERC13 RAID controller, like many of Dell’s RAID solutions, can be managed and monitored in many ways, including during platform boot via System Setup in the BIOS, through the iDRAC web GUI, the PERC12 utility, and even Dell OpenManage UI and CLI.
iDRAC Controller Management
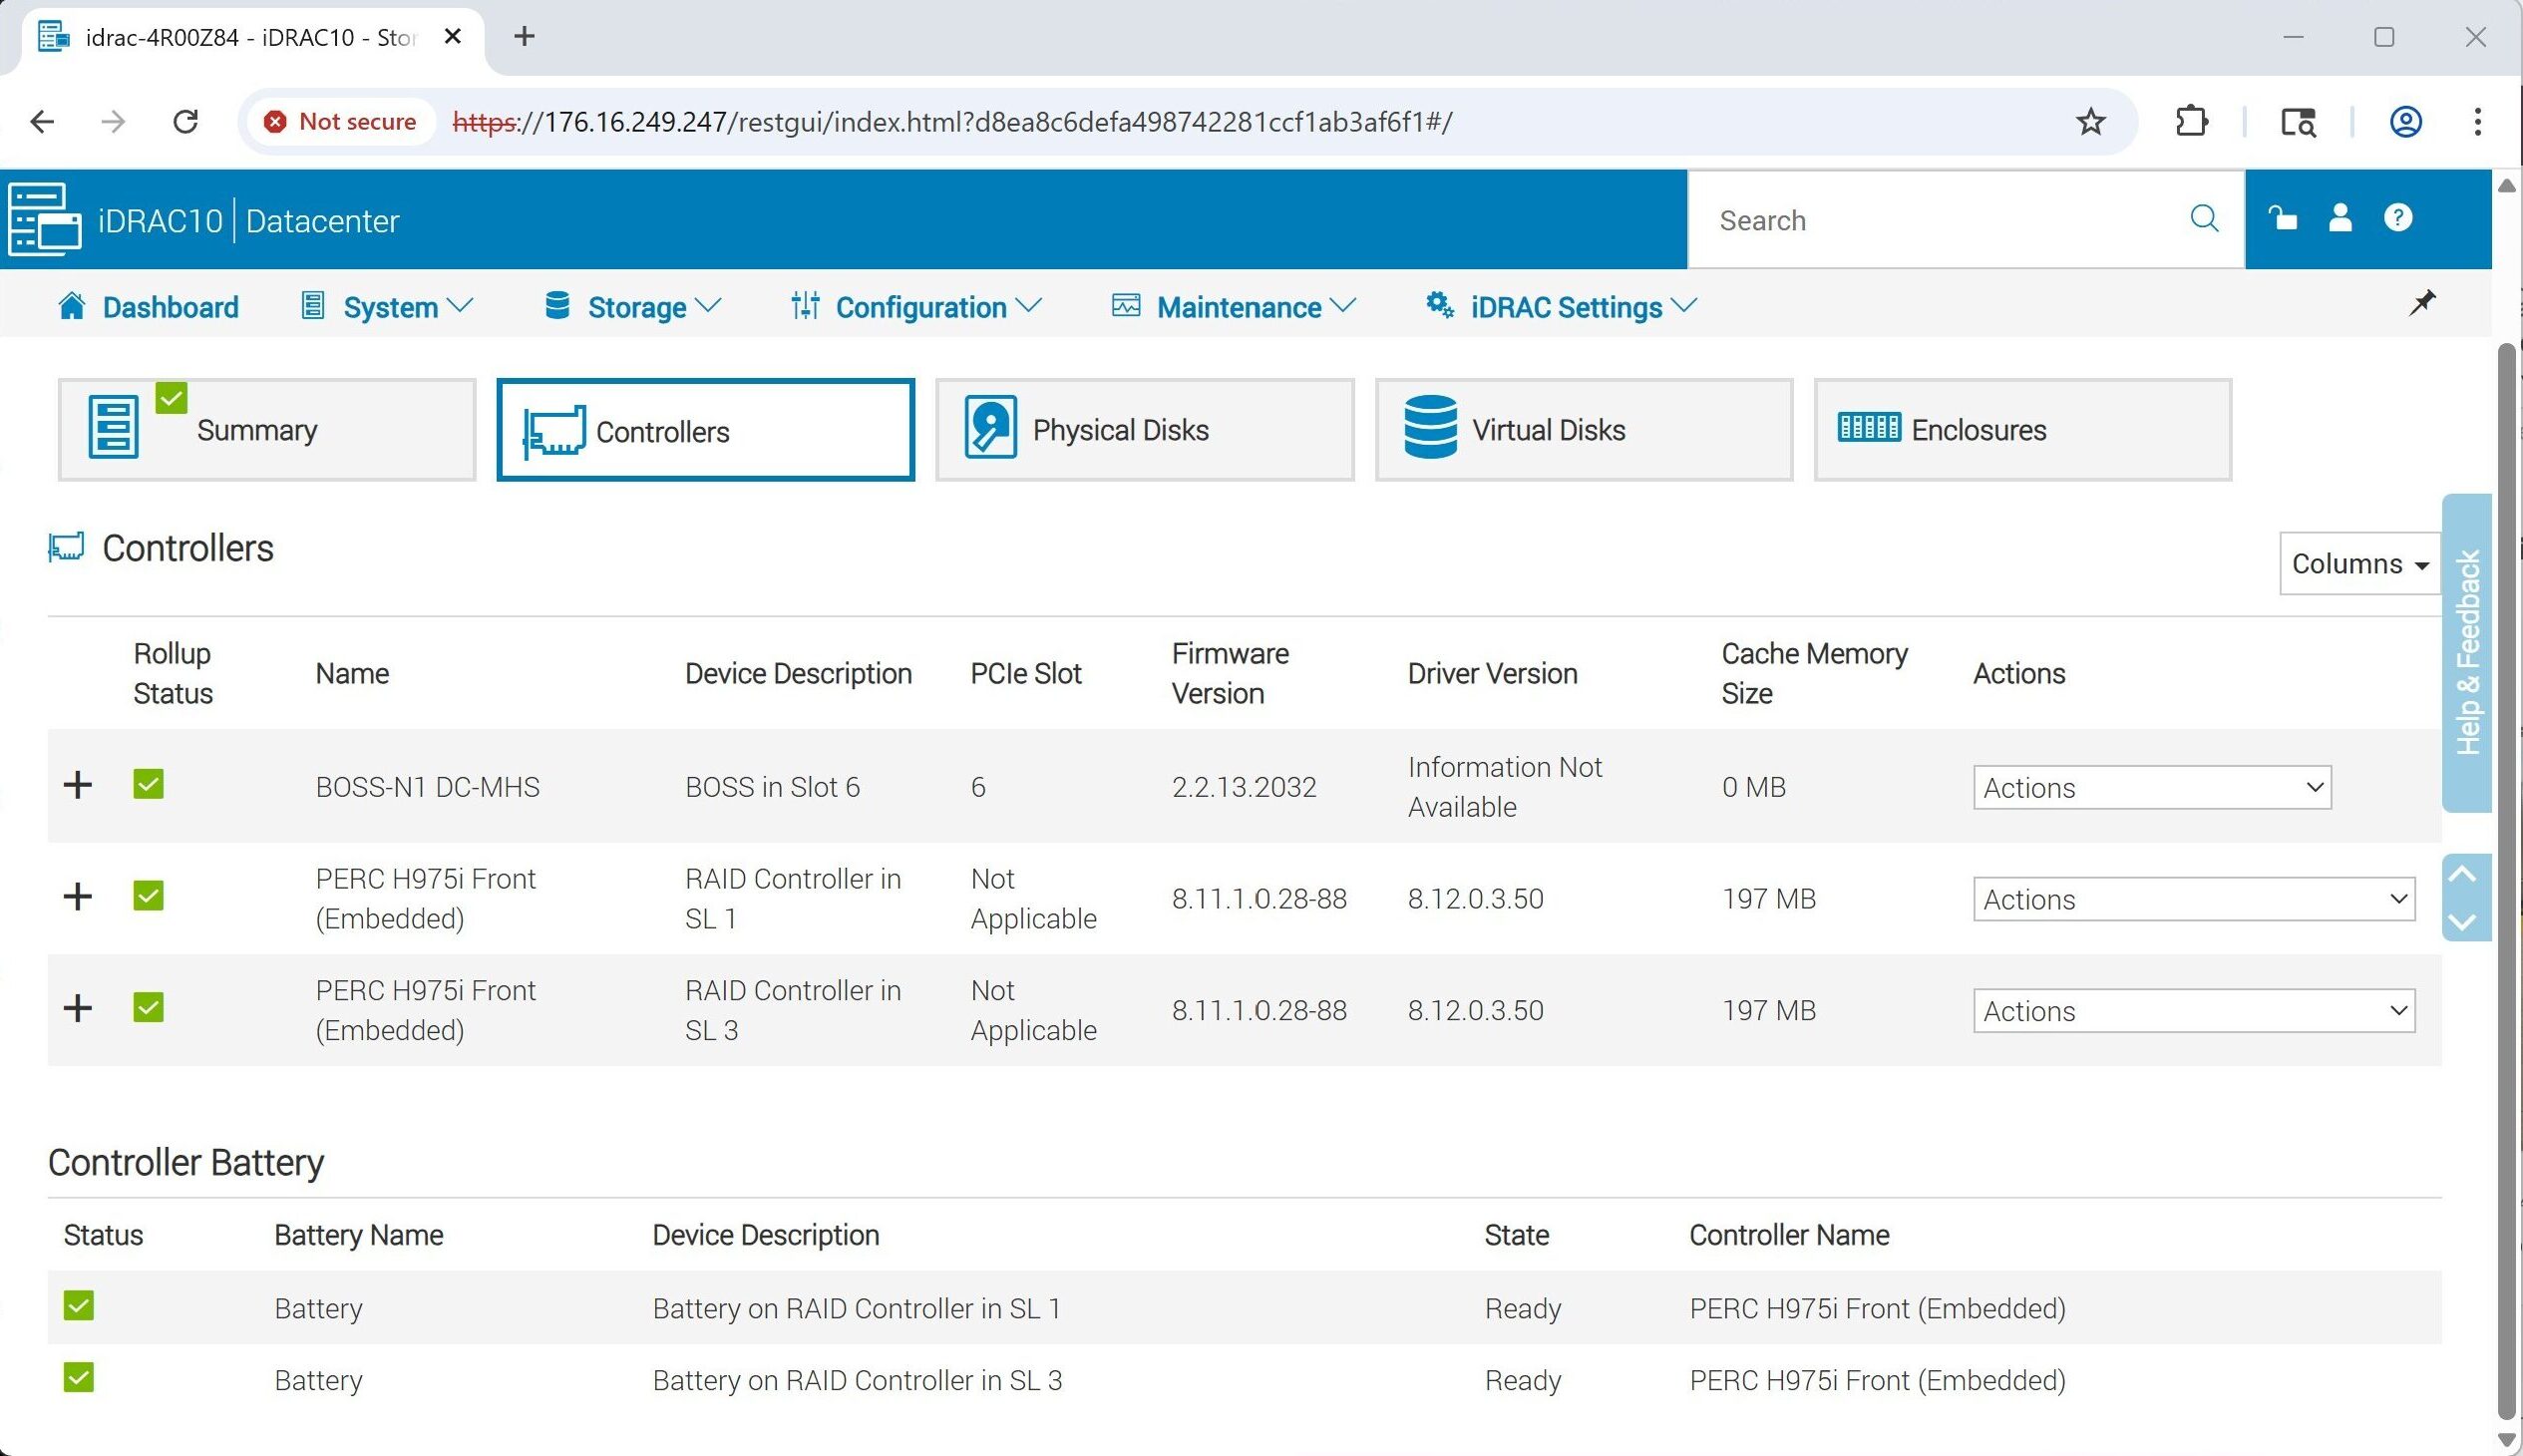
When viewing the iDRAC management interface, the controllers tab offers an overview of the server’s storage hardware. Alongside the BOSS card, you’ll see the dual PERC H975i controllers, complete with information on firmware versions, cache memory, and battery health. This summary enables you to quickly verify the controllers’ readiness and configuration without needing to access the BIOS or use CLI tools.
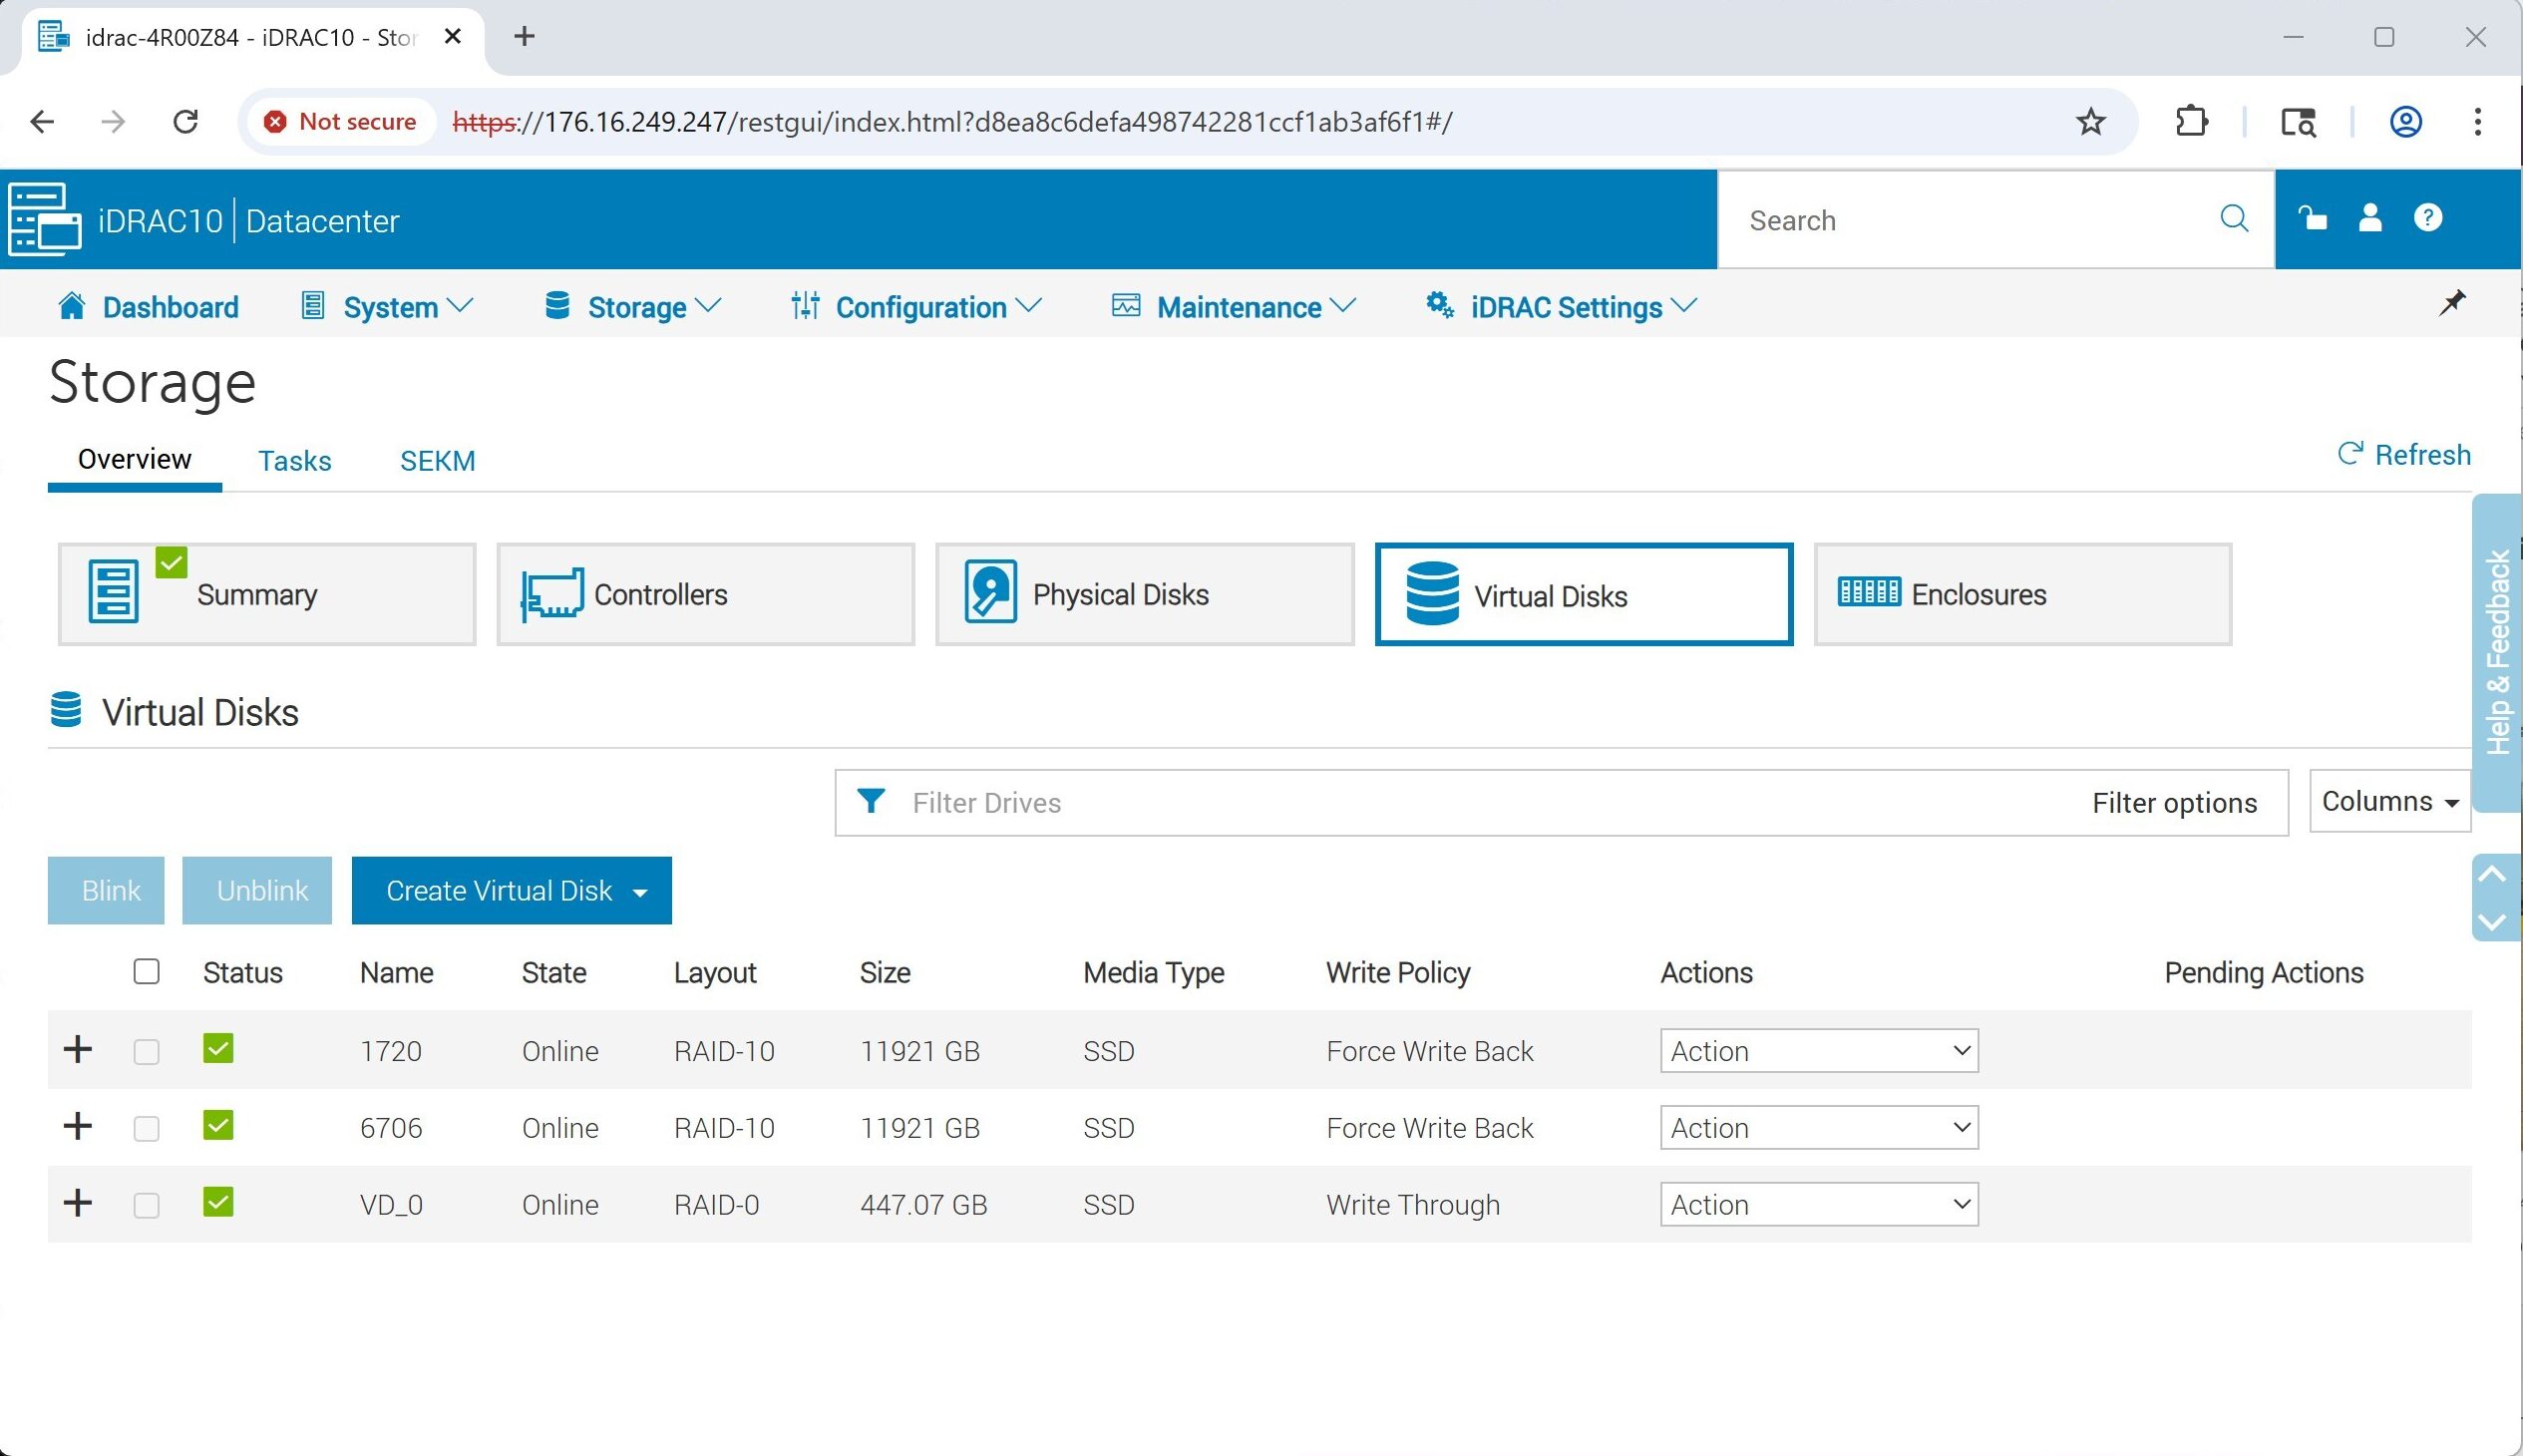
The Virtual Disks tab in iDRAC shows the storage arrays that have been created, including their RAID level, size, and caching policy. In this system, two RAID-10 groups are listed, all built on SSDs. From this view, administrators can confirm volumes are online, create new virtual disks, or use the Actions menu to adjust or delete existing configurations.
RAID Controller Configuration Utility
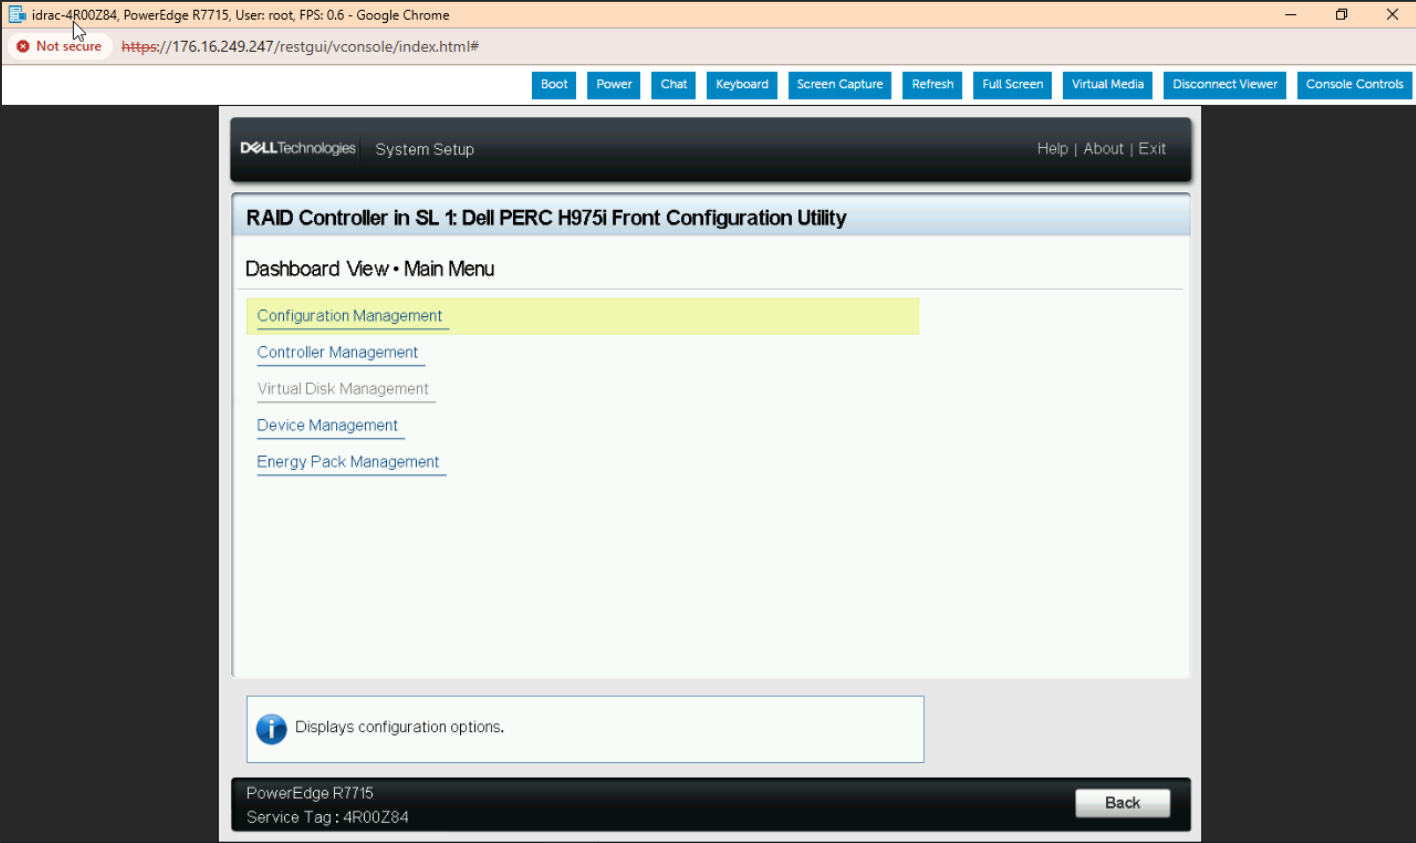
The image above shows an example of entering the PERC H975i Front Configuration Utility System Setup on the PowerEdge R7715 platform. From this interface, you can manage all key RAID controller settings, including Configuration Management, Controller Management, Device Management, and more. This utility provides a streamlined way to set up virtual disks and monitor hardware components directly during the platform boot process.
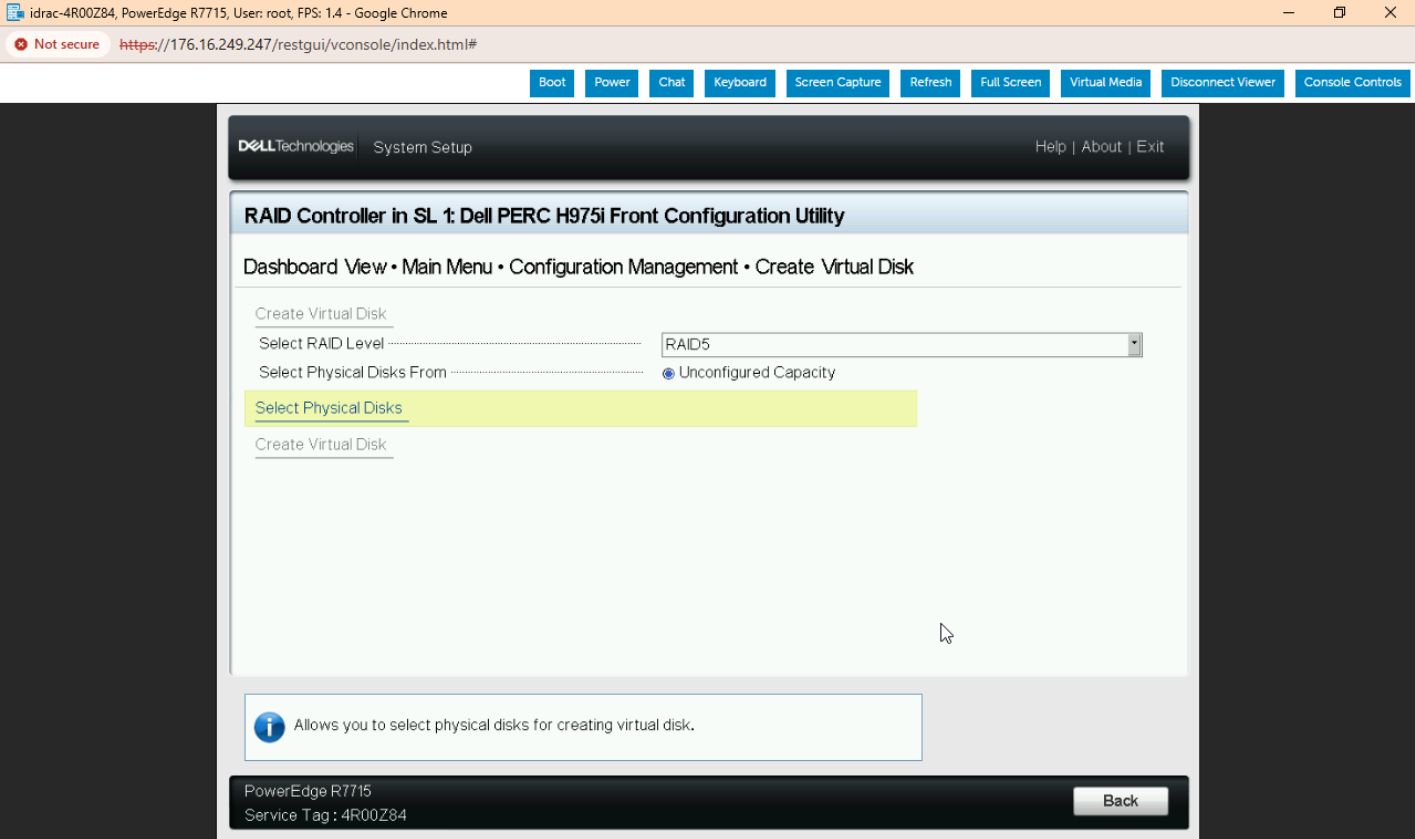
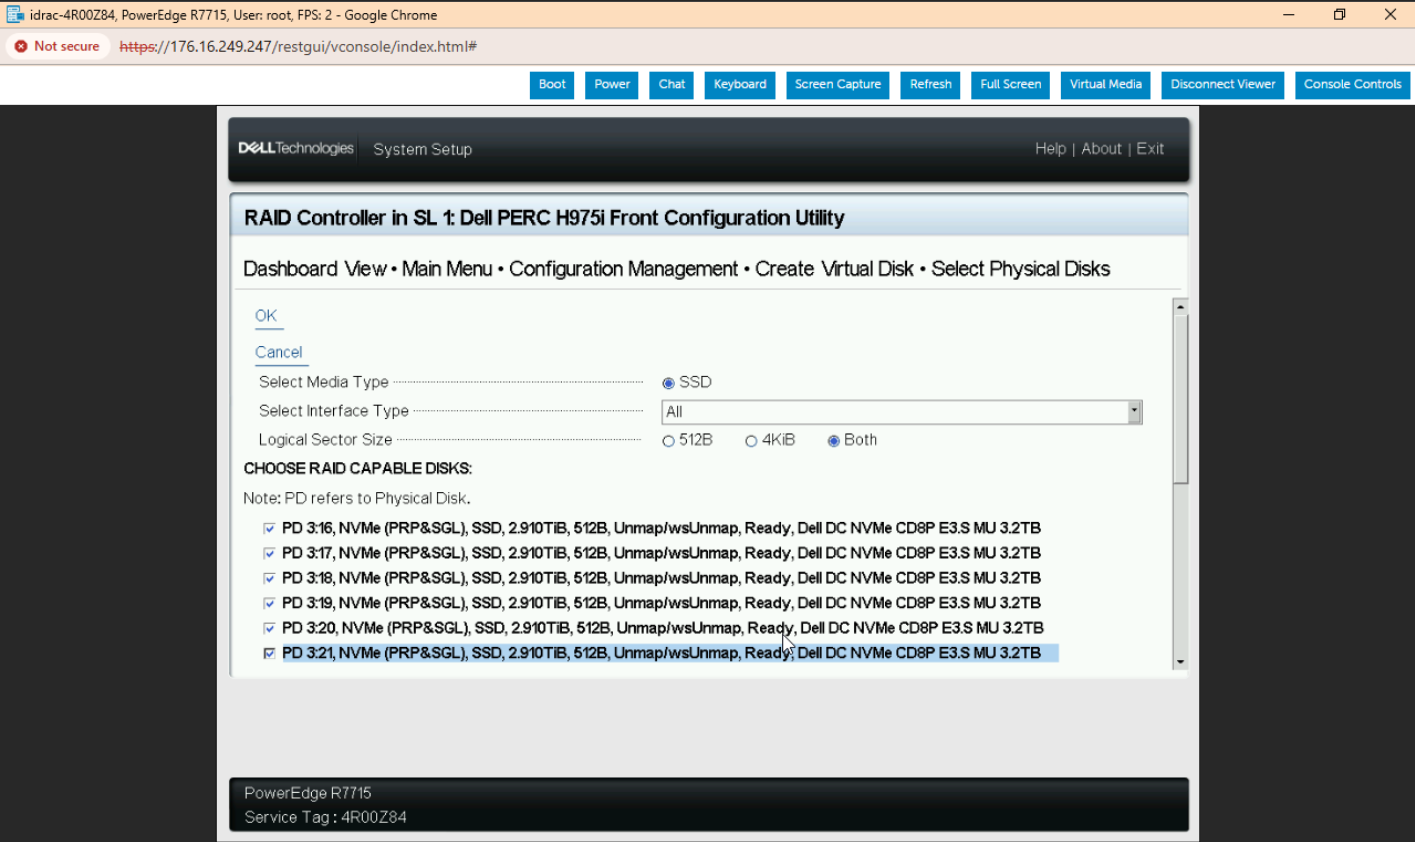
After selecting the RAID level, we move on to choosing physical disks for the array. In this example, all available NVMe SSDs are listed and marked as RAID-capable. We select multiple 3.2 TiB Dell DC NVMe drives from the unconfigured capacity pool. Filters like media type, interface, and logical sector size help narrow the selection. Once the desired drives are checked, we can proceed by clicking “OK” to finalize the disk selection and continue creating the Virtual Disk.
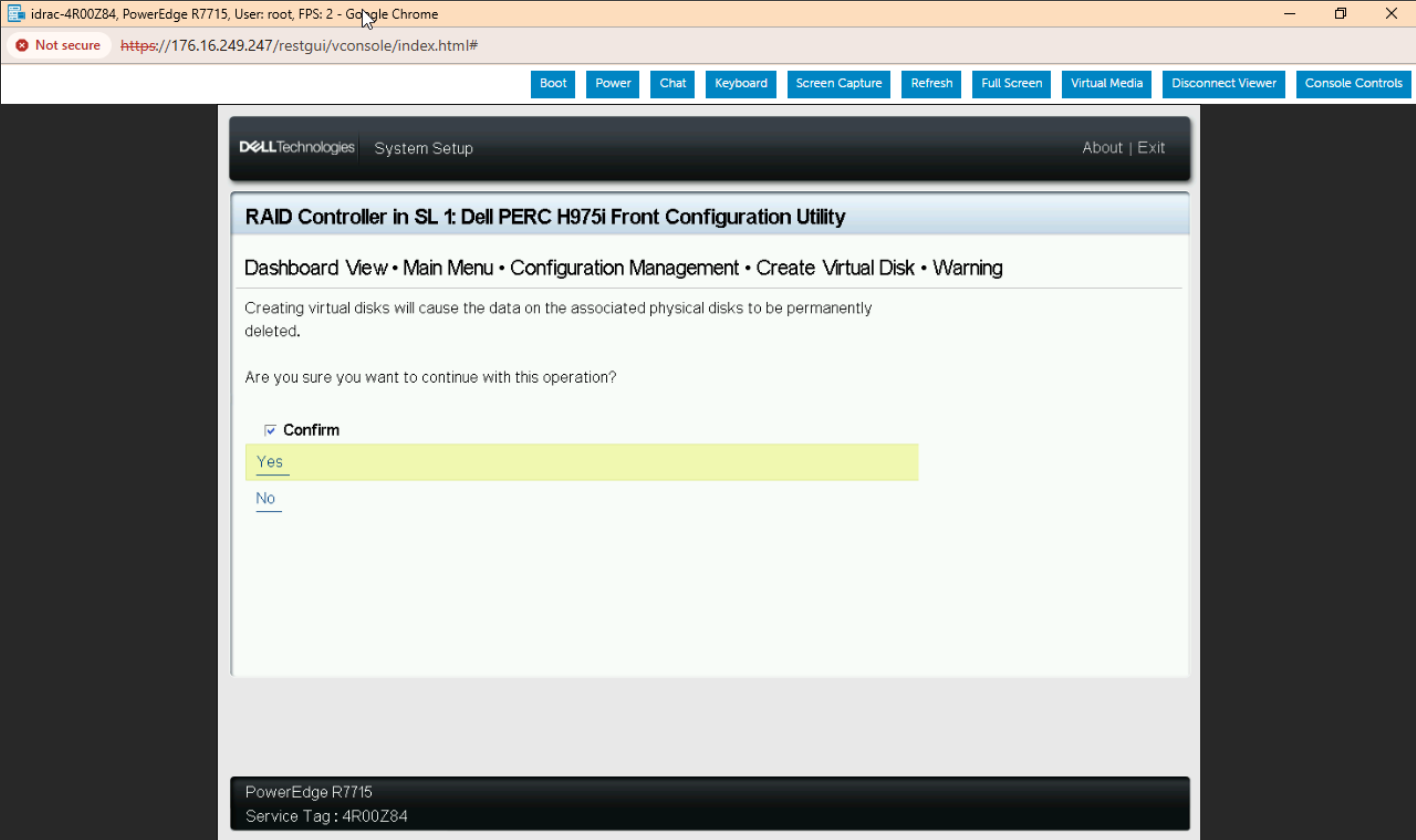
Before finalizing the virtual disk creation, the system displays a warning that confirms all data on the selected physical disks will be permanently deleted. To proceed, we check the “Confirm” box and select “Yes” to authorize the operation. This safeguard helps prevent accidental data loss during the RAID creation process.
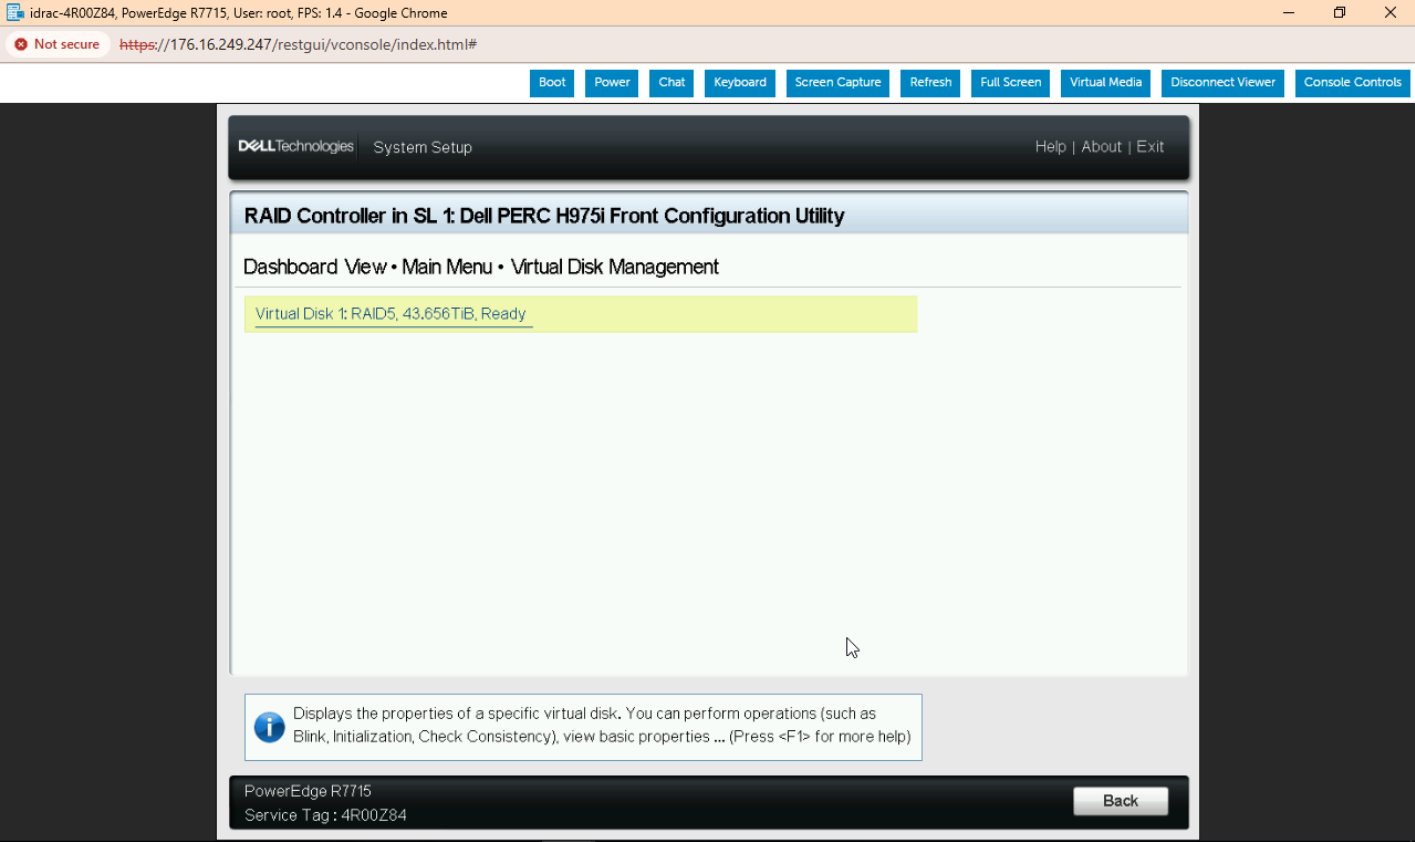
Once the virtual disk is created, it appears under the “Virtual Disk Management” menu. In this example, our new RAID 5 virtual disk is listed with a capacity of 43.656 TiB and a status of “Ready.” With just a few simple steps, the storage is configured and ready for use.
While the PERC BIOS Configuration Utility and iDRAC interface offer intuitive options for local and remote management, Dell also provides a powerful command-line tool called PERC CLI (perccli2). This utility supports Windows, Linux, and VMware, making it ideal for scripting, automation, or managing PERC controllers in headless environments. Dell also provides detailed documentation on installation and command usage for PERC CLI on their support site.
Dell PERC13 Performance Testing
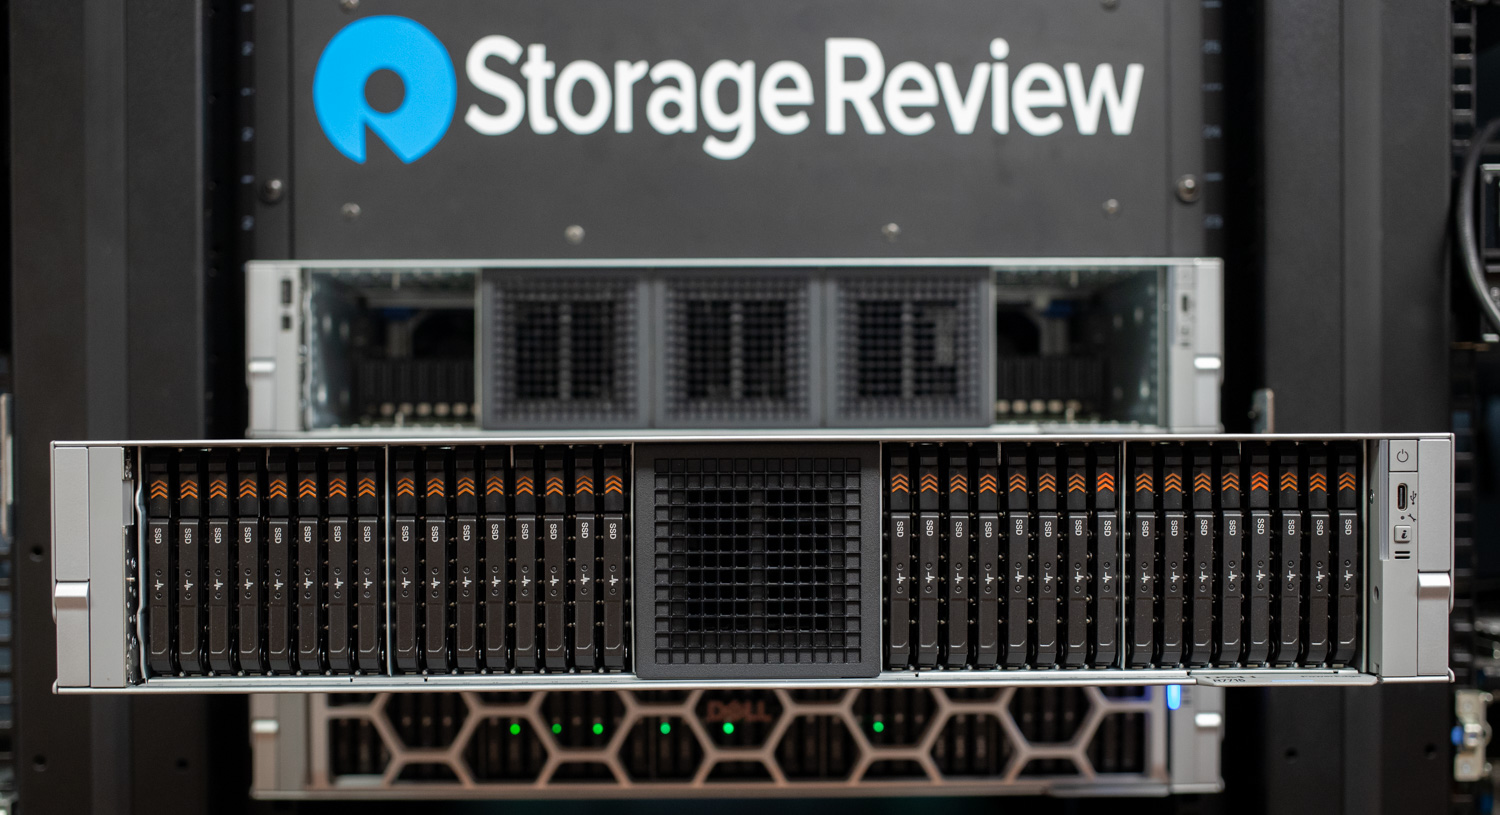
Before diving into performance testing, we prepared our environment using the Dell PowerEdge R7715 platform configured with dual PERC H975i front controllers. These were paired with thirty-two 3.2TB Dell NVMe drives, each rated for up to 12,000 MB/s sequential reads and 5,500 MB/s sequential writes using 128 KiB block sizes. This high-performance foundation enables us to push the limits of the PERC13 controller’s throughput and evaluate RAID behavior at scale.
- Platform: Dell PowerEdge R7715
- CPU: AMD EPYC 9655P 96-Core Processor
- Ram: 768GB (12 x 64GB) DDR5-5200 ECC
- Raid Controller: 2 x PERC13 H975i
- Storage: 32 x 3.2TB Dell CD8P NVMe Drives
- PCIe Accelerators: 2 x NVIDIA H100 GPU
NVIDIA Magnum IO GPU Direct Storage: AI Meets Storage
Modern AI pipelines are often I/O-bound, not compute-bound. Data batches, embeddings, and checkpoints must be transferred from storage to GPU memory quickly enough to keep accelerators busy. NVIDIA’s Magnum IO GDS (via cuFile) short-circuits the traditional “SSD → CPU DRAM → GPU” path and lets data DMA directly from NVMe to GPU memory. That removes CPU bounce-buffer overhead, lowers latency, and makes throughput more predictable under load, all of which translates to higher GPU utilization, shorter epoch times, and quicker checkpoint save/load cycles.
Our GDSIO test is geared to measure the storage-to-GPU data path itself, sweeping block sizes and thread counts to show how quickly PERC13-backed NVMe set can stream into H100 memory. With each H975i on a PCIe 5.0 x16 link (theoretical ~64 GB/s per controller, unidirectional), two controllers set an aggregate ceiling near ~112 GB/s; where our curves plateau tells you whether you’re link or media-limited. For practitioners, read the charts as proxies for real workloads: large sequential reads map to dataset streaming and checkpoint restores; large sequential writes map to checkpoint saves; smaller transfers with concurrency reflect dataloader shuffles and prefetch. In short, strong GDSIO scaling means fewer GPU stalls and more consistent performance during both training and high-throughput inference.
GDSIO Read Sequential Throughput
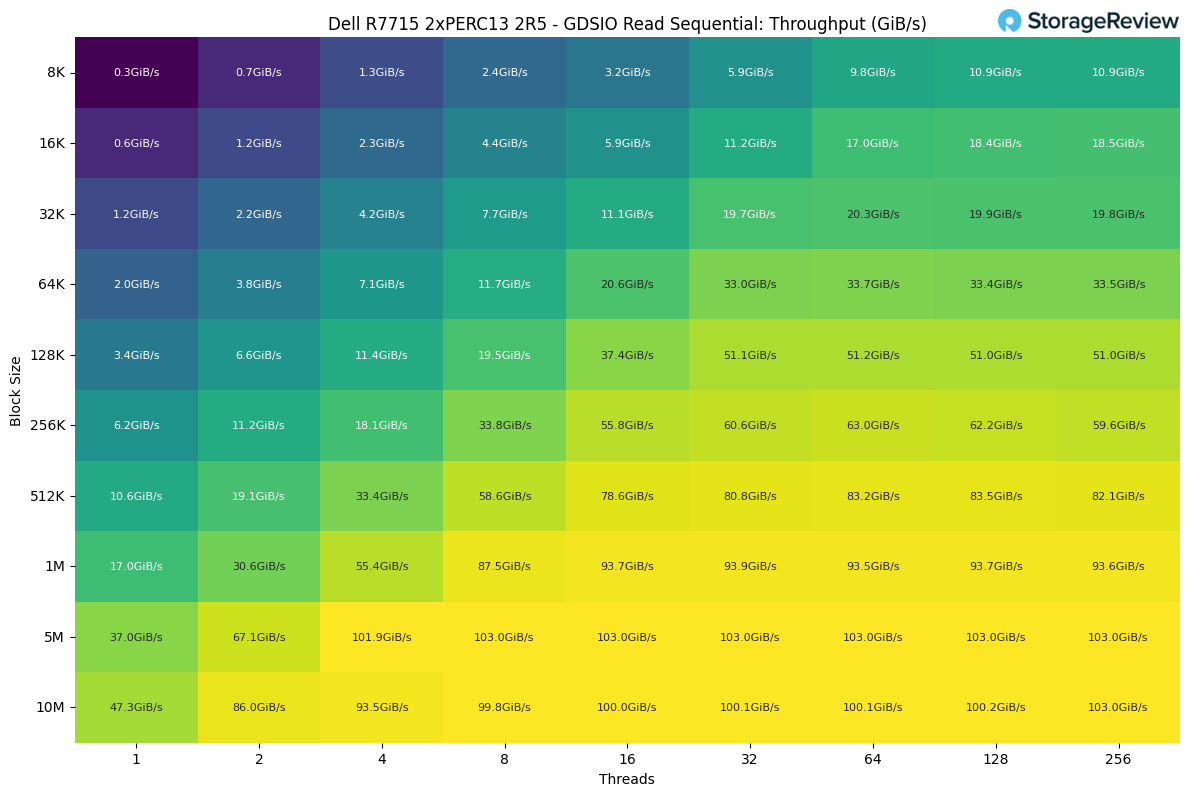
Starting with sequential read, throughput began modestly at lower block sizes and thread counts, starting around 0.3 GiB/s at 8K blocks with a single thread. Performance scaled sharply between 16K and 512K blocks, particularly when increasing thread count from 4 to 16. The most substantial gains occurred at 1M, 5M, and 10M block sizes, where throughput jumped dramatically, peaking at 103 GiB/s at 10M block size with 256 threads. This progression shows that the PERC13 array benefits from larger block sizes and multithreaded parallelism, with optimal saturation around 64-128 threads, beyond which gains plateau.
GDSIO Read Sequential Throughput Differential
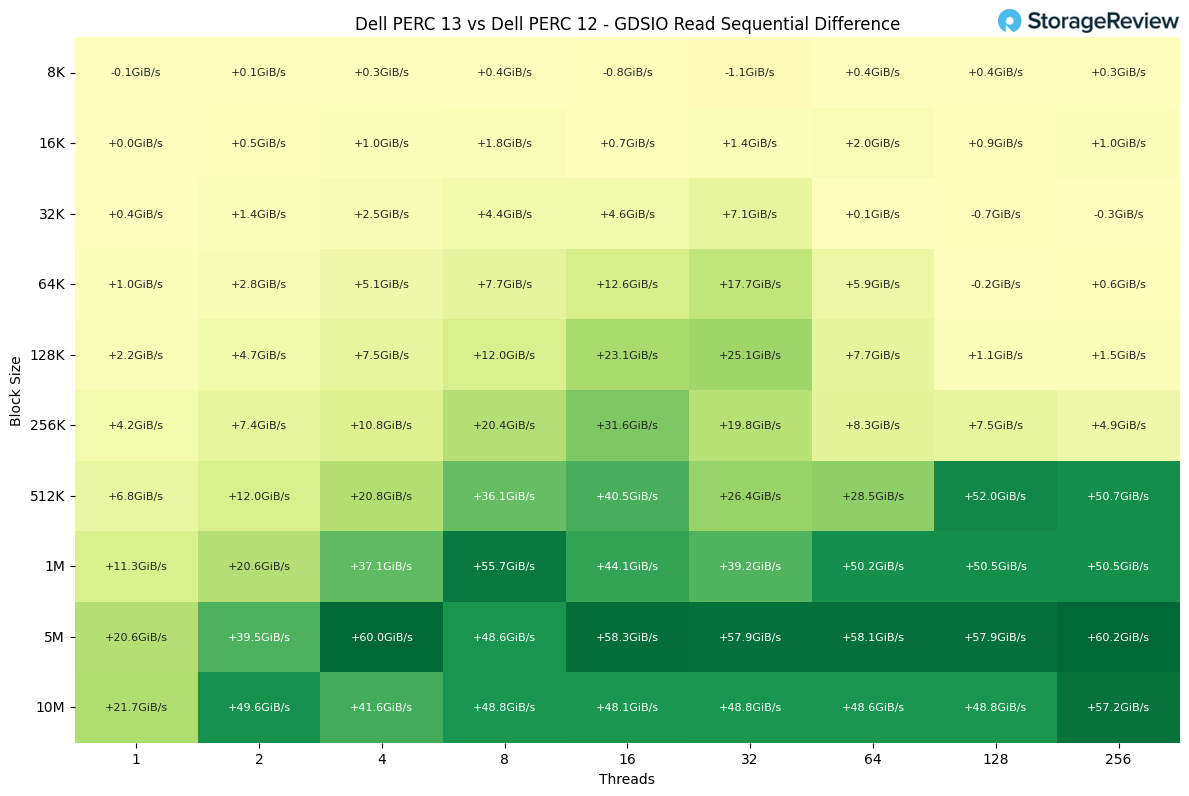
In sequential read testing across block sizes from 8K to 10M, the PERC13 (H975i) consistently outperformed the PERC12 (H965i), with percentage gains scaling dramatically at larger block sizes and higher thread counts.
At smaller block sizes (8K-16K), improvements were modest (typically ranging from 0-20%), and in some isolated cases the H975i trailed slightly due to test variability at low queue depths. By 32K-64K block sizes, the advantage became more consistent, with the H975i delivering 30-50% higher throughput across most thread counts.
The most significant differences were observed at larger block sizes (128K through 10M), where the PERC13 controller unlocked the full sequential read potential of the system. Here, the H975i demonstrated gains of 50-120% compared to the H965i. For example, at 1M block size with 8-16 threads, throughput was over 55 GiB/s higher, equating to roughly a 90% uplift. At block sizes of 5M and 10M, improvements regularly exceeded 100%, with some configurations showing nearly double the performance compared to the previous generation.
Overall, the PERC13 (H975i) established a commanding lead in sequential read workloads, especially as block size and thread count scaled. While smaller block sizes showed incremental improvement, at 256K and above, the newer controller consistently delivered 50-100%+ higher performance, clearly highlighting the architectural advancements in Dell’s latest RAID platform.
GDSIO Read Sequential Latency
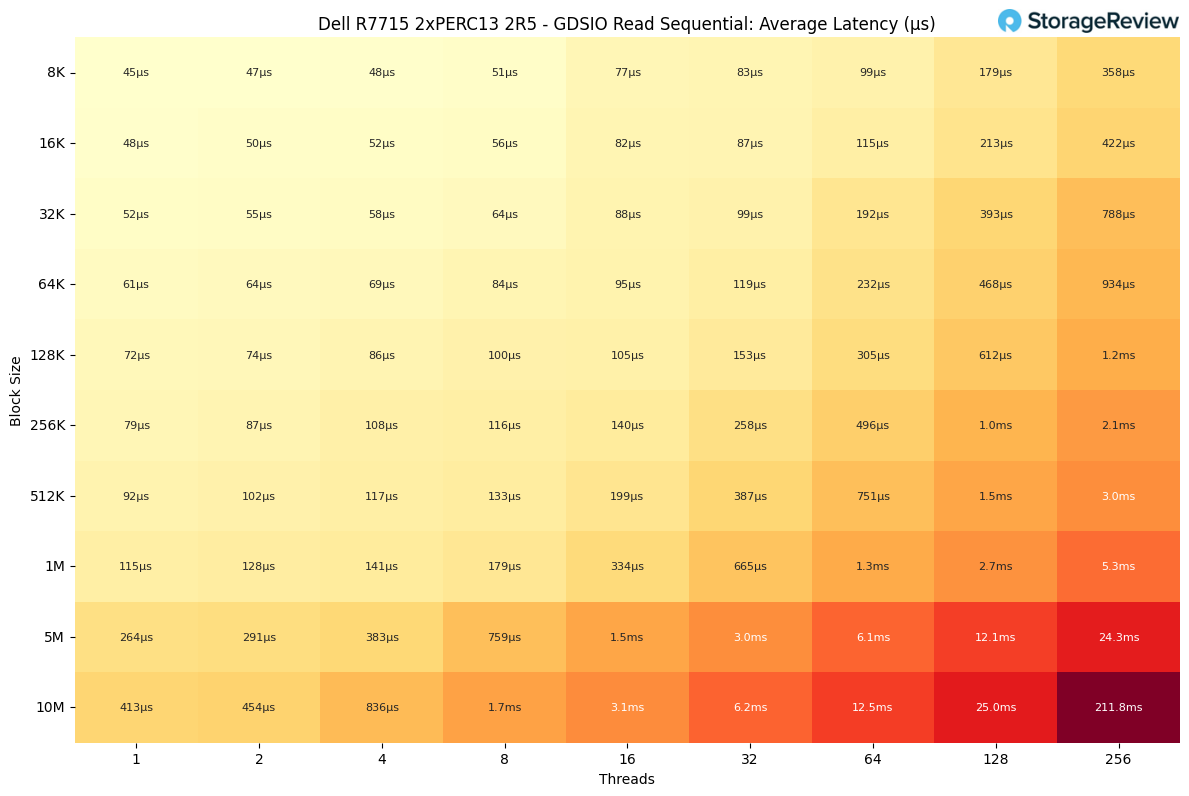
As sequential read throughput increased, latency remained manageable at smaller block sizes and lower thread counts. For example, latency stayed below 100 µs up to 64K blocks and 16 threads, showing efficient handling of reads in that range. Once block sizes and thread counts scaled higher, especially at 5M and 10M with 64 or more threads, latency climbed rapidly, peaking at 211.8 ms at a 10M block size with 256 threads. This highlights how controller or queuing bottlenecks emerge under extreme workloads, even though throughput remains high.
The best balance of performance and efficiency was observed at the 1M block size with 8-16 threads, where the array sustained 87.5-93.7 GiB/s throughput while keeping latency between 179-334 µs. This zone represents the sweet spot for maximizing bandwidth while keeping delays well under a millisecond.
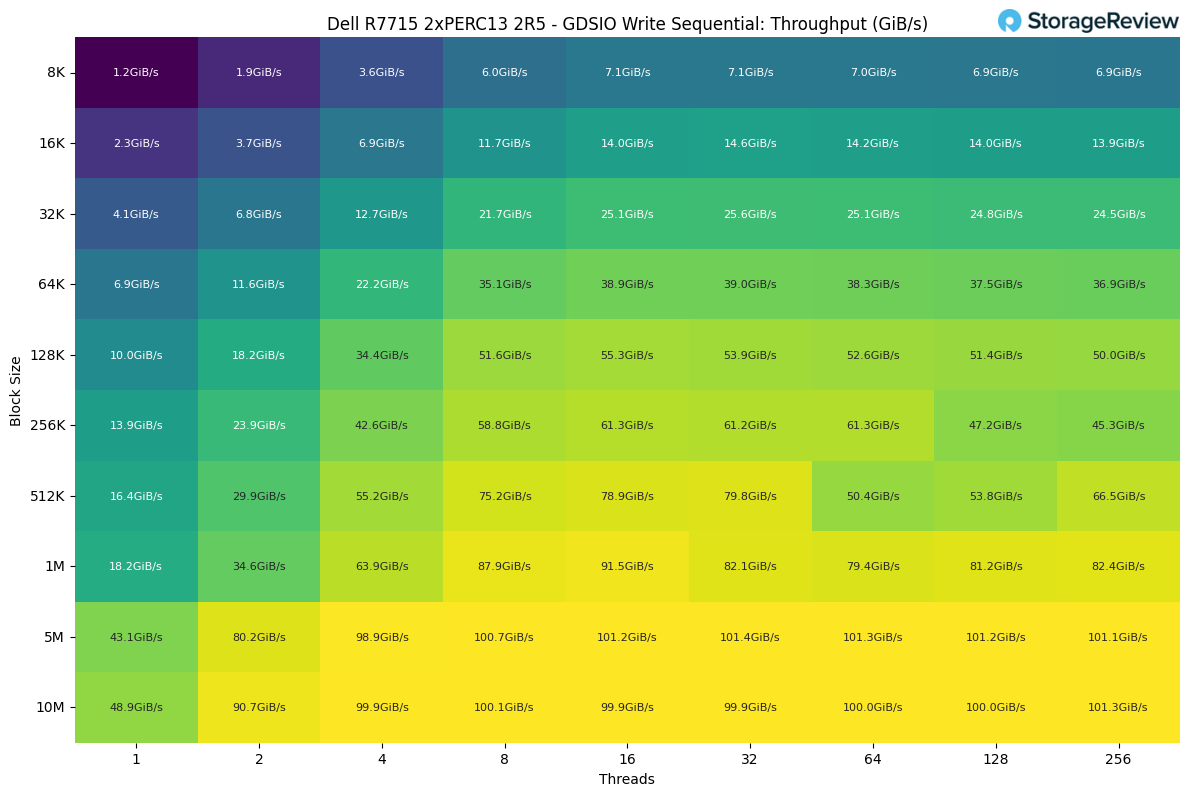
GDSIO Write Sequential Throughput
Write performance showed strong early scaling as block sizes increased, with throughput climbing from 1.2 GiB/s at 8K and 1 thread to 13.9 GiB/s by 256K. The most substantial growth appeared between 128K and 1M block sizes, where throughput reached over 80 GiB/s at 8 to 16 threads. Peak performance came at the 5M and 10M block sizes, sustaining 100 to 101 GiB/s from 8 threads onward.
Performance flattened across 8 to 64 threads for these larger blocks, indicating the controllers reached saturation early in the scaling curve. At higher thread counts, especially 128 and 256 threads, throughput stability varied, holding steady at large 5M and 10M blocks at 101 GiB/s but declining for mid-range block sizes, such as 256K, falling from 61.2 GiB/s at 32 threads to 45.3 GiB/s at 256 threads.
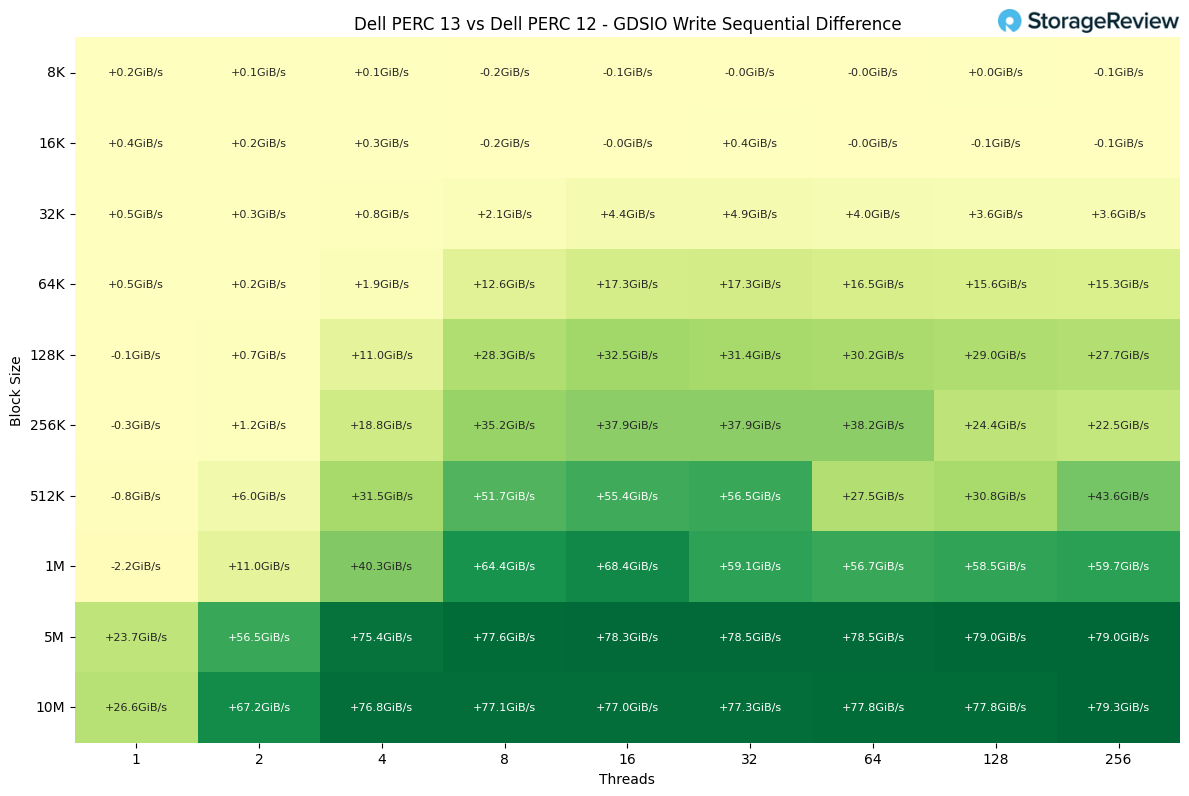
GDSIO Write Sequential Throughput Differential
In sequential write testing, the PERC13 (H975i) delivered substantial gains over the PERC12 (H965i), particularly as block sizes and thread counts scaled. At small block sizes (8K-32K), improvements were modest, generally within 0-10%, with occasional test noise showing negligible differences.
From 64K onward, the advantage of the H975i became more pronounced. At 64K block size, improvements reached 40-70%, with throughput rising by more than 12-17 GiB/s compared to the H965i. At 128K-256K, the uplift grew stronger, where the H975i consistently delivered 50-70% higher throughput at moderate to high thread counts.
The most dramatic performance gap appeared at larger block sizes (512K through 10M). At 512K, the H975i achieved gains of +31 to +56 GiB/s, equating to 60-80% improvement over the H965i. At 1M block size, the lead extended further, with throughput jumps of +40 to +68 GiB/s, representing 70-90% gains. Finally, at 5M and 10M block sizes, the PERC 13 nearly doubled throughput compared to the PERC 12, with deltas of +75 to +79 GiB/s, translating into 100% improvement in some thread-rich scenarios.
Overall, the PERC 13 controller showed a clear generational leap in sequential write performance. While differences are minor at the smallest block sizes, once workloads scale past 64K, the H975i consistently delivers 50–100% higher throughput, firmly establishing its superiority over the H965i in write-intensive sequential workloads.
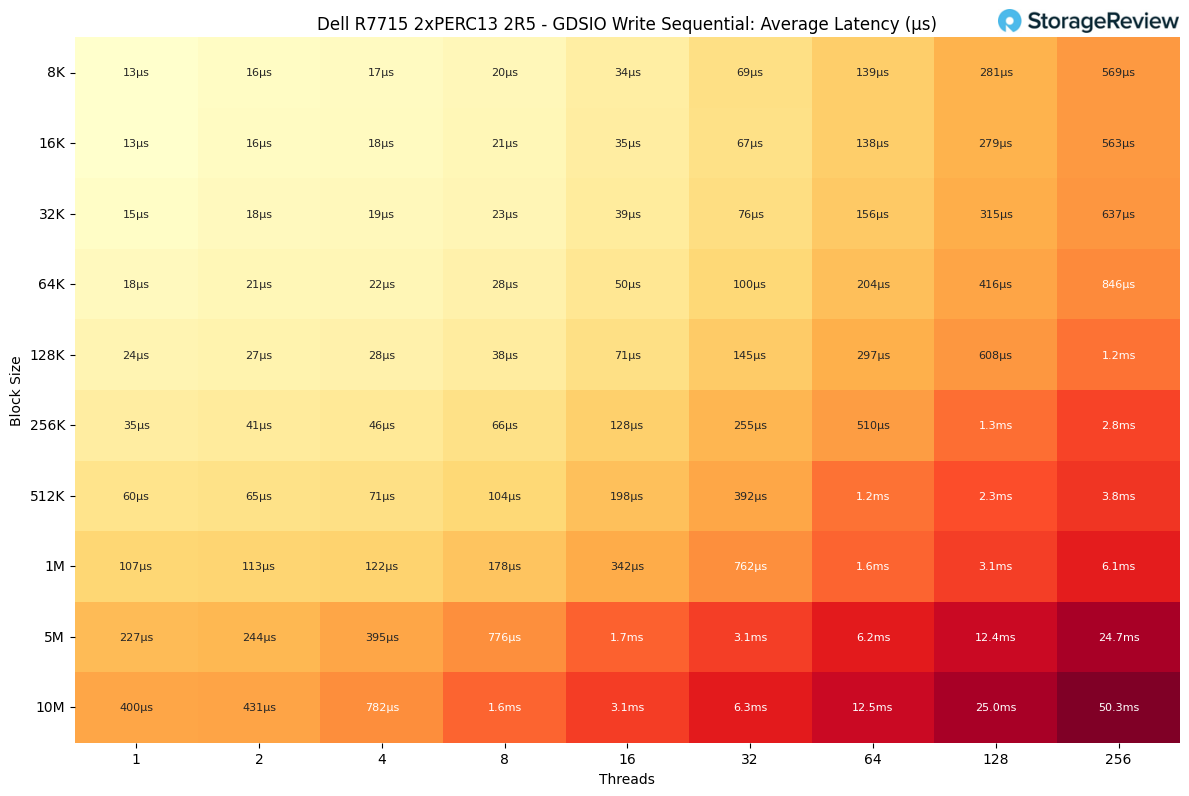
GDSIO Write Sequential Latency
Latency during sequential writes remained impressively low at smaller block sizes and lower thread counts, often staying under 50 µs through 128K blocks with up to 8 threads. As thread counts increased, latency scaled more noticeably. For example, latency reached 392 µs at 512K with 32 threads and exceeded 1 ms at 1M block size with 64 threads.
Saturation effects became more evident at the largest block sizes and highest concurrency levels. Latency rose to 12.4 ms at 5M with 128 threads and peaked at 50.3 ms at 10M with 256 threads.
The most efficient operating point for sequential write workloads occurred at the 1M or 5M block sizes with 8 to 16 threads, where throughput reached 87.9 to 101.2 GiB/s while latency remained within 178 µs – 1.7 ms, providing strong sustained performance without triggering excessive write queue delays.
MLPerf Storage 2.0 Performance
To evaluate real-world performance in AI training environments, we utilized the MLPerf Storage 2.0 test suite. MLPerf Storage is specifically designed to test I/O patterns in real, simulated deep learning workloads. It provides insights into how storage systems handle challenges such as checkpointing and model training.
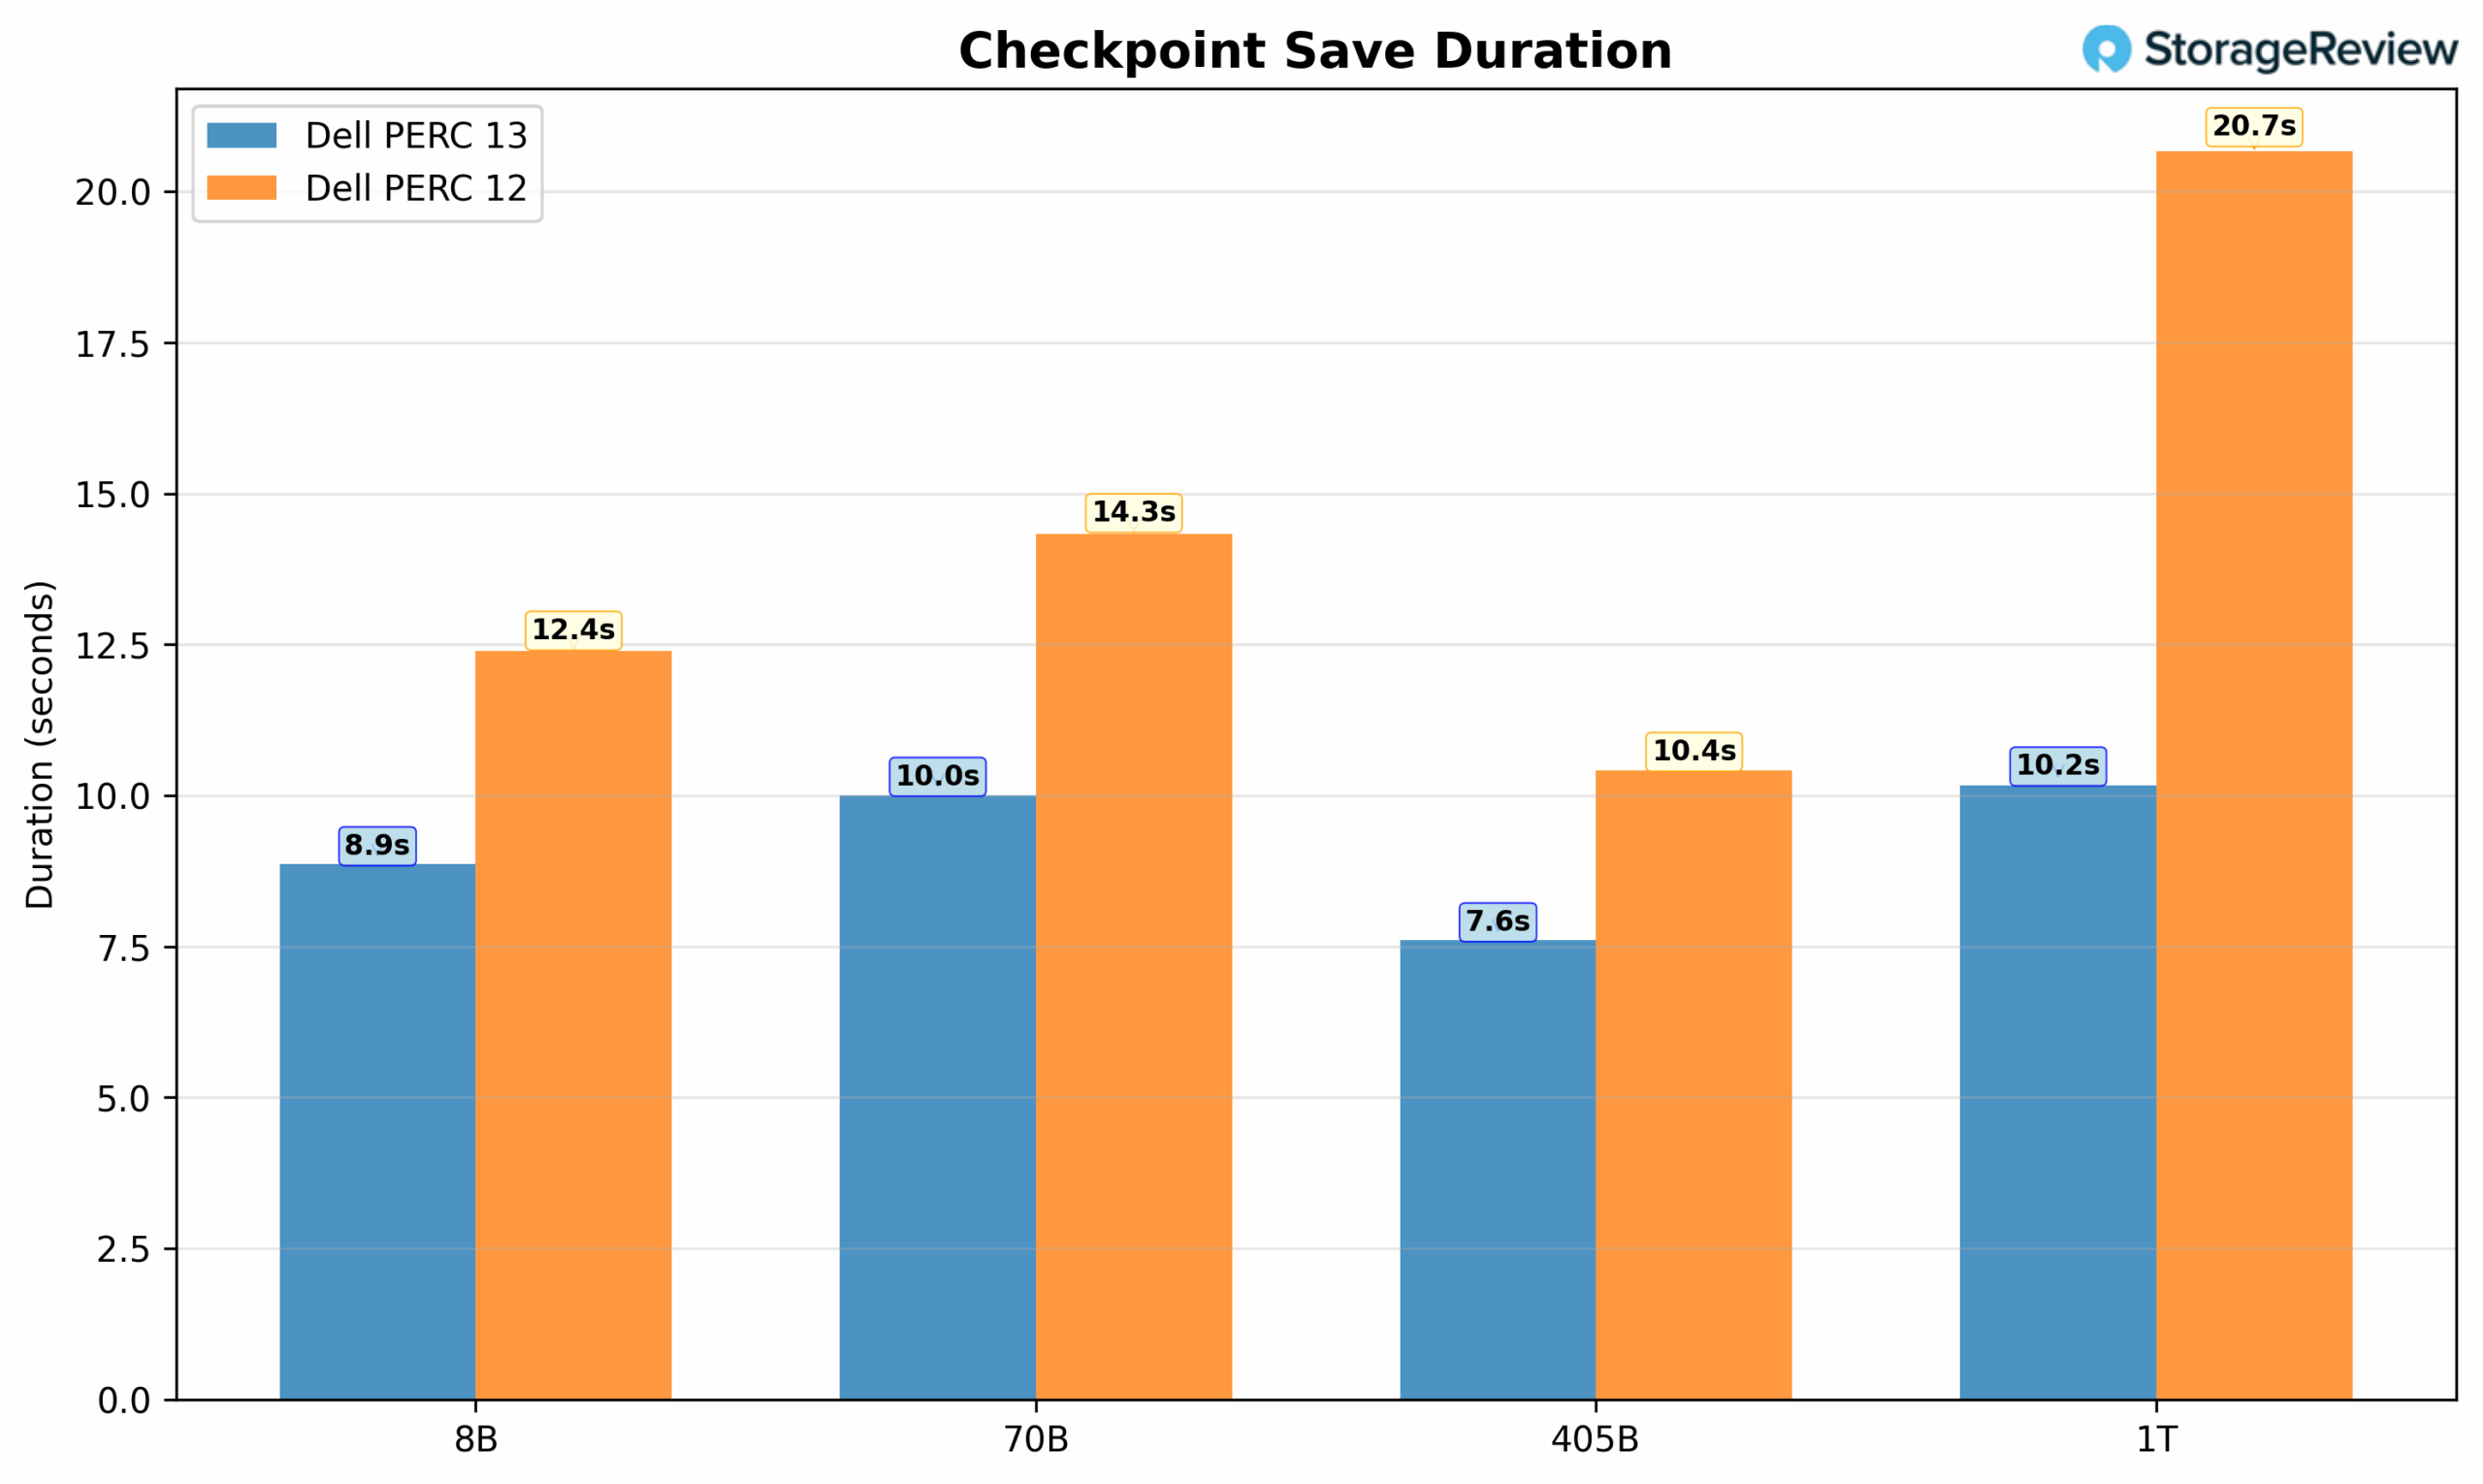
Checkpointing Benchmark
When training machine learning models, checkpoints are essential for periodically saving the model’s state. This helps prevent loss of progress due to interruptions, such as hardware failures, enables early stopping during training, and allows researchers to branch from various checkpoints for experiments and ablations.
The checkpoint save duration comparison revealed that Dell PERC13 consistently outperformed PERC12 across all model configurations. PERC 13 achieved save times ranging from 7.61 to 10.17 seconds, while PERC12 required 10.41 to 20.67 seconds for the same operations. The performance gap was most pronounced with the 1T parameter model, where PERC13 completed saves in just over 10 seconds compared to PERC12’s 20+ seconds. This represents approximately a 50% reduction in save time for the largest models.
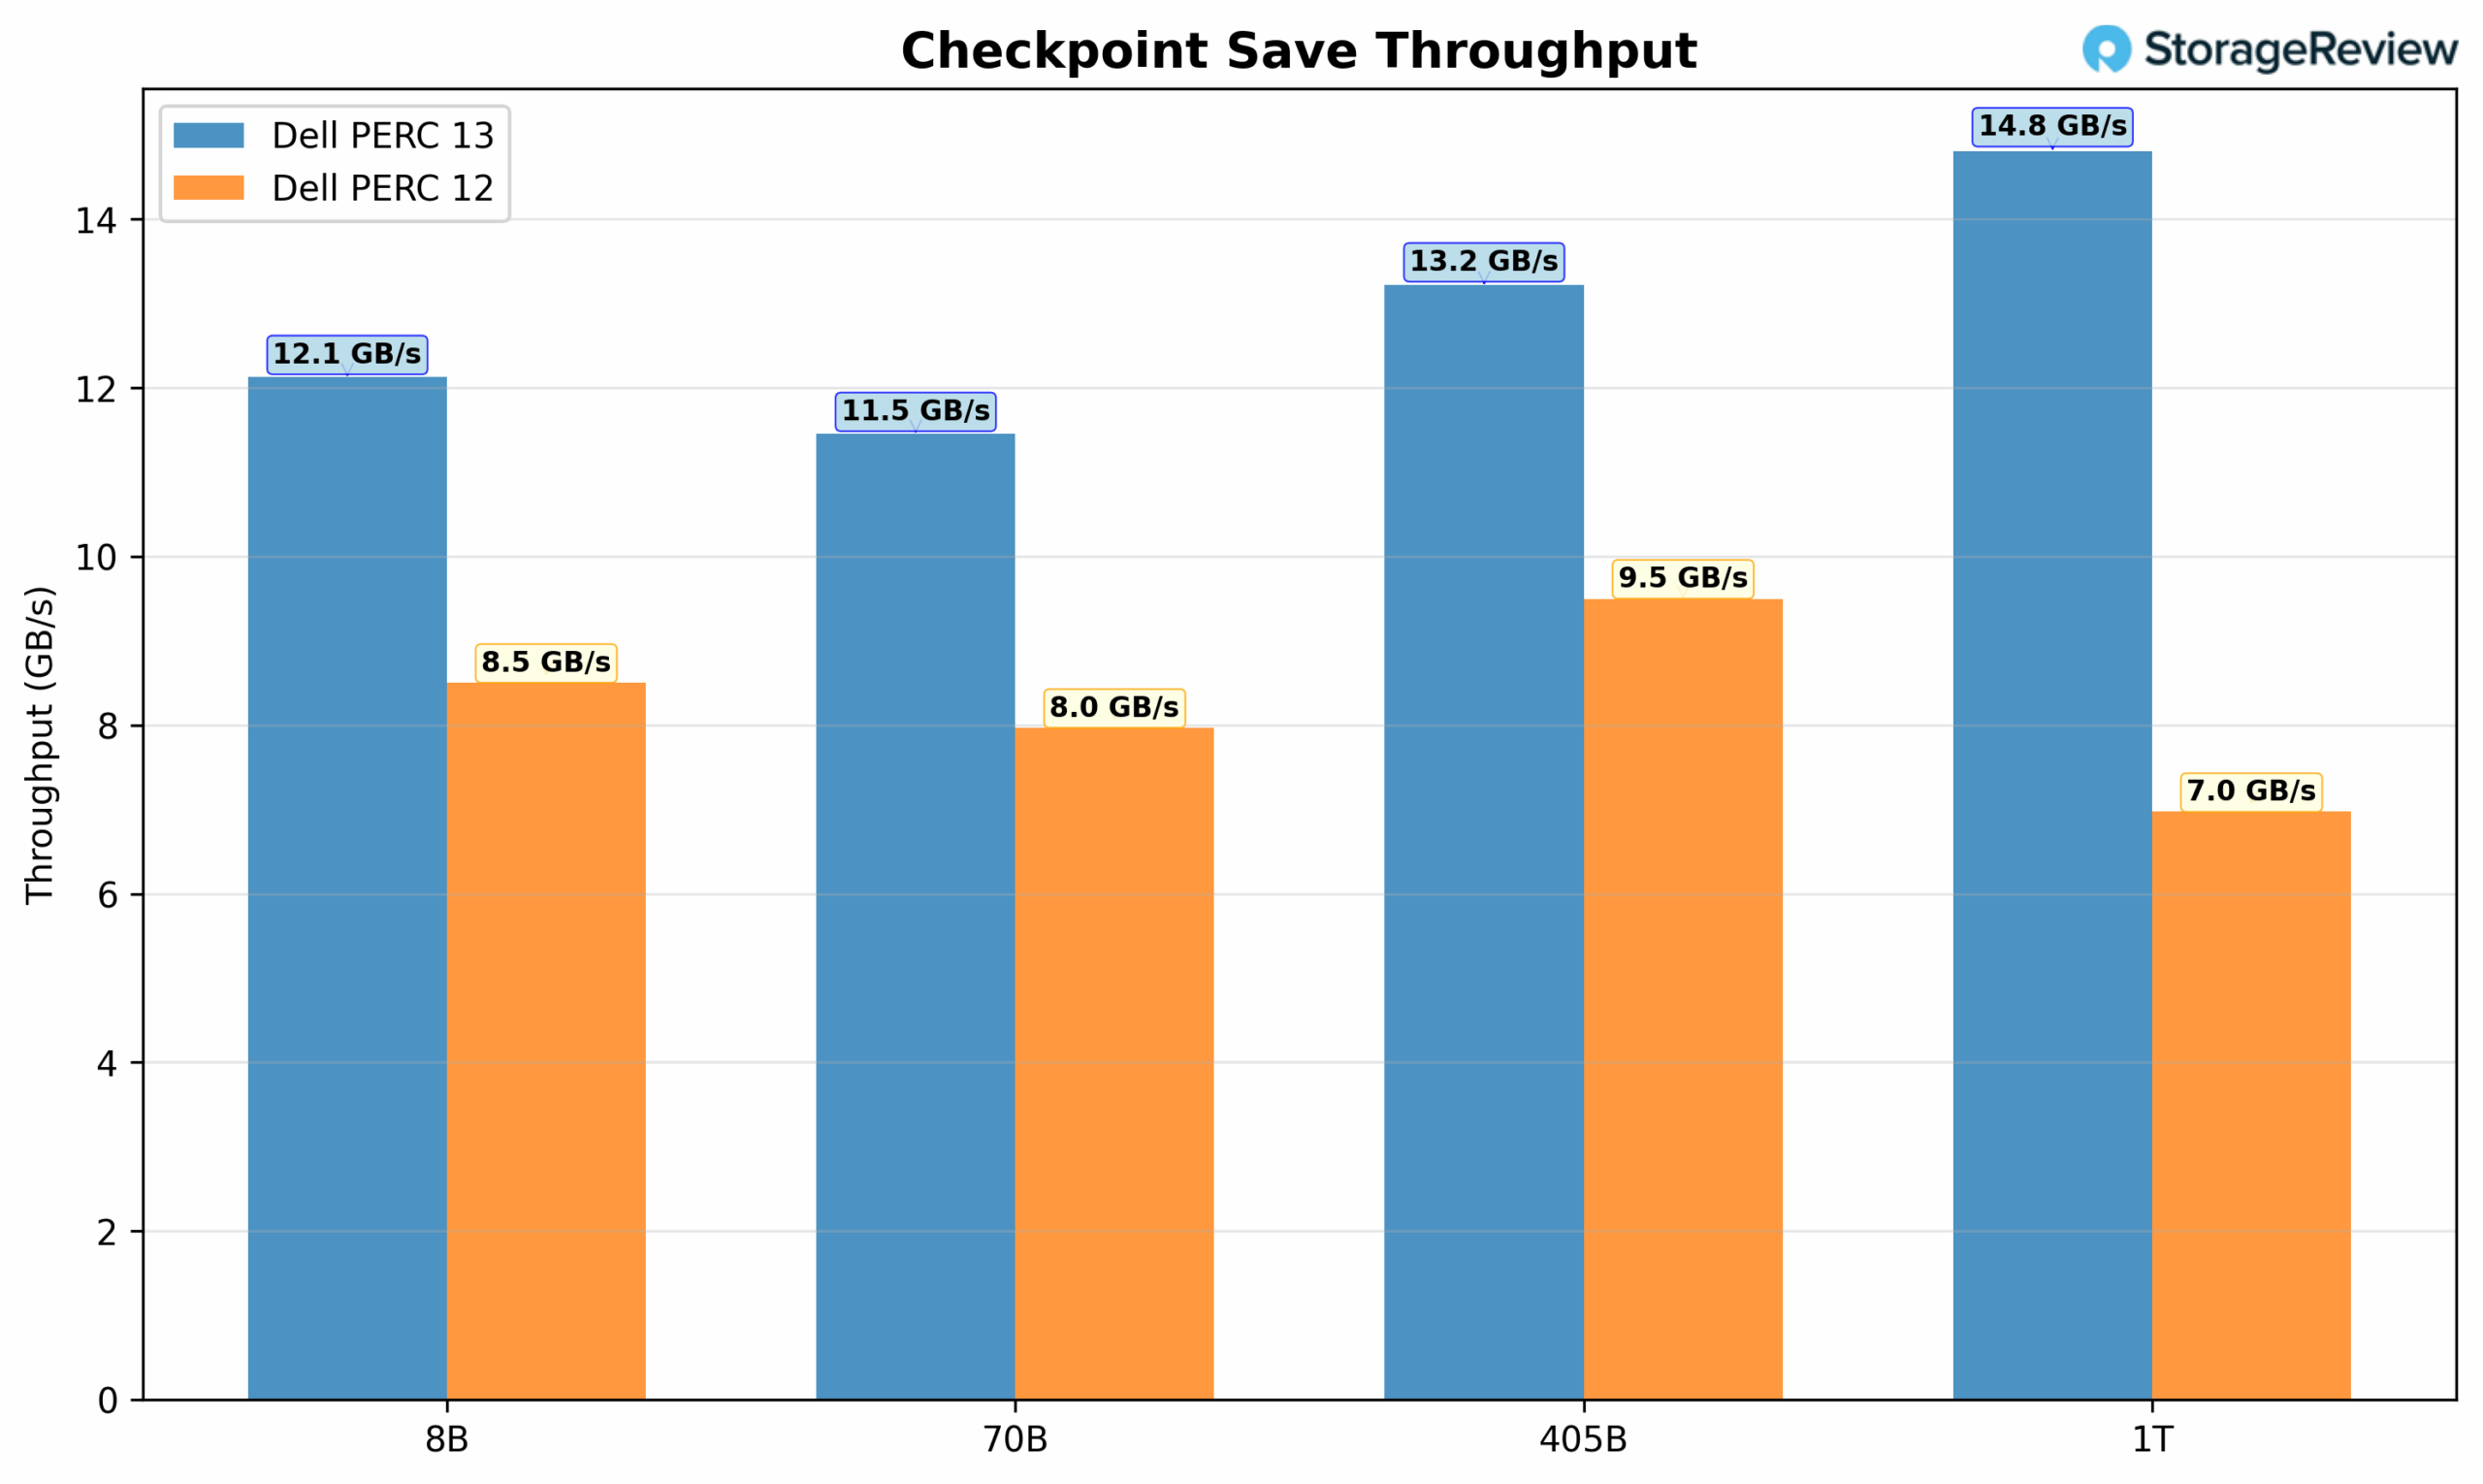
Examining the Save throughput results, the data showcases PERC13’s superior bandwidth utilization, consistently delivering higher data transfer rates. PERC13 achieves throughput between 11.46 and 14.81 GB/s, with peak performance on the 1T model. In contrast, PERC12 tops out at 9.49 GB/s and drops to 6.98 GB/s for the largest configuration. The newer controller maintains more stable performance across different model sizes, suggesting better optimization for handling large sequential writes typical of checkpoint operations.
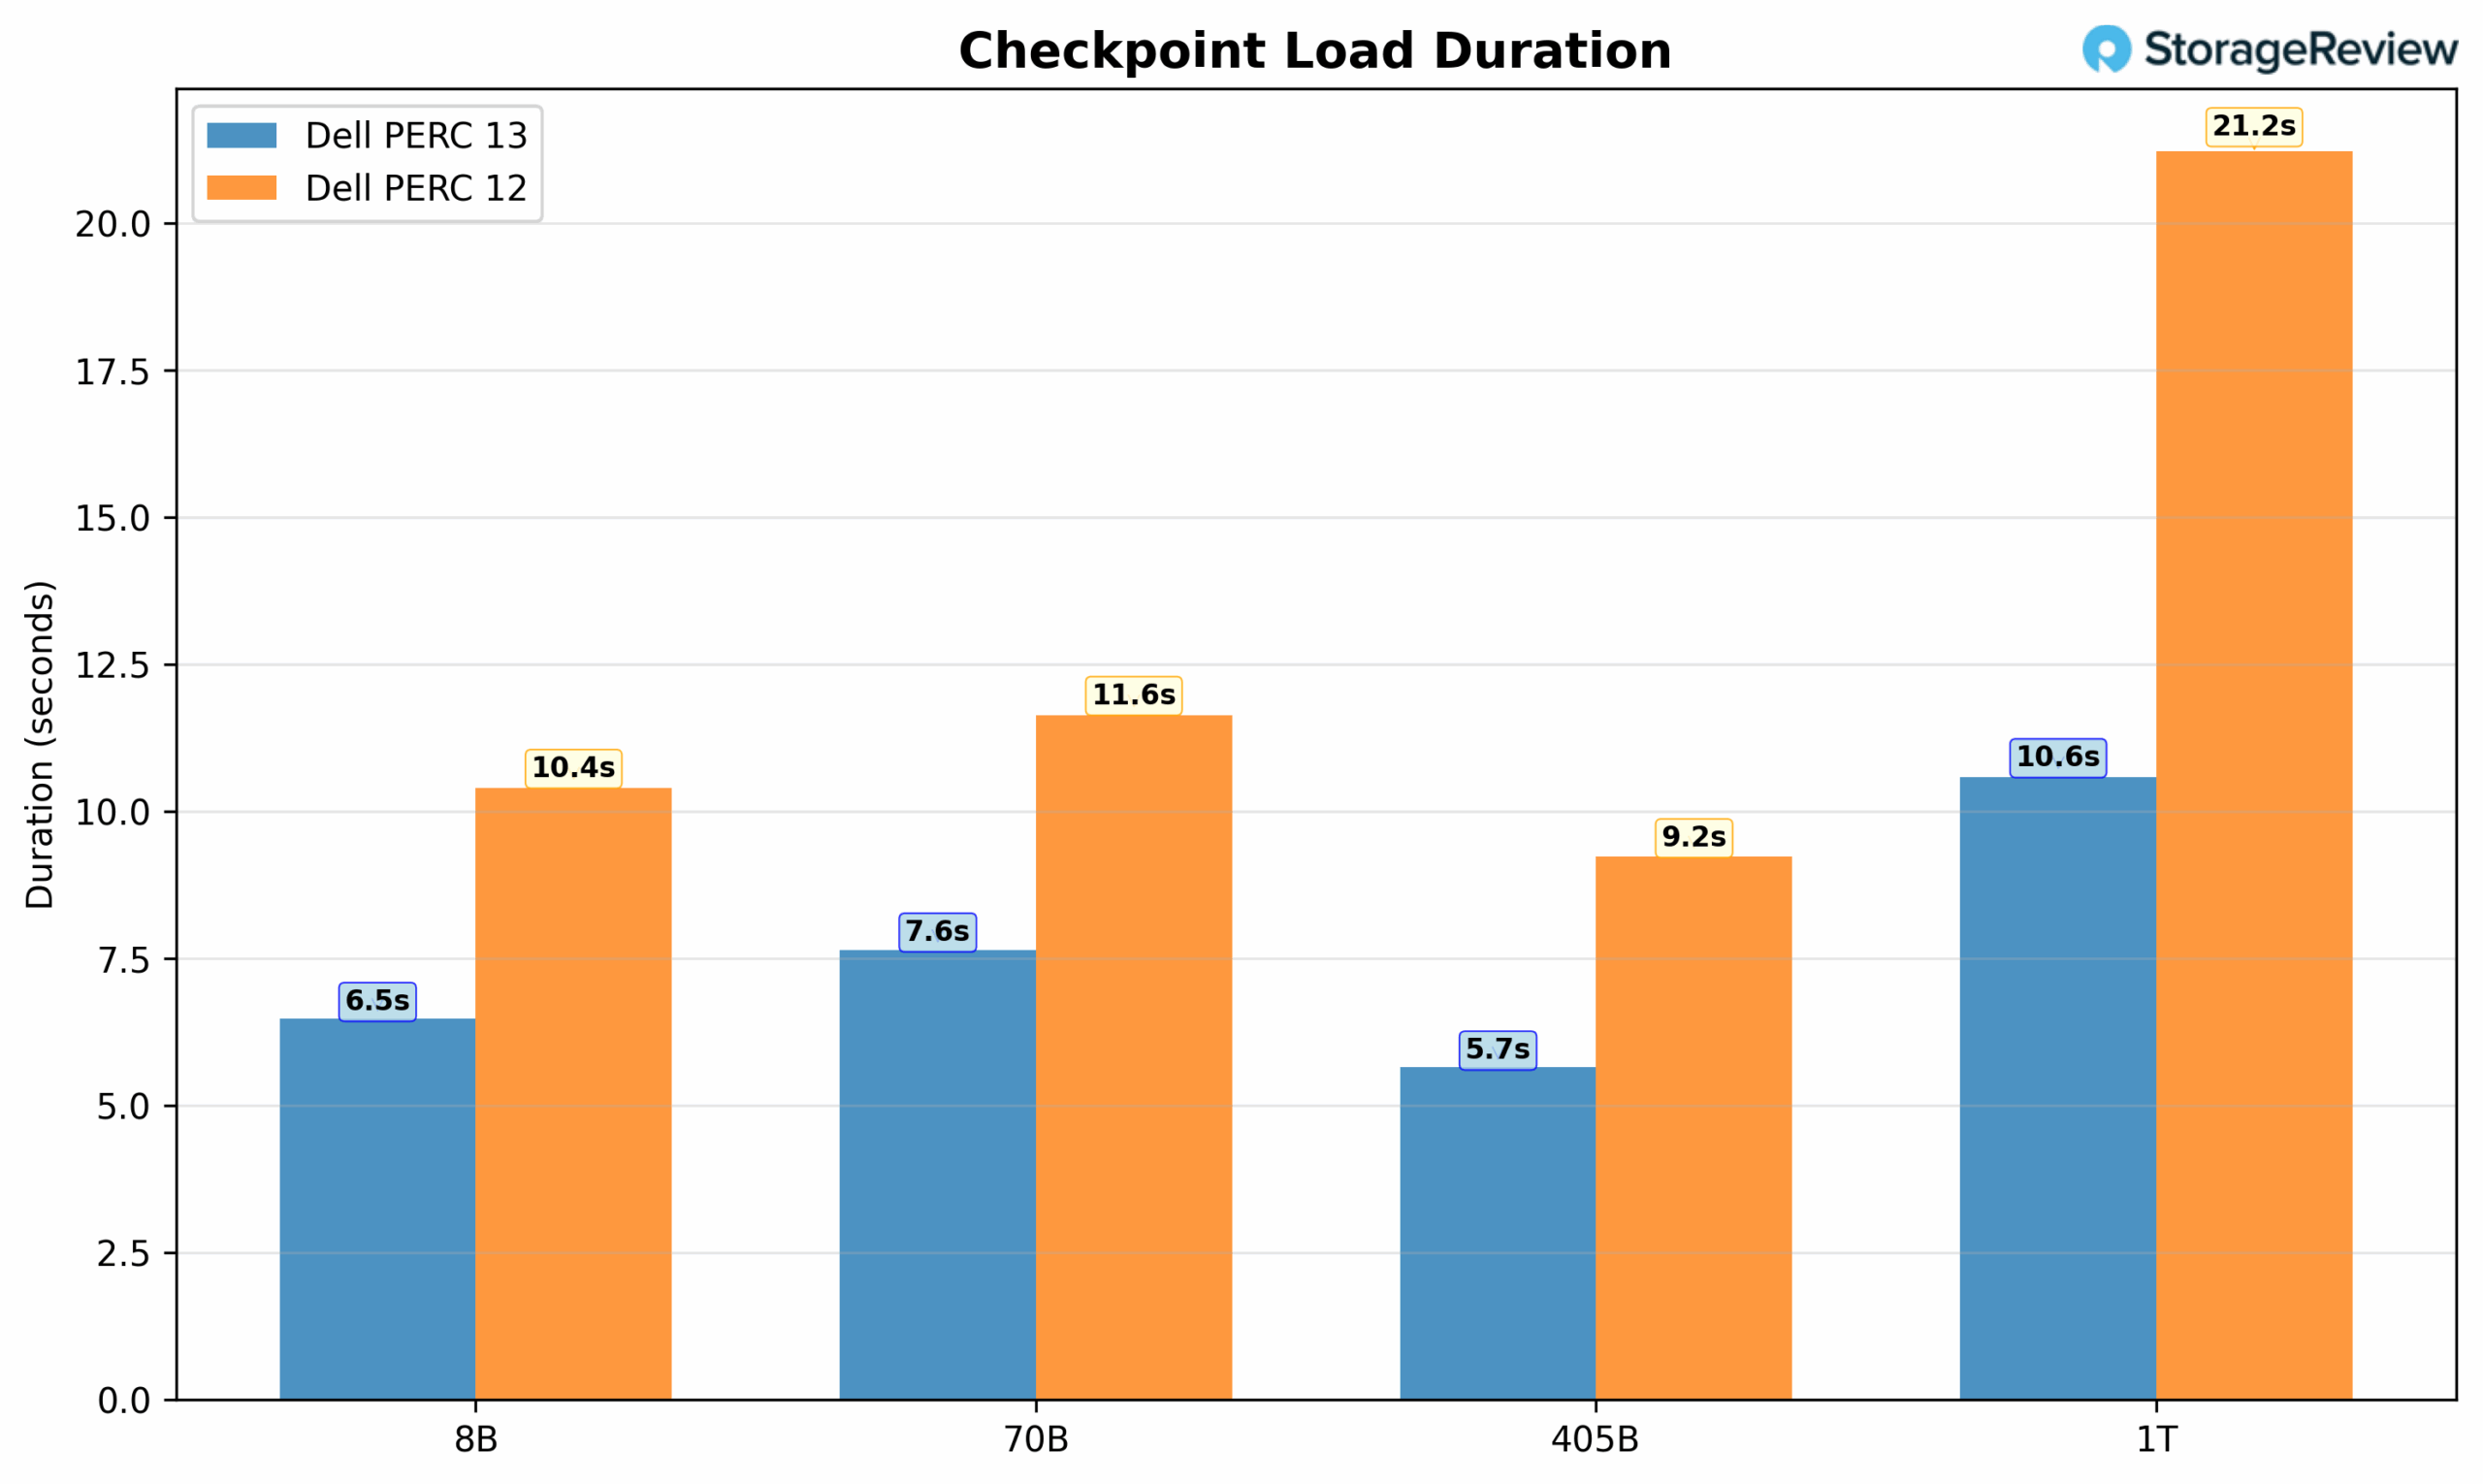
Load duration comparisons show similar advantages for PERC13, though the performance differential varies by model size. For smaller models (8B, 70B), PERC 13 loaded checkpoints approximately 35-40% faster than PERC12. However, again we saw the most dramatic improvement with the 1T model, where PERC13 loaded in 10.58 seconds versus PERC12’s 21.22 seconds (nearly a 50% reduction). This faster recovery time is crucial for minimizing downtime when resuming training from checkpoints after interruptions.
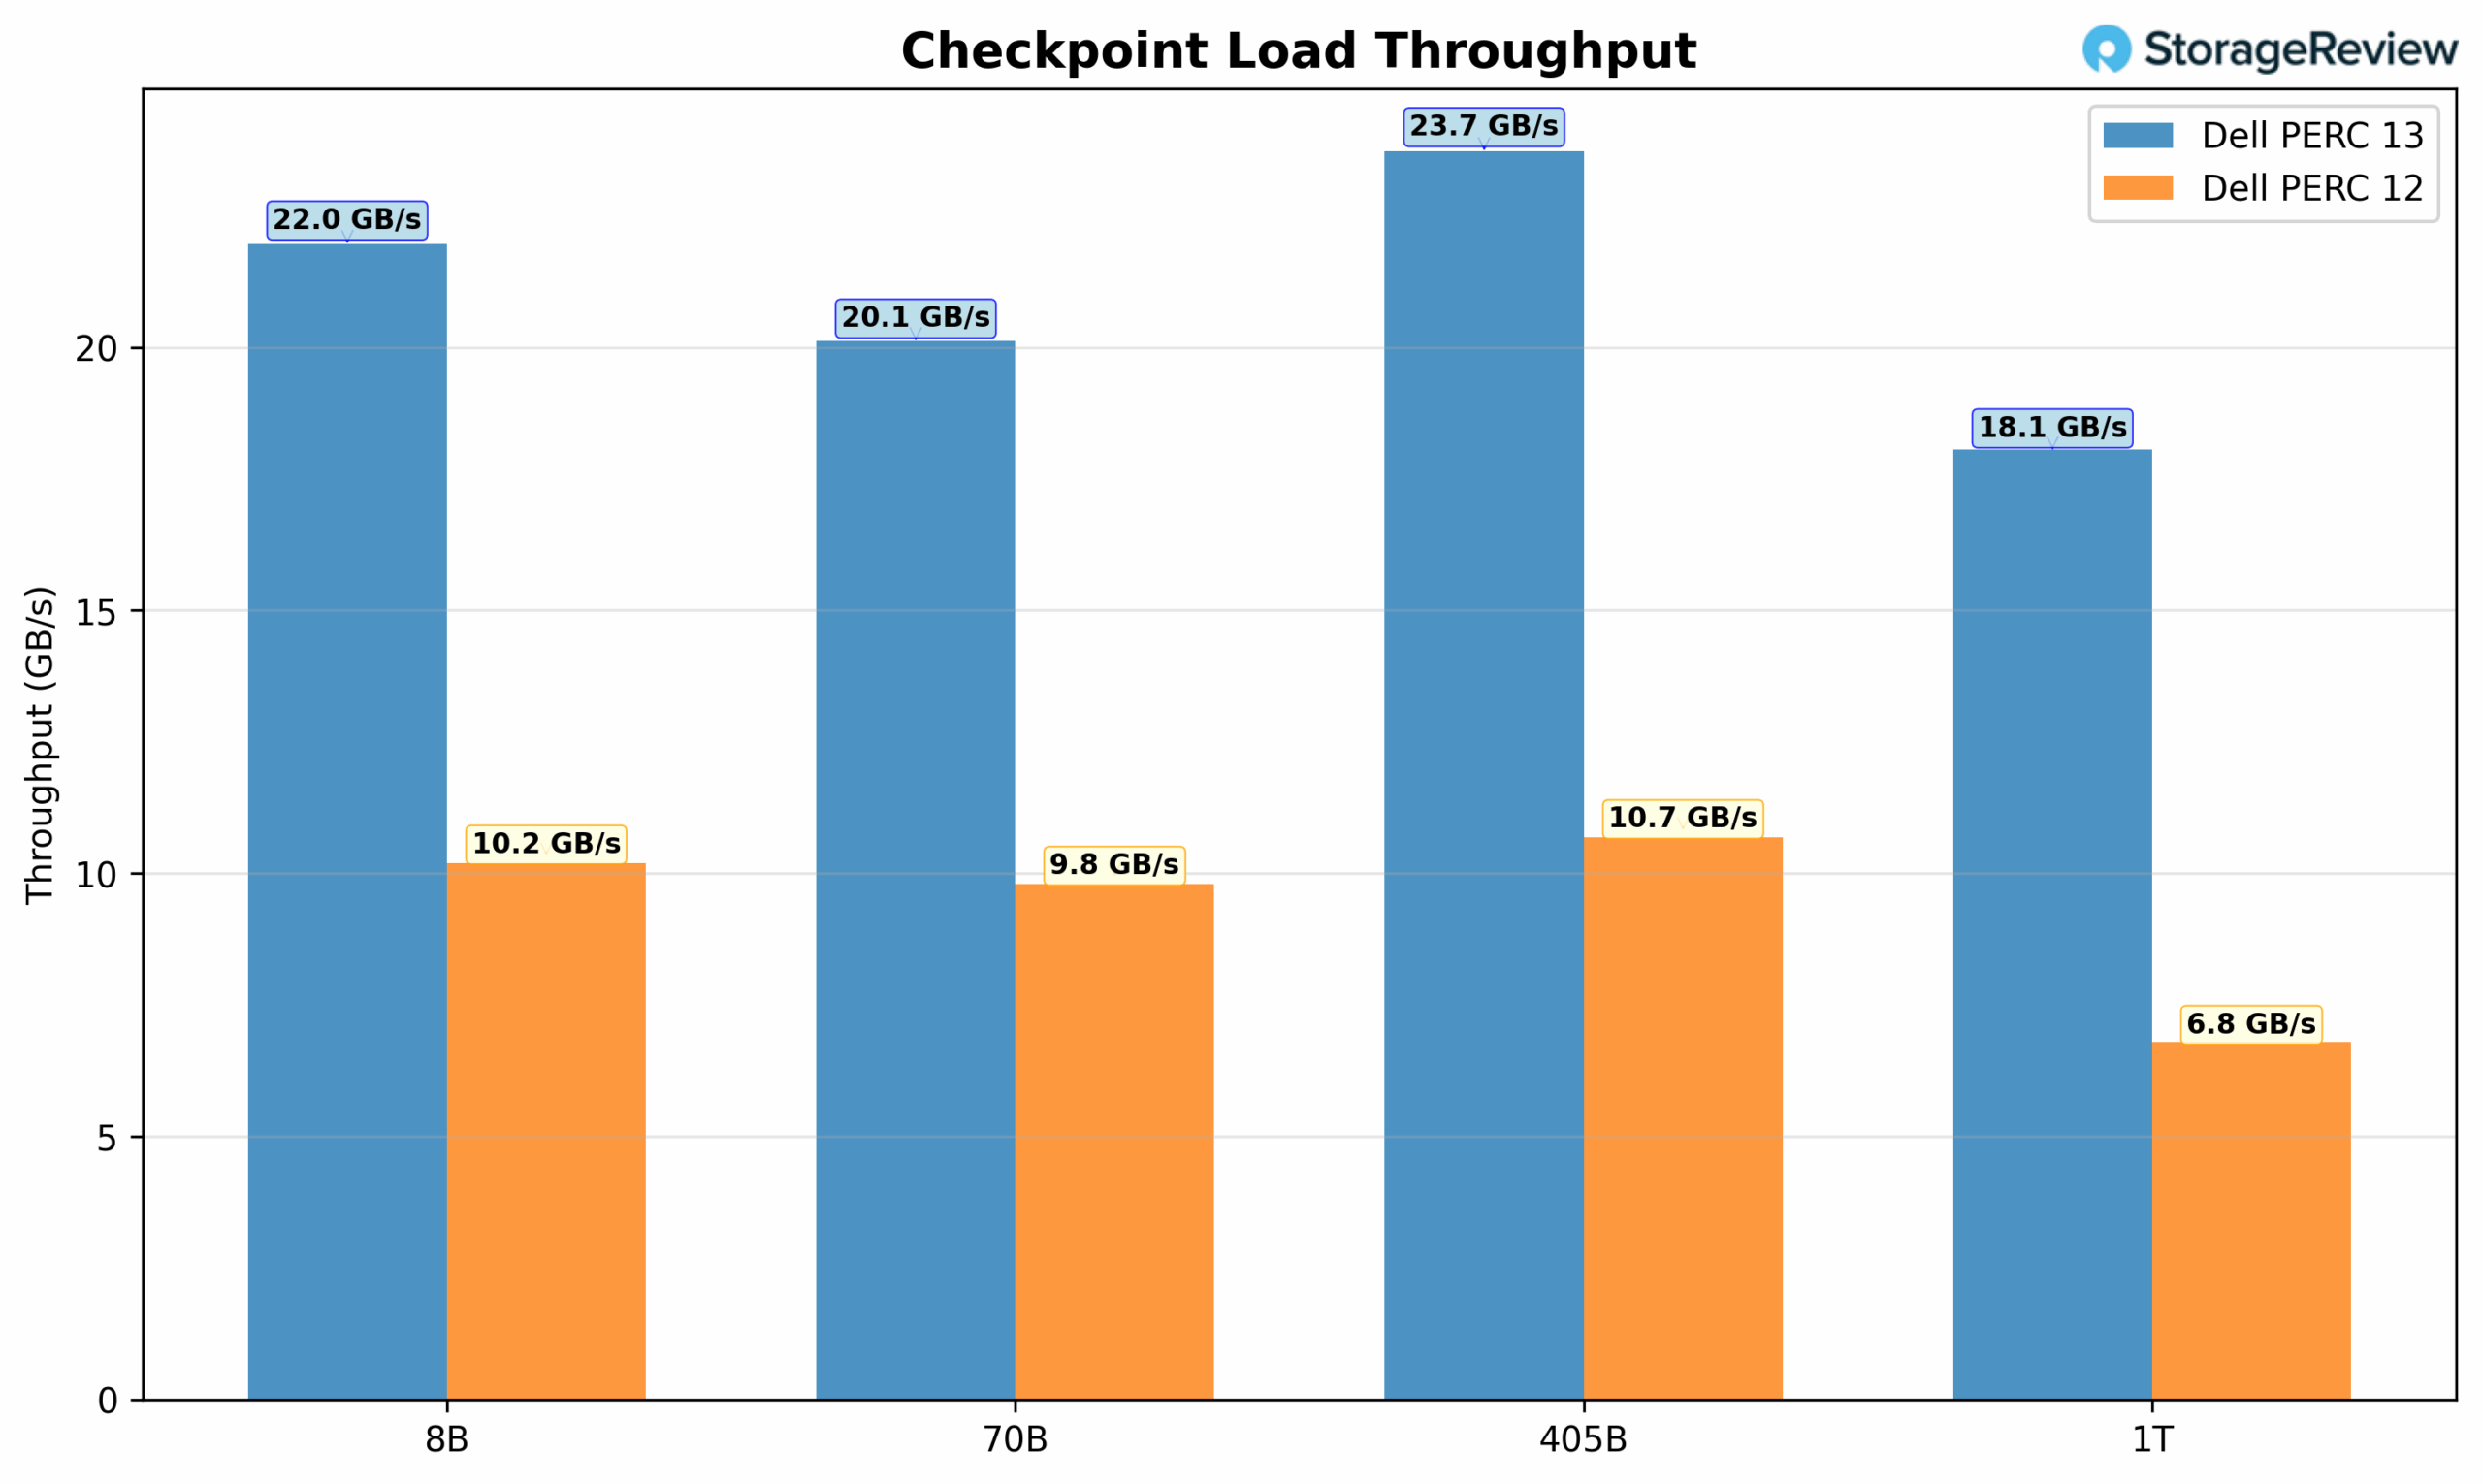
Finally, when examining the Load throughput metrics, PERC13 demonstrates a clear performance advantage, consistently maintaining throughput above 18 GB/s across all configurations and reaching a peak of 23.73 GB/s on the 405B model. In contrast, PERC12 showed lower performance, ranging from 6.8 GB/s to 10.68 GB/s.
FIO Performance Benchmark
While new testing approaches were incorporated into this review, to highlight the improvements, we brought forward some of the data from our last piece on Dell’s PERC12 controller, showcasing the difference in peak bandwidth and peak throughput.
To say PERC13 brings improvements is putting things lightly. With a single RAID5 volume on each controller, we measured an 88% jump in read bandwidth, a 318% increase in write bandwidth, a 31% jump in 4K random read performance, and a stunning 466% jump in 4K random write performance. This isn’t the absolute peak performance of the PERC 13 controller; higher speeds are possible with more virtual disks. However, this result reflects the single-namespace performance when maximizing total capacity.
| Workload | Dual PERC 12 (2 x RAID5) | Dual PERC 13 (2 x RAID5) | Performance Increase |
|---|---|---|---|
| 128K Sequential Reads | 56,107 (MB/s) | 105,227 (MB/s) | 88% |
| 128K Sequential Writes | 24,351 (MB/s) | 101,723 (MB/s) | 318% |
| 4KB Random Reads | 13,205,656 (IOPs) | 17,342,057 (IOPs) | 31% |
| 4KB Random Writes | 1,725,198 (IOPs) | 9,758,677 (IOPs) | 466% |
We focused on the performance of the Dell PERC H975i and PERC H965i controllers, leveraging RAID 5, which offers an excellent mix of capacity with parity protection. We examined multiple virtual disk (VD) configurations on the Dell PERC H975i: 8 VDs in RAID 5 (8R5), 4 VDs in RAID 5 (4R5), and 2 VDs in RAID 5 (2R5). We also tested two configurations on Dell PERC H965i: 4 VDs in RAID 5 (4R5) and 2 VDs in RAID 5 (2R5). The configurations were chosen based on the number of SSDs each controller can manage. The newest PERC 13 controller can manage up to 16 SSDs, which can be easily divided into up to 4 RAID 5 groups of 4 SSDs each. The older PERC12 could only manage 8 SSDs, which limited it to testing at most 2 RAID5 SSD groups. This configuration means that in the case of an 8R5 system, we have four 4-drive RAID 5s on each PERC RAID Controller.
Each configuration underwent an identical benchmarking process, beginning with a preconditioning phase consisting of two full device writes using sequential workloads. After reaching steady-state, we measured performance across a variety of access patterns. Before each new workload test, we reissued a preconditioning cycle using the corresponding transfer size to ensure consistency in results.
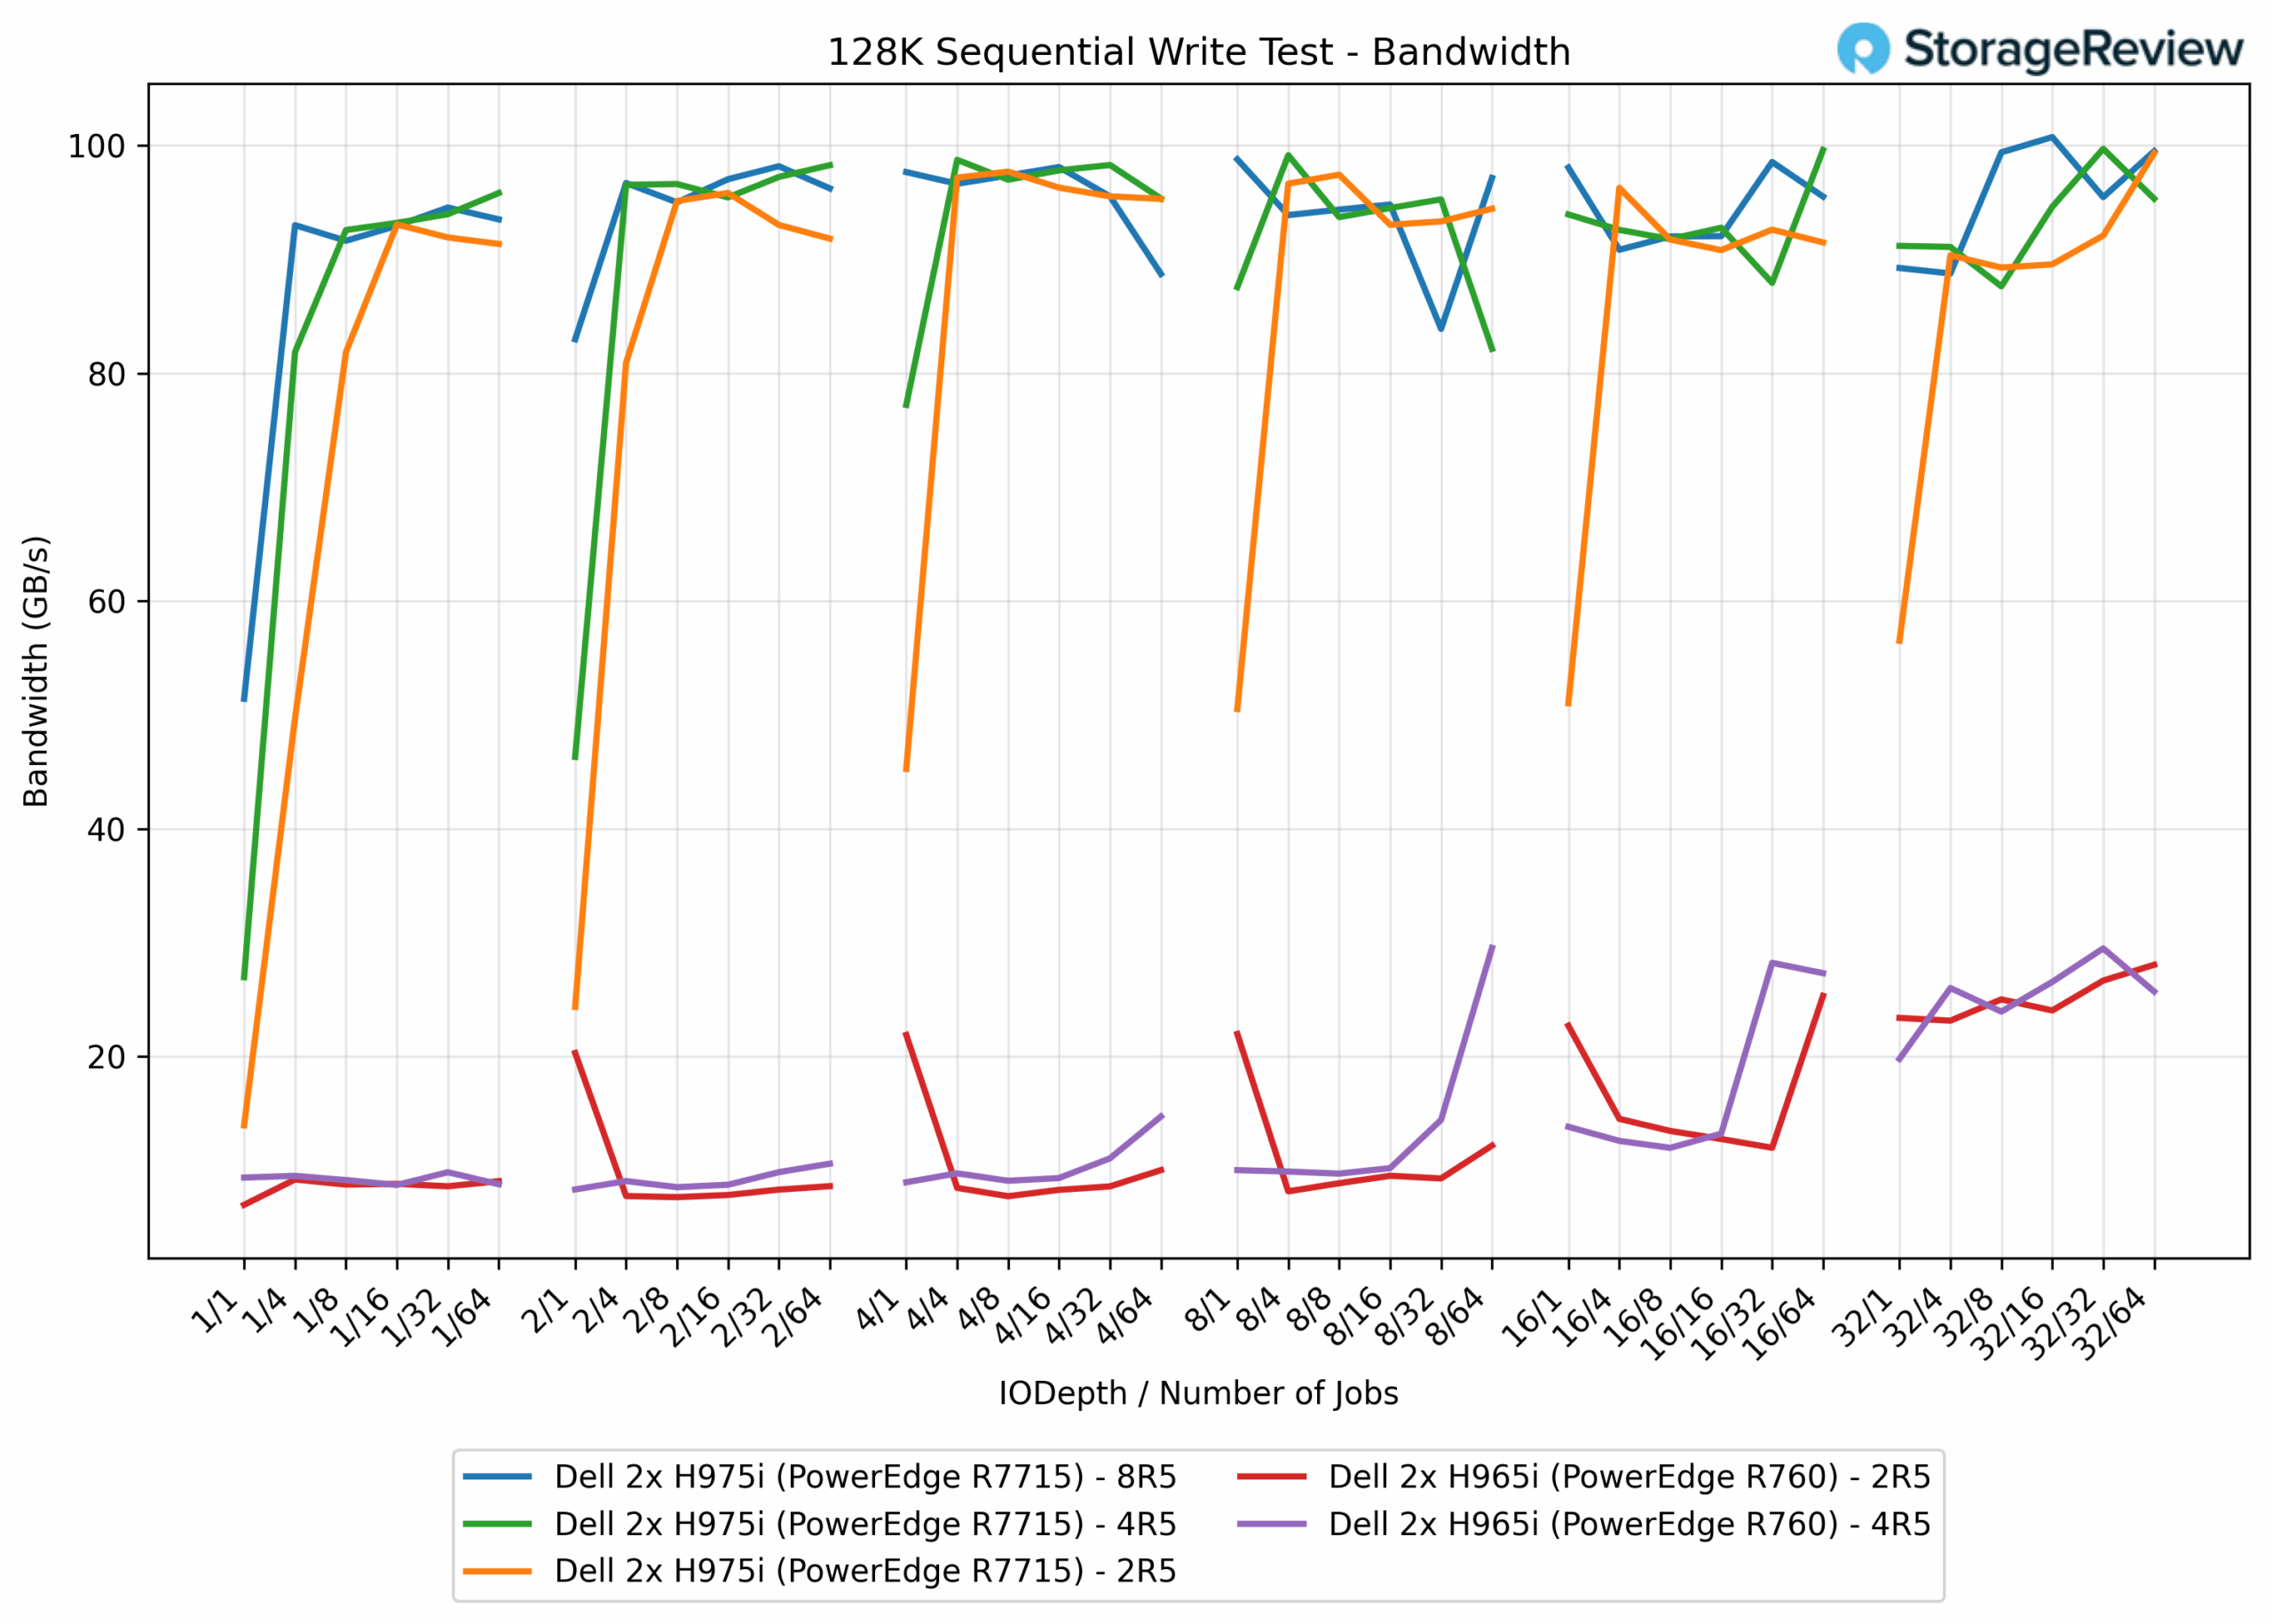
128K Sequential Write Bandwidth
In 128K sequential write testing, a dramatic performance difference emerged between controller generations. The PERC H965i arrays delivered modest throughput, with the 2R5 configuration achieving 28.1 GB/s and the 4R5 setup reaching 29.5 GB/s, showing minimal scaling from additional RAID disks. In stark contrast, the PERC H975i controller delivered exceptional performance across all configurations: the 2R5 array reached 99.3 GB/s (253%), the 4R5 configuration reached 99.7 GB/s (238%), and the 8R5 setup peaked at 101.3 GB/s (243% vs H965i 4R5). Overall, the H975i clustered tightly around 100 GB/s regardless of disk count, indicating the controller’s bandwidth ceiling for 128K sequential writes was being reached.
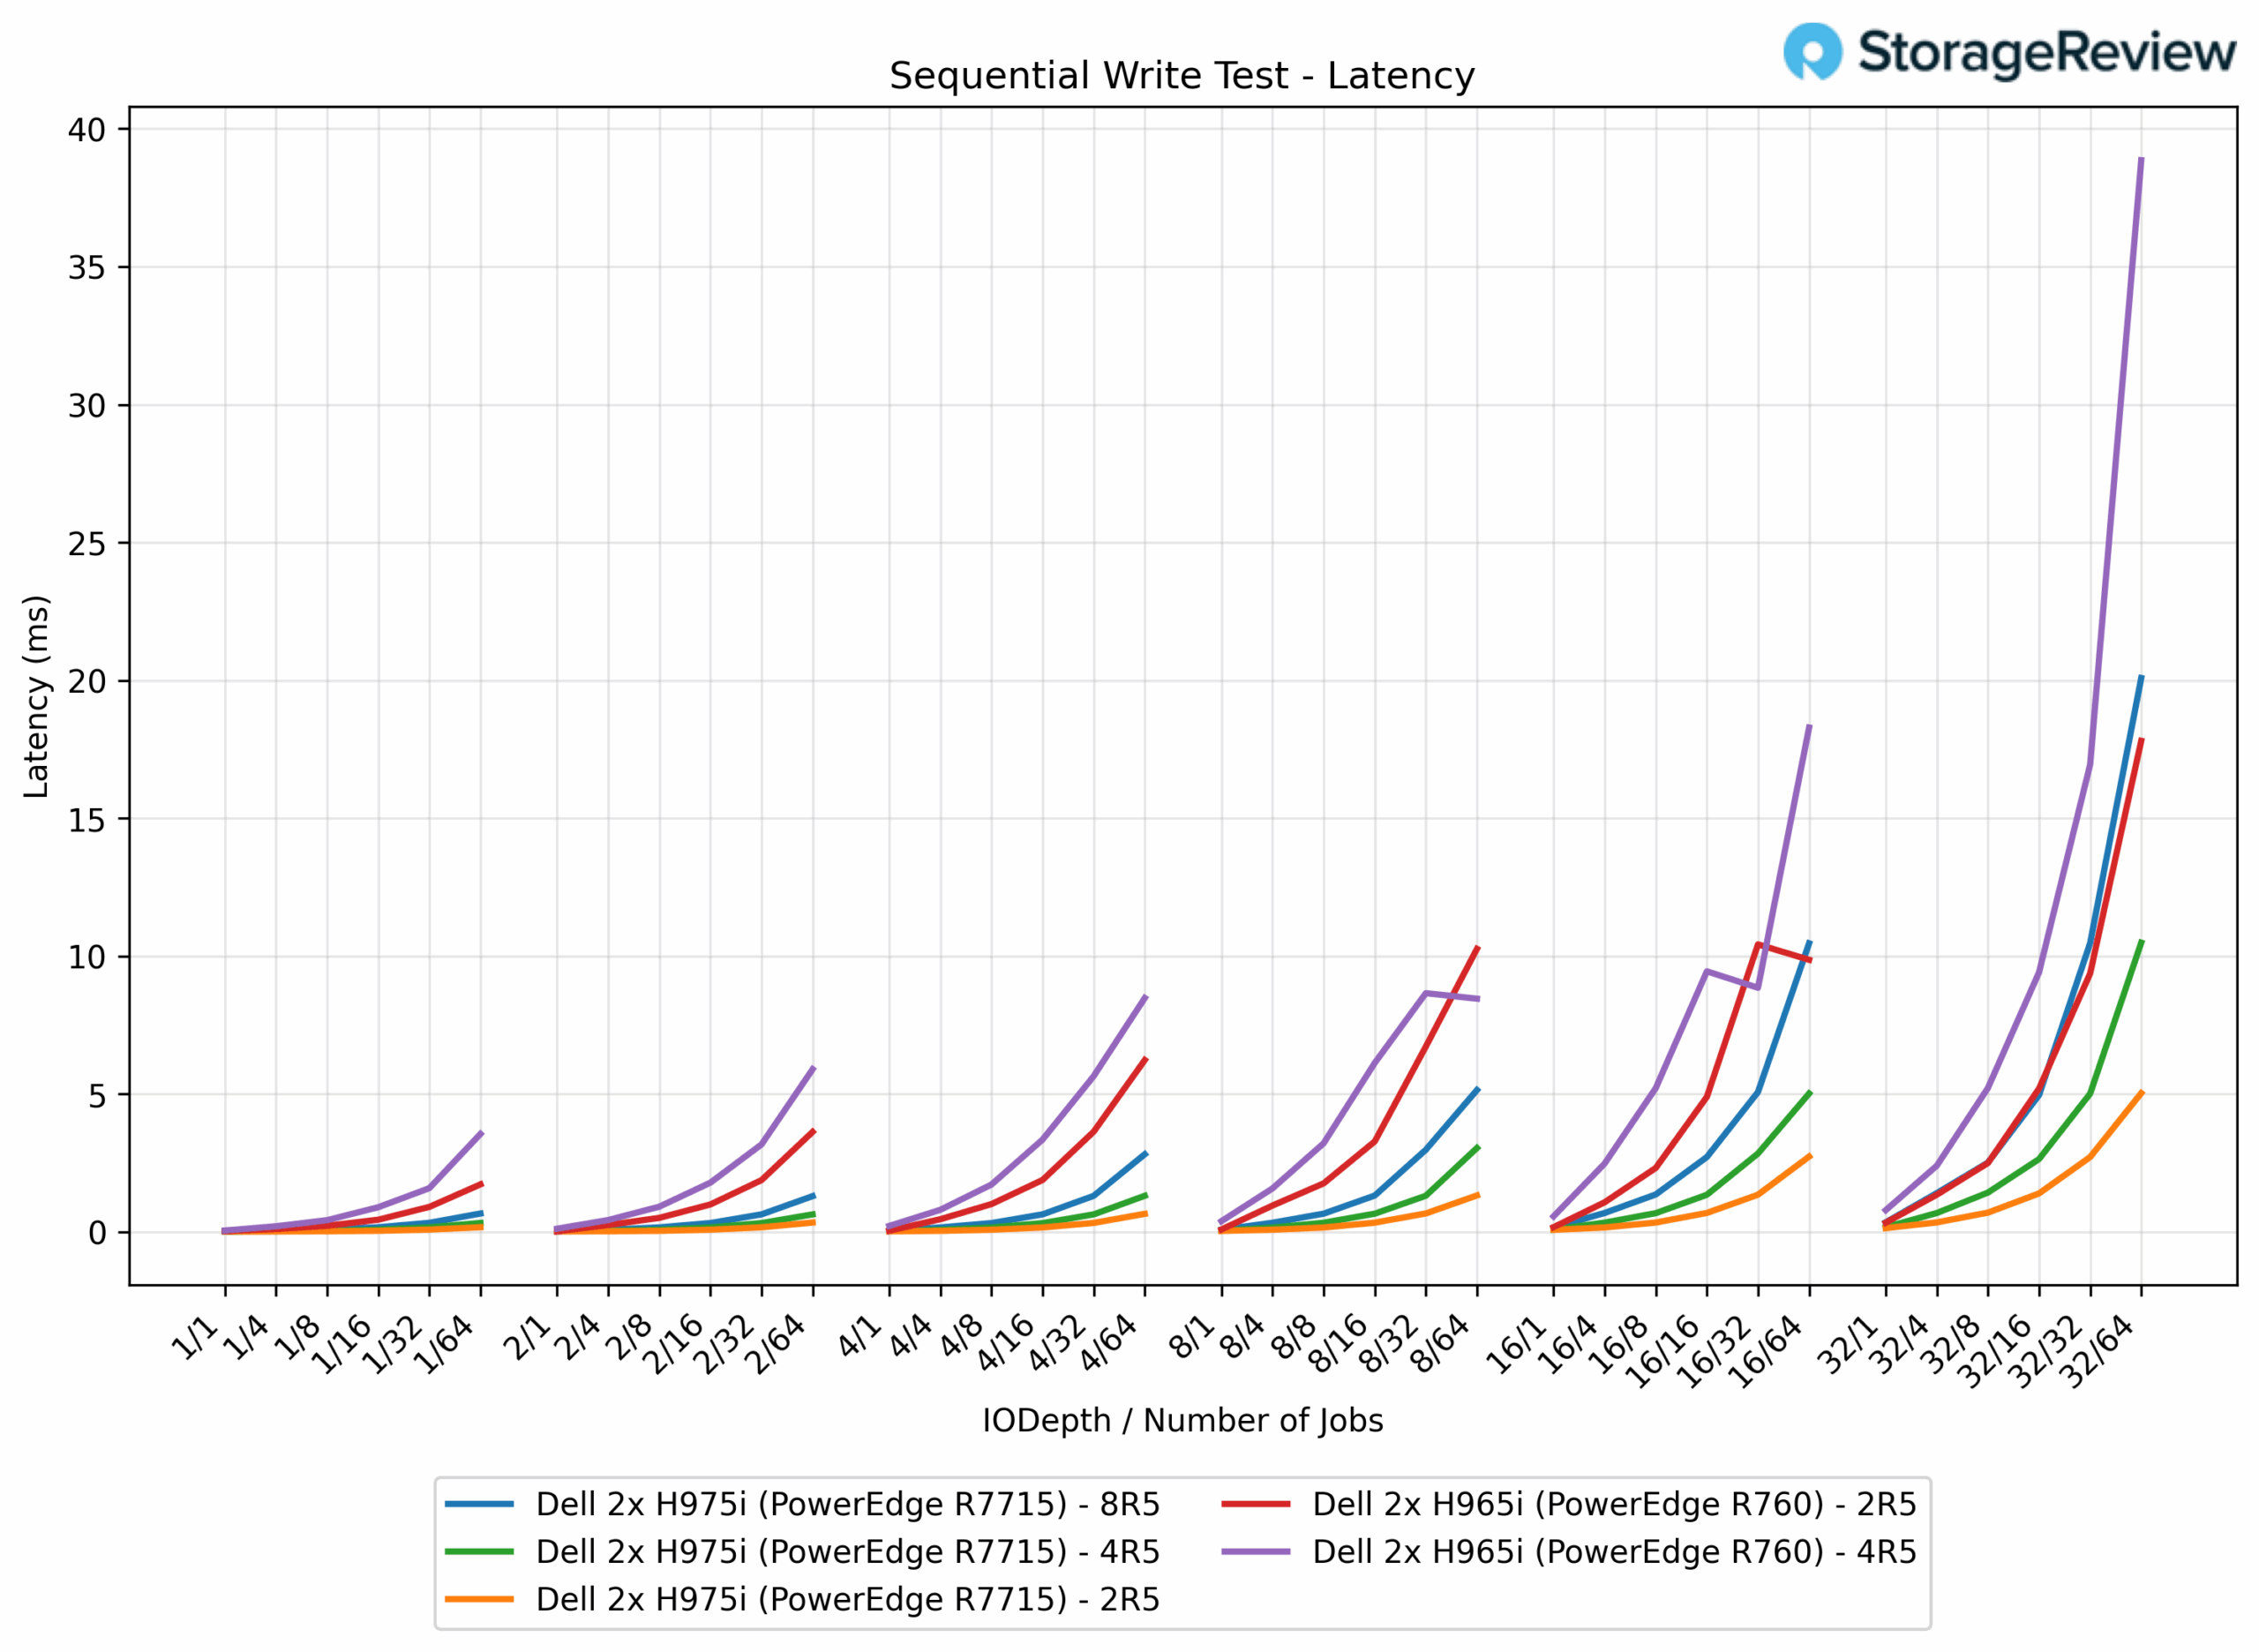
128K Sequential Write Latency
In 128K sequential write latency testing, a clear difference emerged between controller generations. The PERC H965i arrays exhibited higher latencies, with the 2R5 configuration ranging from 0.0238 ms up to 17.8 ms and the 4R5 setup extending to 38.9 ms, showing minimal benefit from additional RAID disks. In contrast, the PERC H975i controller achieved markedly lower latency across all configurations: the 2R5 array ranged from 0.0173 ms to 5.0 ms (72% lower peak latency), the 4R5 configuration ranged from 0.0179 ms to 10.5 ms (73% lower), and the 8R5 setup ranged from 0.0188 ms to 20.1 ms (48% lower vs H965i 4R5).
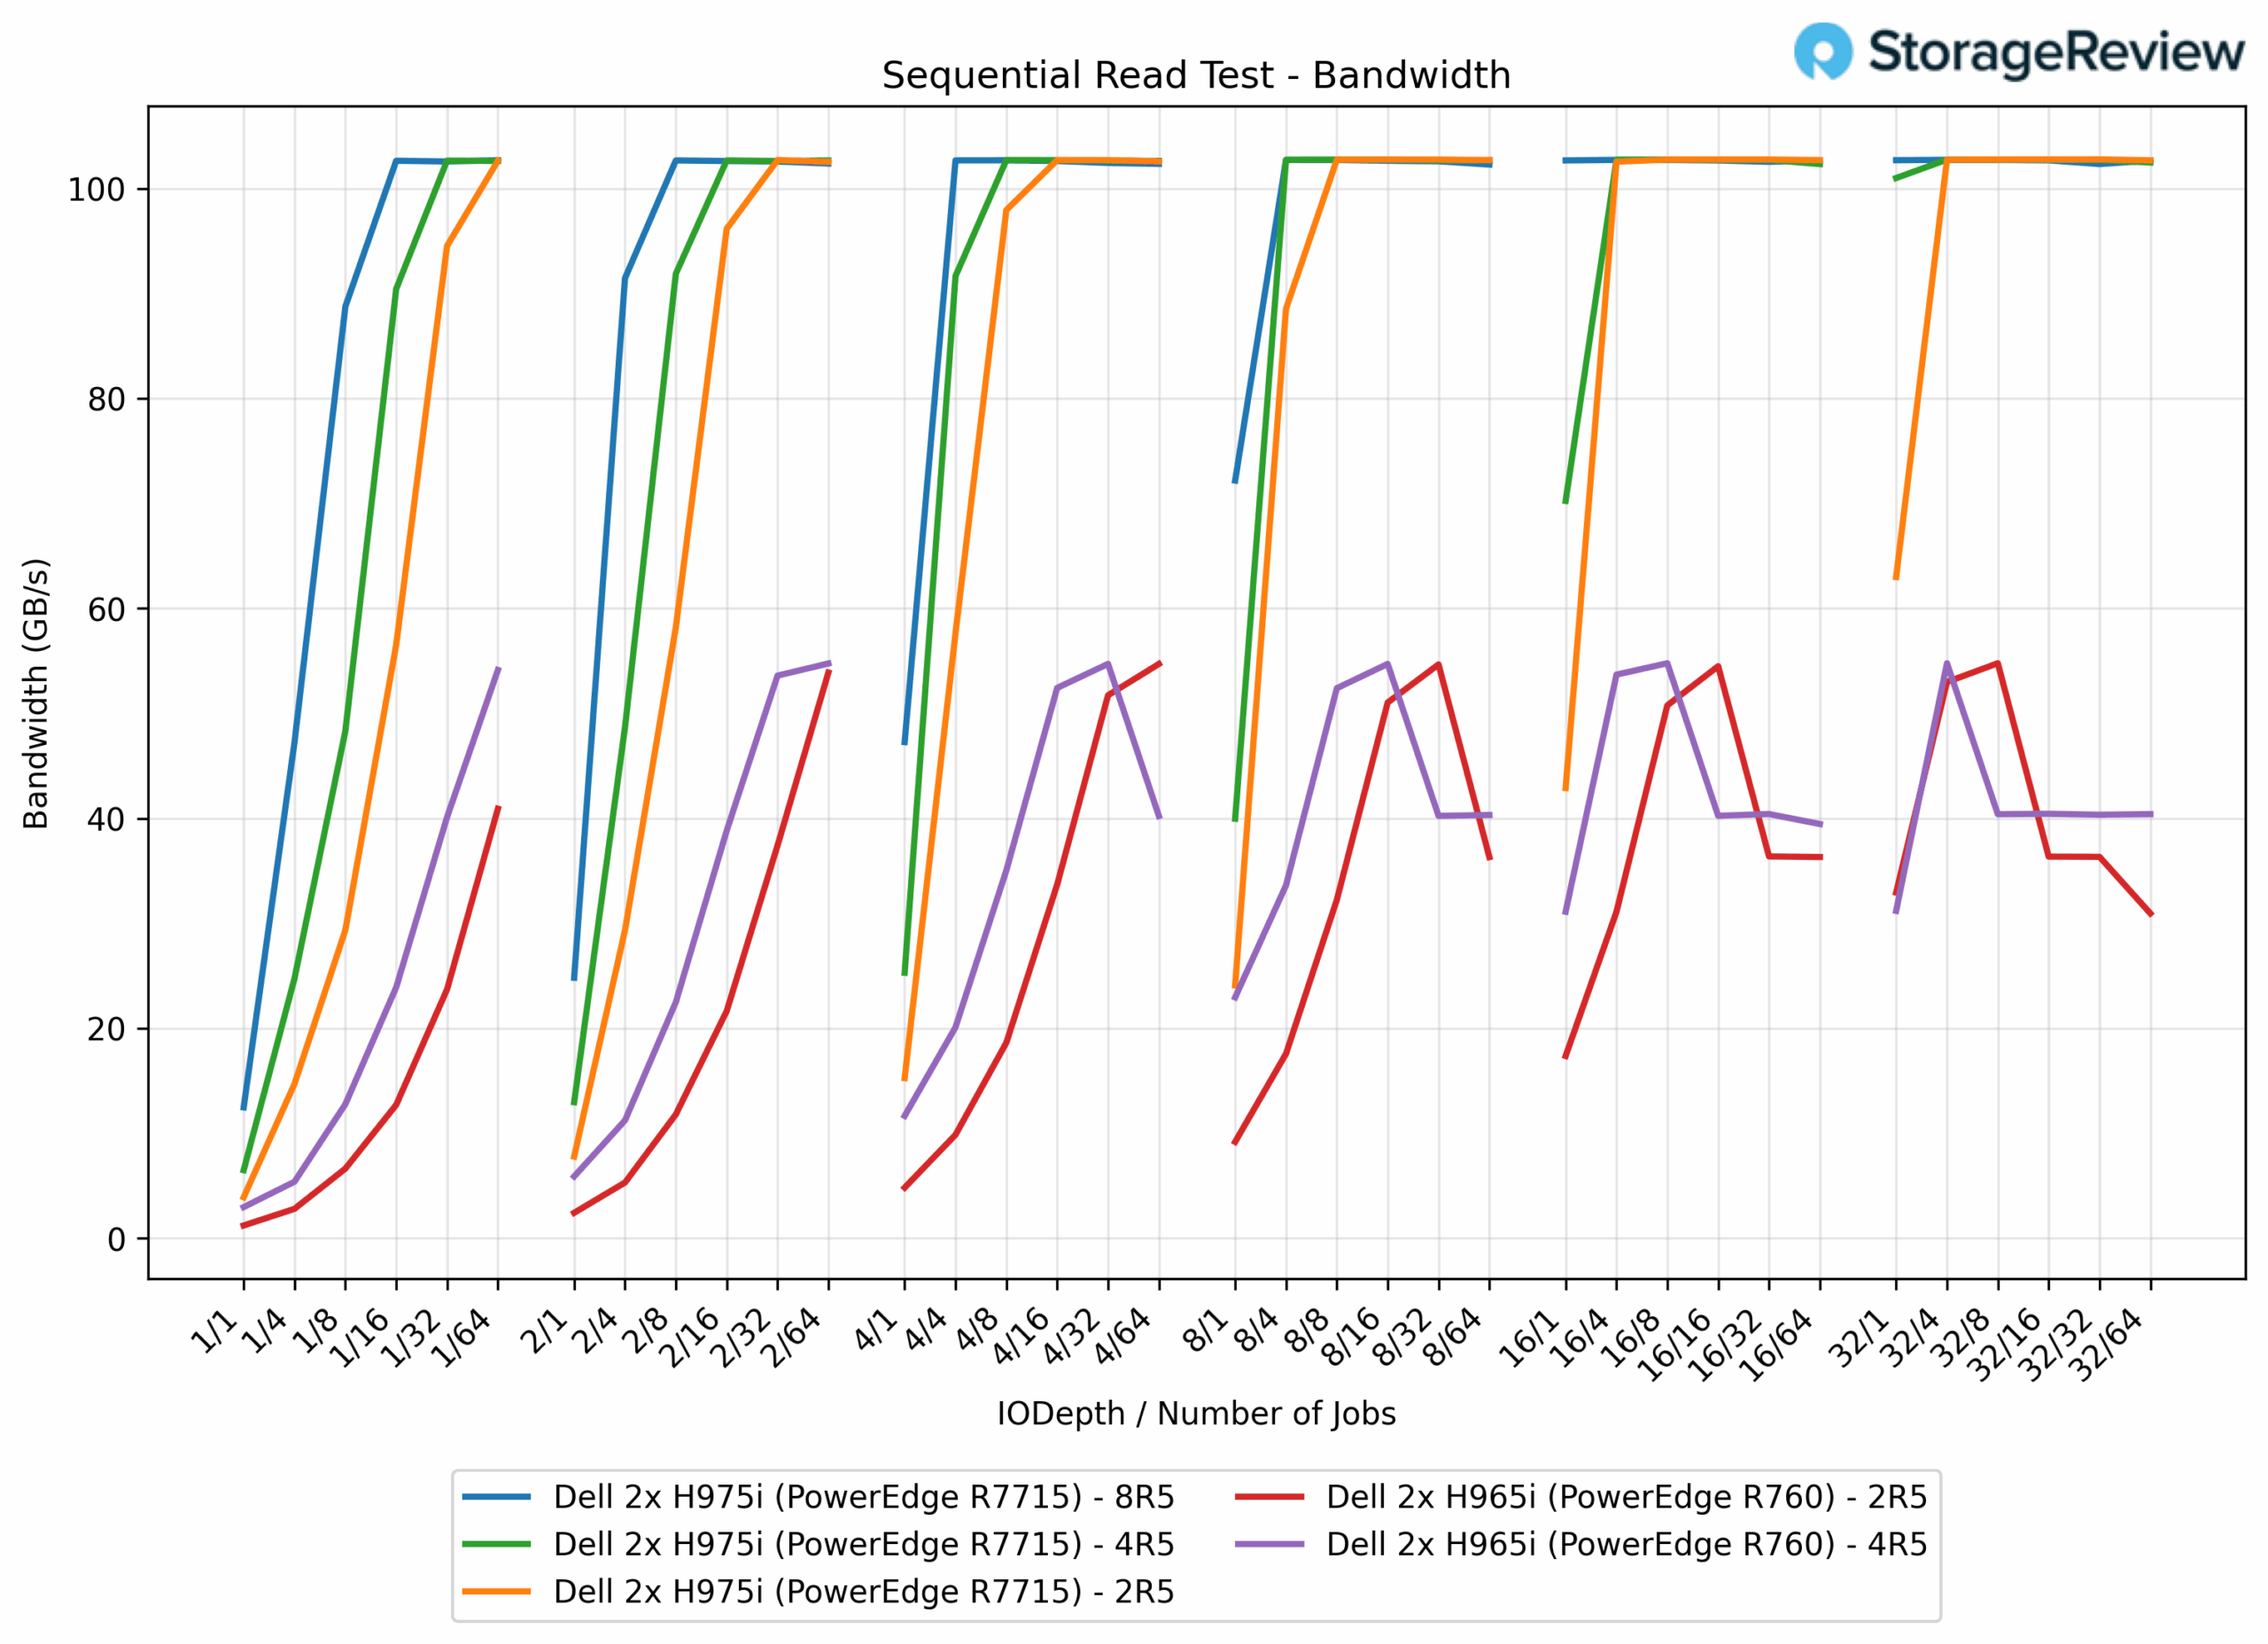
128K Sequential Read Bandwidth
In 128K sequential read testing on the Dell systems, the PERC H965i controllers showed consistent performance across both configurations. The 2R5 array achieved a maximum bandwidth of 54.8 GB/s, while the 4R5 configuration also reached 54.8 GB/s. In contrast, the PERC H975i controllers demonstrated significantly superior performance with all three configurations reaching approximately 102.7–102.8 GB/s peak bandwidth. The H975i 2R5 array delivered 102.8 GB/s (87% improvement), the 4R5 configuration achieved 102.7 GB/s (87% improvement), and the 8R5 setup reached 102.7 GB/s (87% improvement). Notably, while the H965i controllers showed no meaningful performance scaling between 2R5 and 4R5 configurations, the H975i controllers maintained consistent high performance across all RAID 5 configurations, with the bandwidth ceiling appearing to be reached regardless of the number of drives in the array.
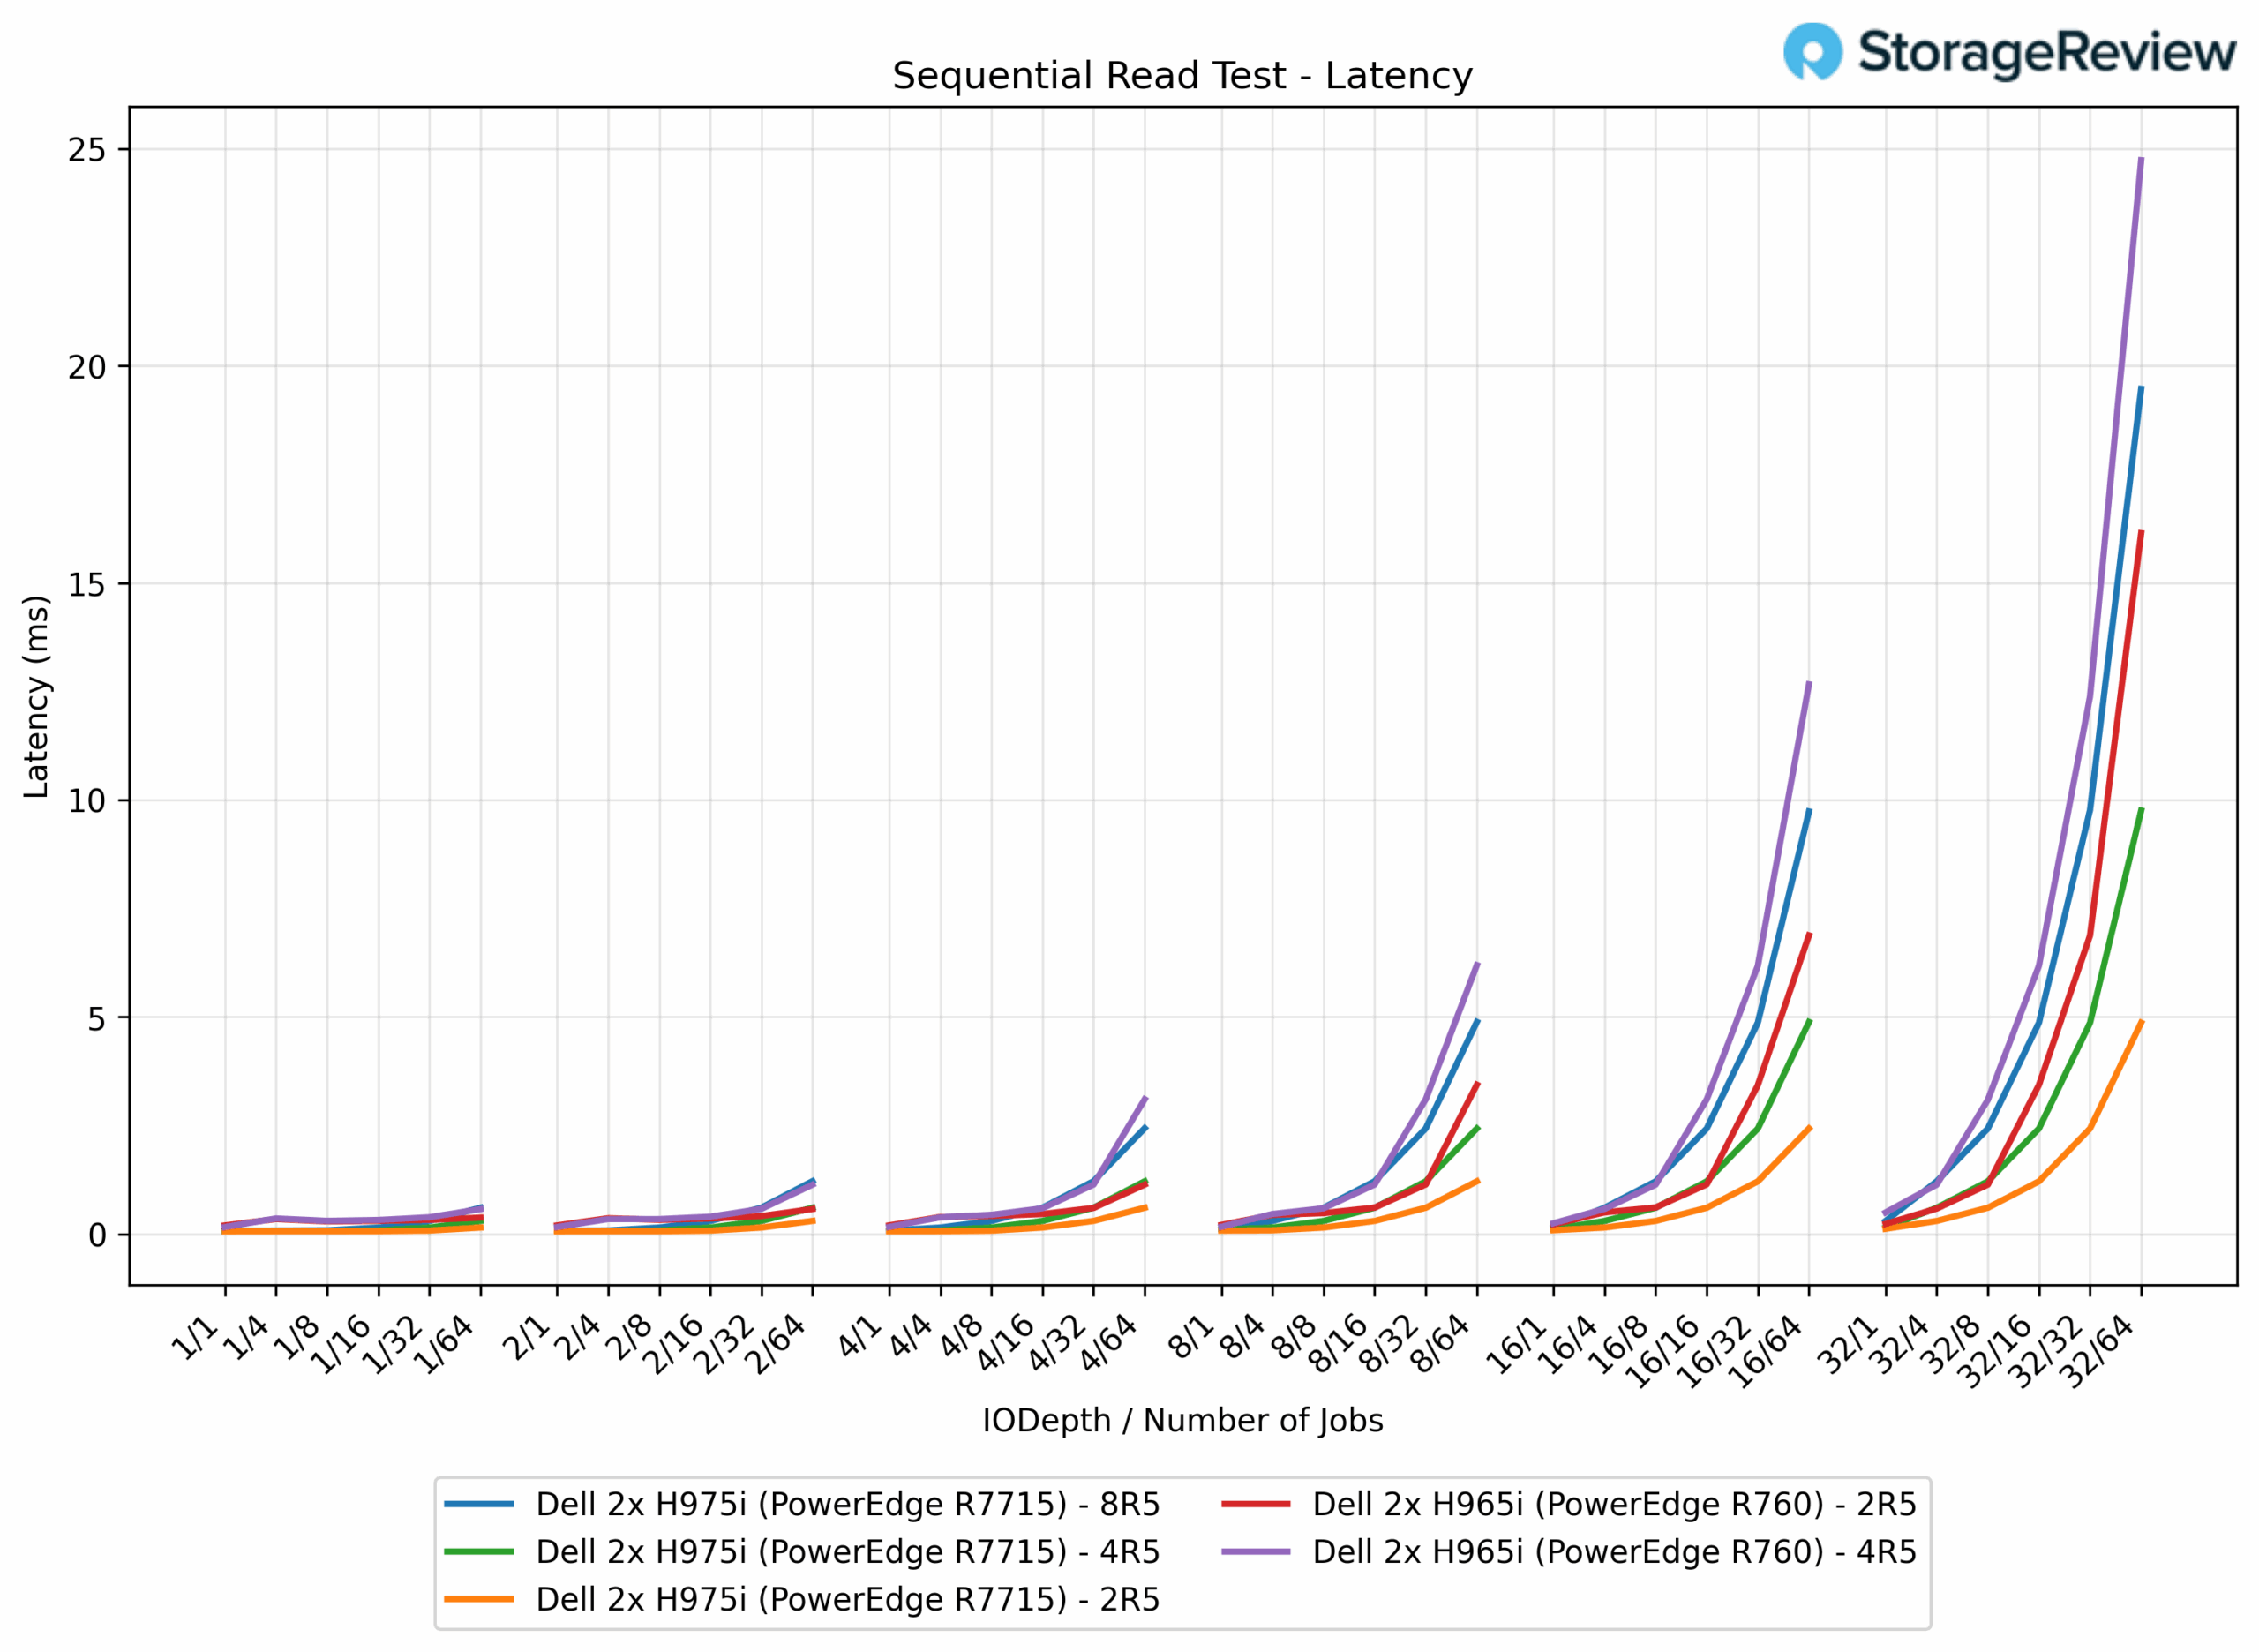
128K Sequential Read Latency
In 128K sequential read latency testing, the PERC H965i delivered latencies ranging from 0.2006 ms to 16.1 ms on 2R5 and from 0.1644 ms to 24.7 ms on 4R5, showing increased variability as the drives scaled. By comparison, the PERC H975i was far more efficient, with the 2R5 configuration ranging from 0.062 ms to 4.9 ms (80% lower peak latency), the 4R5 setup ranging from 0.075 ms to 9.8 ms (60% lower), and the 8R5 peaking at 19.5 ms (21% lower vs H965i 4R5).
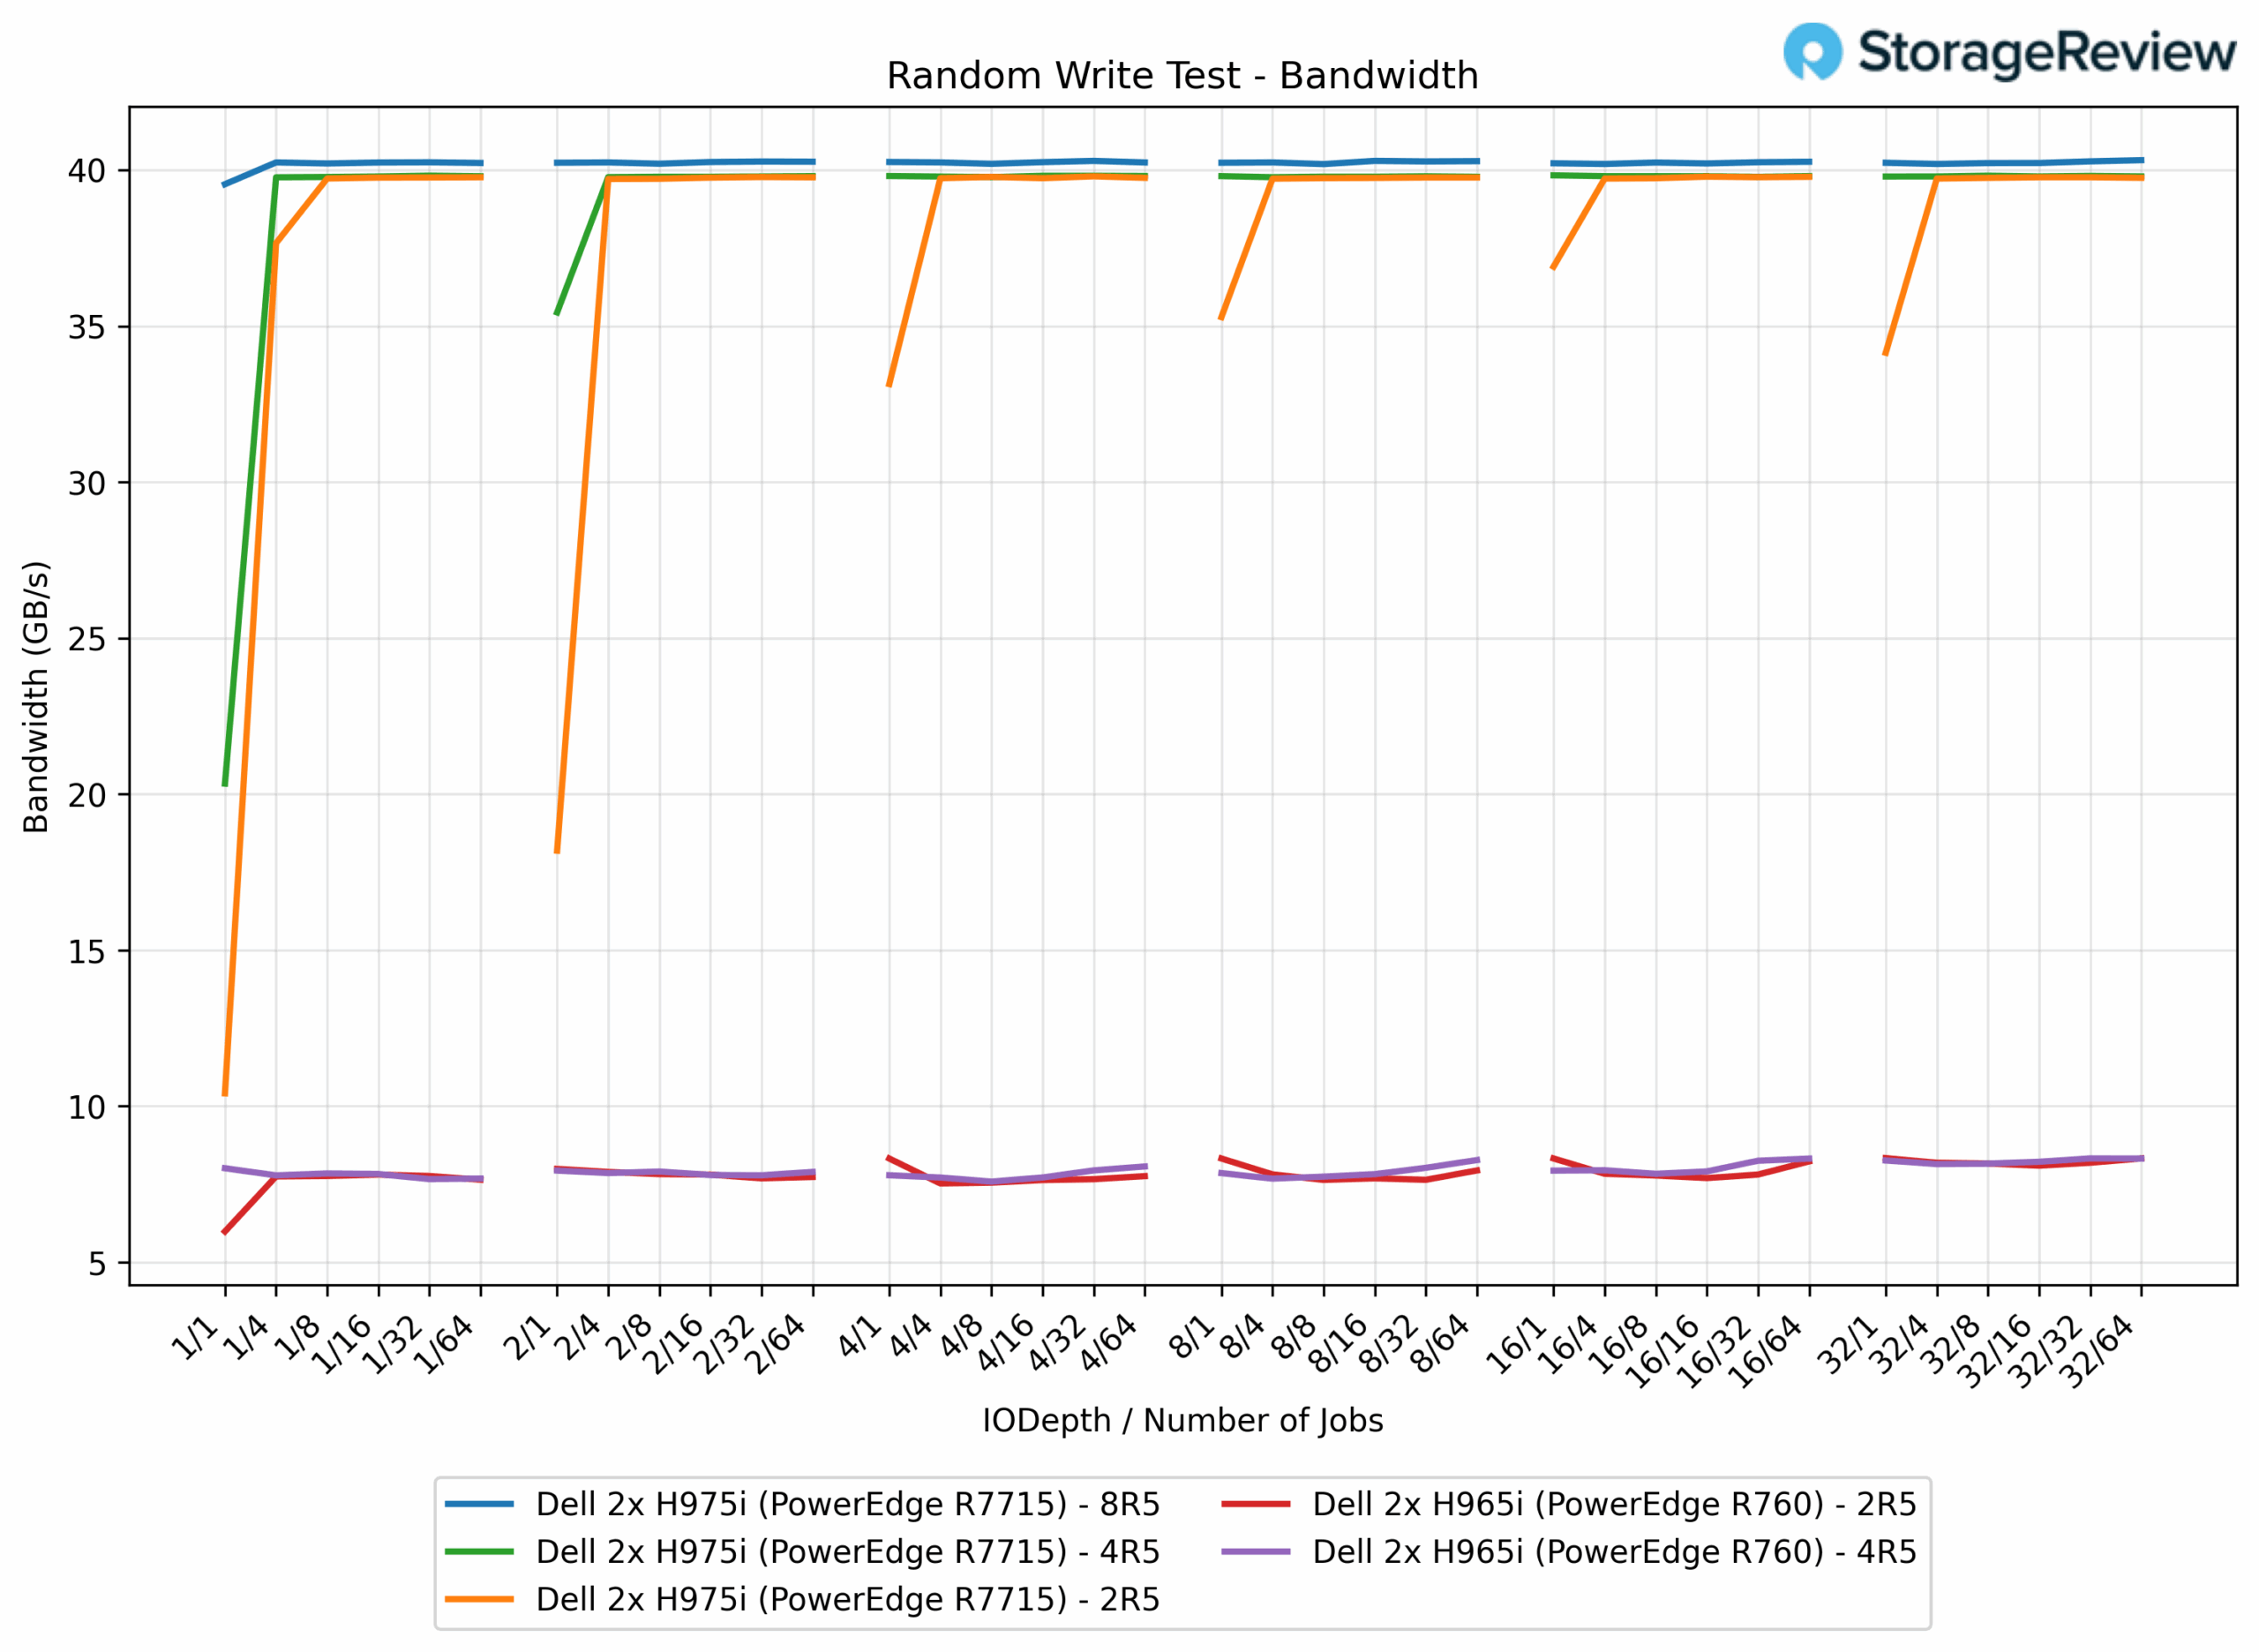
64k Random Write Bandwidth
In 64K random write tests, the older PERC H965i controller demonstrated consistent but limited performance, with both 2R5 and 4R5 configurations achieving nearly identical throughput of 8.3 GB/s regardless of disk count. In stark contrast, the PERC H975i controller delivered exceptional performance improvements: the 2R5 configuration reached 39.8 GB/s (379% improvement), while the 4R5 maintained the same 39.8 GB/s peak bandwidth (379% improvement). The 8R5 array on the H975i slightly edged ahead at 40.3 GB/s (386% improvement).
64k Random Write Latency
In 64K random write latency testing, the H965i struggled under heavier load, with 2R5 ranging from 0.020 ms up to 30.0 ms and 4R5 extending as high as 60.0 ms. In stark contrast, the H975i controller performed dramatically better: 2R5 ranged from 0.0115 ms to 6.3 ms (79% lower peak latency), 4R5 reached only 12.6 ms (79% lower), and 8R5 peaked at 24.8 ms (59% lower vs H965i 4R5).

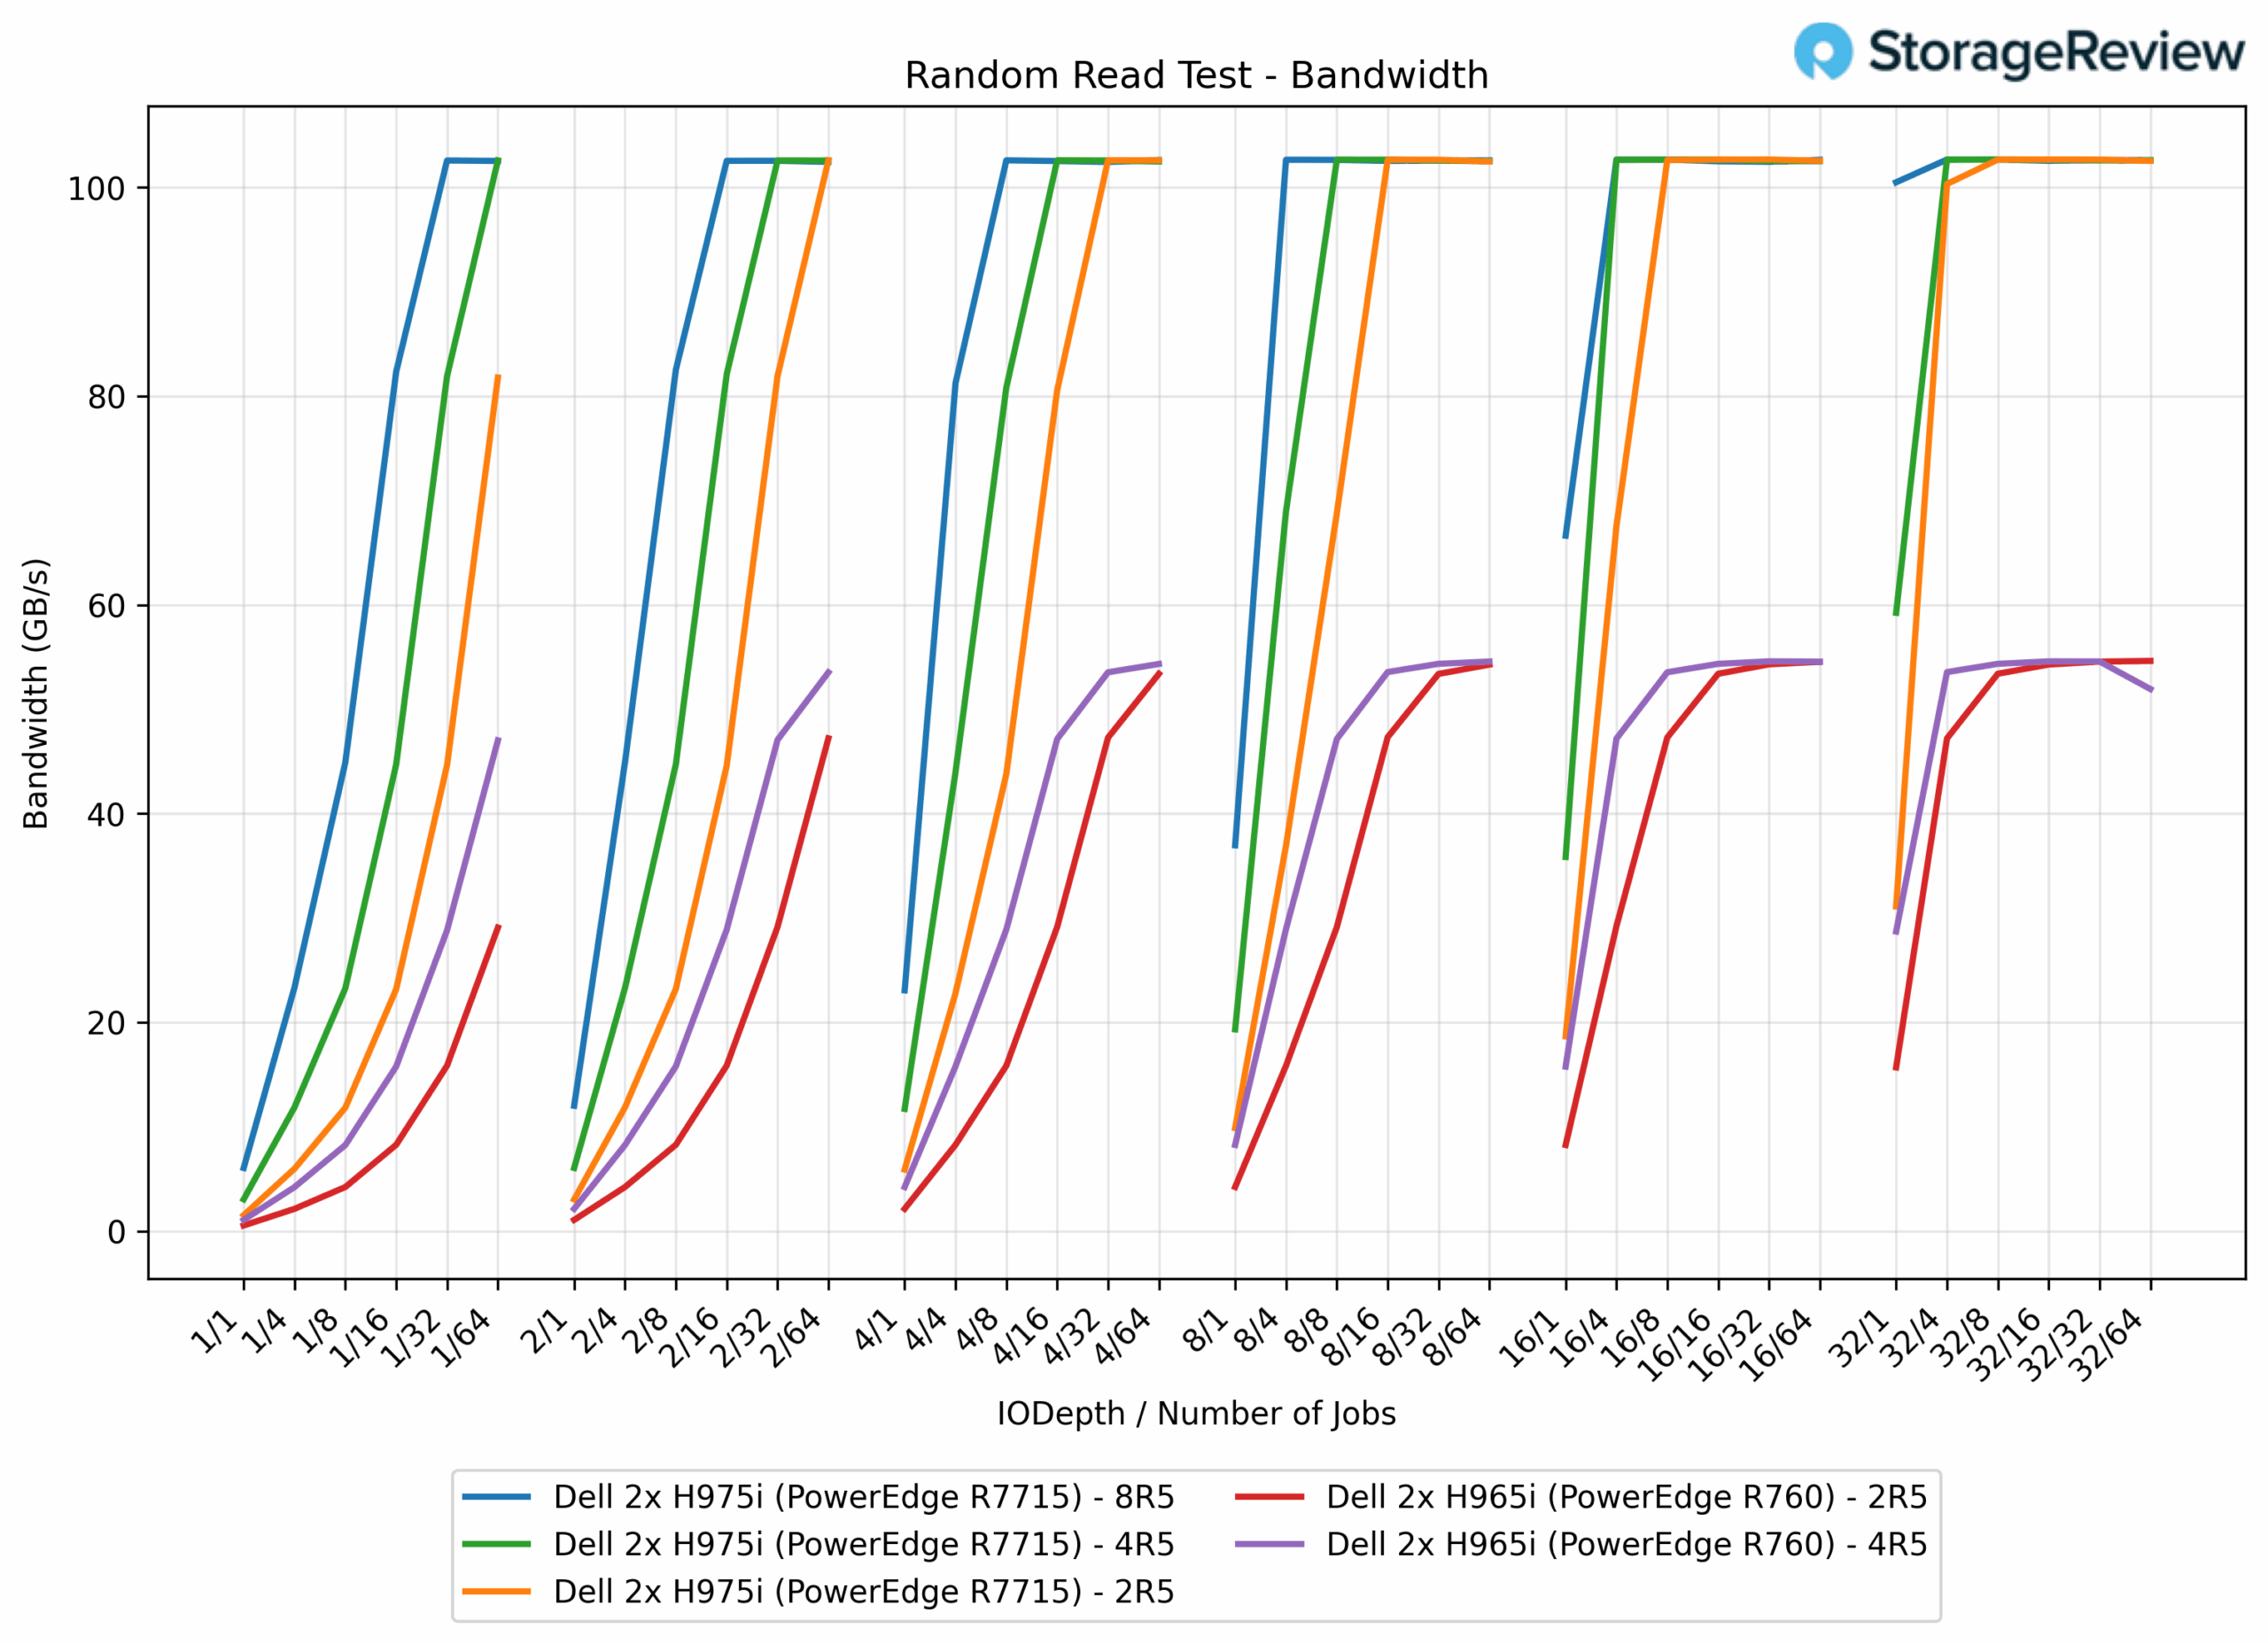
64k Random Read Bandwidth
In 64K random read testing, the PERC H965i with both 2R5 and 4R5 arrays achieved nearly identical 54.6 GB/s throughput. In stark contrast, the PERC H975i controller was again dramatically superior, with all three configurations reaching approximately 102.7 GB/s, representing an 88% performance improvement over the H965i. Notably, the H975i configurations showed remarkable consistency across different RAID array sizes, with peak bandwidth ranging only from 102.7 GB/s to 102.7 GB/s regardless of whether using 2, 4, or 8 drives in the RAID-5 array. This suggests that at the 64K random read workload, we are able to completely saturate the controller and are not drive-limited on the newer H975i platform.
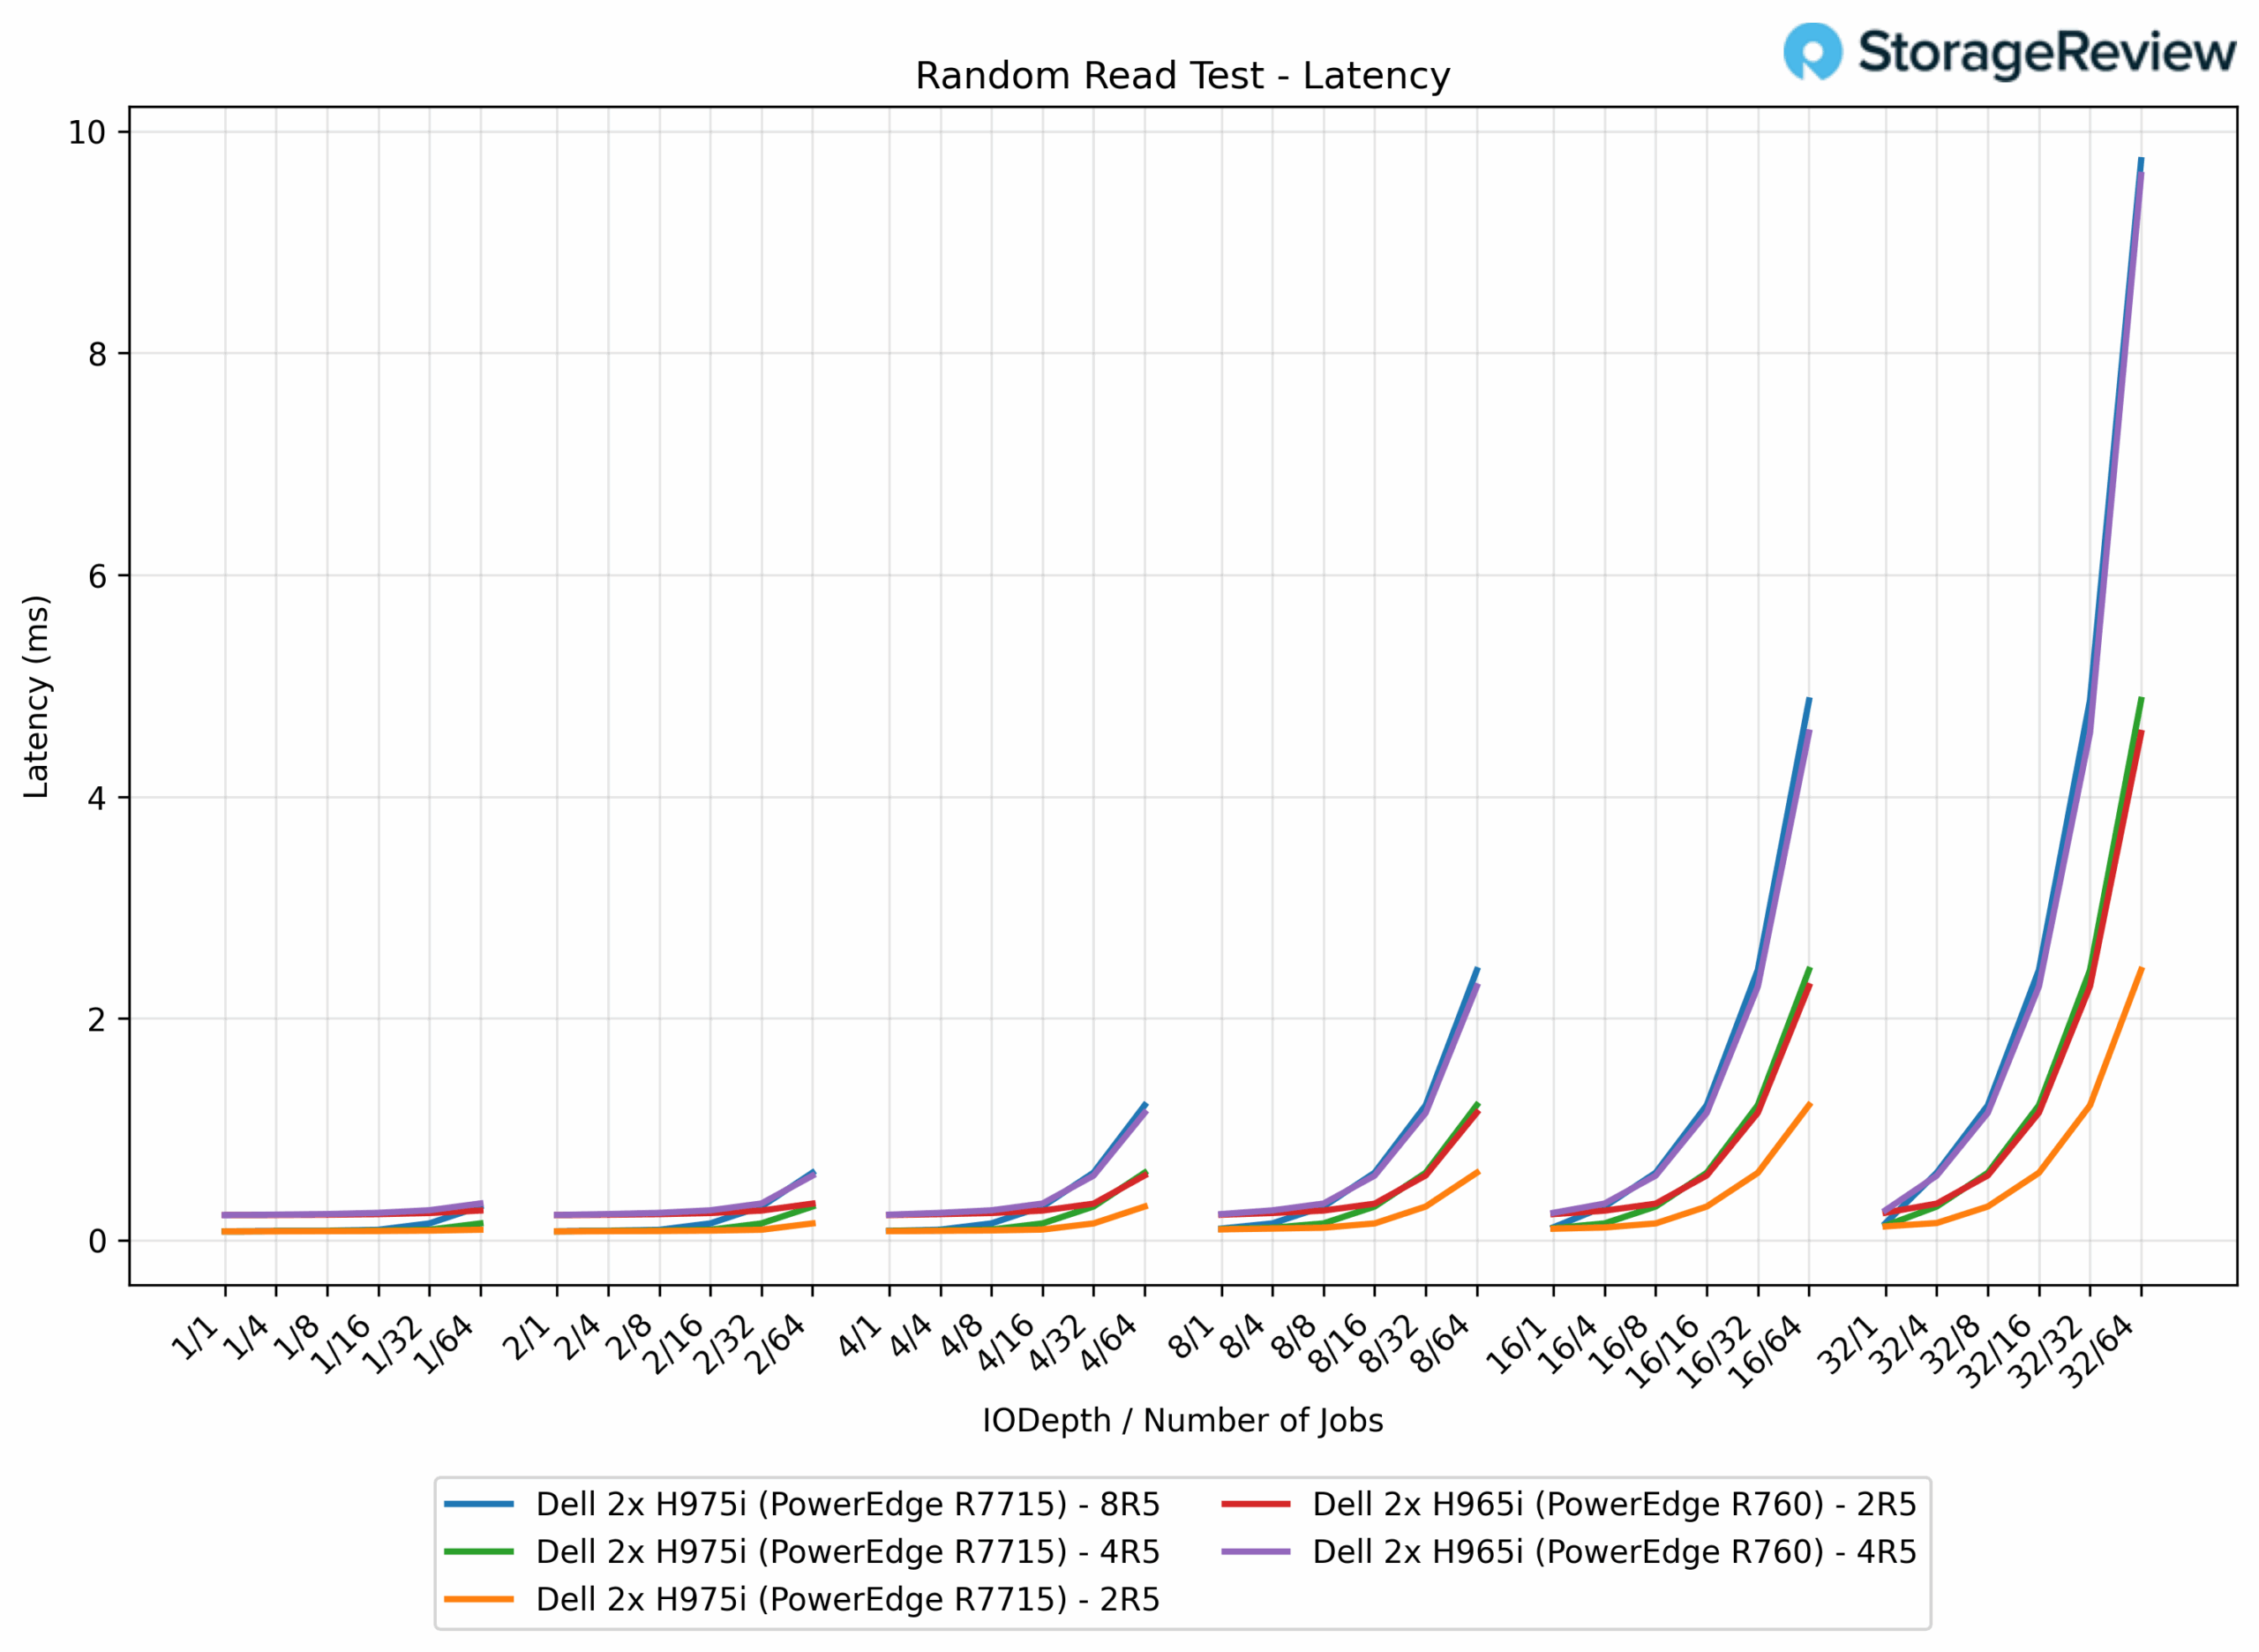
64k Random Read Latency
For 64K random reads, the H965i 2R5 array ranged from 0.226 ms to 4.6 ms, while the 4R5 setup stretched to 9.6 ms. Moving to the H975i substantially lowered latencies, with 2R5 measuring 0.080 ms to 2.4 ms (48% lower peak latency), 4R5 at 0.080 ms to 4.9 ms (49% lower), and 8R5 at 0.080 ms to 9.7 ms (on par with H965i 4R5). Overall, the H975i showed tighter control and lower latency ceilings across RAID groups.
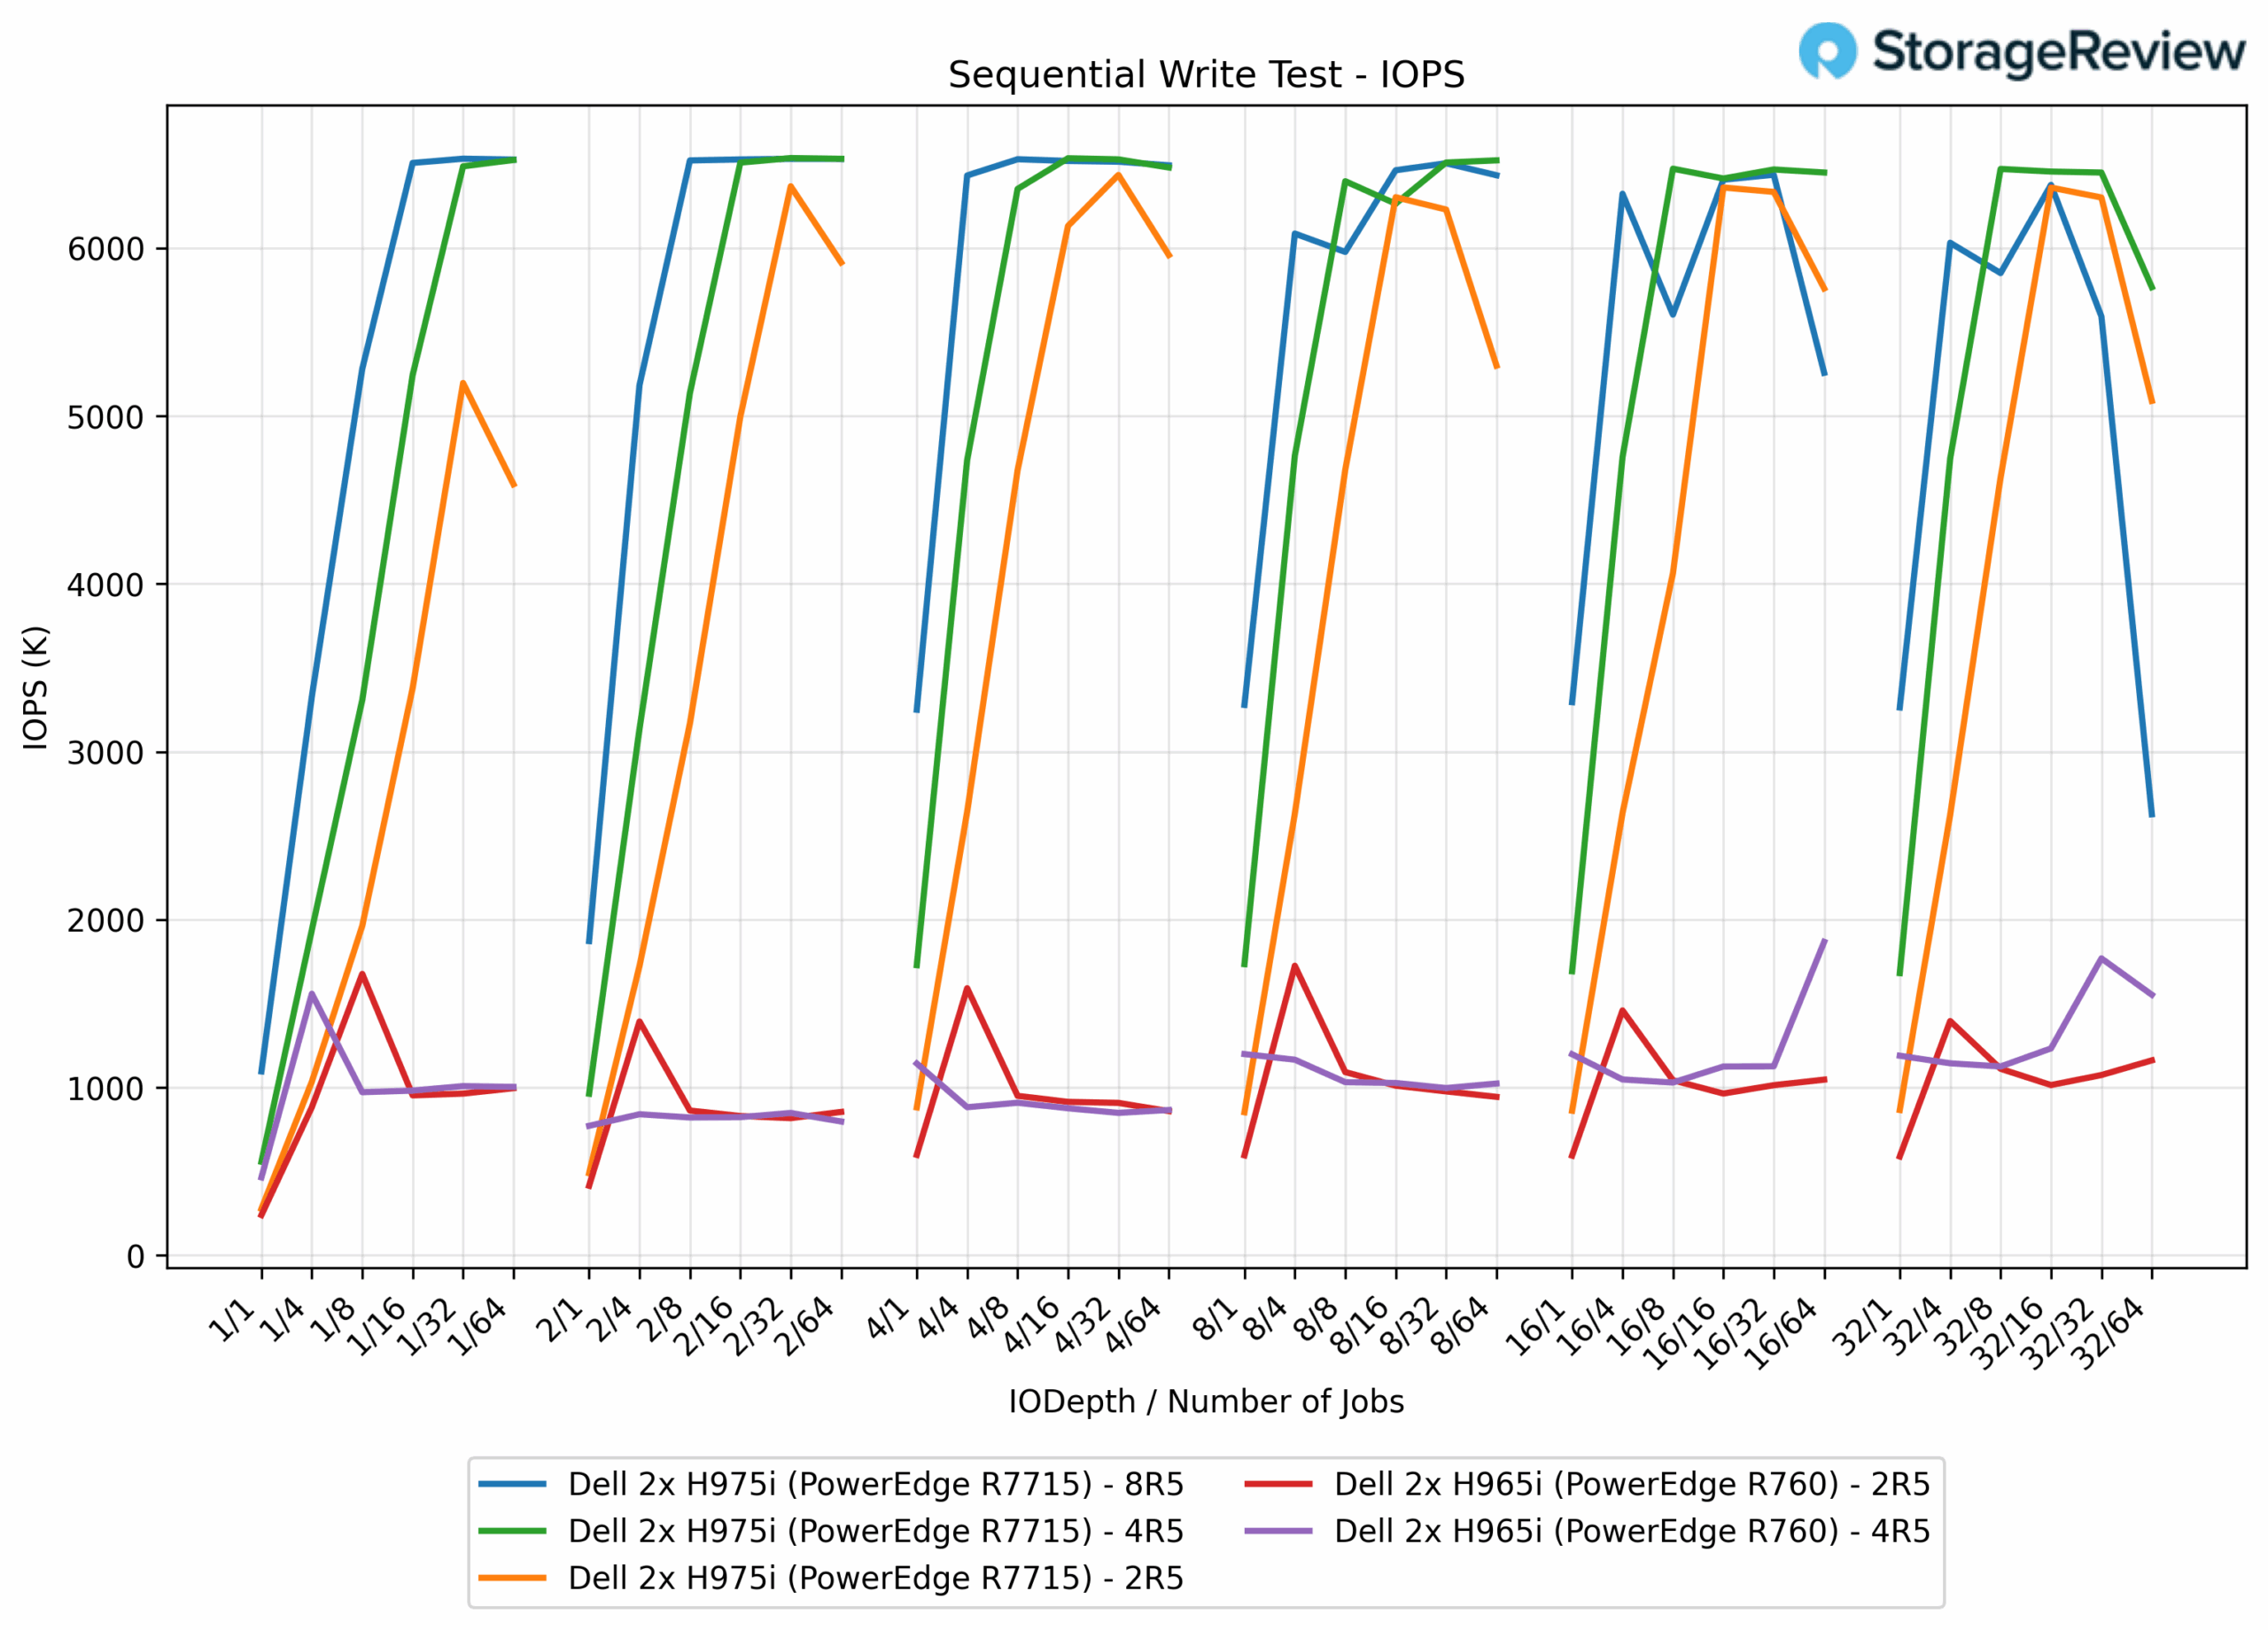
16k Sequential Write IOPS
In 16K sequential write testing, the PERC H965i controller delivered modest performance, with the 2R5 configuration achieving 1.73 million IOPS and the 4R5 setup reaching 1.87 million IOPS. The PERC H975i, by comparison, delivered a dramatic uplift, with the 2R5 configuration reaching 6.44 million IOPS (272% improvement over the H965i). The H975i’s 4R5 array peaked at 6.54 million IOPS (250% improvement), while the 8R5 configuration achieved 6.53 million IOPS (249% improvement vs H965i 4R5), again showcasing that the controllers saturate around 6.5M IOPS at the 16K block size.
16k Sequential Write Latency
In 16K sequential writes, the H965i arrays produced 0.0080-3.5 ms on 2R5 and 0.0083-5.3 ms on 4R5. The H975i showed superior efficiency, with 2R5 ranging from 0.0070 ms to 0.80 ms (77% lower), 4R5 ranging up to 1.42 ms (73% lower), and 8R5 peaking at 6.2 ms (17% lower vs H965i 4R5). 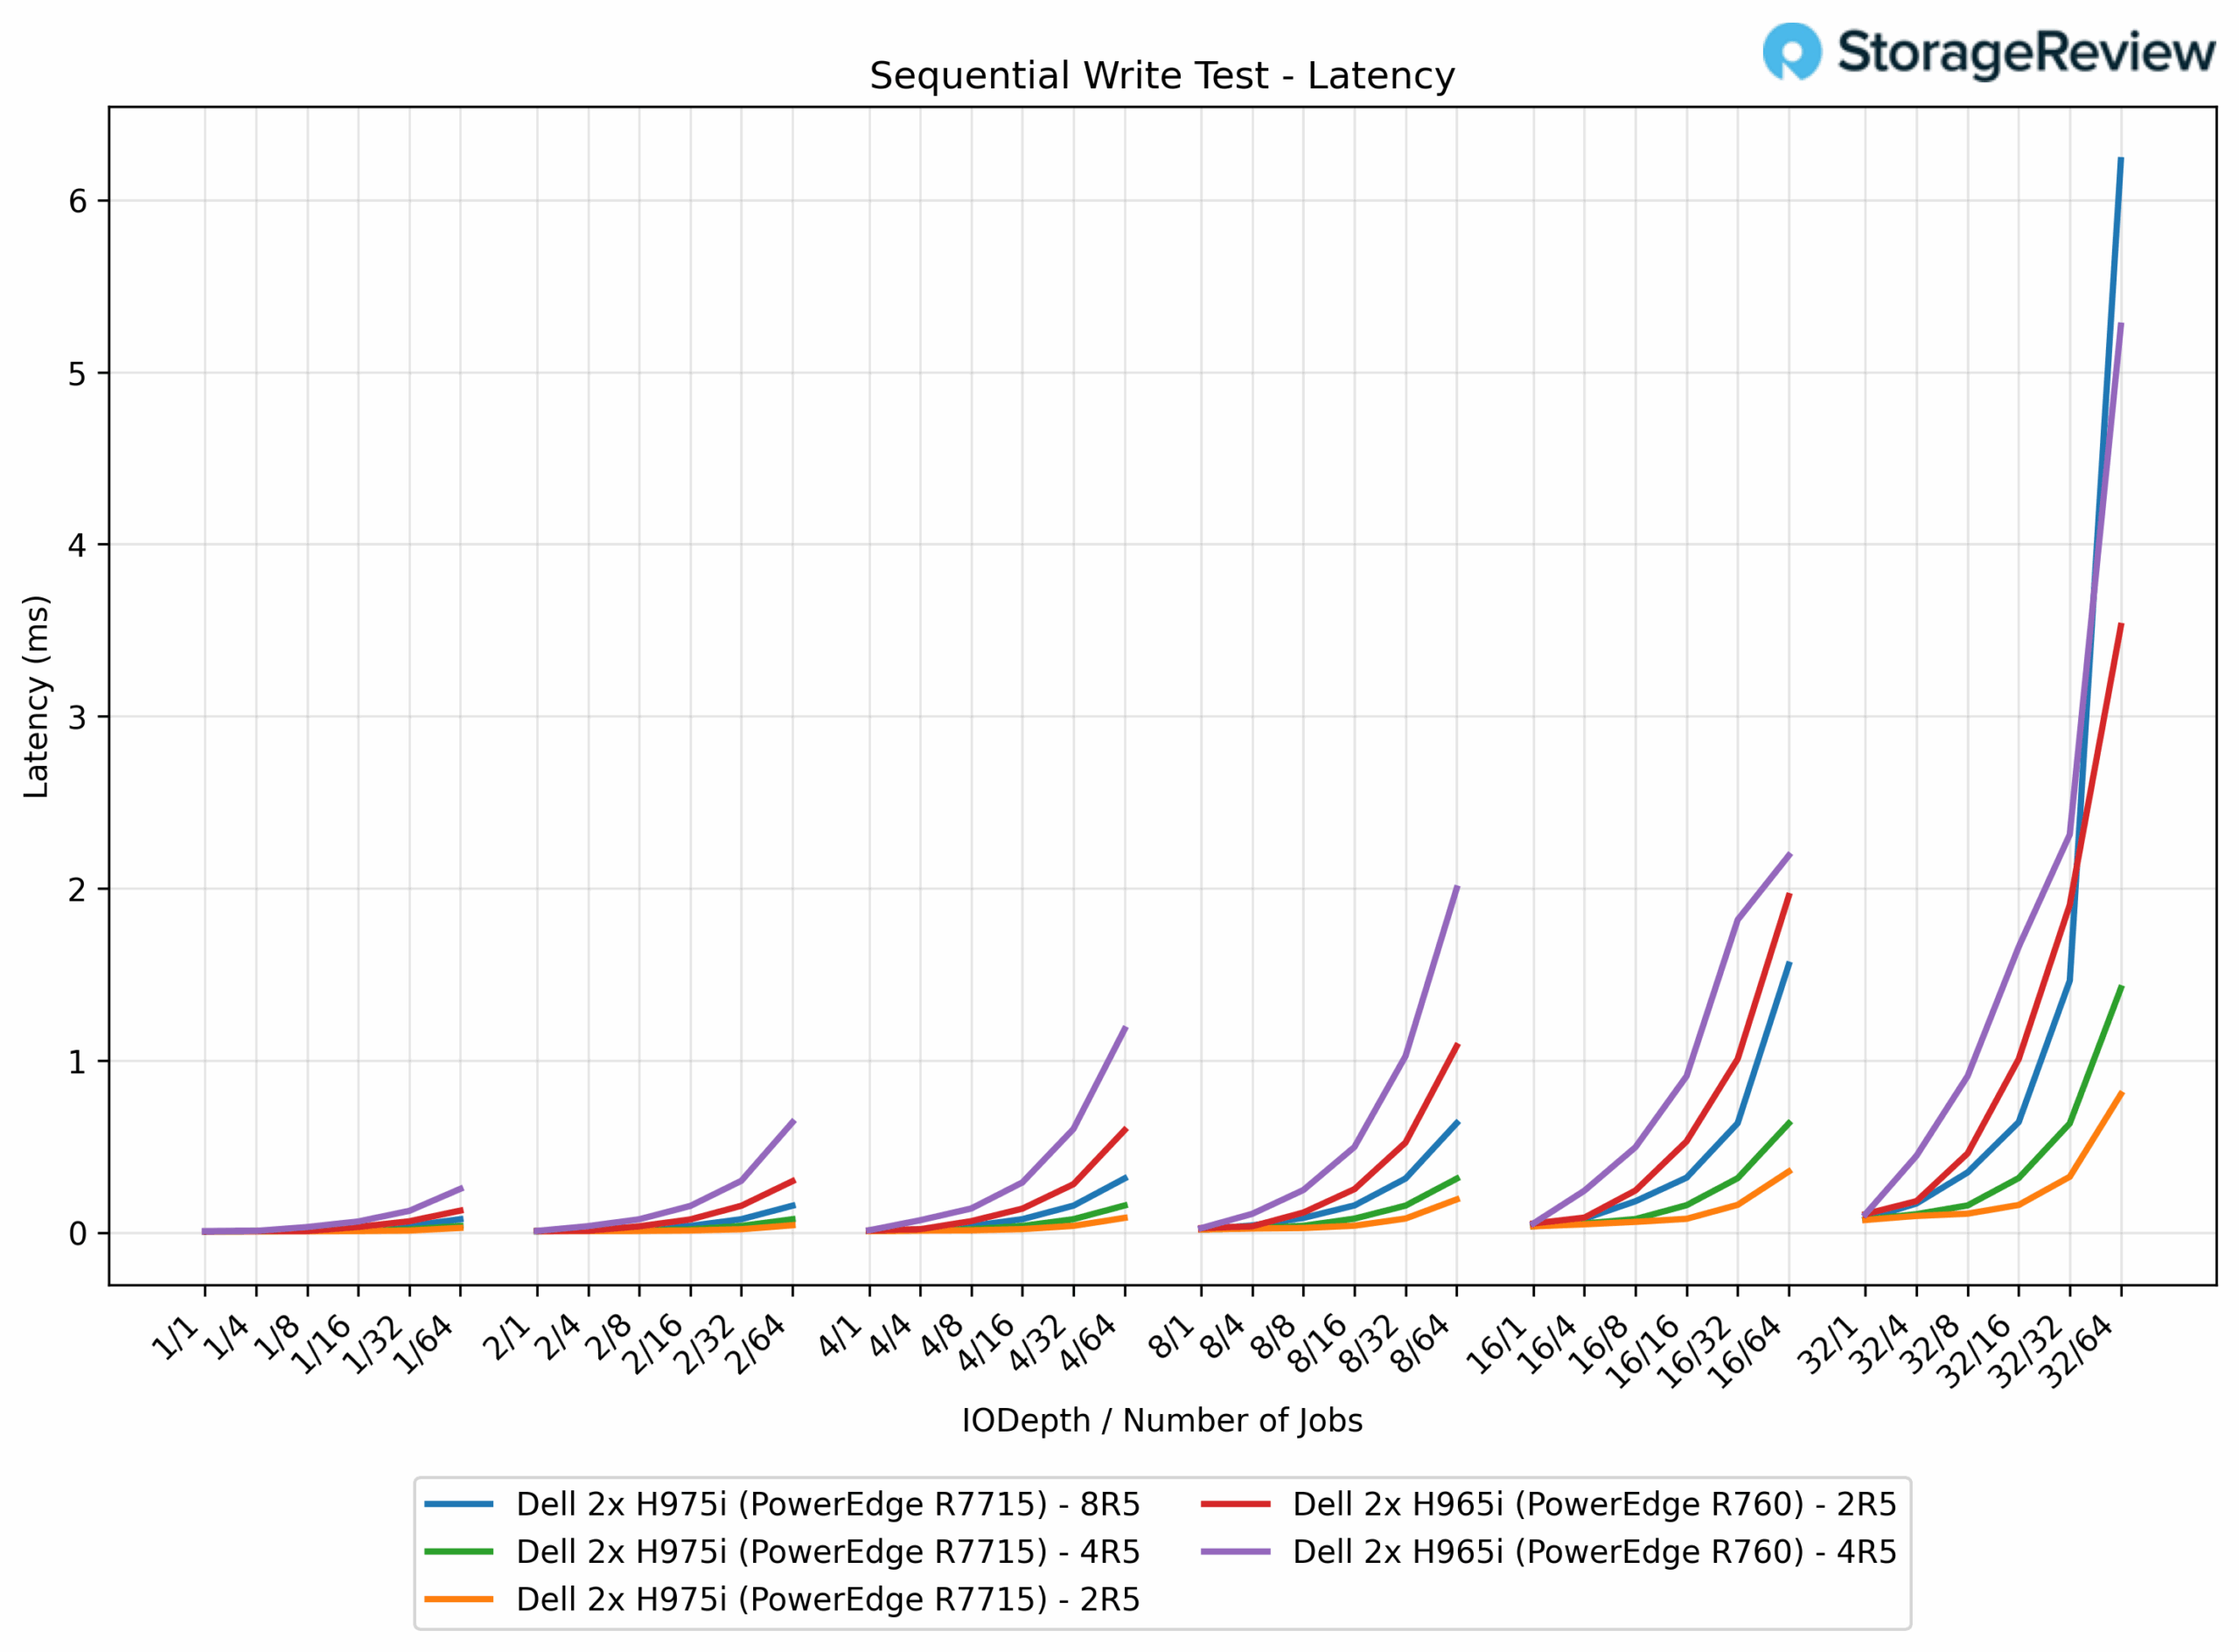
16k Sequential Read IOPS
In 16K sequential read testing, the PERC H965i controllers delivered consistent results, with the 2R5 setup achieving 3.56 million IOPS and the 4R5 configuration also reaching 3.56 million IOPS. By comparison, the PERC H975i controllers saw all configurations cluster tightly around 6.64 million IOPS, representing an 86% improvement over the H965i.
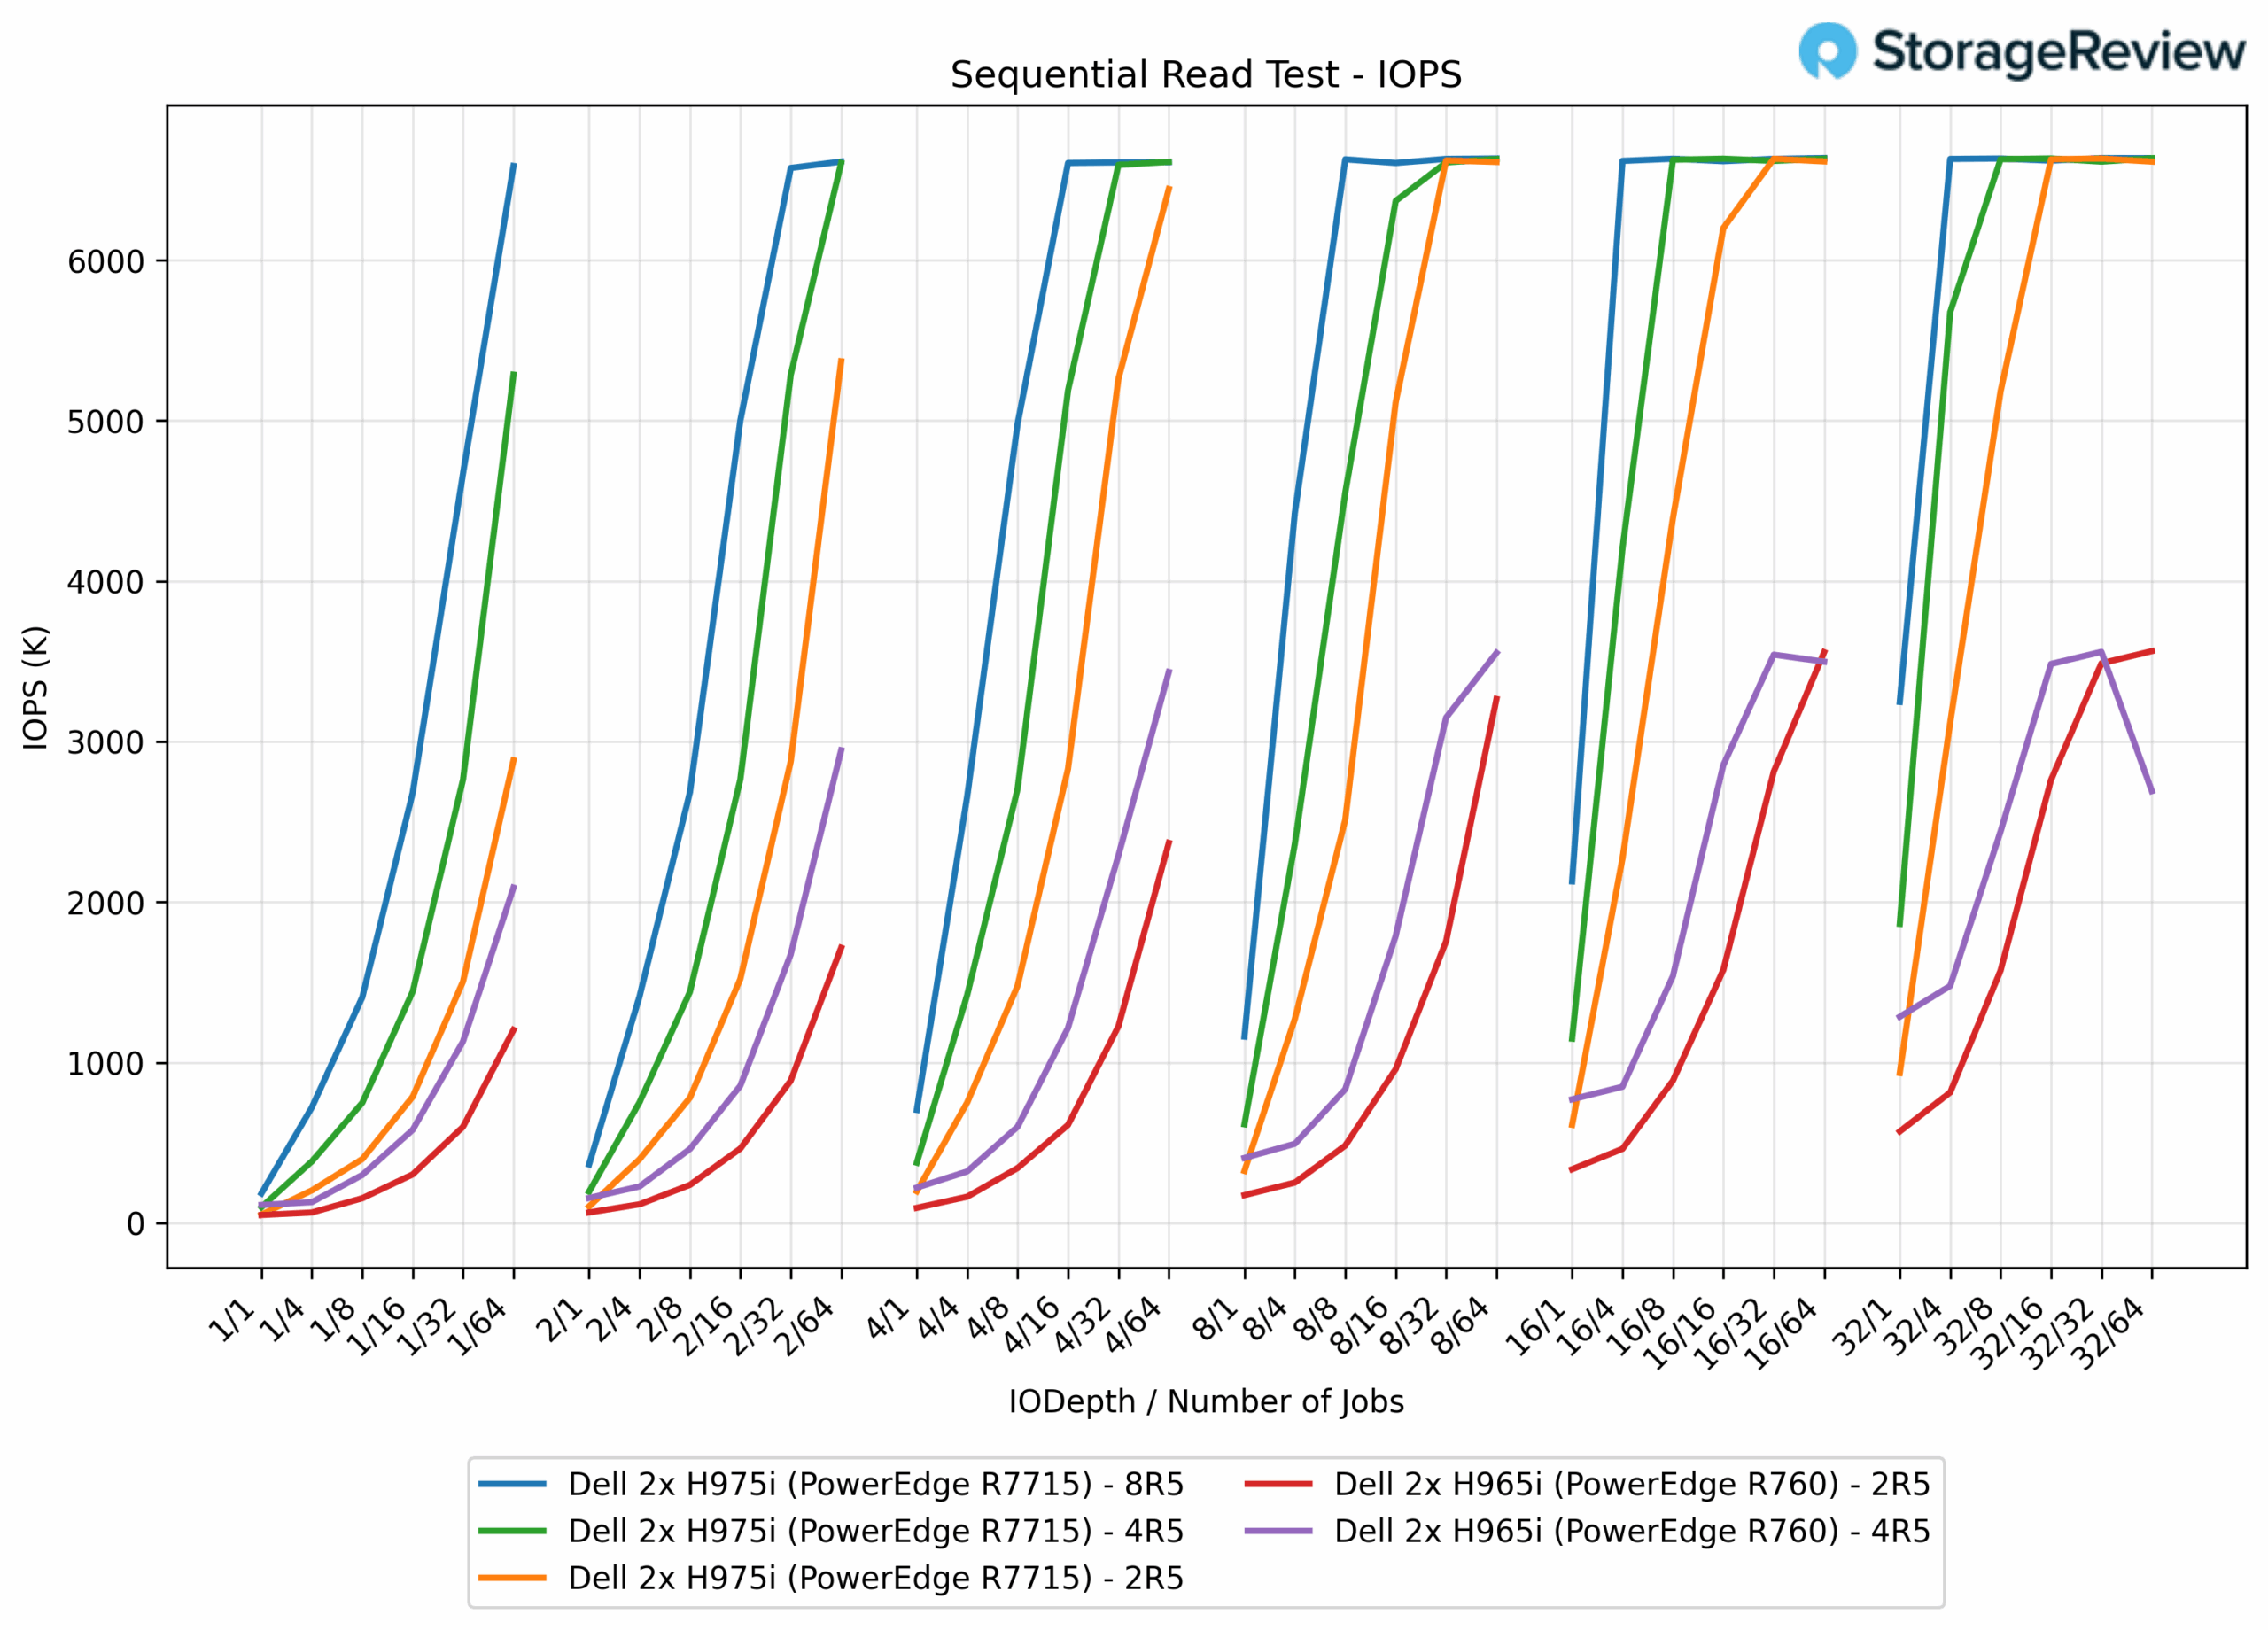
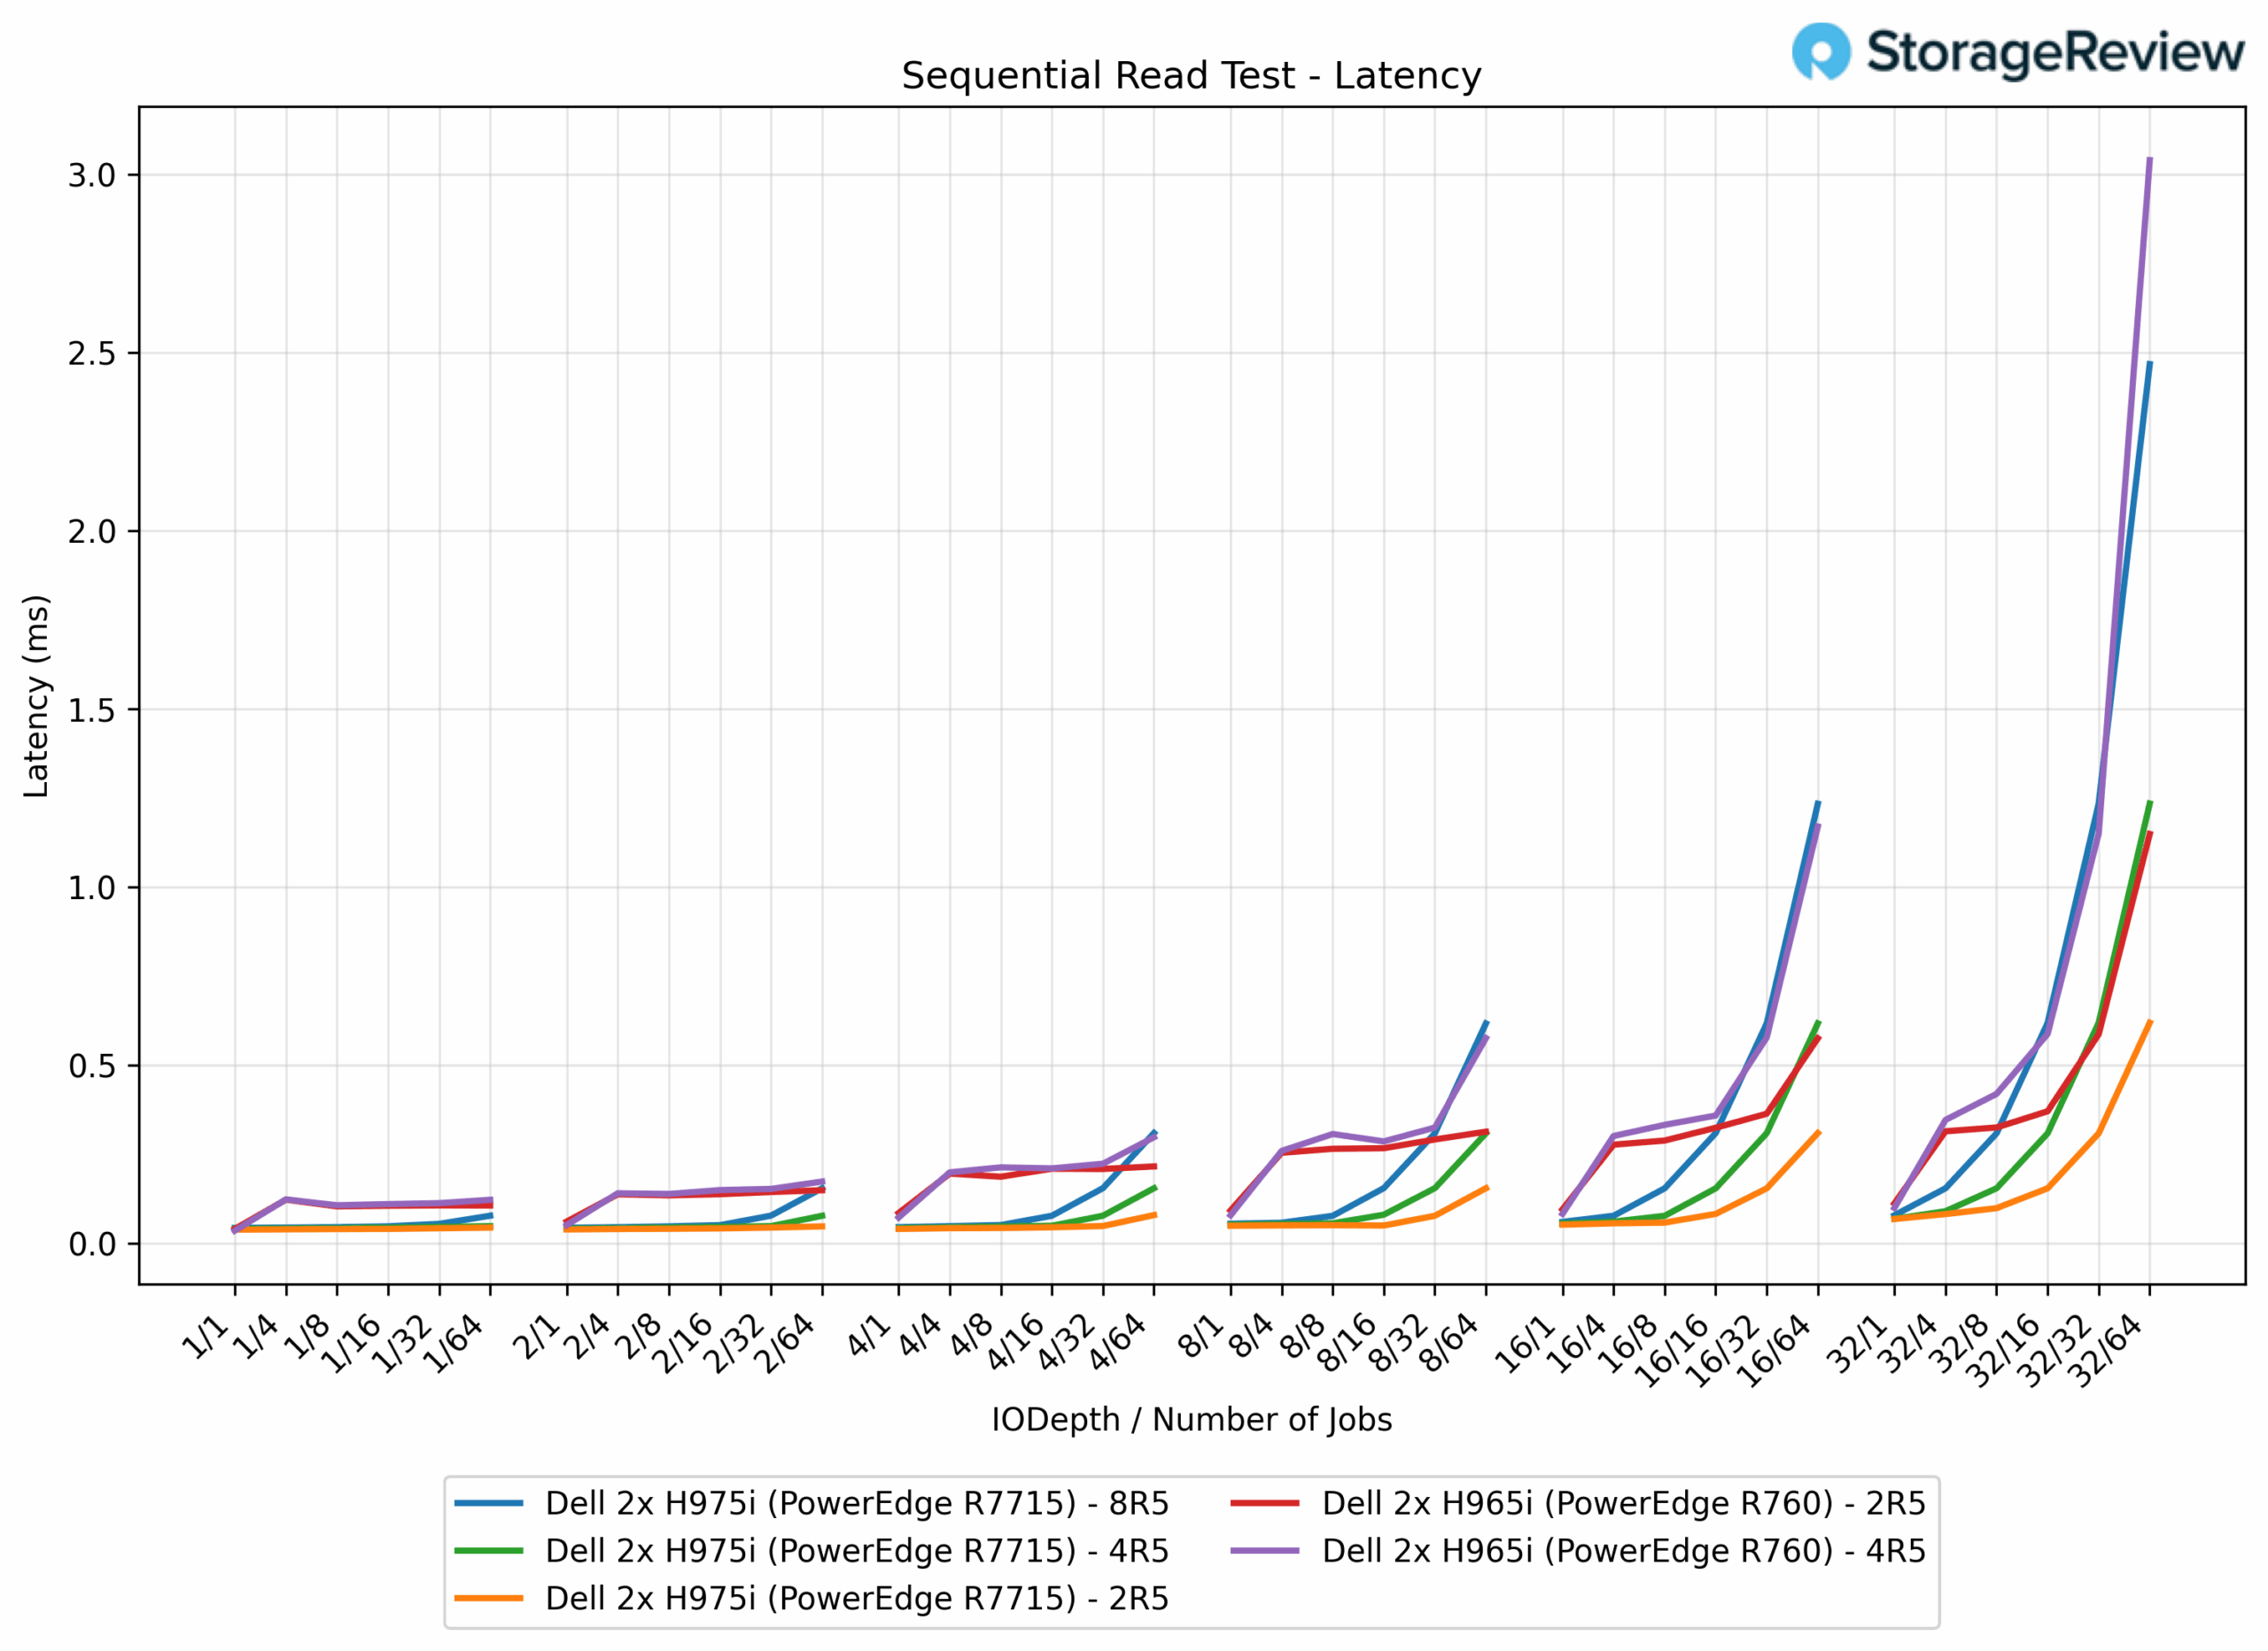
16k Sequential Read Latency
In 16K sequential reads, the H965i 2R5 array ranged from 0.040 ms to 1.15 ms, while 4R5 climbed as high as 3.0 ms. On the H975i, latencies improved: 2R5 came in at 0.038–0.62 ms (46% lower), 4R5 peaked at 1.23 ms (59% lower), and 8R5 reached 2.47 ms (19% lower vs H965i 4R5).
16k Random Write IOPS
With random IO at 16K block size we saw the saturation point being reached very early into the tests. Both the PERC H965i configurations (2R5 and 4R5) delivered nearly identical performance, with approximately 492,000 IOPS. The PERC H975i controllers with the 2R5 array achieved 2.57 million IOPS (422% improvement). The H975i 4R5 and 8R5 configurations were slightly higher at about 2.60 million IOPS (428% improvement).
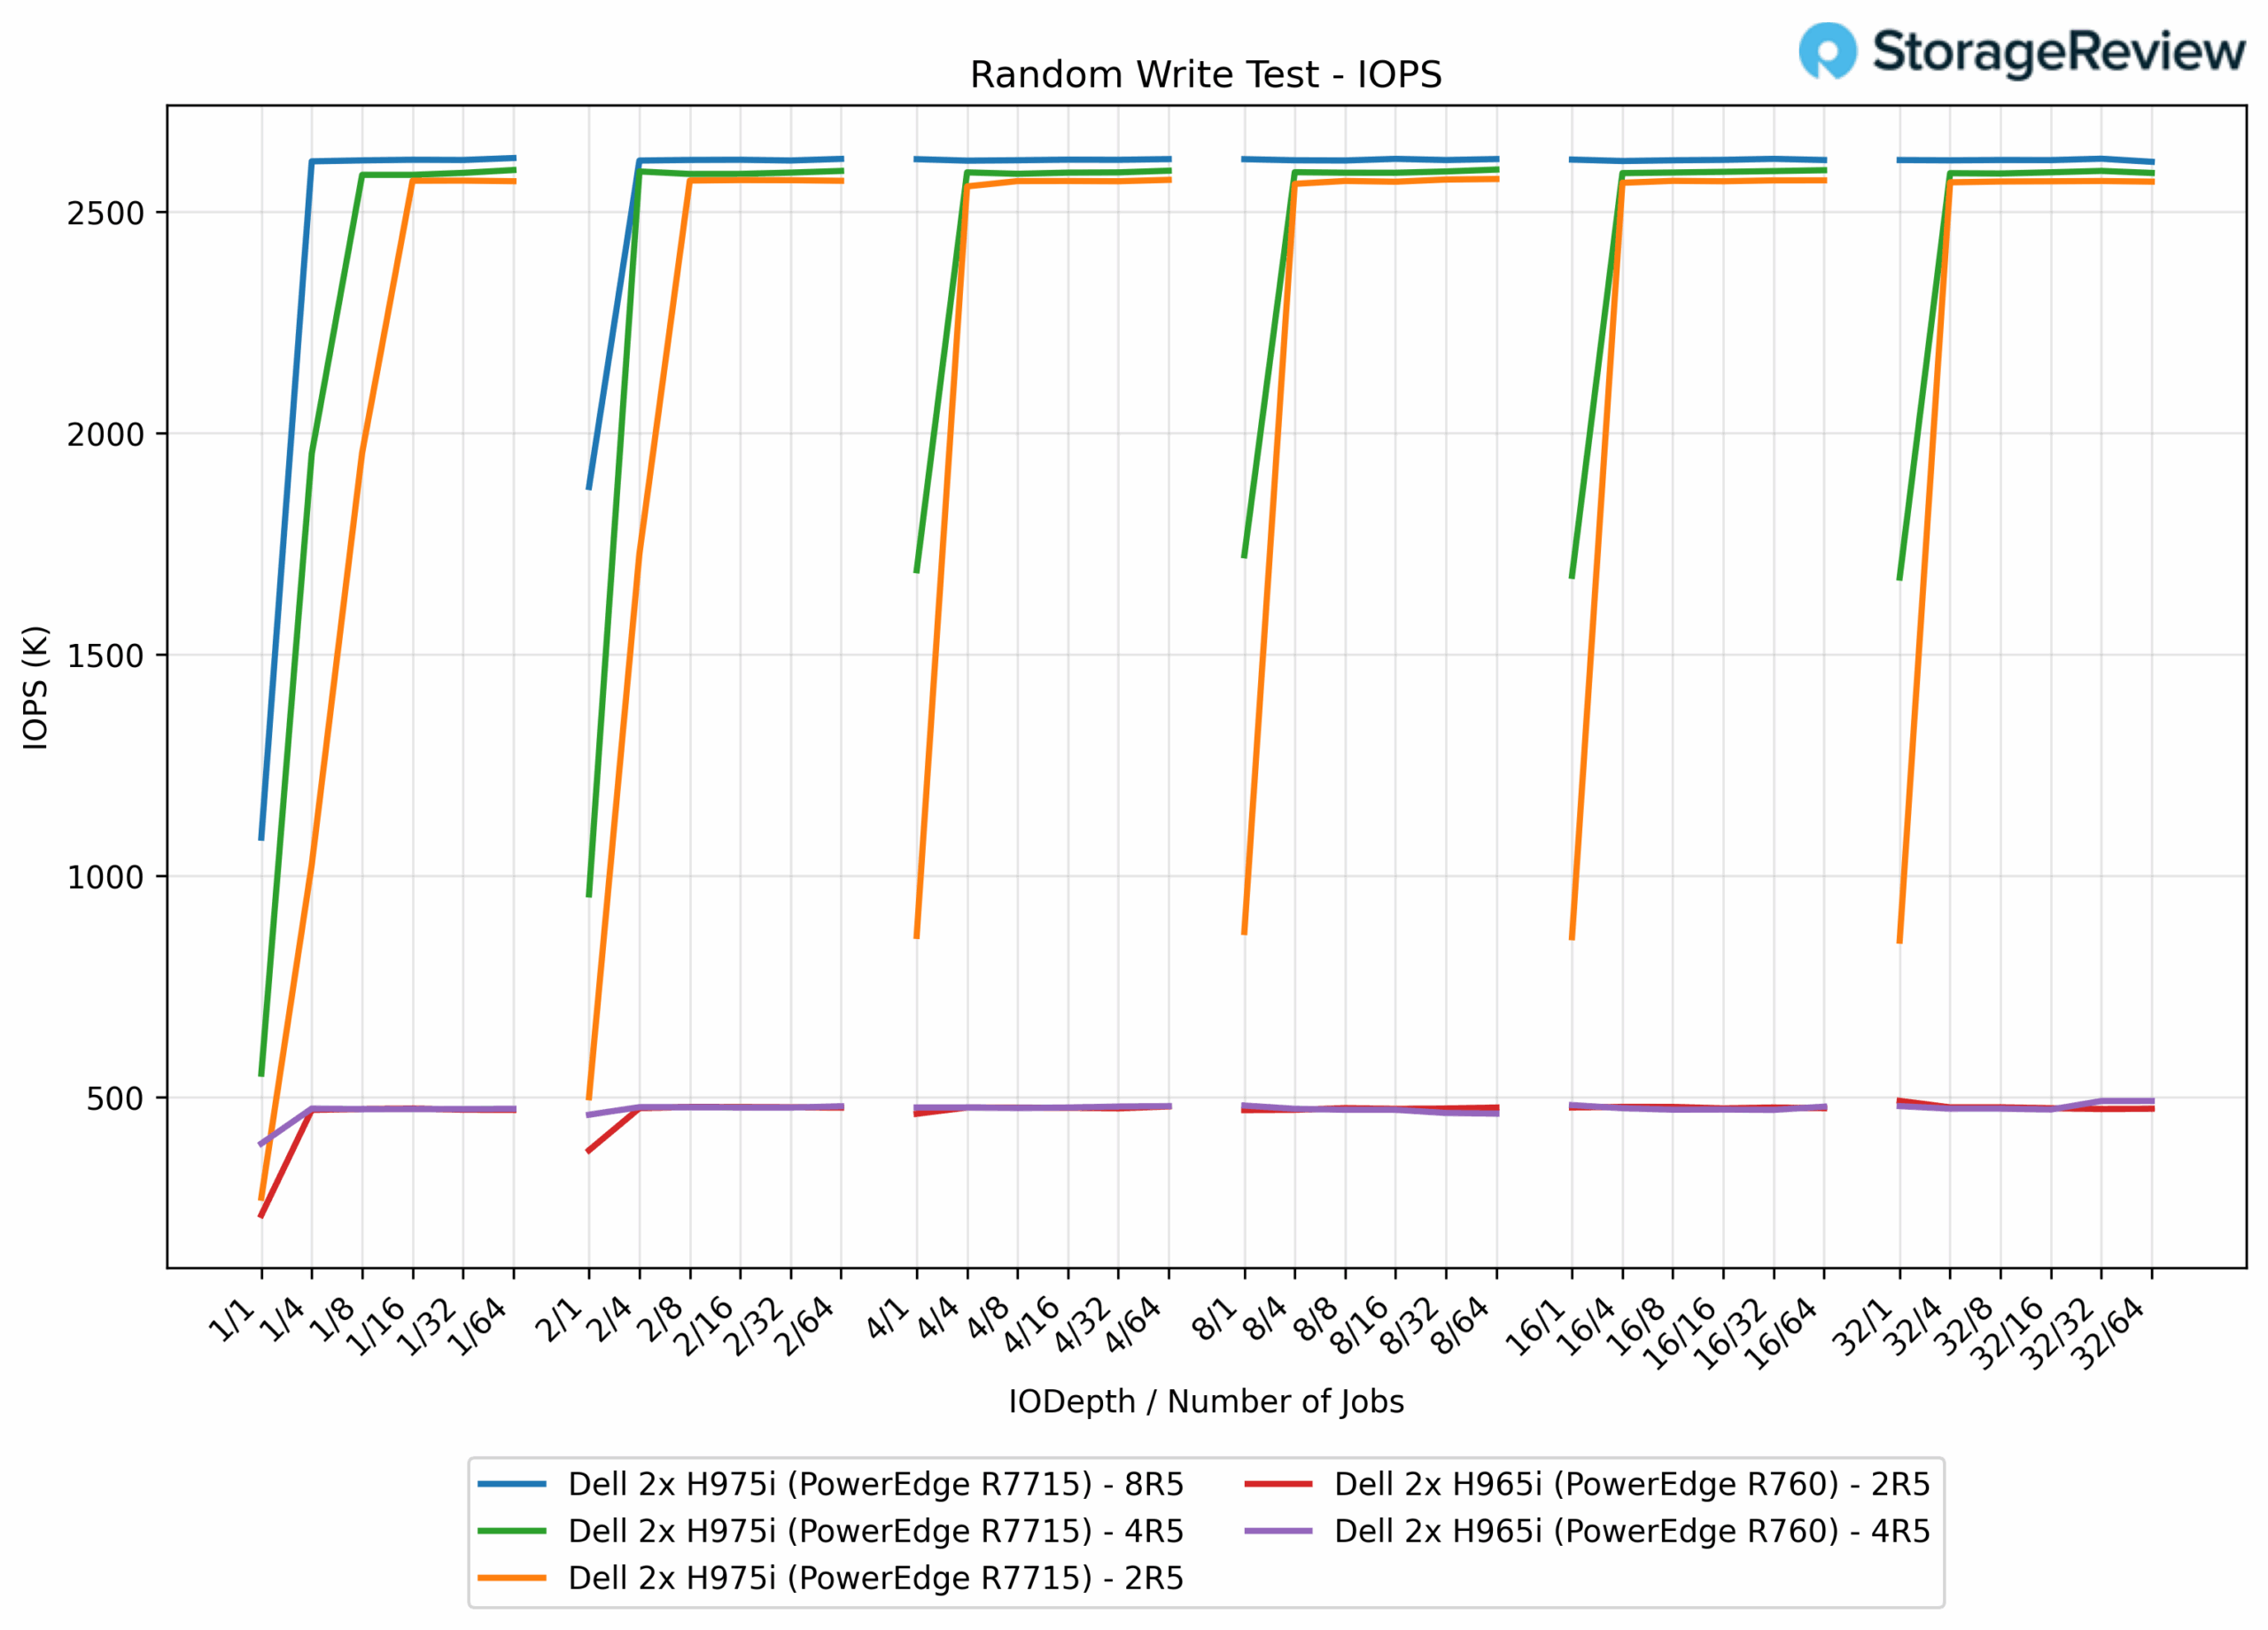
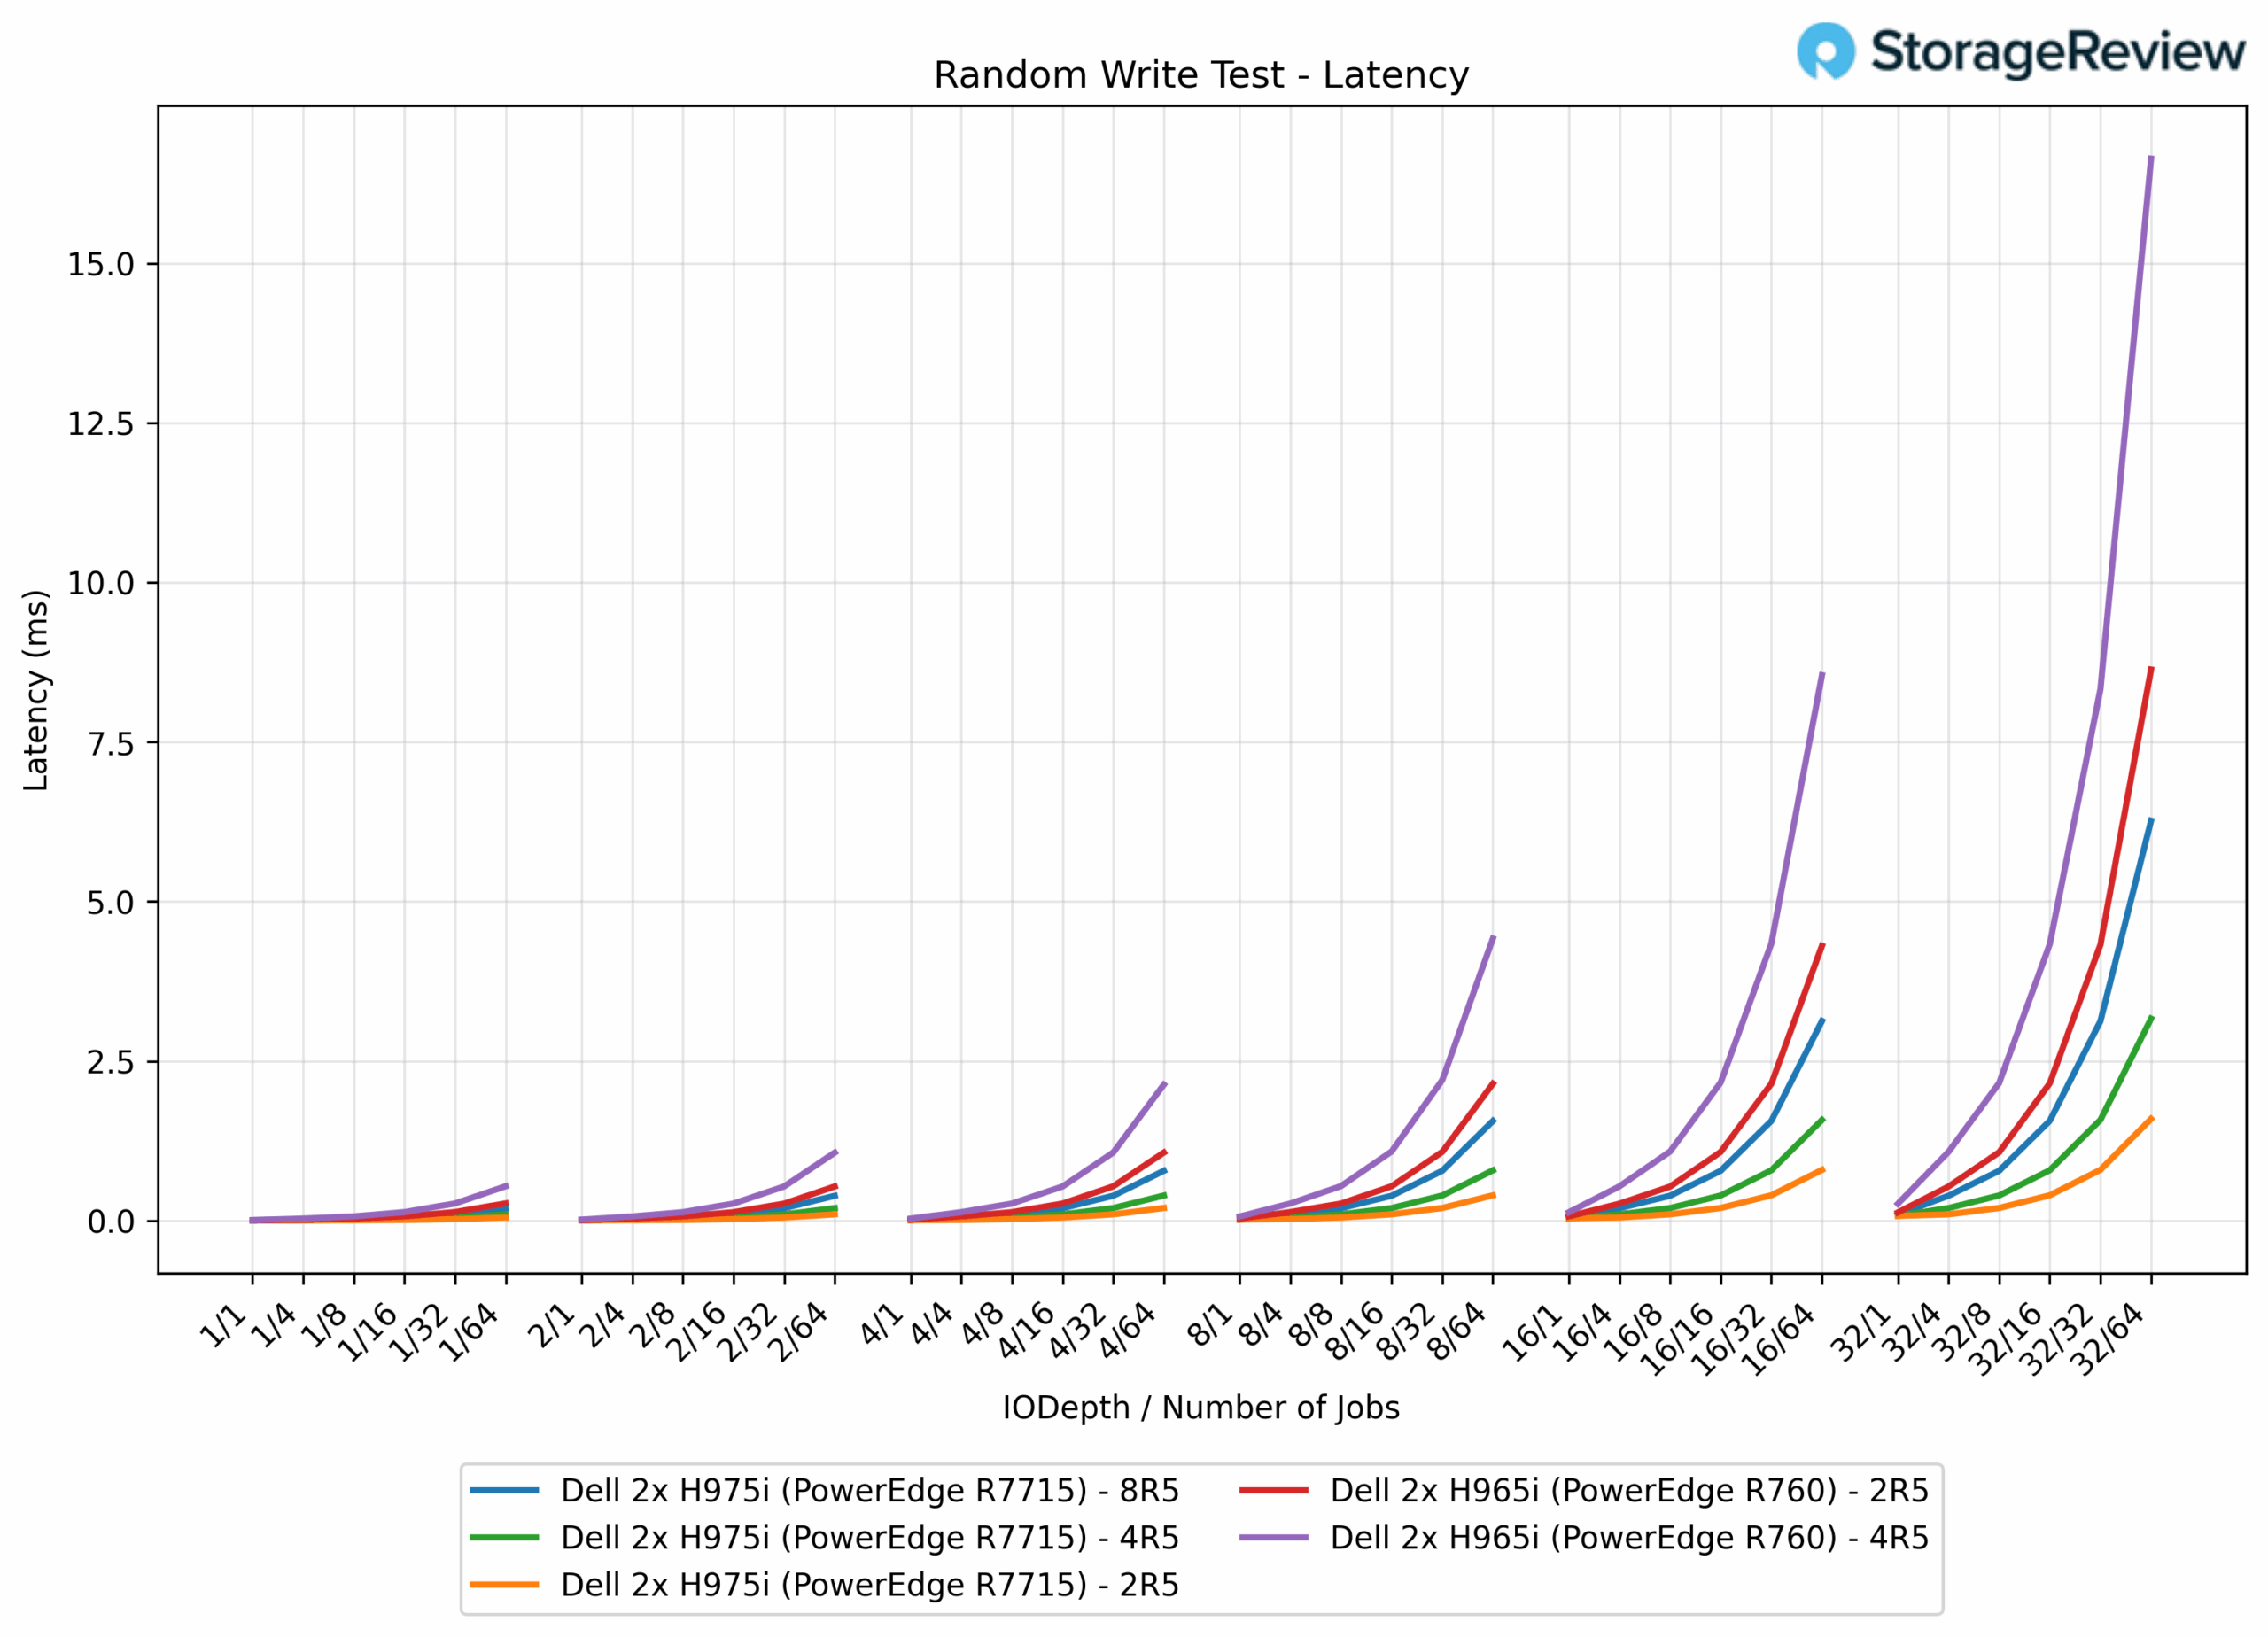
16k Random Write Latency
With 16K random writes, the H965i suffered higher latency, with 2R5 spanning 0.0082–8.6 ms and 4R5 stretching to 16.6 ms. The H975i improved dramatically, with 2R5 at 0.0070–1.59 ms (82% lower), 4R5 up to 3.17 ms (81% lower), and 8R5 maxing at 6.27 ms (62% lower vs H965i 4R5).
16k Random Read IOPS
In 16K random read, the PERC H965i configurations delivered consistent performance with the 2R5 array achieving 3.55 million IOPS and the 4R5 array reaching 3.55 million IOPS. The PERC H975i 2R5, 4R5, and 8R5 configurations achieved nearly identical peak performance around 6.64 million IOPS, representing an 87% improvement over the H965i generation.
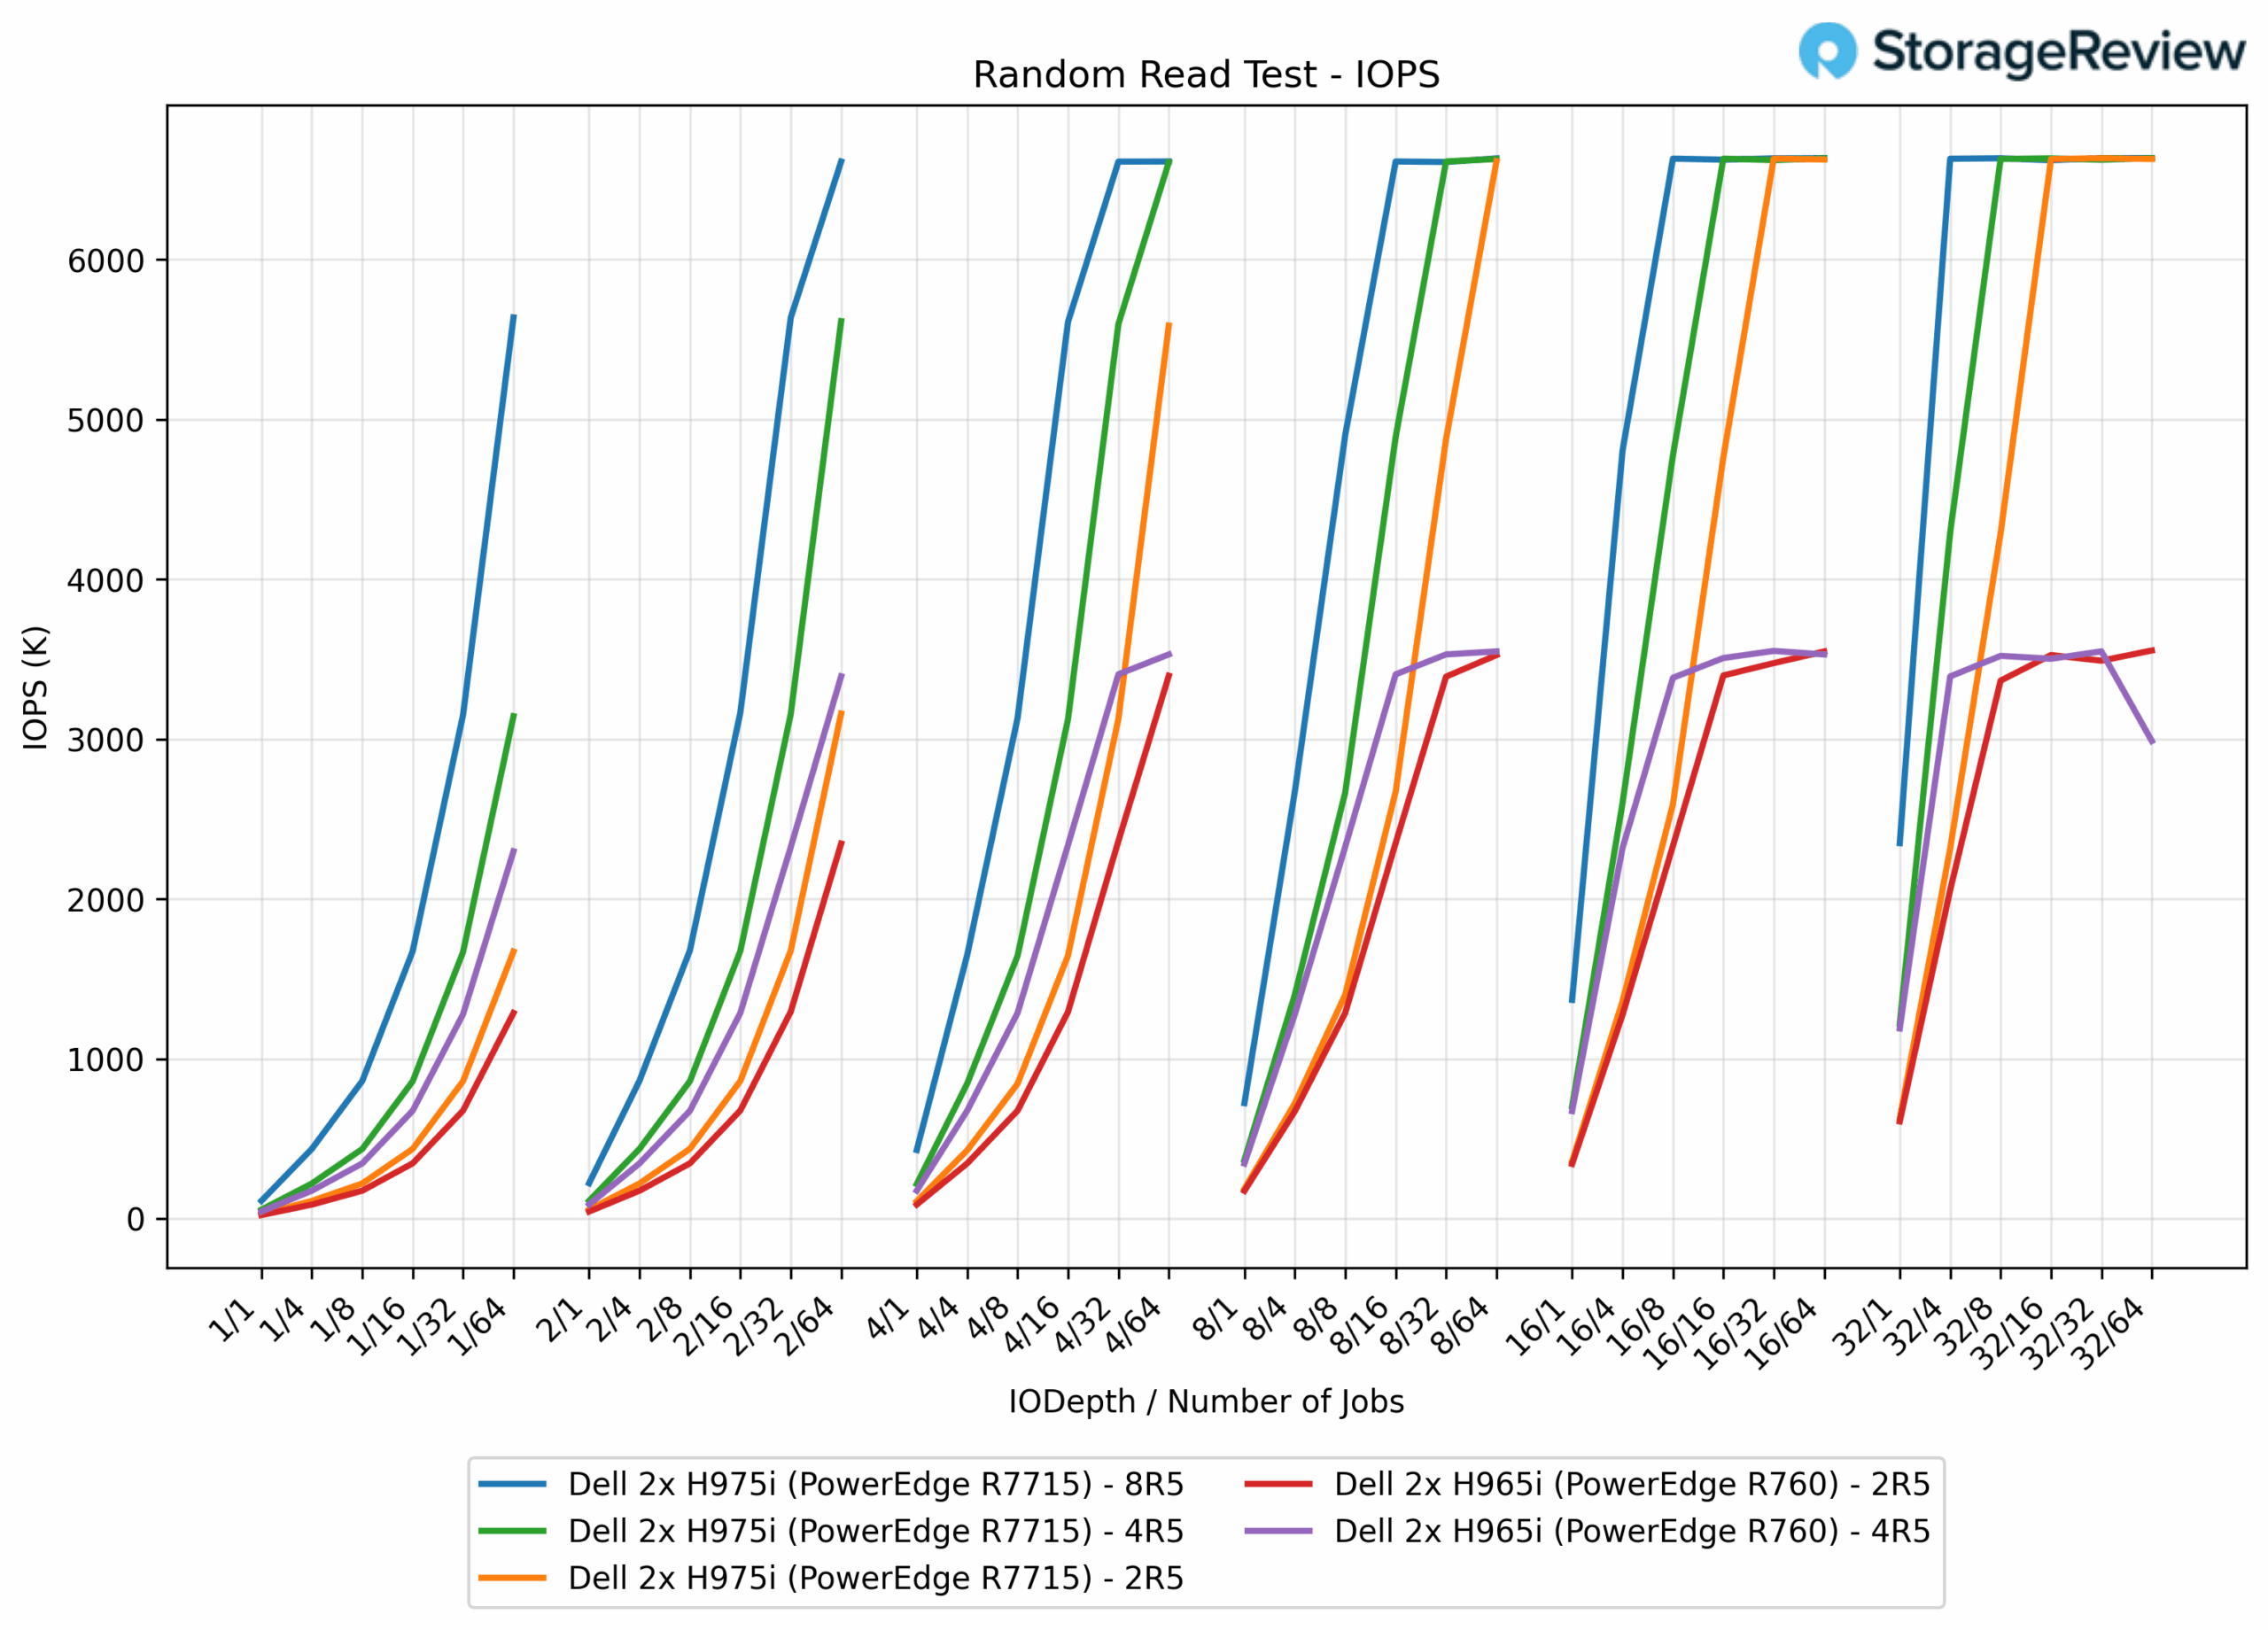
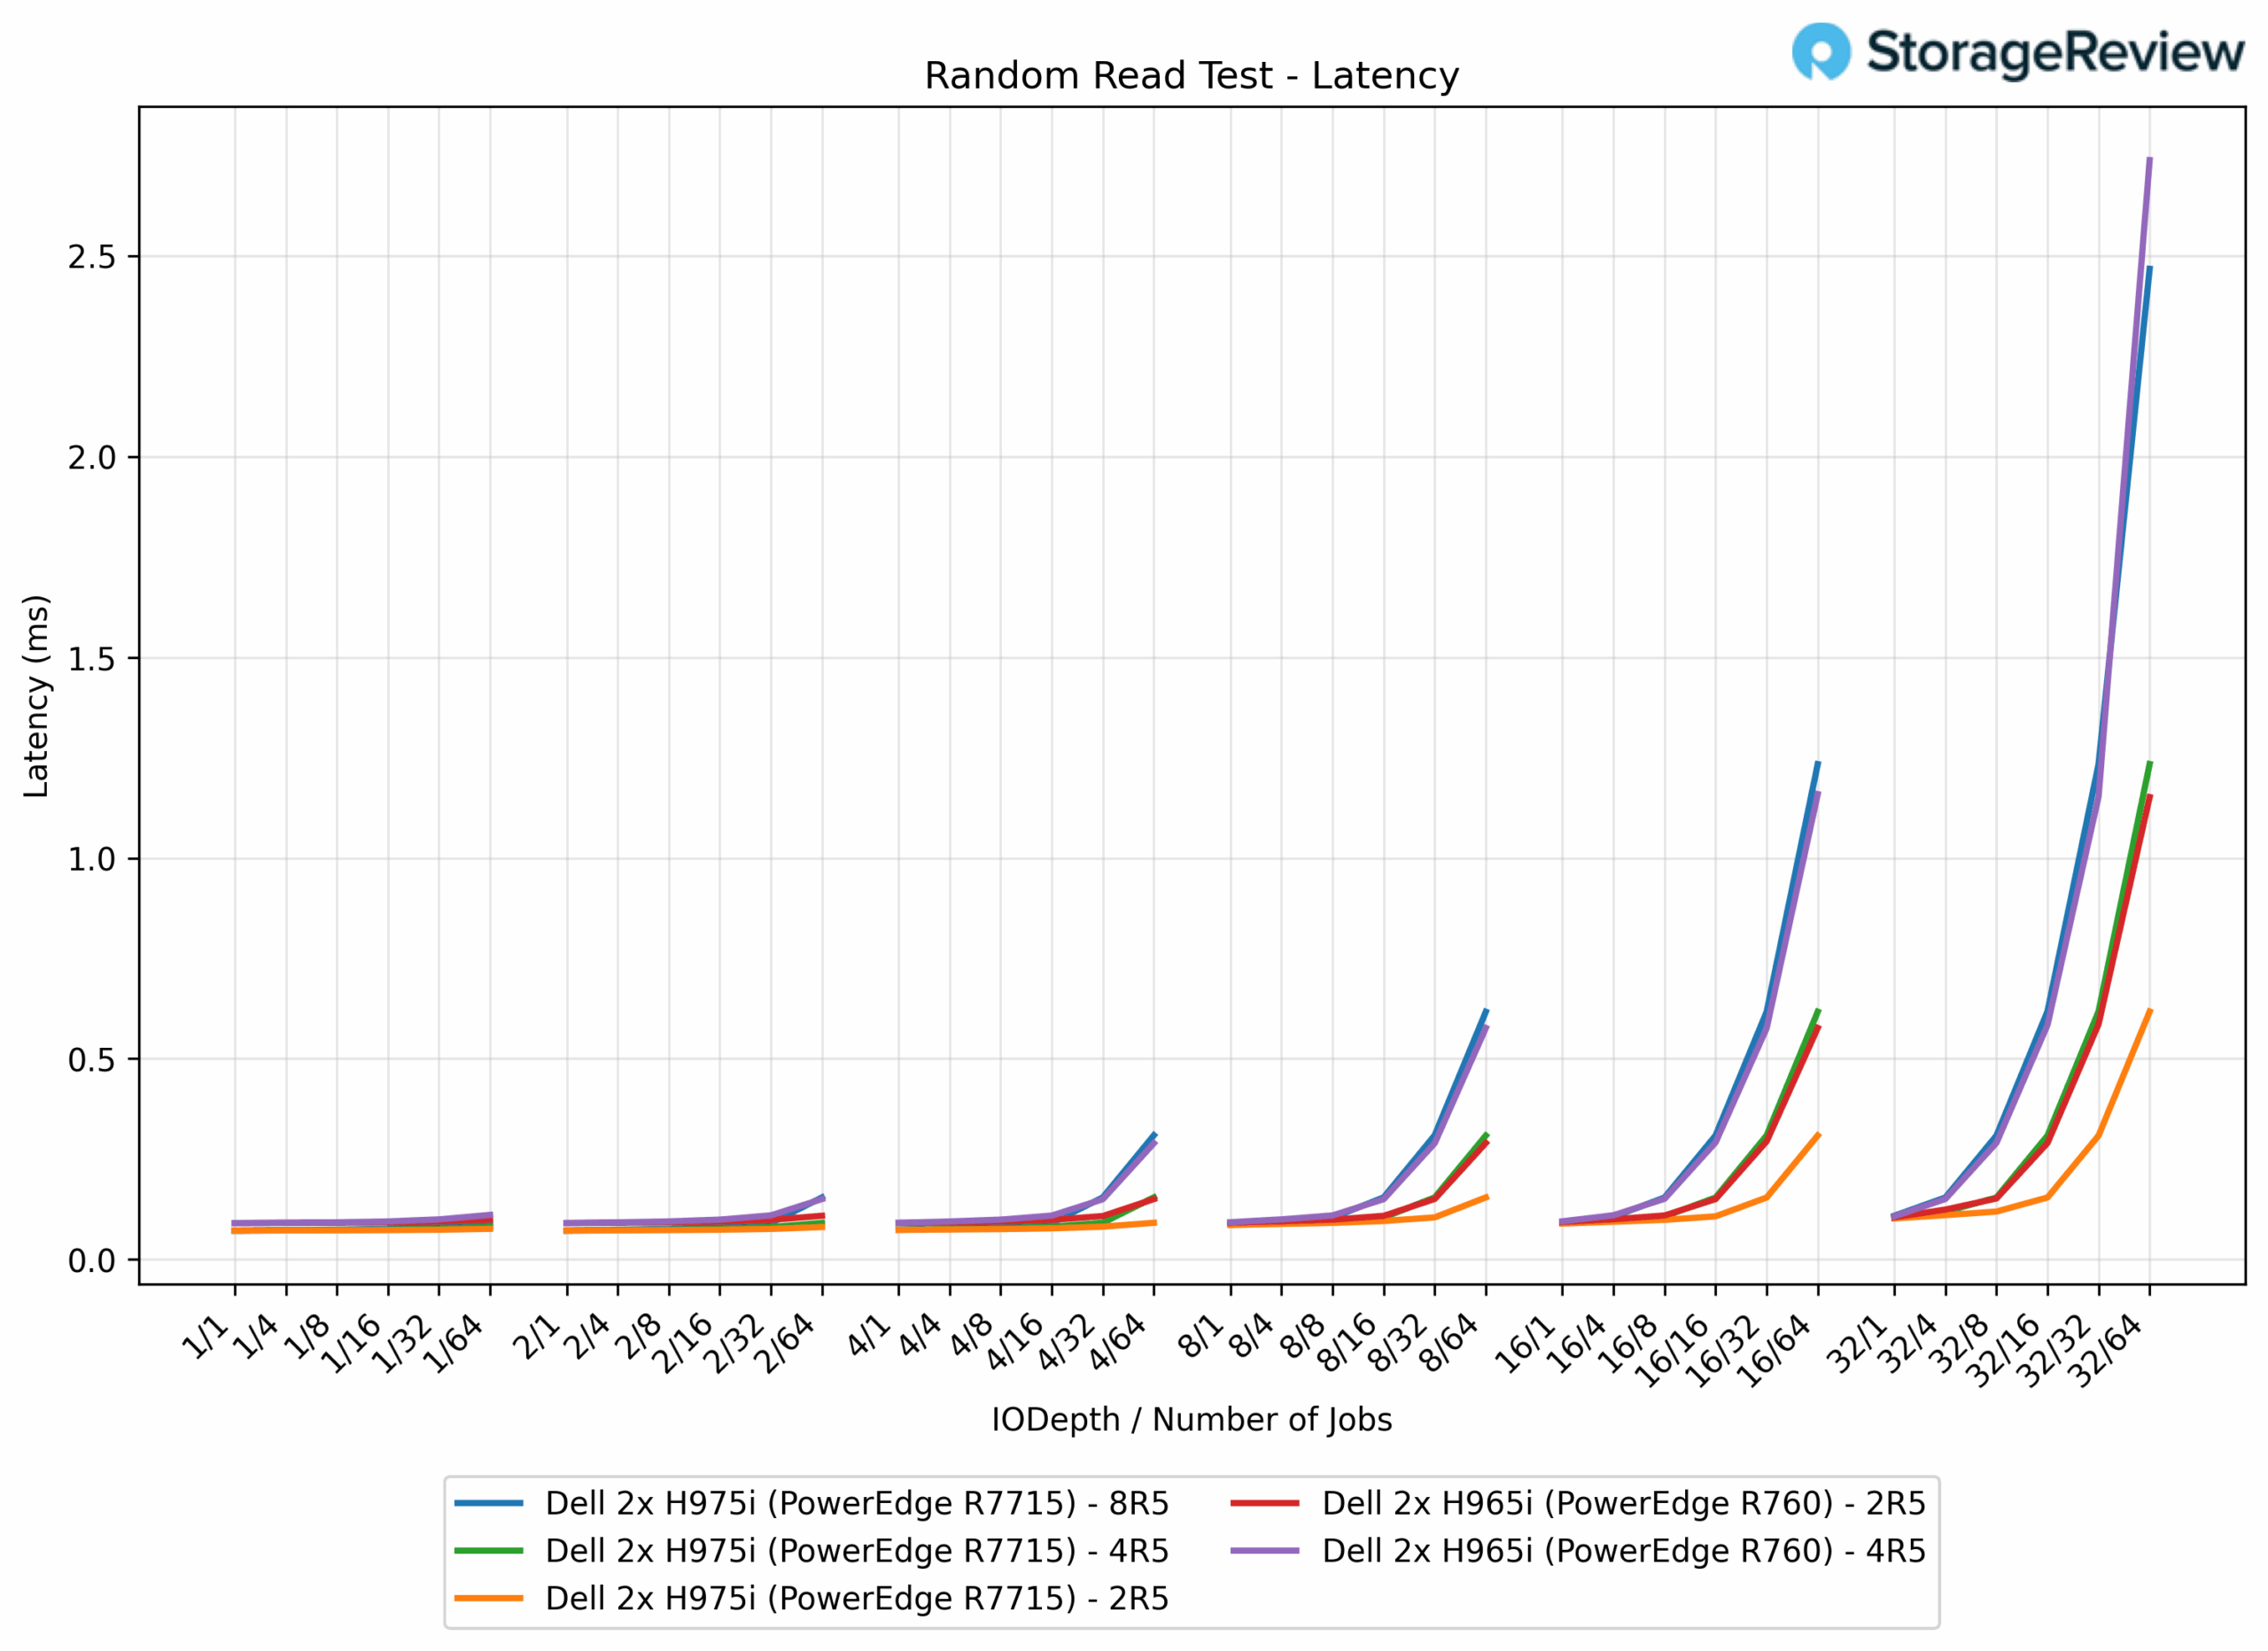
16k Random Read Latency
In 16K random reads, the H965i arrays delivered 0.0906–1.15 ms for 2R5 and up to 2.74 ms for 4R5. The H975i once again reduced latency, with 2R5 at 0.072–0.62 ms (46% lower), 4R5 up to 1.23 ms (55% lower), and 8R5 peaking at 2.47 ms (10% lower vs H965i 4R5).
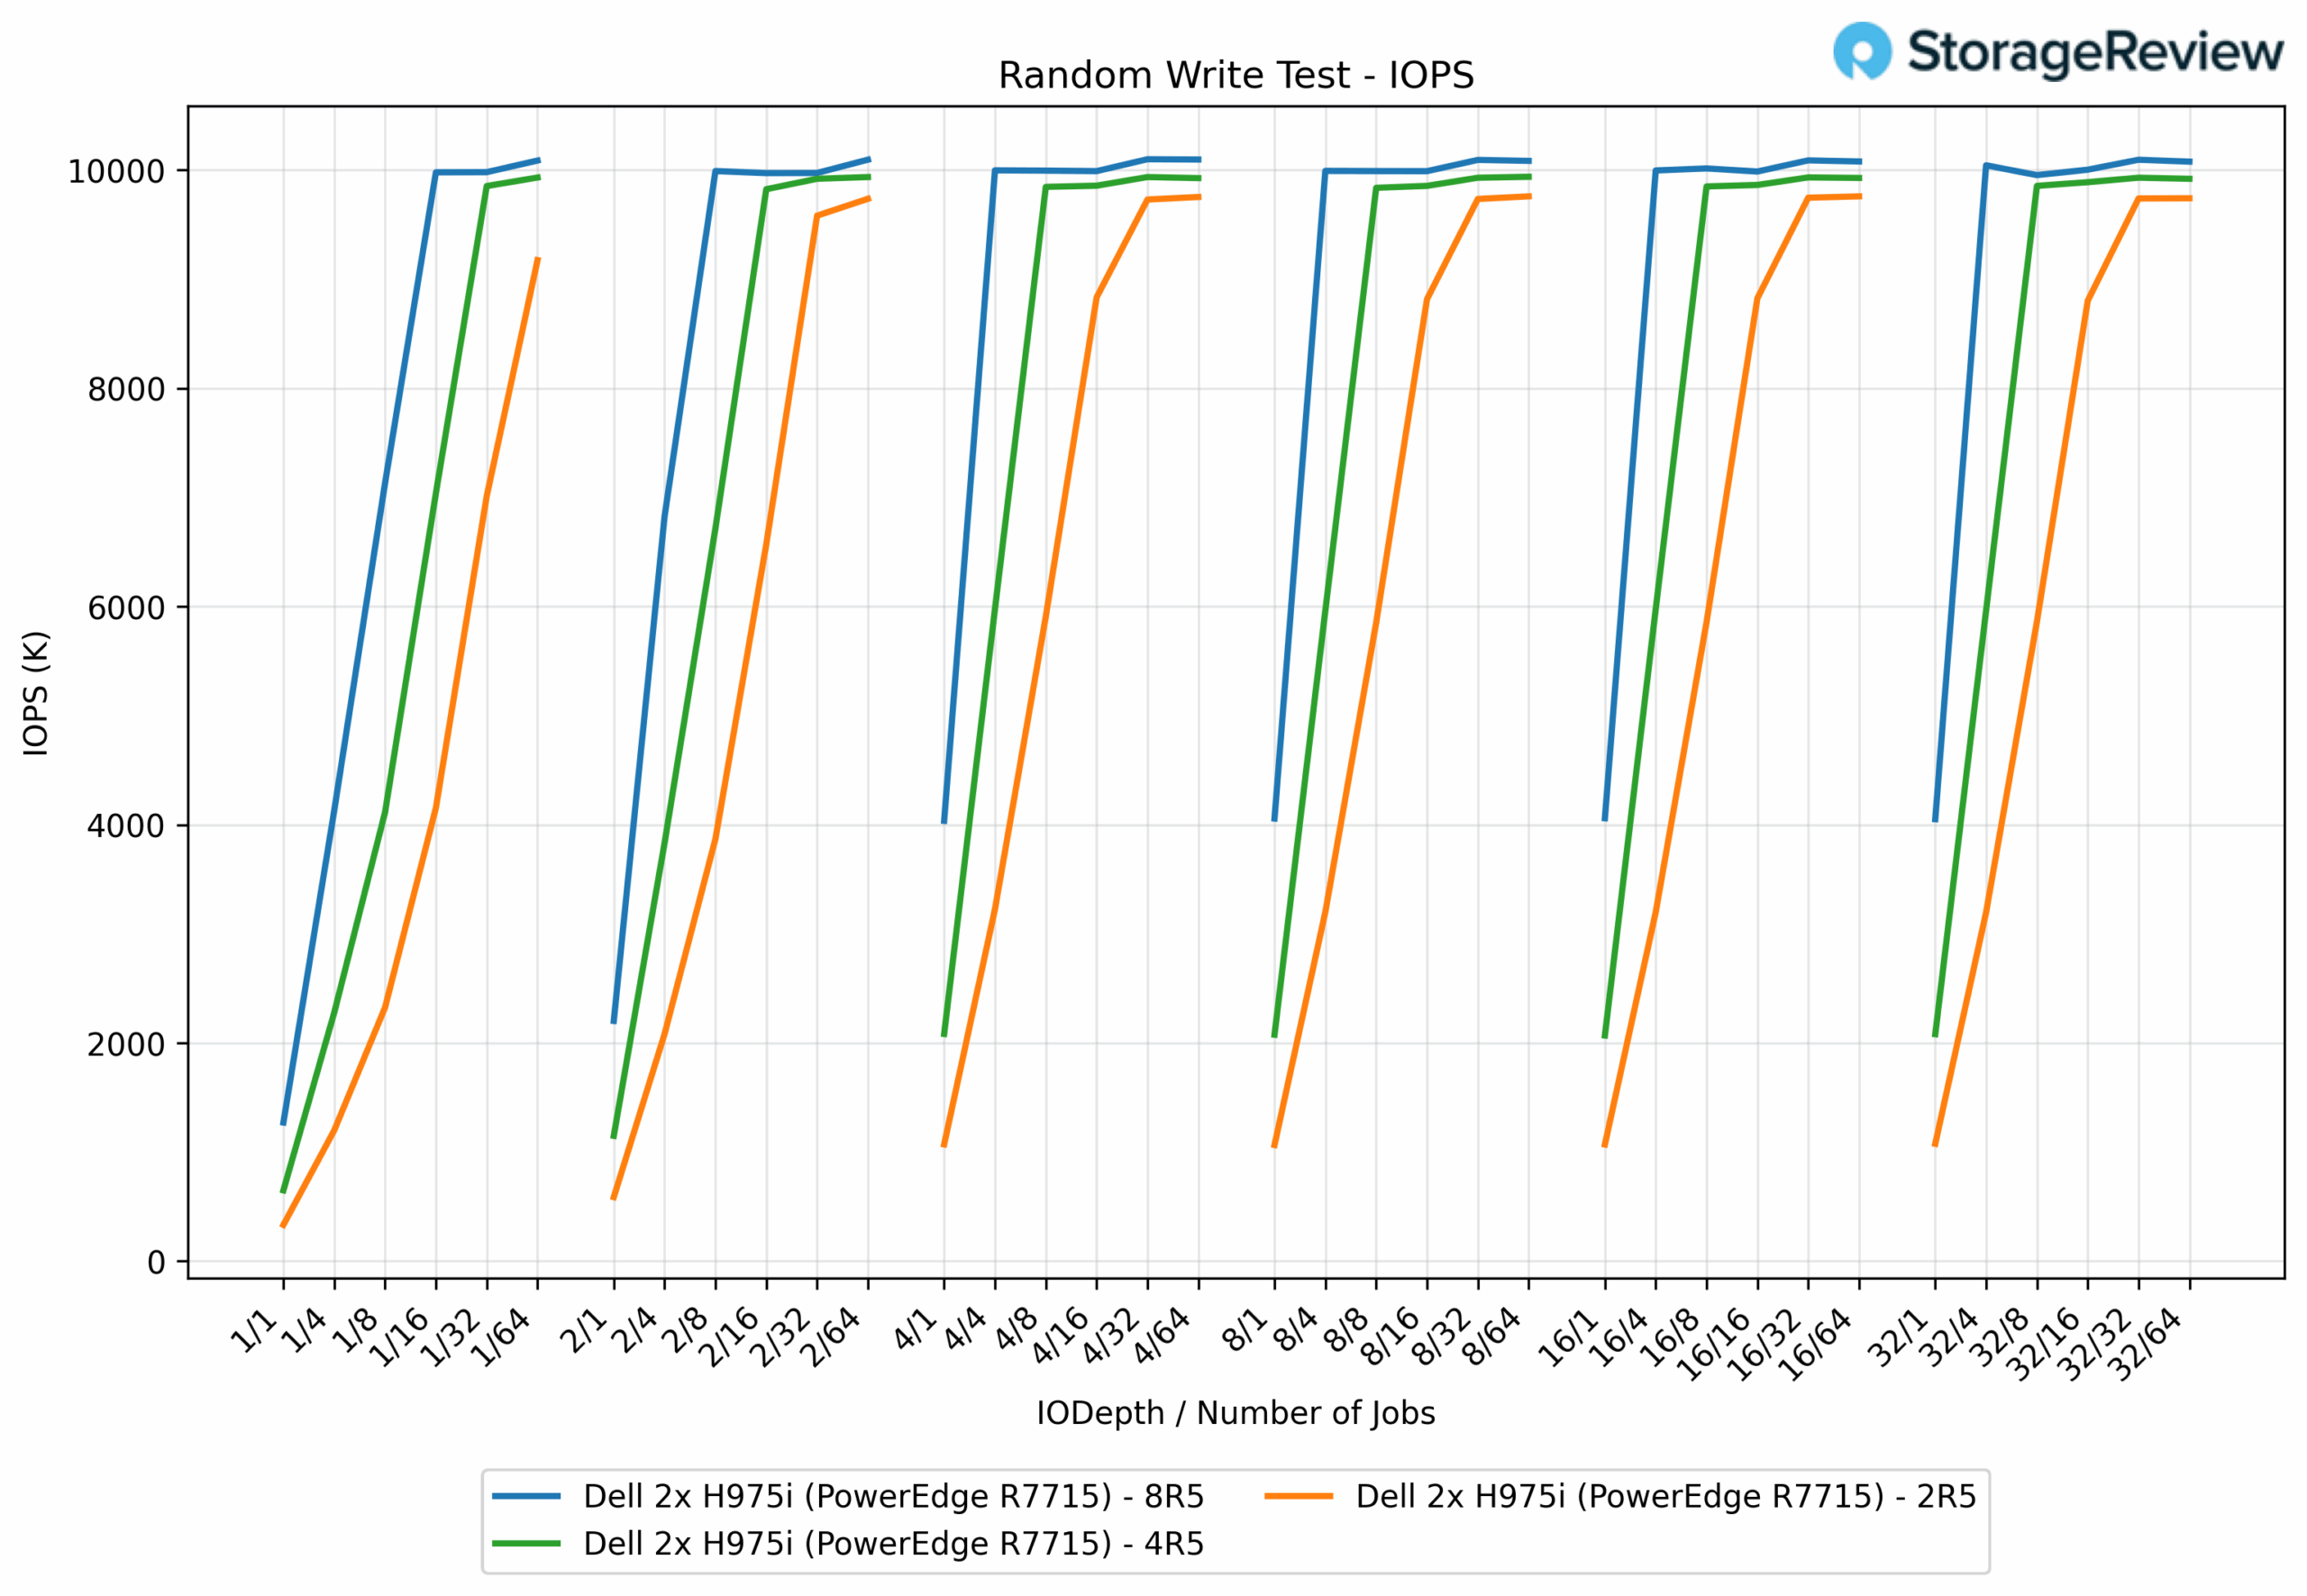
4K Random Write IOPS
In 4K random write tests, the PERC H975i controllers with 2R5 configuration achieved a peak of 9.76 million IOPS, while the 4R5 array delivered slightly higher performance at 9.94 million IOPS. The 8R5 configuration demonstrated the strongest performance, reaching 10.10 million IOPS.
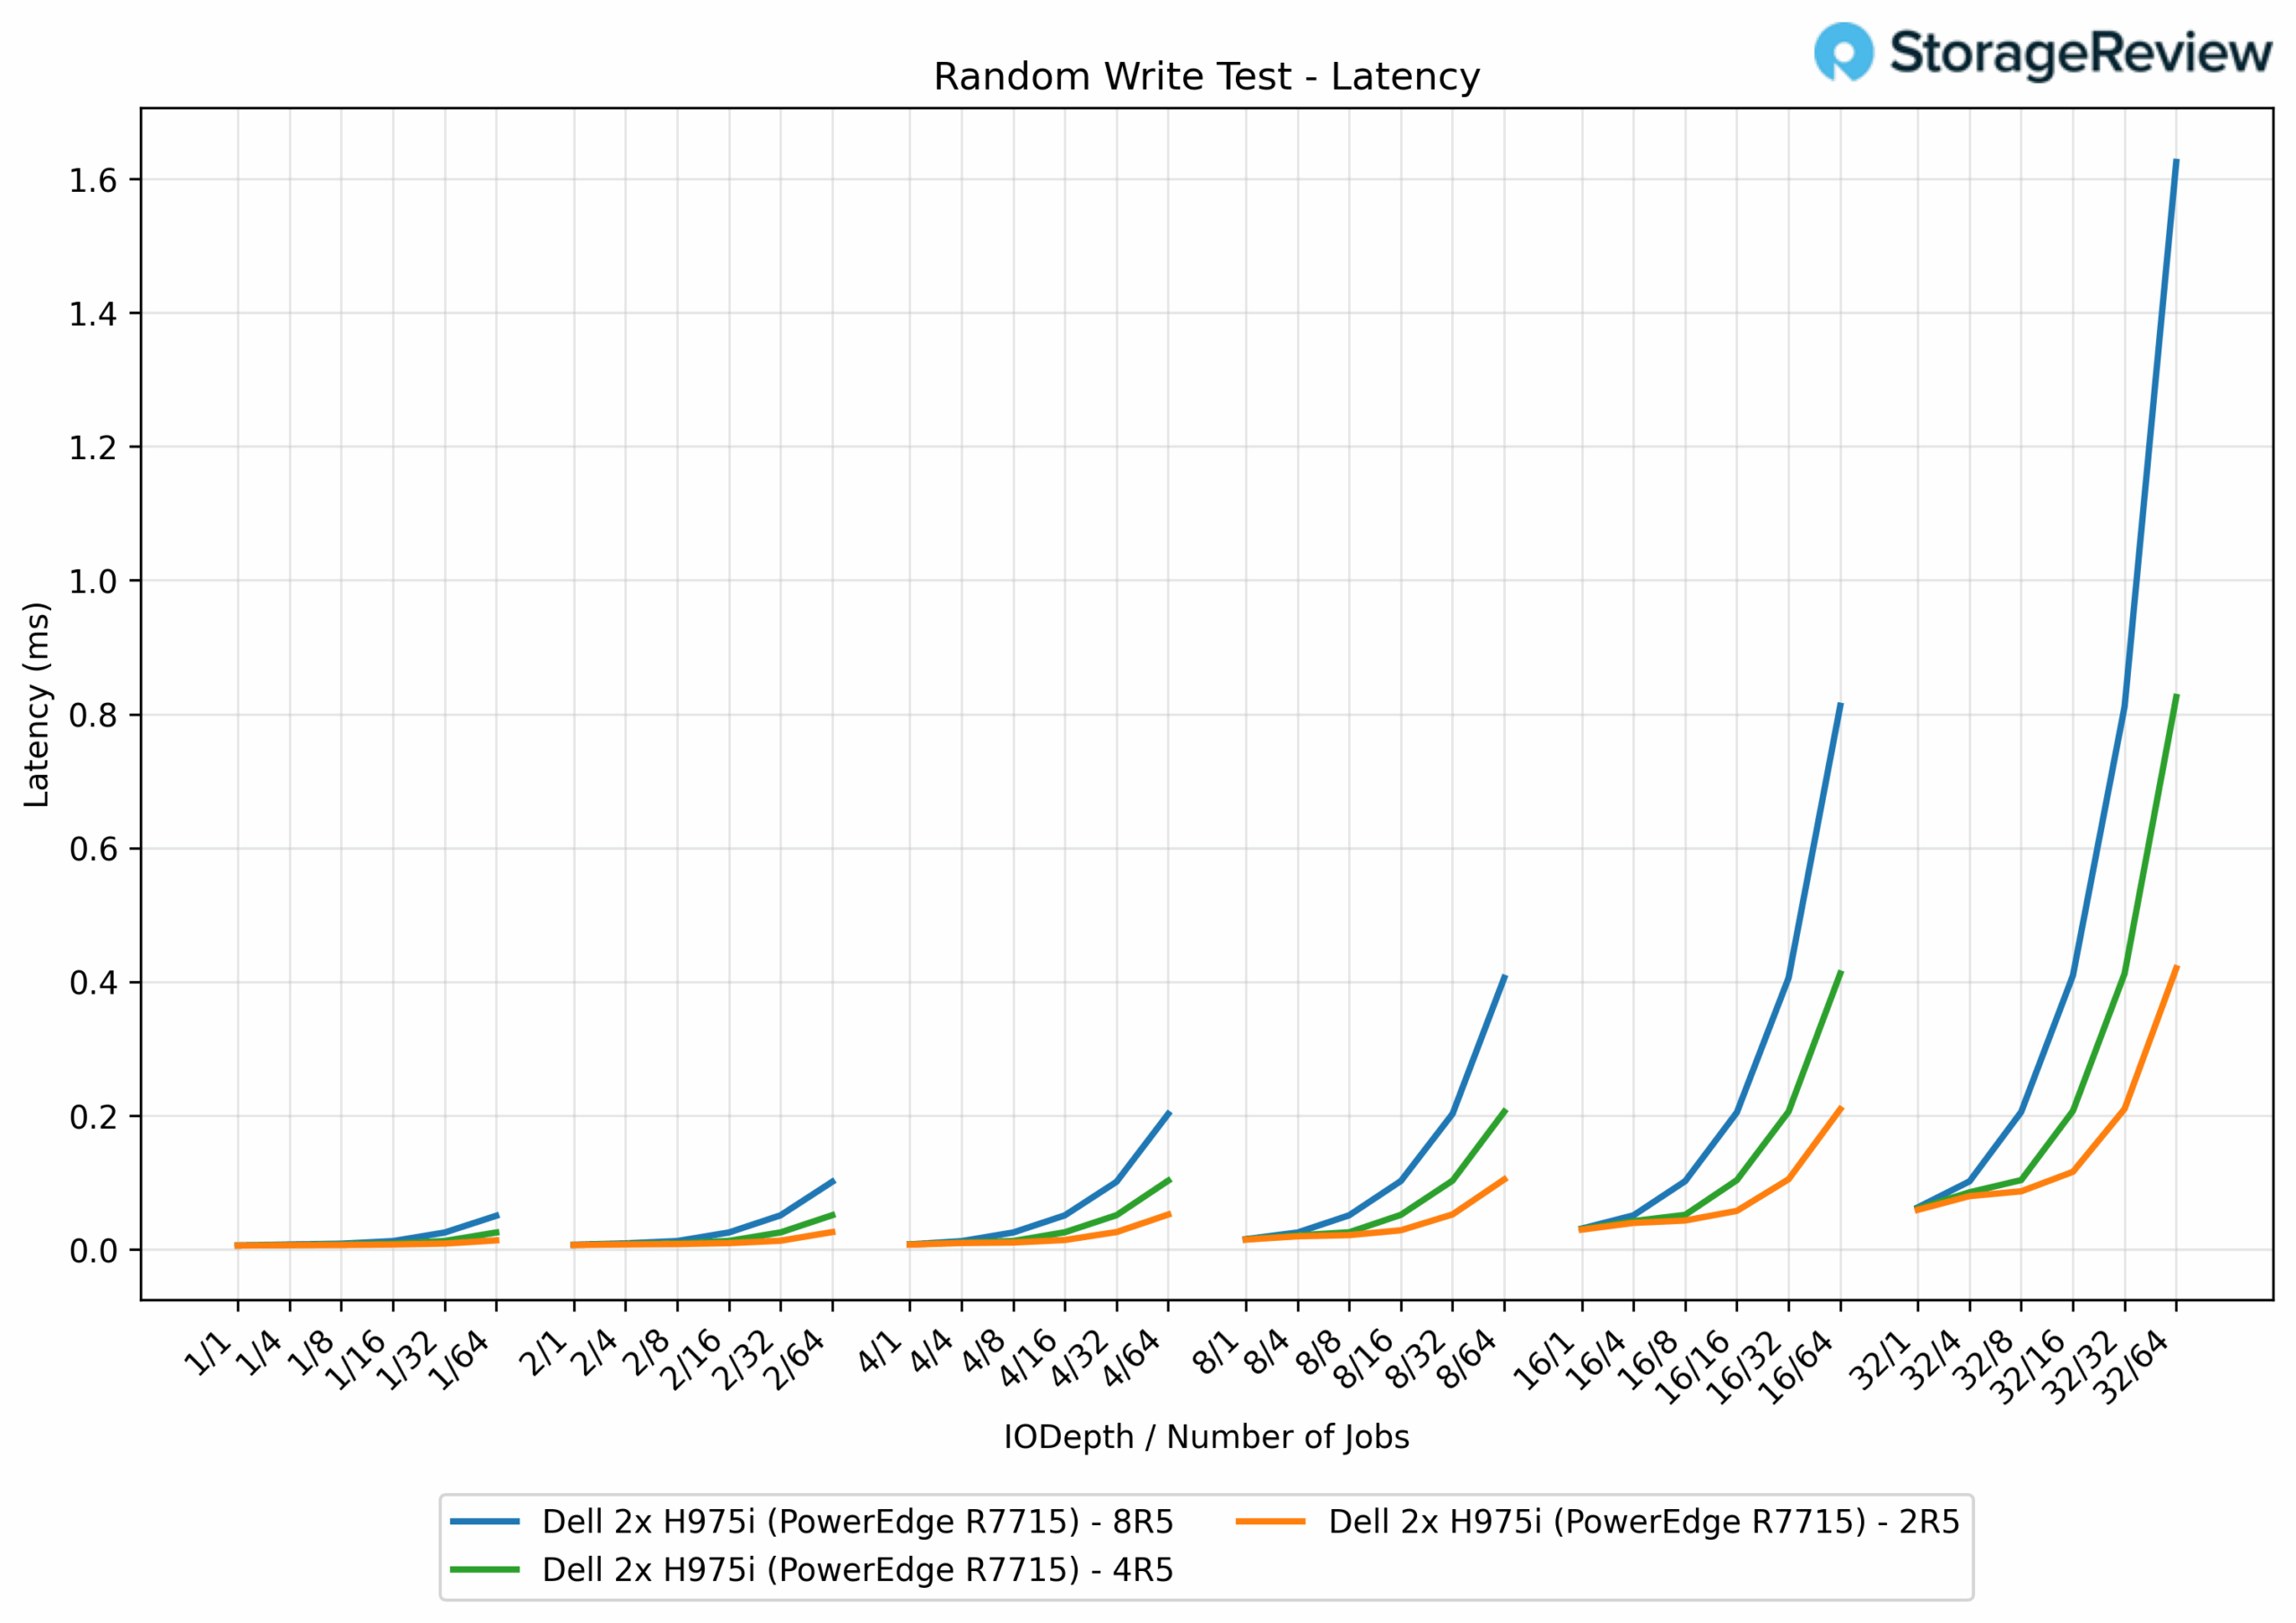
4K Random Write Latency
For 4K testing, we solely evaluated the H975i for peak performance. Latency was excellent across all arrays: 2R5 ranged from 0.0058 ms to 0.47 ms, 4R5 peaked at 0.88 ms, and 8R5 reached 1.63 ms. These results demonstrate that at the smallest block size, the H975i maintained exceptionally low latencies, consistently under 2 ms.
4K Random Read IOPS
We’ve reserved one of the most exciting charts for last: in 4K random read tests, the H975i with the 2R5 configuration reached an impressive 17.3 million IOPS. The H975i 4R5 array reached 20.1 million IOPS, while the 8R5 configuration delivered the highest throughput at 25.2 million IOPS.
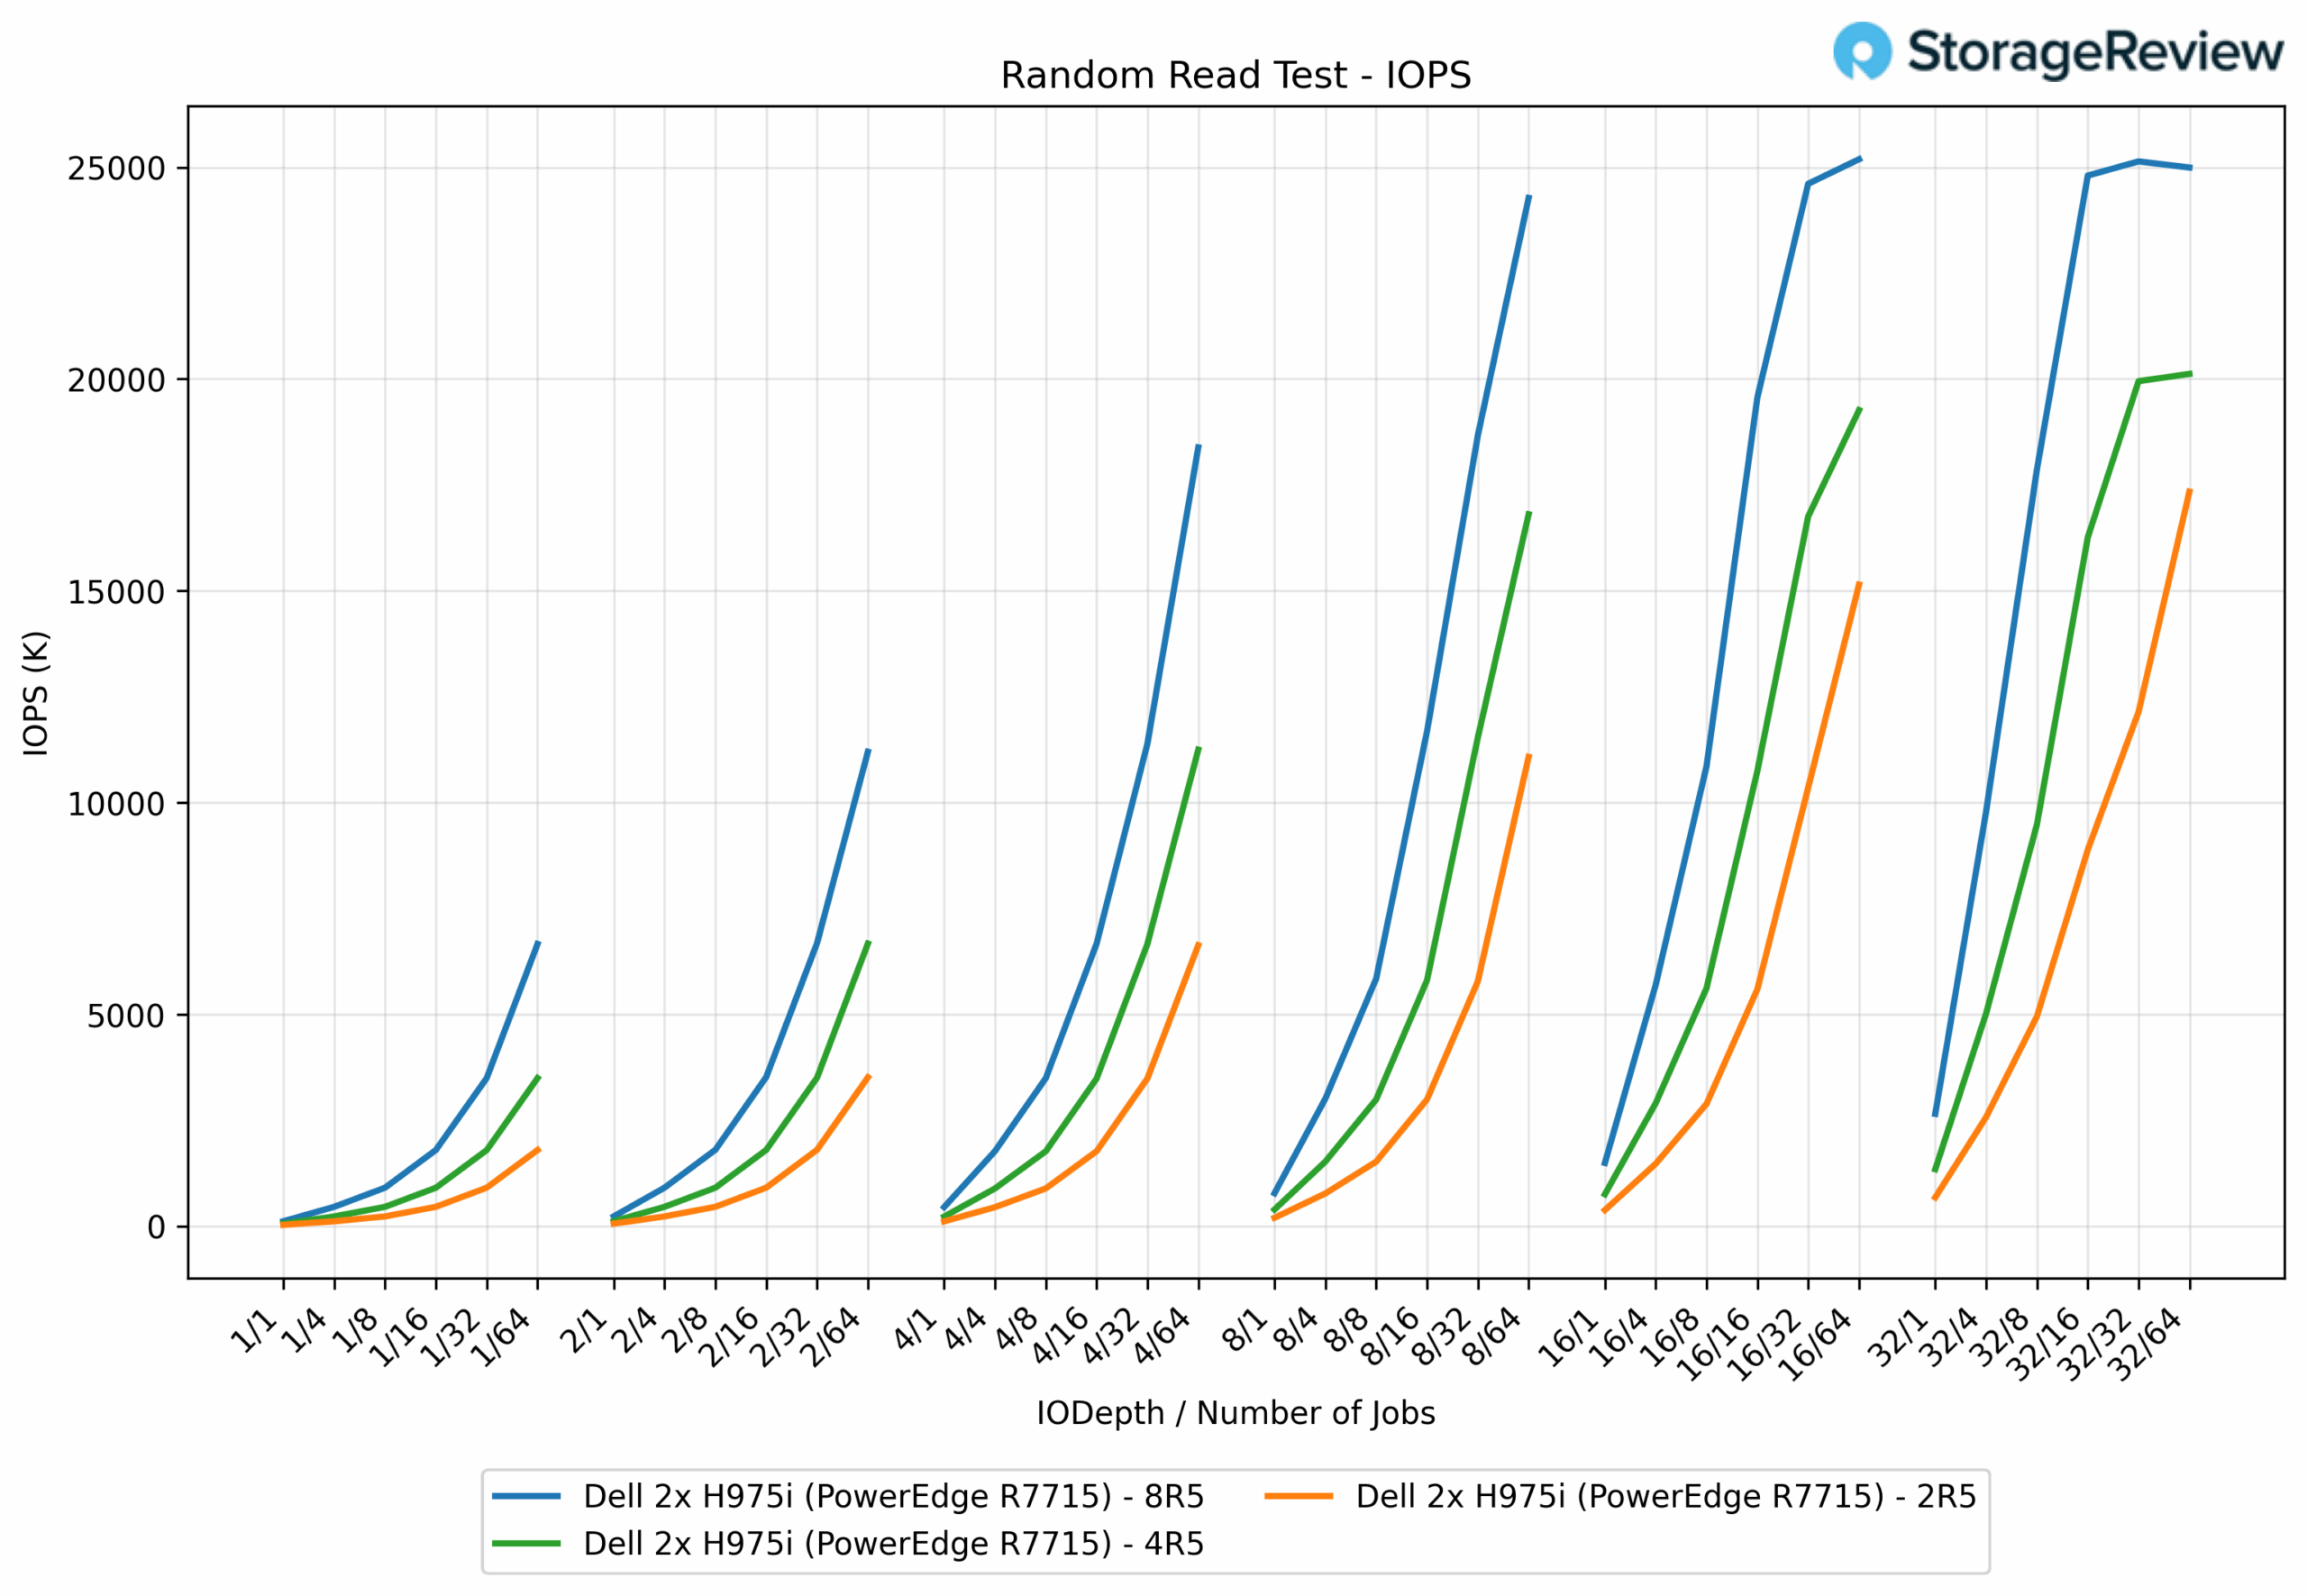
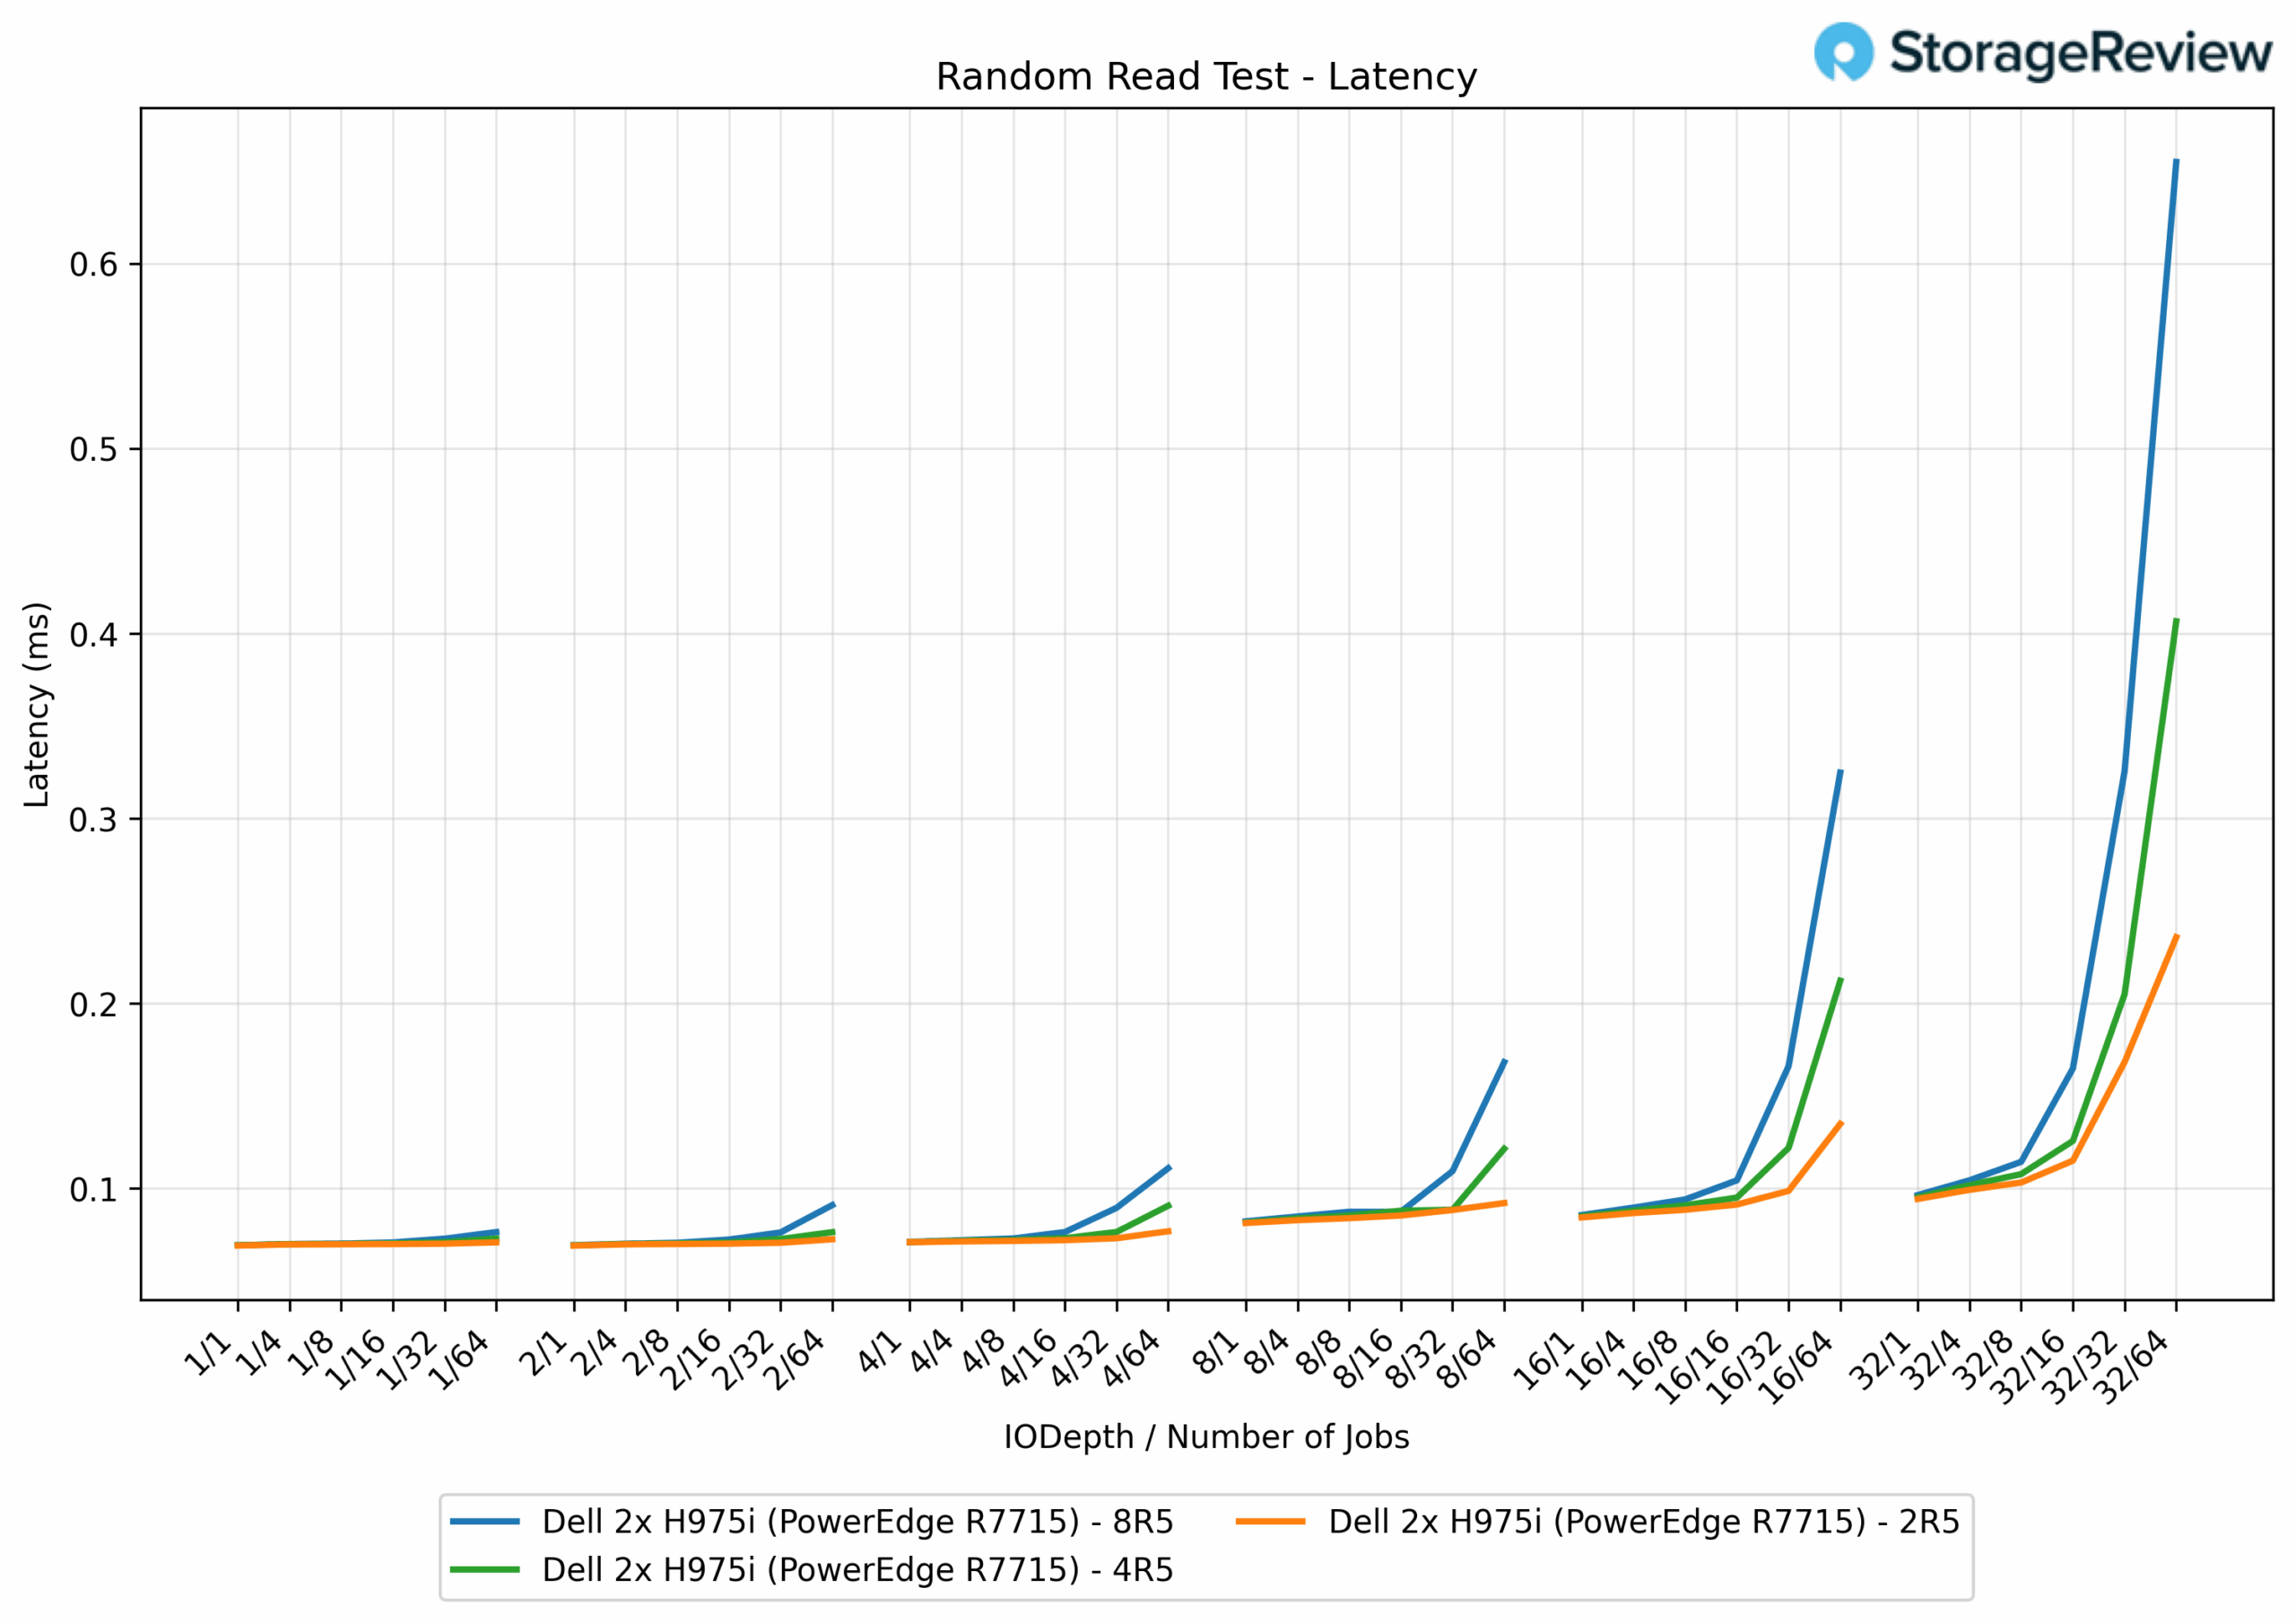
4K Random Read Latency
In 4K random reads, latencies began at 0.069 ms across all arrays, with 2R5 peaking at 0.29 ms, 4R5 at 0.53 ms, and 8R5 at 0.65 ms. The low ceiling across all RAID groups highlights the H975i’s ability to handle small random reads with remarkable efficiency.
No Performance Compromise Under Rebuild
Compared to PERC12, the Dell PERC13 controller offers substantially higher throughput across every workload while arrays are rebuilding. Sequential reads more than double to 53.7GB/s vs 25GB/s (up 114.7%), and sequential writes jump to 68GB/s from 14.6GB/s (up 363.7%). Small-block performance widens the gap further: 4K random reads climb to 17.33M IOPS from 4.68M (up 270.4%), while 4K random writes rocket to 5.33M IOPS from 0.48M (up 1013.1%). In short, PERC13 minimizes rebuild impact and preserves host headroom even during the heaviest maintenance windows.
| Workload | Dual PERC 12 (2 × RAID5) – Rebuild | Dual PERC 13 (2 × RAID5) – Rebuild | % Improvement |
|---|---|---|---|
| Sequential Read Bandwidth | 25 (GB/s) | 53.7 (GB/s) | 114.7% |
| Sequential Write Bandwidth | 14.7 (GB/s) | 68 (GB/s) | 363.7% |
| 4KB Random Reads | 4,676,748 (IOPS) | 17,326,888 (IOPs) | 270.4% |
| 4KB Random Writes | 479,144 (IOPs) | 5,333,783 (IOPs) | 1013.1% |
Rebuild Quickly without Slowing Workloads Down
Dell also claims massive gains in resiliency and rebuild performance, citing a reduction in array rebuild time from over 80 minutes per terabyte with PERC12 to as little as 10 minutes per terabyte on PERC13. That kind of speed reduces risk windows and speaks to the maturity of the controller’s hardware XOR engine, cache acceleration, and data path optimization.
In RAID5 rebuild tests, PERC13 consistently delivered shorter rebuild times than PERC12 when the controller was allowed to prioritize the rebuild, with the caution that extremely heavy write pressure can reverse that advantage. With Priority Rebuild enabled, the controller gives rebuild tasks first call on resources. This allowed the PERC13 controller to significantly reduce rebuild times under sequential read pressure. At the lowest host load (125 MB/s), rebuild time dropped from 11.53 to 5.32 Min/TiB. Even at the heaviest load, rebuild time was cut from 16.96 to 7.73 Min/TiB, while also sustaining a much higher host read rate (22.4 GB/s compared to 60 GB/s).
With sequential write pressure, the PERC13 improved the light-load rebuild from 7.51 to 4.98 Min/TiB, but under the heaviest write load, its rebuild time rose to 15.29 Min/TiB versus the R760’s 13.09 Min/TiB. You can view this through two lenses: the PERC13 had a slower rebuild rate, but the PERC13 maintained near production level write-workload speeds over the PERC12 (62.5GB/s vs 12GB/s). In other words, Priority Rebuild fulfills its promise of a faster rebuild window, especially for read-dominant activity. The one exception is when the system is simultaneously subjected to very heavy writes; the PERC13’s higher host throughput capability can extend the rebuild time.
| Scenario | Dual PERC 12 (2 × RAID5) | Dual PERC 13 (2 × RAID5) | ||
|---|---|---|---|---|
| Min/TiB | Total Bandwidth | Min/TiB | Total Bandwidth | |
| Sequential Read – Light Activity | 11.53 | 0.125 GB/s | 5.32 | 0.125 GB/s |
| Sequential Read – Heavy Activity | 16.96 | 22.4 GB/s | 7.73 | 60 GB/s |
| Sequential Write – Light Activity | 7.51 | 0.125 GB/s | 4.98 | 0.125 GB/s |
| Sequential Write – Heavy Activity | 13.09 | 12 GB/s | 15.29 | 62.5 GB/s |
Shifting to Priority Host, which intentionally protects application I/O at the expense of rebuild speed, the performance is similar for reads and more nuanced for writes. With read workloads, the PERC13 controller again finishes rebuilds significantly faster than the older PERC12, dropping light-load time from 11.23 to 6.70 Min/TiB and heavy-load time from 38.44 to 19.75 Min/TiB, all while servicing more host traffic (46.2GB/s vs 24.1 GB/s at the heavy point). For write workloads, Priority Host keeps production performance front-and-center: the PERC13 is faster at the smallest load (7.80 vs 5.67 Min/TiB), but under the heaviest write load, its rebuild extends to 32.81 Min/TiB compared to the PERC12’s 25.40 Min/TiB. The rebuild time slightly extends, but the PERC13 gives the host far higher host write bandwidth (62.4GB/s vs 12.5 GB/s).
| Scenario | Dual PERC 12 (2 × RAID5) | Dual PERC 13 (2 × RAID5) | ||
|---|---|---|---|---|
| Min/TiB | Total Bandwidth | Min/TiB | Total Bandwidth | |
| Sequential Read – Light Activity | 11.23 | 0.125 GB/s | 6.70 | 0.125 GB/s |
| Sequential Read – Heavy Activity | 38.44 | 24.1 GB/s | 19.75 | 46 GB/s |
| Sequential Write – Light Activity | 7.80 | 0.125 GB/s | 5.67 | 0.125 GB/s |
| Sequential Write – Heavy Activity | 25.40 | 12.5 GB/s | 32.81 | 62.4 GB/s |
From a deployment perspective, the choice is straightforward. When you need to minimize the vulnerability window and can tolerate some I/O deprioritization, Rebuild Priority on the PERC13 shortens rebuild times, especially for read-heavy scenarios. When maintaining application responsiveness is non-negotiable, Priority Host does exactly that; the PERC13 still excels for read rebuilds, while heavy write periods may warrant scheduling or modest throttling if the absolute rebuild time is a concern.
Conclusion
The Dell PERC H975i establishes hardware RAID as a compelling solution for NVMe-centric enterprise data centers. While JBOD and software RAID implementations have gained traction in scale-out environments, these approaches introduce operational complexity, CPU overhead, and extended recovery times during drive failures. The H975i delivers purpose-built hardware acceleration with dedicated parity engines, accelerated rebuild operations, and integrated management capabilities within Dell’s infrastructure stack.
For AI and machine learning workloads that demand consistent throughput characteristics, minimal latency variance, and maximum uptime reliability, hardware-managed RAID architectures deliver both computational performance and operational resilience without consuming critical host processing resources.
Performance testing validates the architectural improvements, with the H975i delivering 88% higher sequential read bandwidth and 318% higher sequential write bandwidth compared to the PERC12 generation. Peak measurements of 103 GB/s throughput and 25.2 million IOPS demonstrate the controller’s capabilities for data-intensive workloads. Additionally, rebuild times dropped from over 80 minutes per terabyte to as little as 10 minutes per terabyte, while maintaining near-production performance levels during recovery operations.
The H975i’s PCIe Gen5 x16 interfaces and front-integrated design support dense GPU deployments without storage contention, enabling predictable performance scaling in multi-accelerator configurations. With many PowerEdge servers offering both the H965i and H975i RAID controllers, there is no question that organizations leveraging emerging workloads should opt for the newer offering. If you are deploying AI infrastructure at scale, the H975i provides the high-bandwidth, low-latency storage foundation necessary to maximize computational resource utilization.


 Amazon