

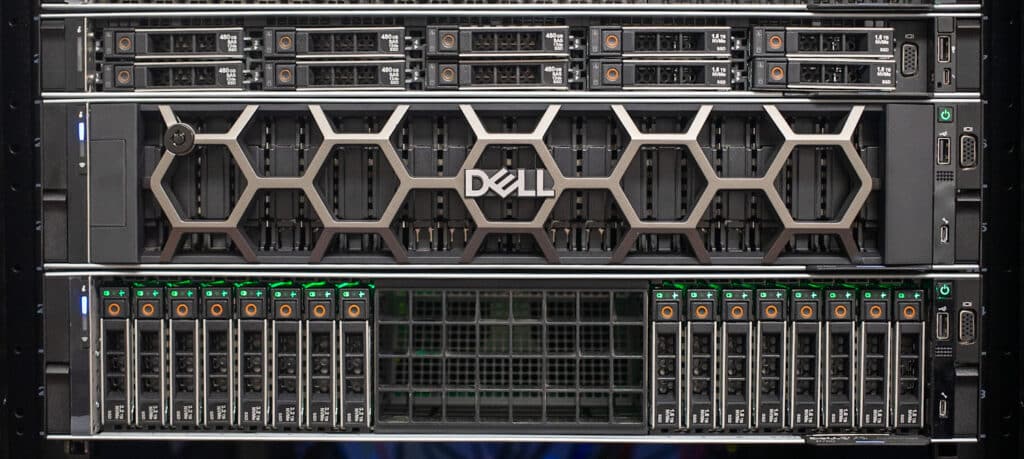
In publishing our review of the Dell PowerEdge R760 server, we purposefully held off on storage numbers, noting that the R760 has many storage configuration options that would have made the initial review too long. In this review, we’re digging into the storage options Dell PowerEdge supports for Gen4 NVMe SSDs and the performance profile of what Dell calls Direct Drives vs. PERC 12 hardware RAID card.
Dell PowerEdge NVMe Backplane Options
Dell offers various storage backplanes in their 16G PowerEdge servers. When configuring the R760, there are almost 50 drive chassis options. While some of this is legacy support (PERC 11, for instance), the point is the chassis decision is a big one. This doesn’t even account for upcoming E3.S NVMe SSD support, which is the only way to get Gen5 SSDs in PowerEdge servers. We looked at E3.S in the Dell PowerEdge R660 if you want to learn more about the benefits of Gen5 and EDSFF form factors.
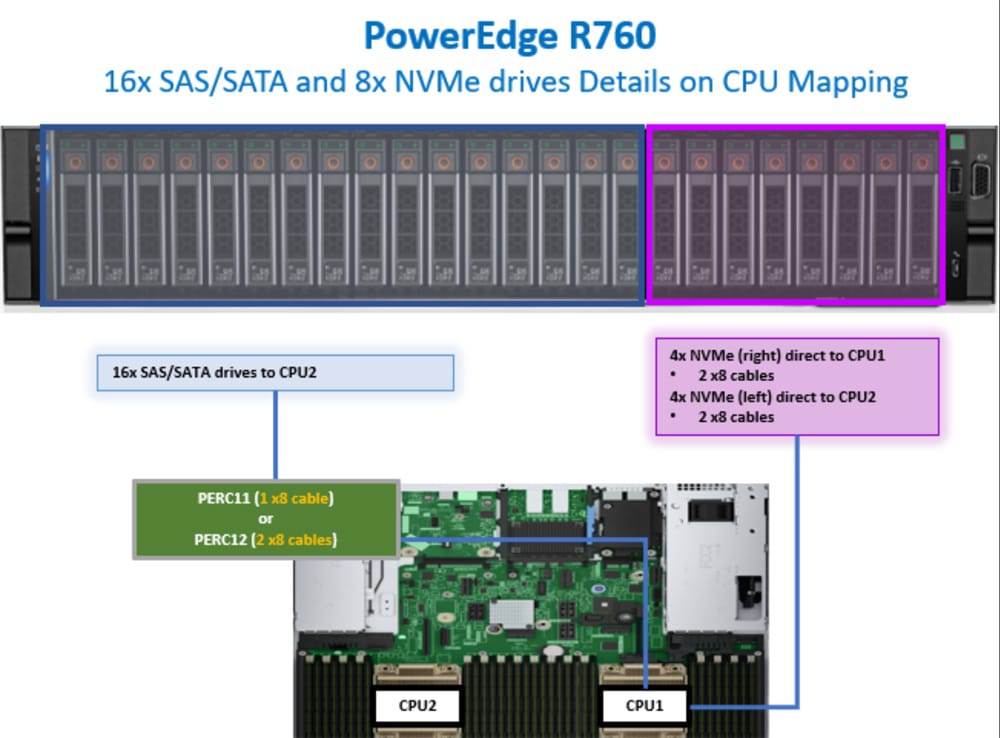
Back to the task at hand. For this review, we want to understand the implications of selecting Dell’s Direct Drives option compared to the PERC 12 HWRAID card option. As mentioned, the explicit focus here is only in consideration of Gen4 U.2/U.3 NVMe SSDs. For now, we’re ignoring chassis options for SATA/SAS and 3.5″ HDDs. Those configurations are much more straightforward.
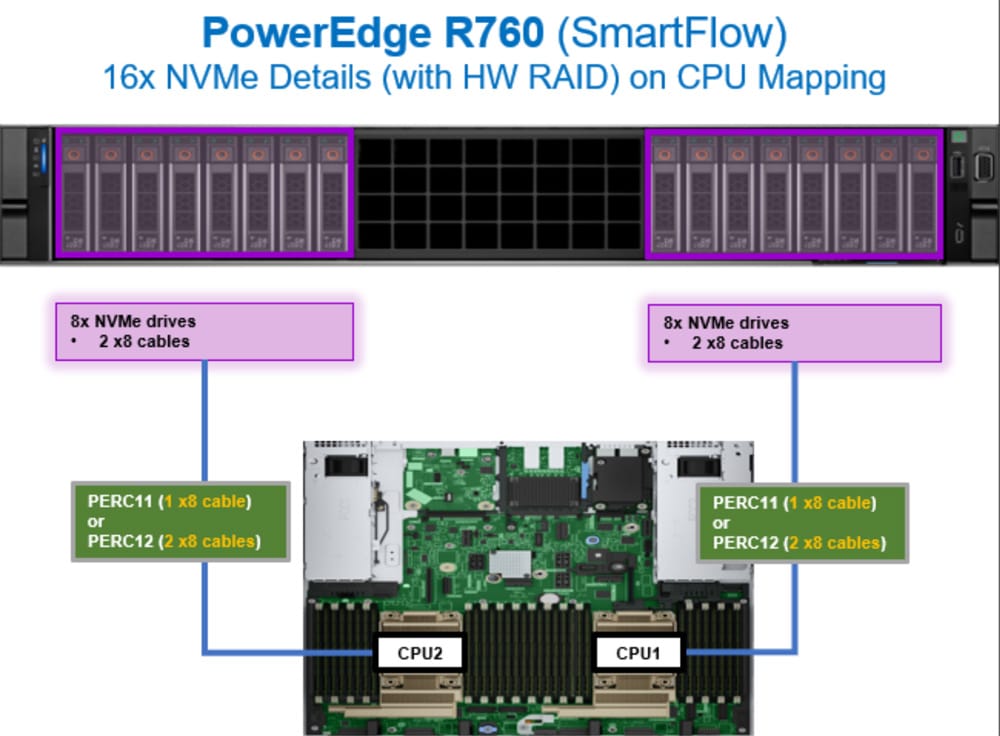
In the R760, Dell offers a couple of chassis options to get Gen4 NVMe drives onboard. The Direct Drives option can be configured for 8- or 16-drive support. For the HWRAID configs, Dell offers the PERC 12 HWRAID card the same way, with one RAID card for each batch of 8 SSDs. This decision is important as it is fundamental to letting a fully populated R760 with 16 NVMe SSDs obtain the best possible performance.
Dell PERC 12 Overview
The Dell PowerEdge RAID Controller (PERC) 12 is based on Broadcom SAS4116W silicon. Despite SAS in the product name, the controller is a tri-mode RAID-on-Chip (ROC) device. The same RAID controller is used in the Broadcom MegaRAID line. We recently reviewed the MegaRAID 9670W highlighting key capabilities. With the Dell PERC 12, however, essential design differences come into play depending on which Dell server and storage family you’re interested in.
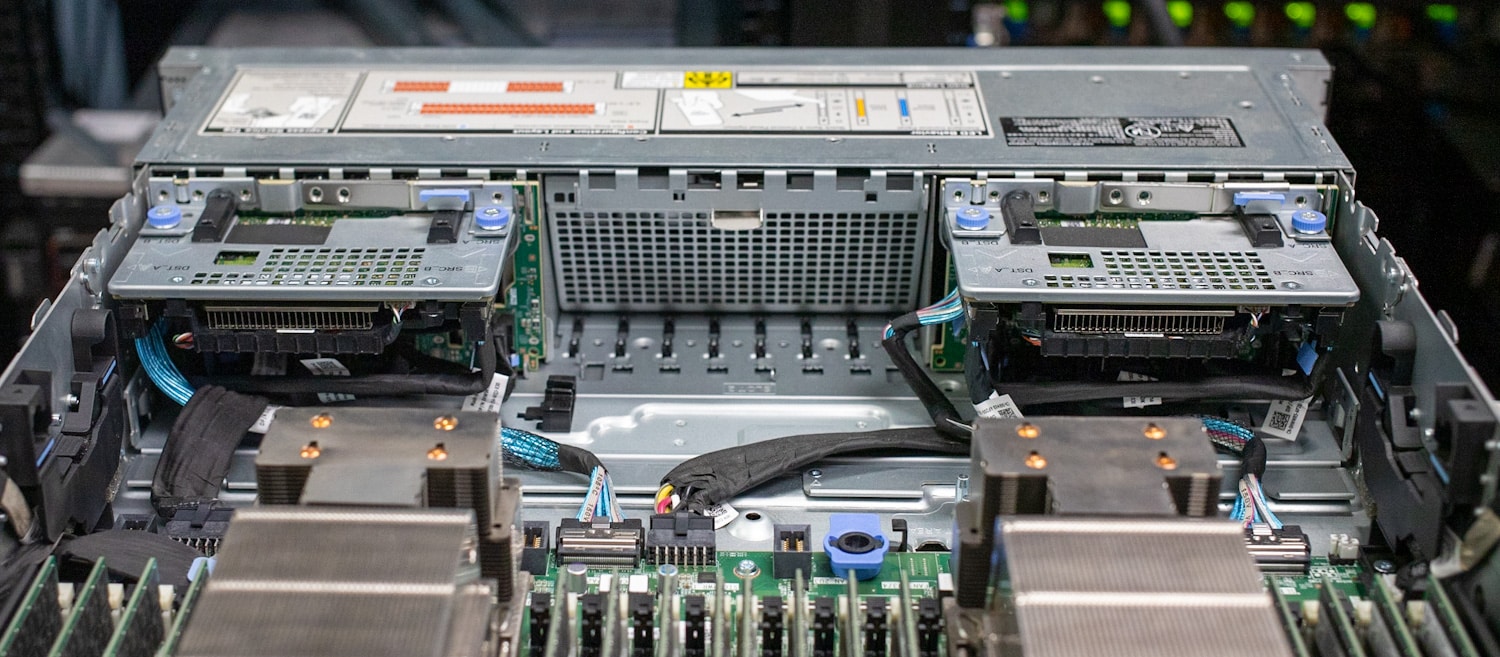
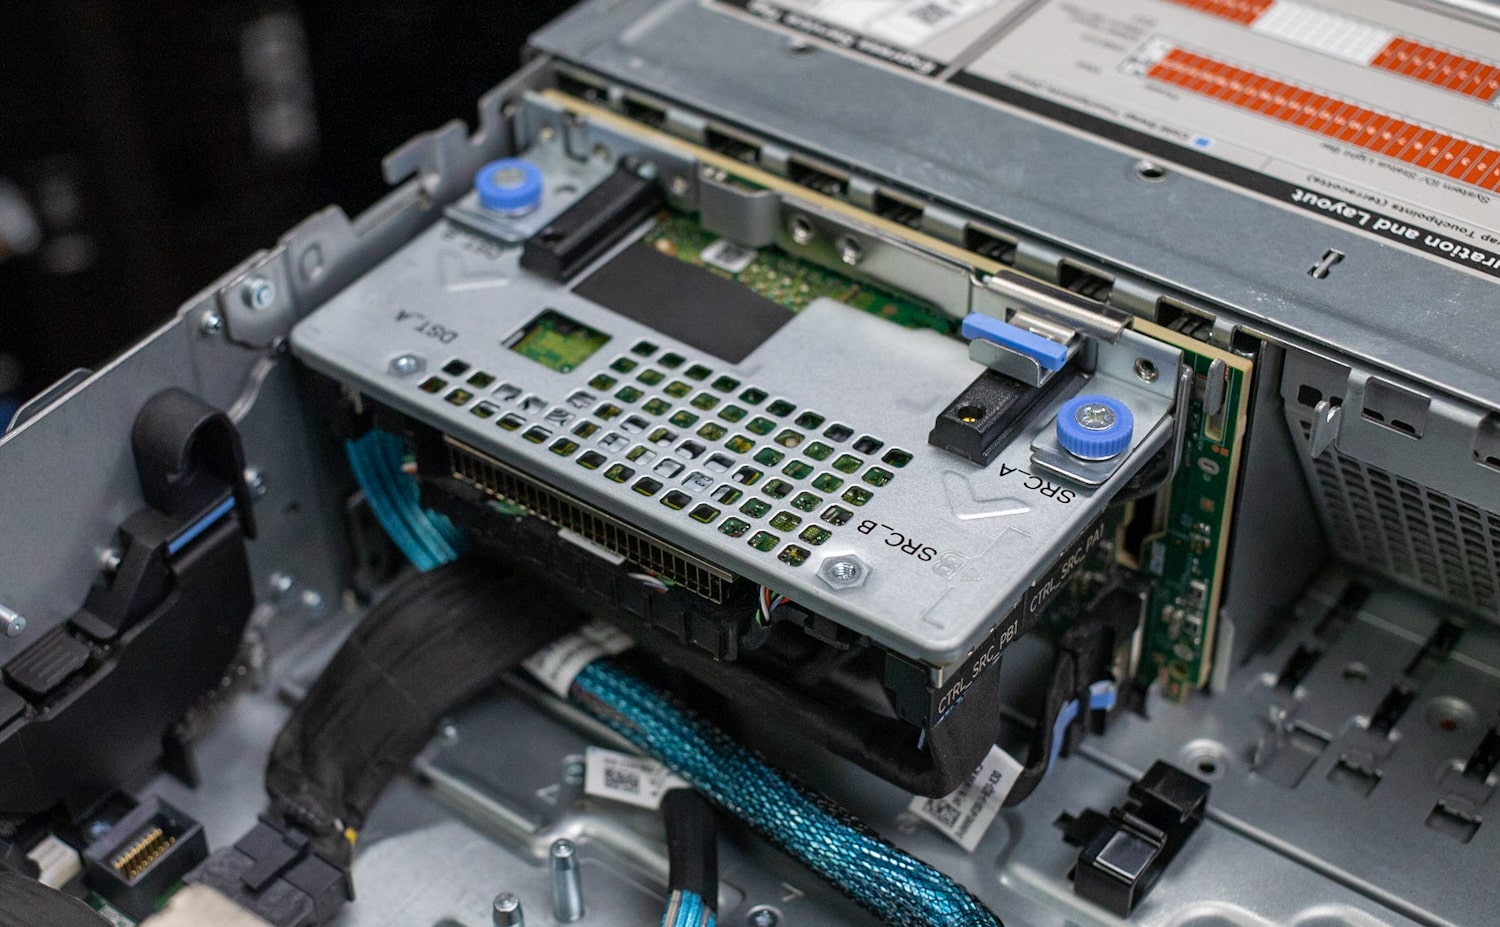
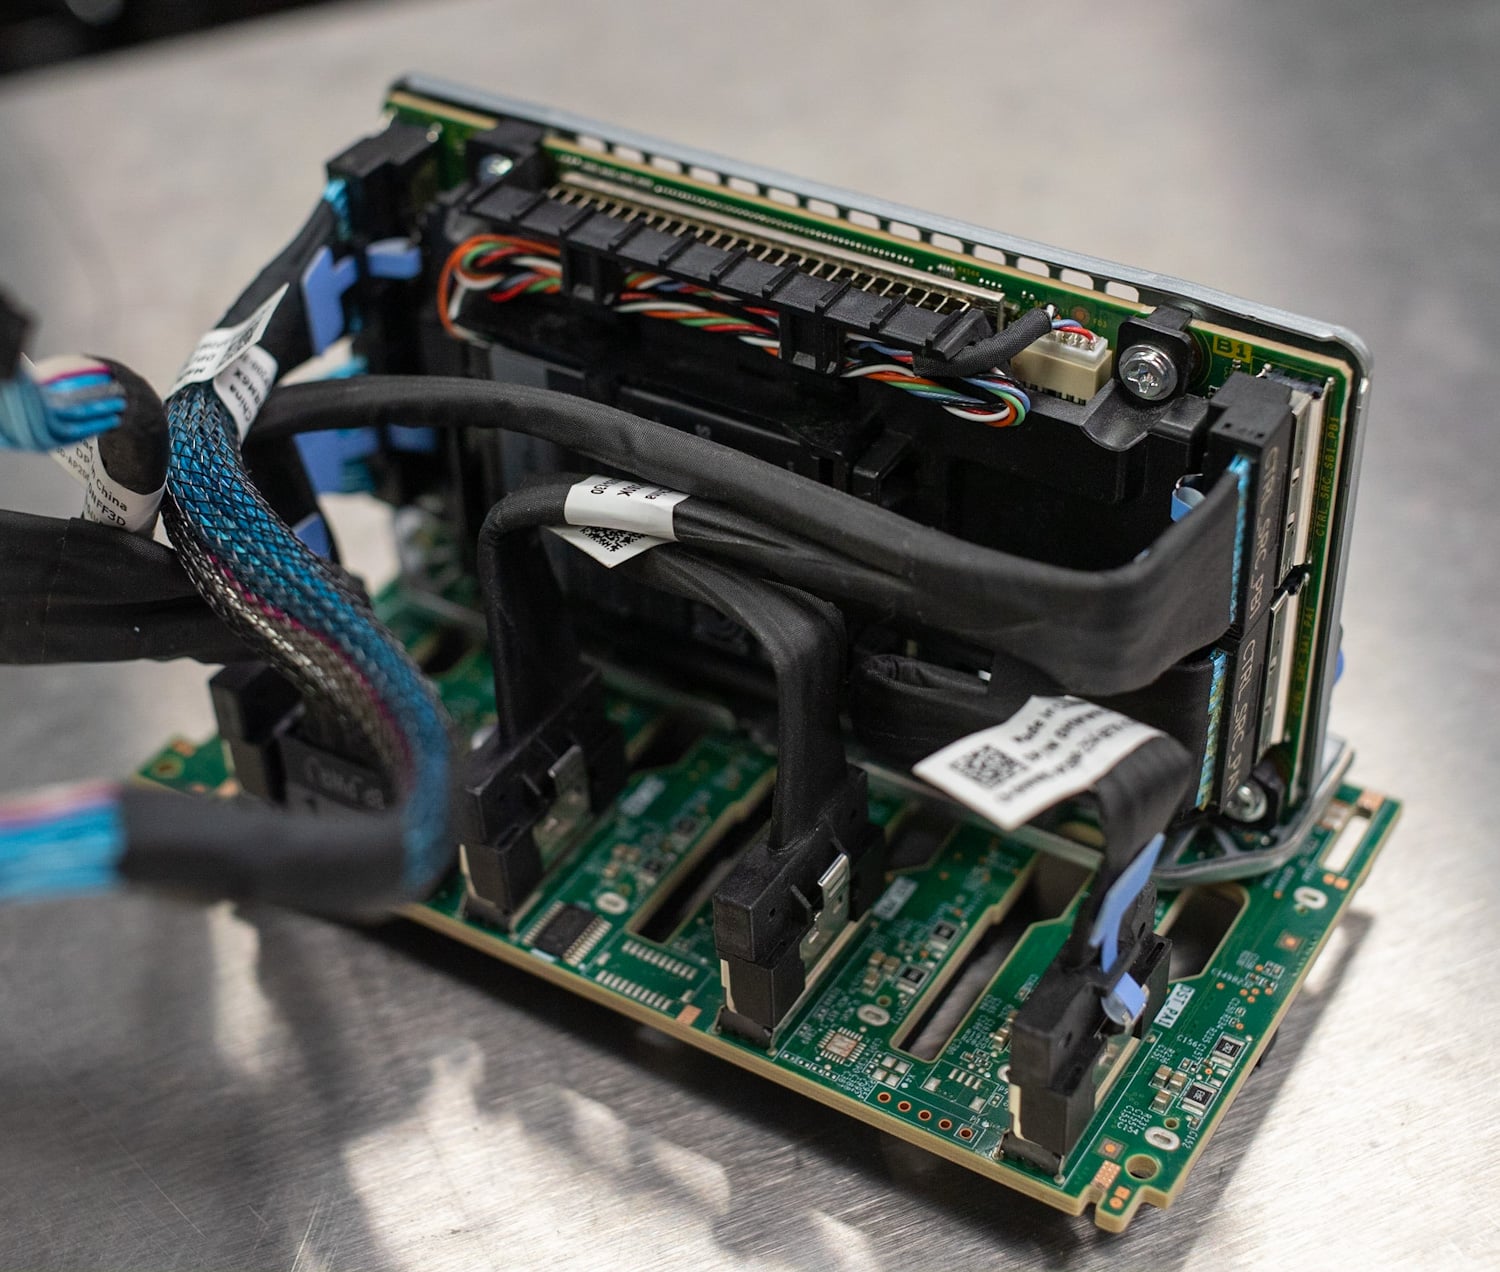
Regarding PowerEdge, most configurations will leverage the “H965i Front” PERC 12 card. In our review of the R760 system with HWRAID, we have two of these H965i Front cards in the system, one for each set of 8x Solidigm P5520 SSDs. It’s worth mentioning that these cards are significantly smaller than the add-in card. The PCB design and thermal management are truly impressive. These cards are mounted directly to the 8-drive NVMe backplane and connected to the motherboard with two x8 PCIe cables. This frees up PCIe slots on the read side of the server for other devices.
Speaking of add-in cards, the standard PERC 12 H965i is a half-height, half-length card that includes an onboard fan. This version of PERC 12 will appear in some PowerEdge configurations and can also be found in some of the new Dell PowerVault MD JBODs. Lastly, there’s an H965i MX, which is a long, narrow PCB designed for something like the MX7000 modular chassis.
Dell PERC 11 vs PERC 12
The Dell PERC 11 card did support NVMe SSDs, but unfortunately, the benefits of hardware RAID came at an extensive performance cost. That hit is precisely why the industry is so excited with the new Broadcom silicon and Dell’s version of that card, the PERC. Dell has published some numbers on the difference between PERC 11 and PERC 12, which are astounding.
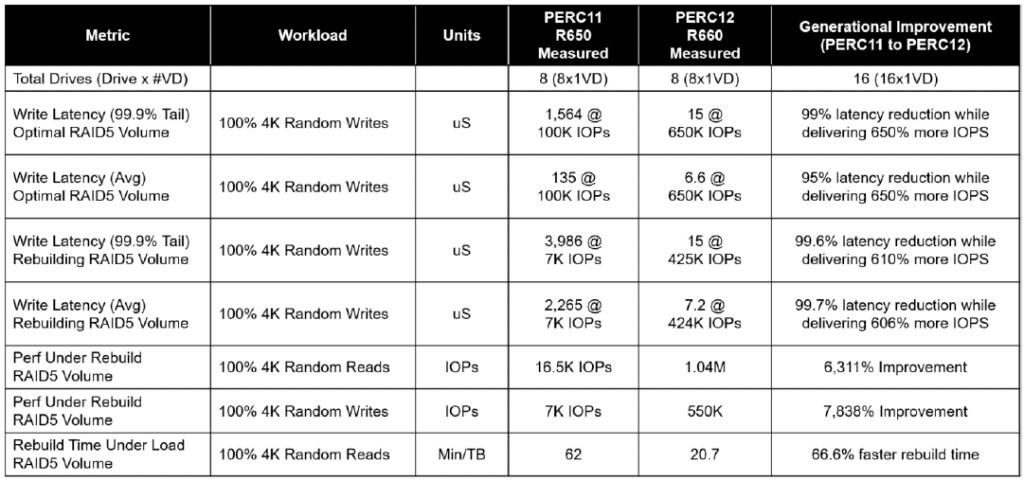
The latency benefits of PERC 12 are clearly evident; but look at the performance under worst-case conditions, performance during a rebuild. PERC 12 picks up a few thousand percent improvement, and even the RAID rebuild time sees significant benefits.
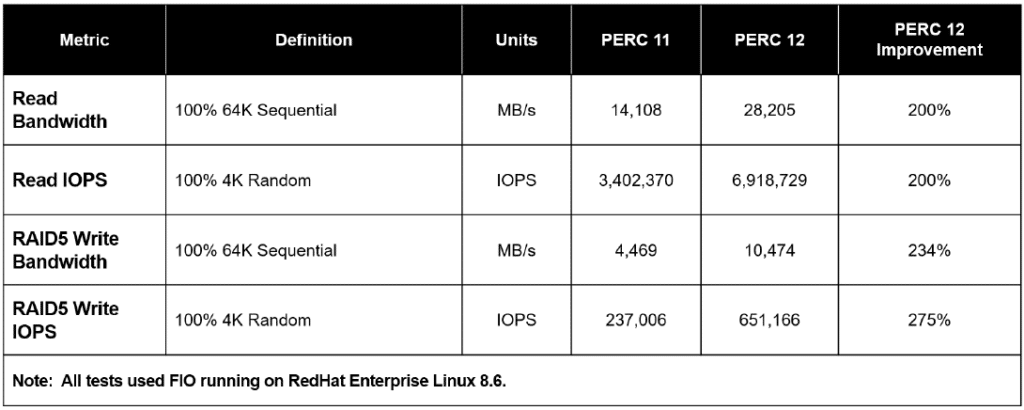
Looking at the bandwidth and IOPS numbers Dell quotes, we can again see the massive step forward the PERC 12 takes compared to the PERC 11. Across the board, all of these workloads see a minimum 2X improvement in the PERC 12 card. Of course, we’ve done our testing to check the PERC 12 performance, and we’ll get to that.
Dell Direct Drives vs. Dell PERC 12 Performance
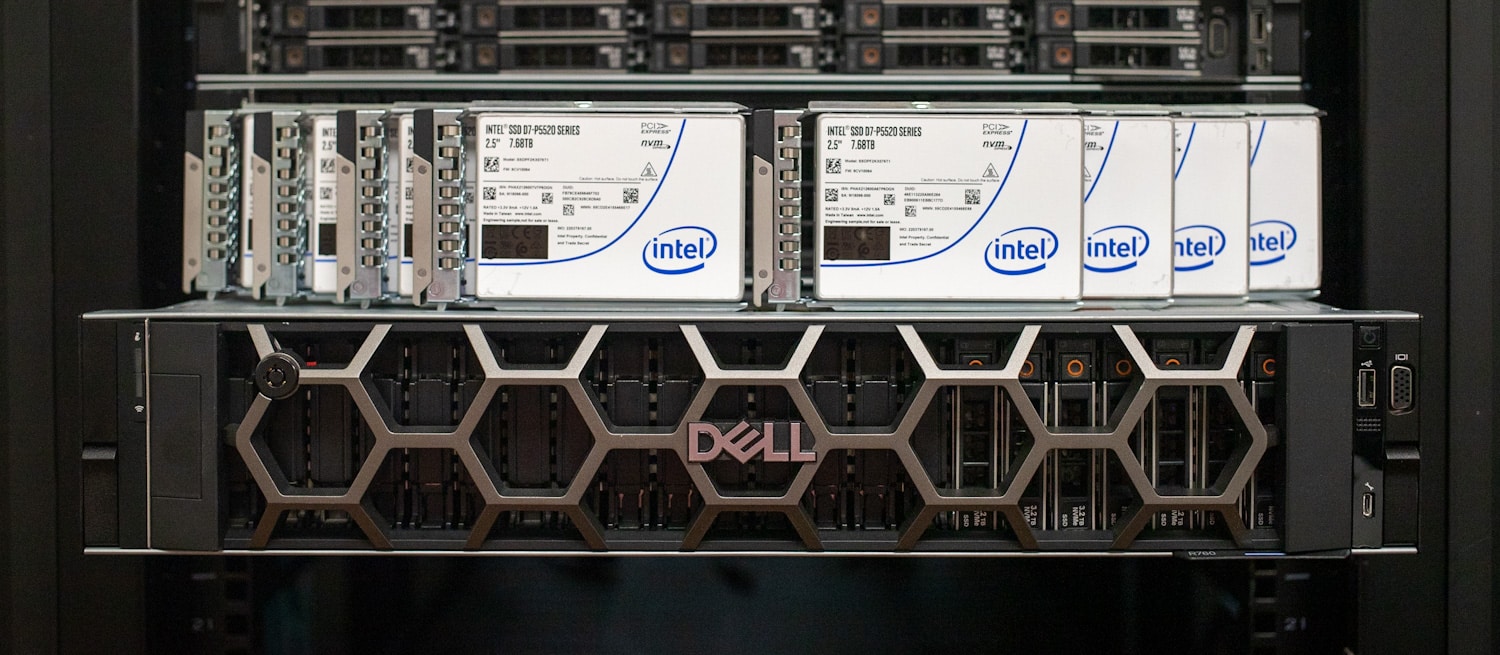
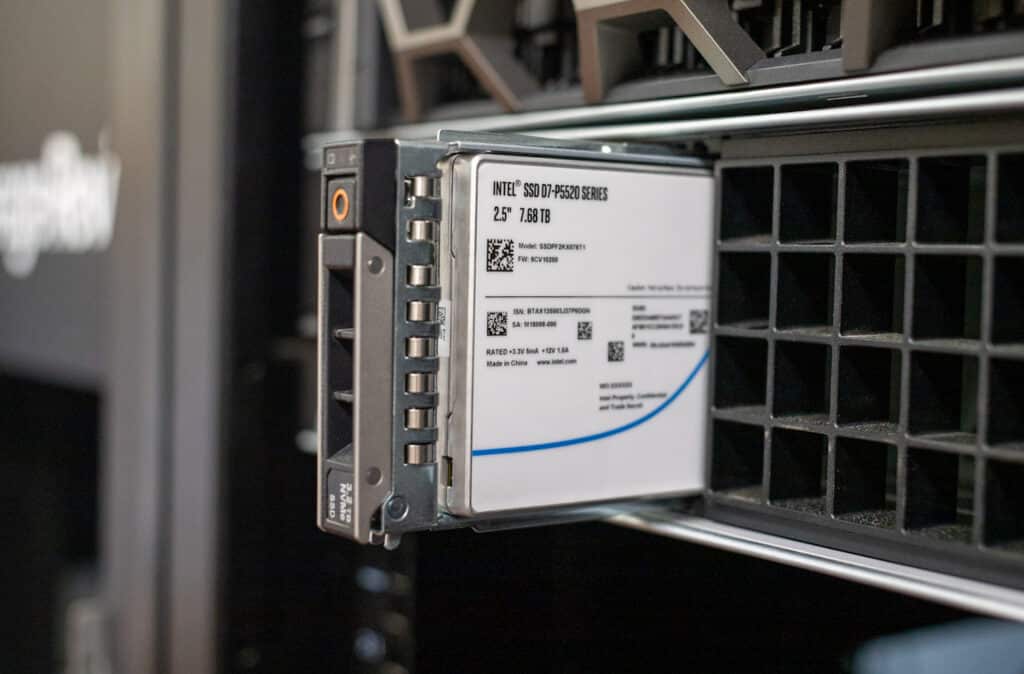
To compare the storage performance in Direct Drives vs. PERC 12, we configured our R760 server “cousins” with Solidigm P5520 7.68TB SSDs. The Dell R760 with Direct Drives has 8x NVMe bays. The R760 with PERC 12 has 16x NVMe bays with twin H965i Front RAID cards.
At face value, it might not be obvious there are certain performance limitations on either side. Starting with the Direct Drives approach, each SSD has its own x4 PCIe connection, meaning eight SSDs have 32 lanes of PCIe dedicated to them.
This enables incredible bandwidth, generally over 52GB/s if each Gen4 drive can saturate its 6.5GB/s connection. Compared to the PERC 12 H965i setup, each group of eight SSDs interfaces directly with the RAID card, which connects back to the motherboard with a x16 PCIe connection. This cuts in half the bandwidth the Direct Drives configuration supports. So obviously, the native NVMe connections win? Not exactly.
When dealing with multiple NVMe devices in a multi-CPU system, NUMA mapping between drive and CPU, as well as system interrupts, come into play. This can be optimized around but requires significant tuning. Not all applications take this into account.
Virtualization is one where it is challenging to manage NUMA mapping as shared resources are balanced in real-time, sometimes to a CPU that might not have direct access to those assigned PCIe resources. Hardware RAID cards mitigate many of these issues and optimize for system interrupts and context switching, which frees up CPU resources. NUMA mapping also becomes less complex, as instead of having 16 individual SSDs split across two CPUs, you only have one storage card per CPU to manage.
Our test plan focuses on two areas. The first is Vdbench workloads measuring JBOD performance with eight SSDs passed through to either R760. On the Direct Drives R760 are eight native SSDs, while on the HWRAID R760, the PERC 12 passes through eight raw storage devices. Both are tested as is without optimizations. The 2nd stage of testing shows the scaled performance of the PERC 12 solution from a single to an optimized dual-card setup.
Our Direct Drives PowerEdge R760 review unit has the following configuration:
- Dual Intel Xeon Gold 6430 (32 cores/64 threads, 1.9GHz base)
- 1TB DDR5 RAM
- 8 Solidigm P5520 7.68TB Gen4 SSDs
- RHEL 9
The HWRAID NVMe PowerEdge R760 review unit has the following configuration:
- Dual Intel Xeon Gold 6430 (32 cores/64 threads, 1.9GHz base)
- 1TB DDR5 RAM
- 16 Solidigm P5520 7.68TB Gen4 SSDs
- Dual PERC 12 H965i
- RHEL 9
Vdbench Workload Analysis
When benchmarking storage devices, application testing is best, followed by synthetic testing. While not a perfect representation of actual workloads, synthetic tests help baseline storage devices with a repeatability factor that makes it easy to compare apples-to-apples between competing solutions. These workloads offer a range of testing profiles ranging from “four corners” tests and common database transfer size tests to trace captures from different VDI environments.
These tests leverage the typical Vdbench workload generator with a scripting engine to automate and capture results over a large compute testing cluster. This allows us to repeat the same workloads across various storage devices, including flash arrays and individual storage devices. Our testing process for these benchmarks fills the entire drive surface with data and then partitions a drive section equal to 25 percent of the drive capacity to simulate how the drive might respond to application workloads. This differs from complete entropy tests, which use 100 percent of the drive and take them into a steady state. As a result, these figures will reflect higher-sustained write speeds.
Profiles:
- 4K Random Read and Write: 100 percent Read or Write, 128 threads, 0-120 percent iorate
- 64K Sequential Read: 100 percent Read, 32 threads, 0-120 percent iorate
- 64K Sequential Write: 100 percent Write, 16 threads, 0-120 percent iorate
- 4K 70R/30W and 90R/10W Random Mix, 64 threads, 0-120 percent iorate
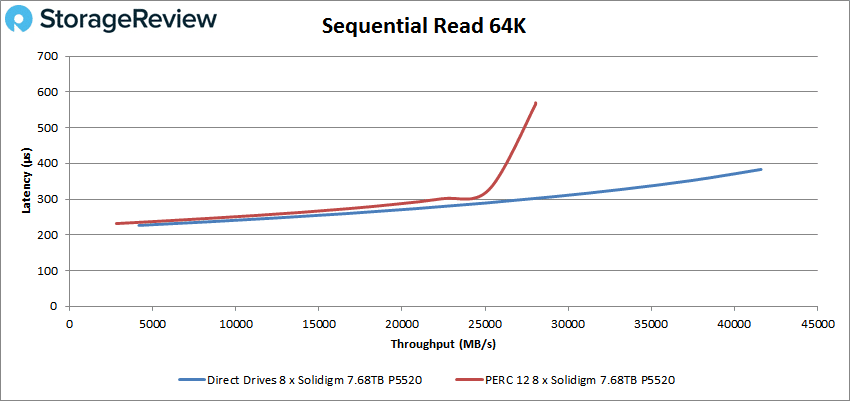
Looking at our first test focusing on read transfer bandwidth, we can see the PCIe channel advantage that the Direct Drives approach has with 32 PCIe lanes over the single PERC 12 with 16 lanes. This works out to 41.6GB/s from Direct Drives versus 28GB/s from the PERC 12 in JBOD mode.
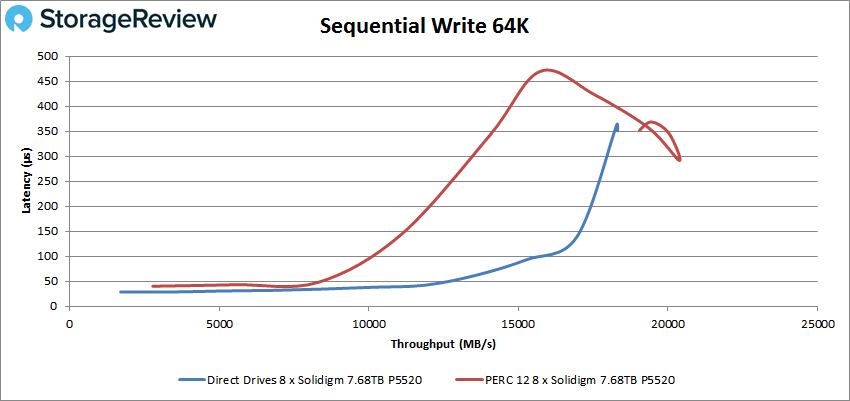
Switching from read to write bandwidth, the advantage of the additional PCIe lanes shrinks as the write speed of the Solidigm P5520 is lower than its read speed. Here the Direct Drives configuration measured 18.3GB/s compared to 20.3GB/s from the PERC 12.
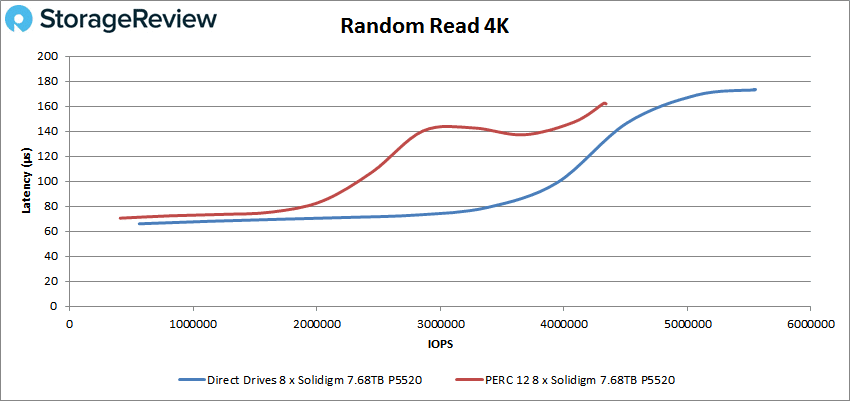
In our random 4K read workload, the 8 Solidigm P5520 SSDs in the Direct Drive PowerEdge R760 measured 5.55M IOPS peak, compared to 4.34M IOPS on the PERC 12 setup.
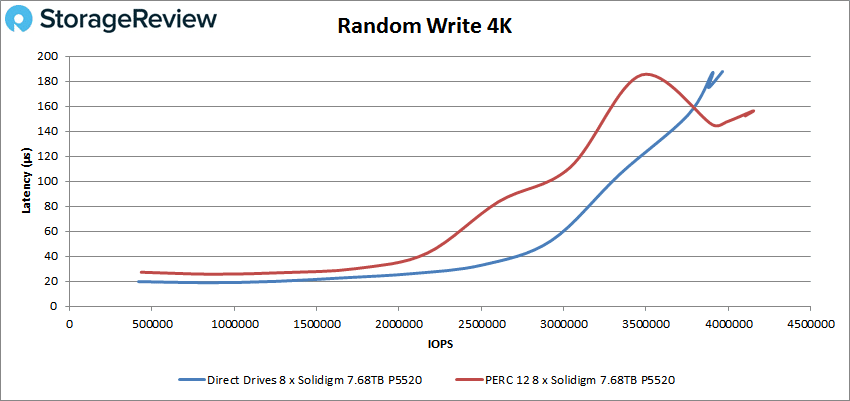
In 4K random write, that difference narrows again, with Direct Drives measuring 3.96M IOPS versus 4.15M IOPS on PERC 12.
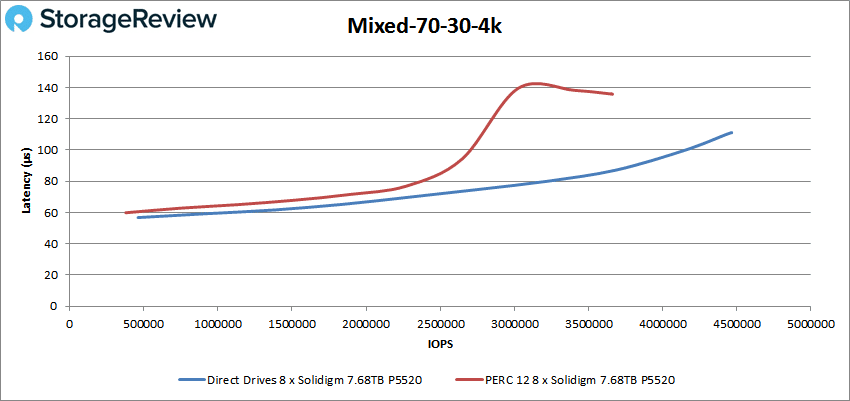
In our first of two mixed workloads, we look at a 4K random transfer with a 70/30 Read/Write spread. Here the Direct Drives PowerEdge R760 configuration measured 4.47M IOPS peak, against the PERC 12 with 3.66M IOPS.
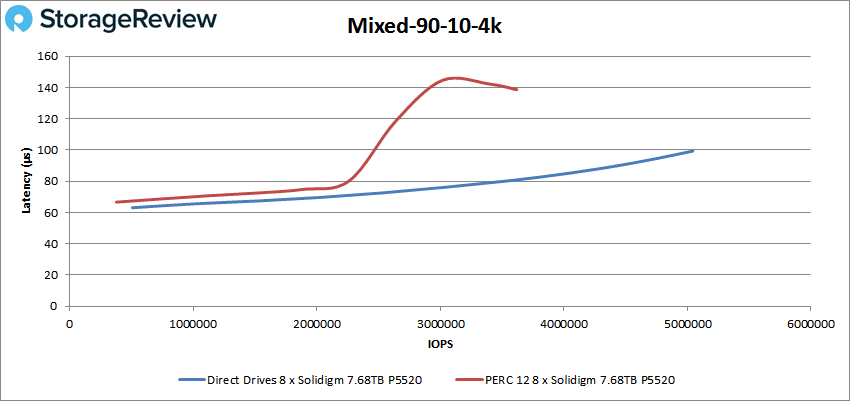
Increasing the read percentage to 90 percent in the same 4K transfer test, we measured 5.04M IOPS from the Direct Drives server versus 3.62M IOPS from the PERC 12 system.
FIO Workload Analysis
To measure the performance of the drives of Dell’s Direct Drive and PERC 12 HWRAID offerings, the benchmarks were split into the following configurations. The first included a JBOD configuration measuring each drive outside of RAID, RAID10, and then RAID5 configurations.
For the Direct Drives approach, the SSDs show up to the OS as normal; for the PERC 12, they are passed through the HBA as raw storage devices. These configurations were walked through a scripting process to precondition the flash, run the tests they were conditioned for, and move to the next preconditioning/workload mix.
- Sequential preconditioning
- Sequential tests on JBOD, 8DR10, 8DR5 (Single and Dual PERC)
- Random preconditioning
- Random optimal tests on JBOD, 8DR10, 8DR5 (Single and Dual PERC)
- Random rebuild tests on 8DR10, 8DR5 (Single and Dual PERC)
- Random write latency for optimal and rebuild for 8DR5 (Single PERC)
With the PERC 12 H965i having an x16 PCIe Gen4 slot, its peak performance will be right around 28GB/s in one direction, and that is where the Gen4 slot tops out. Dell took a unique approach to this bandwidth limit by offering a dual PERC 12 configuration in their PowerEdge R760. Instead of 16 SSD bays all connected to a single card, the load is split, with each PERC 12 controlling its own set of 8 SSDs. This approach side-steps the bandwidth limitation while dramatically increasing the peak available throughput under demanding workloads.
Looking at sequential transfer performance first, we can see the bandwidth advantage that the Direct Drives configuration has, with read speed measuring 54.4GB/s against the single PERC 12 measuring 28.1GB/s. Write speed native has an advantage as well, with it measuring 33.4GB/s against 28.3GB/s from the single PERC 12 with eight drives behind it. Write speeds, in general, won’t see a huge difference here as, generally speaking, this class of SSD has read speed far in excess of write speed.
| Workload | JBOD Direct Drives (MB/s) | JBOD 1 x PERC 12 (MB/s) | JBOD 2 x PERC 12 (MB/s) | RAID 10 1 x PERC 12- Optimal (MB/s) | RAID 10 2 x PERC 12- Optimal (MB/s) | RAID 5 1 x PERC 12 – Optimal (MB/s) | RAID 5 2 x PERC 12 – Optimal (MB/s) |
|---|---|---|---|---|---|---|---|
| Maximum Sequential Reads | 54,396 | 28,076 | 56,114 | 27,450 | 55,482 | 24,049 | 56,107 |
| Maximum Sequential Writes | 33,367 | 28,284 | 56,541 | 11,037 | 22,120 | 12,269 | 24,351 |
| Maximum 50:50 Seq Reads:Writes | 33,569 | 28,286 | 56,541 | 11,011 | 21,875 | 12,269 | 24,360 |
Switching our focus to random transfer performance, we start to see a shift in where the advantages of the RAID card can come in regarding NUMA balancing. With read performance, the Solidigm 7.68TB P5520 SSDs measured 7.96M IOPS in our 4K read test, with the PERC 12 JBOD configuration measuring 7M IOPS. Write speed through the Direct Drives configuration dropped to 3.4M IOPS while the PERC 12 maintained 5.97M IOPS. With the 4K OLTP workload, this becomes even more pronounced with the Direct Drives measuring 3.6M IOPS versus 10.2M IOPS from the PERC 12.
While the traditional thinking has been that hardware RAID doesn’t have value with modern SSDs, we can see that is no longer the case. Yes, the Direct Drives NVMe setup can be tuned, but it’s a moving target across multiple SSDs balanced over two CPUs.
This is in direct contrast to the PERC 12 HWRAID card, which manages all of that complexity and connects to just one CPU. For scaling, the 2nd PERC card in the Dell PowerEdge R760 connects to the other CPU, offering balancing for larger workloads split across those two disk groups. It should be noted that around 10M IOPS, the system started to saturate the CPUs, which is why we didn’t see linear scaling in some areas with the additional PERC 12 card.
| Workload | JBOD Direct Drives (MB/s) | JBOD 1 x PERC 12 (MB/s) | JBOD 2 x PERC 12 (MB/s) | RAID 10 1 x PERC 12 – Optimal (MB/s) | RAID 10 2 x PERC 12 – Optimal (MB/s) | RAID 5 1 x PERC 12 – Optimal (MB/s) | RAID 5 2 x PERC 12 – Optimal (MB/s) |
|---|---|---|---|---|---|---|---|
| 4KB Random Reads (IOPs) | 7,958,204 | 7,003,556 | 12,447,020 | 6,757,498 | 13,067,852 | 6,974,826 | 13,205,656 |
| 4KB Random Writes (IOPs) | 3,473,446 | 5,974,265 | 11,323,633 | 2,204,738 | 4,684,333 | 862,769 | 1,725,198 |
| 4KB OLTP (IOPs) | 3,553,974 | 10,195,618 | 11,967,984 | 6,441,868 | 12,288,219 | 2,635,711 | 5,279,999 |
While we didn’t look at software RAID options with the Direct Drives PowerEdge R760 configuration, we did have a chance to see how well RAID configuration performs on PERC 12 in a degraded state. While performance saw a significant dip compared to its optimal performance, both RAID10 and RAID5 offered strong performance while rebuilding their RAID groups.
| Workload | RAID 10 1 x PERC 12 – Rebuild (MB/s) | RAID 10 2 x PERC 12 – Rebuild (MB/s) | RAID 5 1 x PERC 12 – Rebuild (MB/s) | RAID 5 2 x PERC 12 – Rebuild (MB/s) |
|---|---|---|---|---|
| 4KB Random Reads (IOPs) | 1,345,175 | 2,692,738 | 2,350,889 | 4,676,748 |
| 4KB Random Writes (IOPs) | 1,666,967 | 3,174,430 | 242,802 | 479,144 |
| 4KB OLTP (IOPs) | 1,618,209 | 3,253,603 | 243,349 | 486,251 |
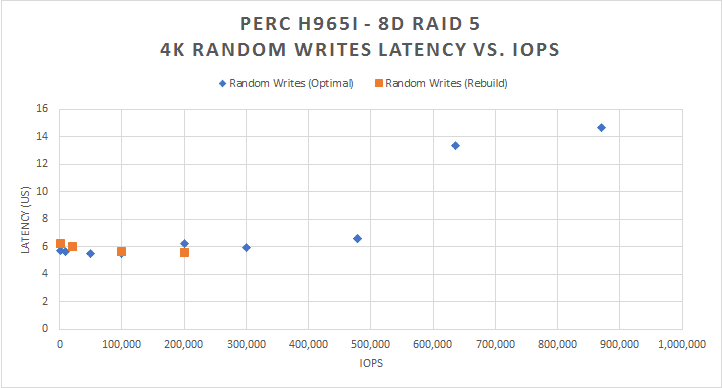
While optimal RAID performance is an important aspect of choosing a storage solution, seeing how it performs under suboptimal conditions can be equally as important. To that end, we measured the 4K write latency in RAID5 under optimal conditions, and rebuild performance with a drive failed out. If performance or latency were to take a massive hit, application responsiveness could become a problem. While rebuild performance decreases compared to optimal, the latency of the performance doesn’t increase over the baseline.
Final Thoughts
Dell’s new PERC12 NVMe RAID card changes the game for NVMe storage options in PowerEdge servers. In the past, some customers hesitated to switch from SAS SSDs or opted for NVMe drives connected to various SDS or hypervisors. However, the introduction of the PERC 12 card has altered the equation for PowerEdge, making it a more viable option.
The reason PERC 12 performs so well is also attributable to the layout of the PowerEdge server. Our R760 has two PERC 12 (H965i Front) cards, each with x16 lanes. This allows us to utilize the 8 Solidigm SSDs with each card, providing a maximum bandwidth of up to 28GB/s per card. Connecting all 16 SSDs to a single RAID card would result in a loss of half of the potential performance.
You might ask, “Why not 24 SSDs with HWRAID?” Just remember that every system has a bottleneck somewhere. In this case, we can saturate the CPU pretty easily, so the x86 within the server becomes the gating factor. If we’re talking about a clustered solution, then we’ll also peg the network. A handful of SSDs can easily fill 200GbE or even 400GbE. With SSD capacities now topping 30.72TB, there’s less of a need to have a server full of drives for system capacity issues as well.
If you read our Broadcom 9600 Series RAID card review, we started off pretty skeptical that the new silicon would realistically provide all the data resiliency and rebuild benefits of HWRAID without kneecapping the NVMe SSD performance profile. We were pleasantly surprised with the results in that review and even more so here, with PERC 12 being able to double up in the R760 to get twice as much top-line performance. While Dell Direct Drives may still be preferred in many use cases, like software-defined storage, the PERC 12 option should be extremely popular for most enterprise use cases.


 Amazon