

Dell has introduced the PowerVault ME5 Series, an entry-level block storage array purpose-built and optimized for price-sensitive SAN & DAS environments focused on simplicity, performance, and affordability. It would be an understatement to say that this storage array is simple to set up and operate. Valid PowerVault ME5 configurations start as low as $12,000. The PowerVault ME5 Series follows its predecessor, PowerVault ME4 released in 2018. We did a detailed review of the ME4 in June 2019 that you can find here.
Dell PowerVault ME5 vs. ME4
There are similarities between the ME4 Series and the ME5 Series, but the performance and capacity improvements with the ME5 are significant. The upgraded Xeon processors with 2X more cores and controller memory increased to 16GB per controller, making the ME5 worth consideration for that next project.
The ME5 delivers twice the performance compared to the ME4. Sequential read and write throughput increased by over 70 percent. Virtual and linear pool size for the ME5 increased to 4PB per pool/controller. Network performance was enhanced with support for 32Gb FC and an additional 25Gb iSCSI optical host protocols.
Additionally, the ME5 offers multiple protocols, provides support for a range of drive types and capacities including SEDs that can mix with other drives, scales up to 6.72PB capacity validated with Dell PowerEdge Servers, and is delivered with all-inclusive software. Firmware has been designed to support 8PB capacity (4X) with future high-capacity HDDs.
The ME5 system uses existing ME4 expansion bays to scale up to 336 drives meeting the 8PB capacity. The ME5 doubles the ME4 available storage using the same enclosures and expansion bays. And unlike the ME4, the full capacity of 6.72PB and 8PB are supported for both virtual and linear modes.
Dell PowerVault ME5 Configurations
The flexibility of the ME5 is demonstrated with the configuration options. The system can be deployed in an affordable all-HDD configuration to start. Alternatively, the system can be configured as a hybrid array or all-flash to meet the more demanding needs of a growing business. The PowerVault ME5 provides organizations with a storage solution that is easy to deploy and manage while still offering a deep range of features typically found in enterprise storage products.
The ME5 ships with Intel Xeon processors with a dual-active controller architecture, 12GB/sec read, and 10GB/sec write throughput and uses a 12Gb SAS backend protocol for rapid capacity expansion.
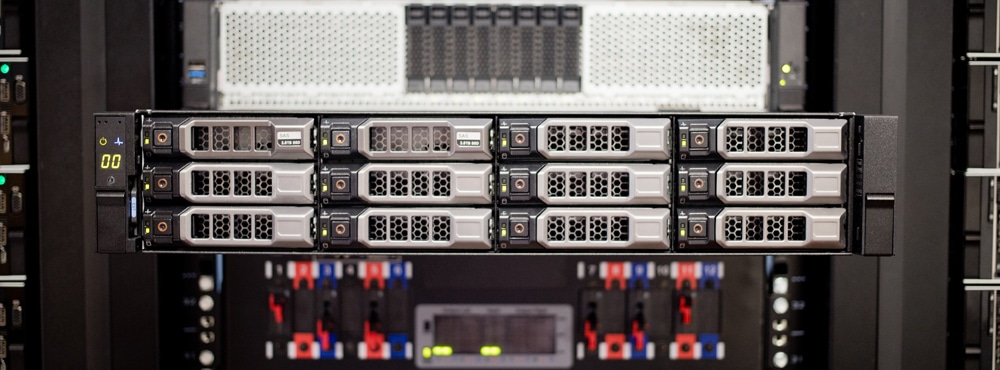
The PowerVault ME5012 and ME5024 base arrays start at 2U, and the ME5084 base array starts at 5U. The base models all support dual-active controllers, with each controller including 16GB of memory.

The optional ME5 expansion enclosures let you scale up to 336 drives or 8PB. PowerVault ME412 and ME424 expansion enclosures can only be used with either ME5012 or ME5024 base arrays. The ME484 dense expansion enclosure is supported behind any of the ME5 base arrays. A variety of SSD, 10K, and NLSAS drives (including FIPS-certified SEDs) are available.
HDD vs. SDD balancing act
The debate over purchasing SDD or HDD rages on with conflicting opinions. There are benefits for each technology. SDDs offer improved performance and reduced latency over legacy HDDs; however, it would not make economic sense to invest in SDDs for long-term retention. HDDs would make more sense in this scenario. With the ME5 and associated software, the decision to go all-in on SDDs or HDDs does not have to be made upfront. The ME5, using intelligent auto-tiering software, offers the flexibility to mix media and the intelligence to determine if data should be stored on HDD or SDD, performed in real-time. The auto-tiering software recognizes incoming data patterns and places the data on the appropriate tier, providing better performance.
The software solution addresses the need to assume all data is critical and requires the low latency and high performance of SDDs. Auto-tiering works by logically breaking down volumes into small 4K pages and ranking them based on a sophisticated algorithm. Tiering is performed at the sub-LUN level and requires minimum CPU and memory resources. Essentially, active critical data is moved in real-time to the appropriate media.
The tiering algorithm runs every five seconds, during which time the pages are ranked, scanned, and migrated in real-time. The ranking process is determined by access patterns and the scan checks for highly ranked pages. It is possible to rank pages up or down, but ranking a page down is only performed if space is needed for other high-rank pages. To avoid system degradation, only 80MB are migrated during 5-second intervals. The benefit of auto-tiering is a better utilization of media.
The ME5 also offers SSD Read Cache as a second method to leverage SSDs. Read cache is a special-purpose disk group dedicated to holding volatile copies of data within one or more SSDs. The read cache maintains copies of data in the HDD tier and doesn’t require additional SSDs to make the system fault-tolerant. The SSDs provide performance, and the HDDs offer fault tolerance.
Dell PowerVault ME5 Deployment
The PowerVault ME5 block storage array brings the essential features of high-end storage to small-medium businesses with a focus on simplicity and affordability. Highlighting simplicity, Dell expects new installations to be operational in approximately 15 minutes.
With flexible connectivity options, the PowerVault ME5 arrays offer significant advantages for SAN/DAS workloads with impressive IOPs, massive bandwidth, scale, and low latency. An all-inclusive software model helps to reduce OPEX and improve operational efficiencies, making the ME5 Series a top candidate.
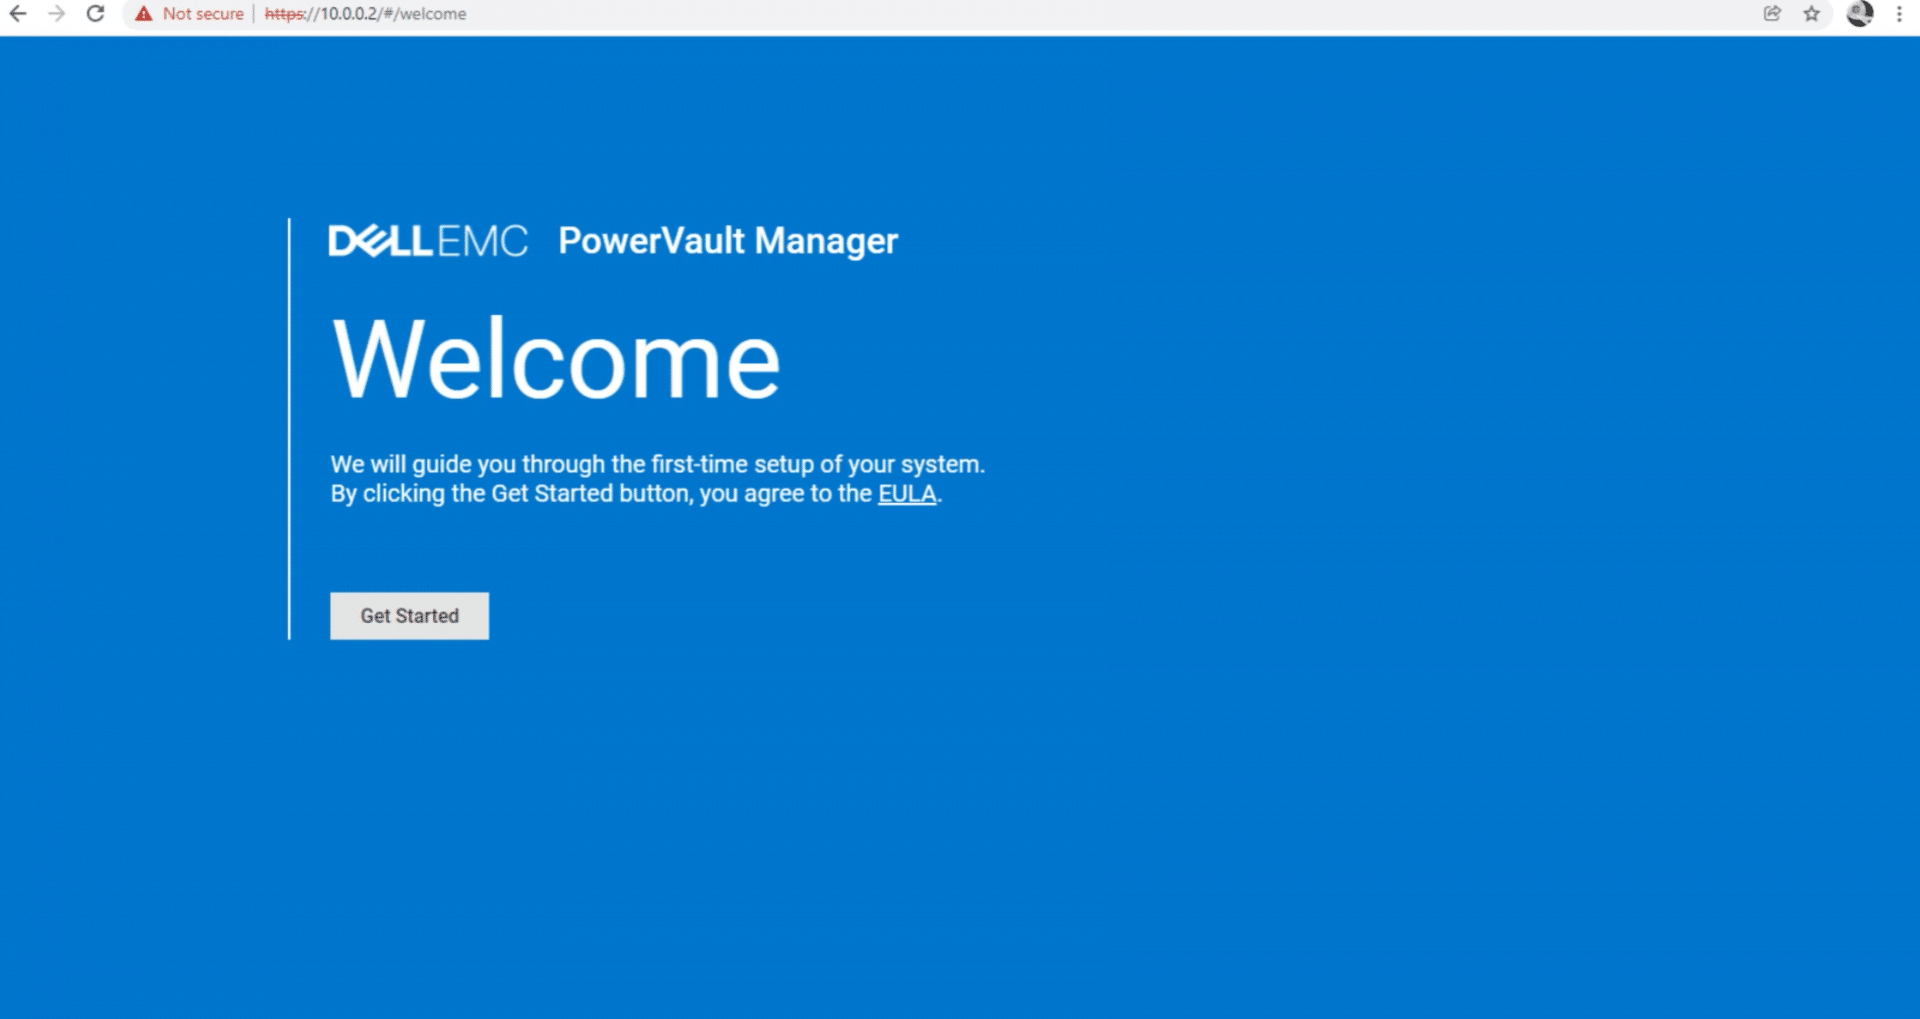
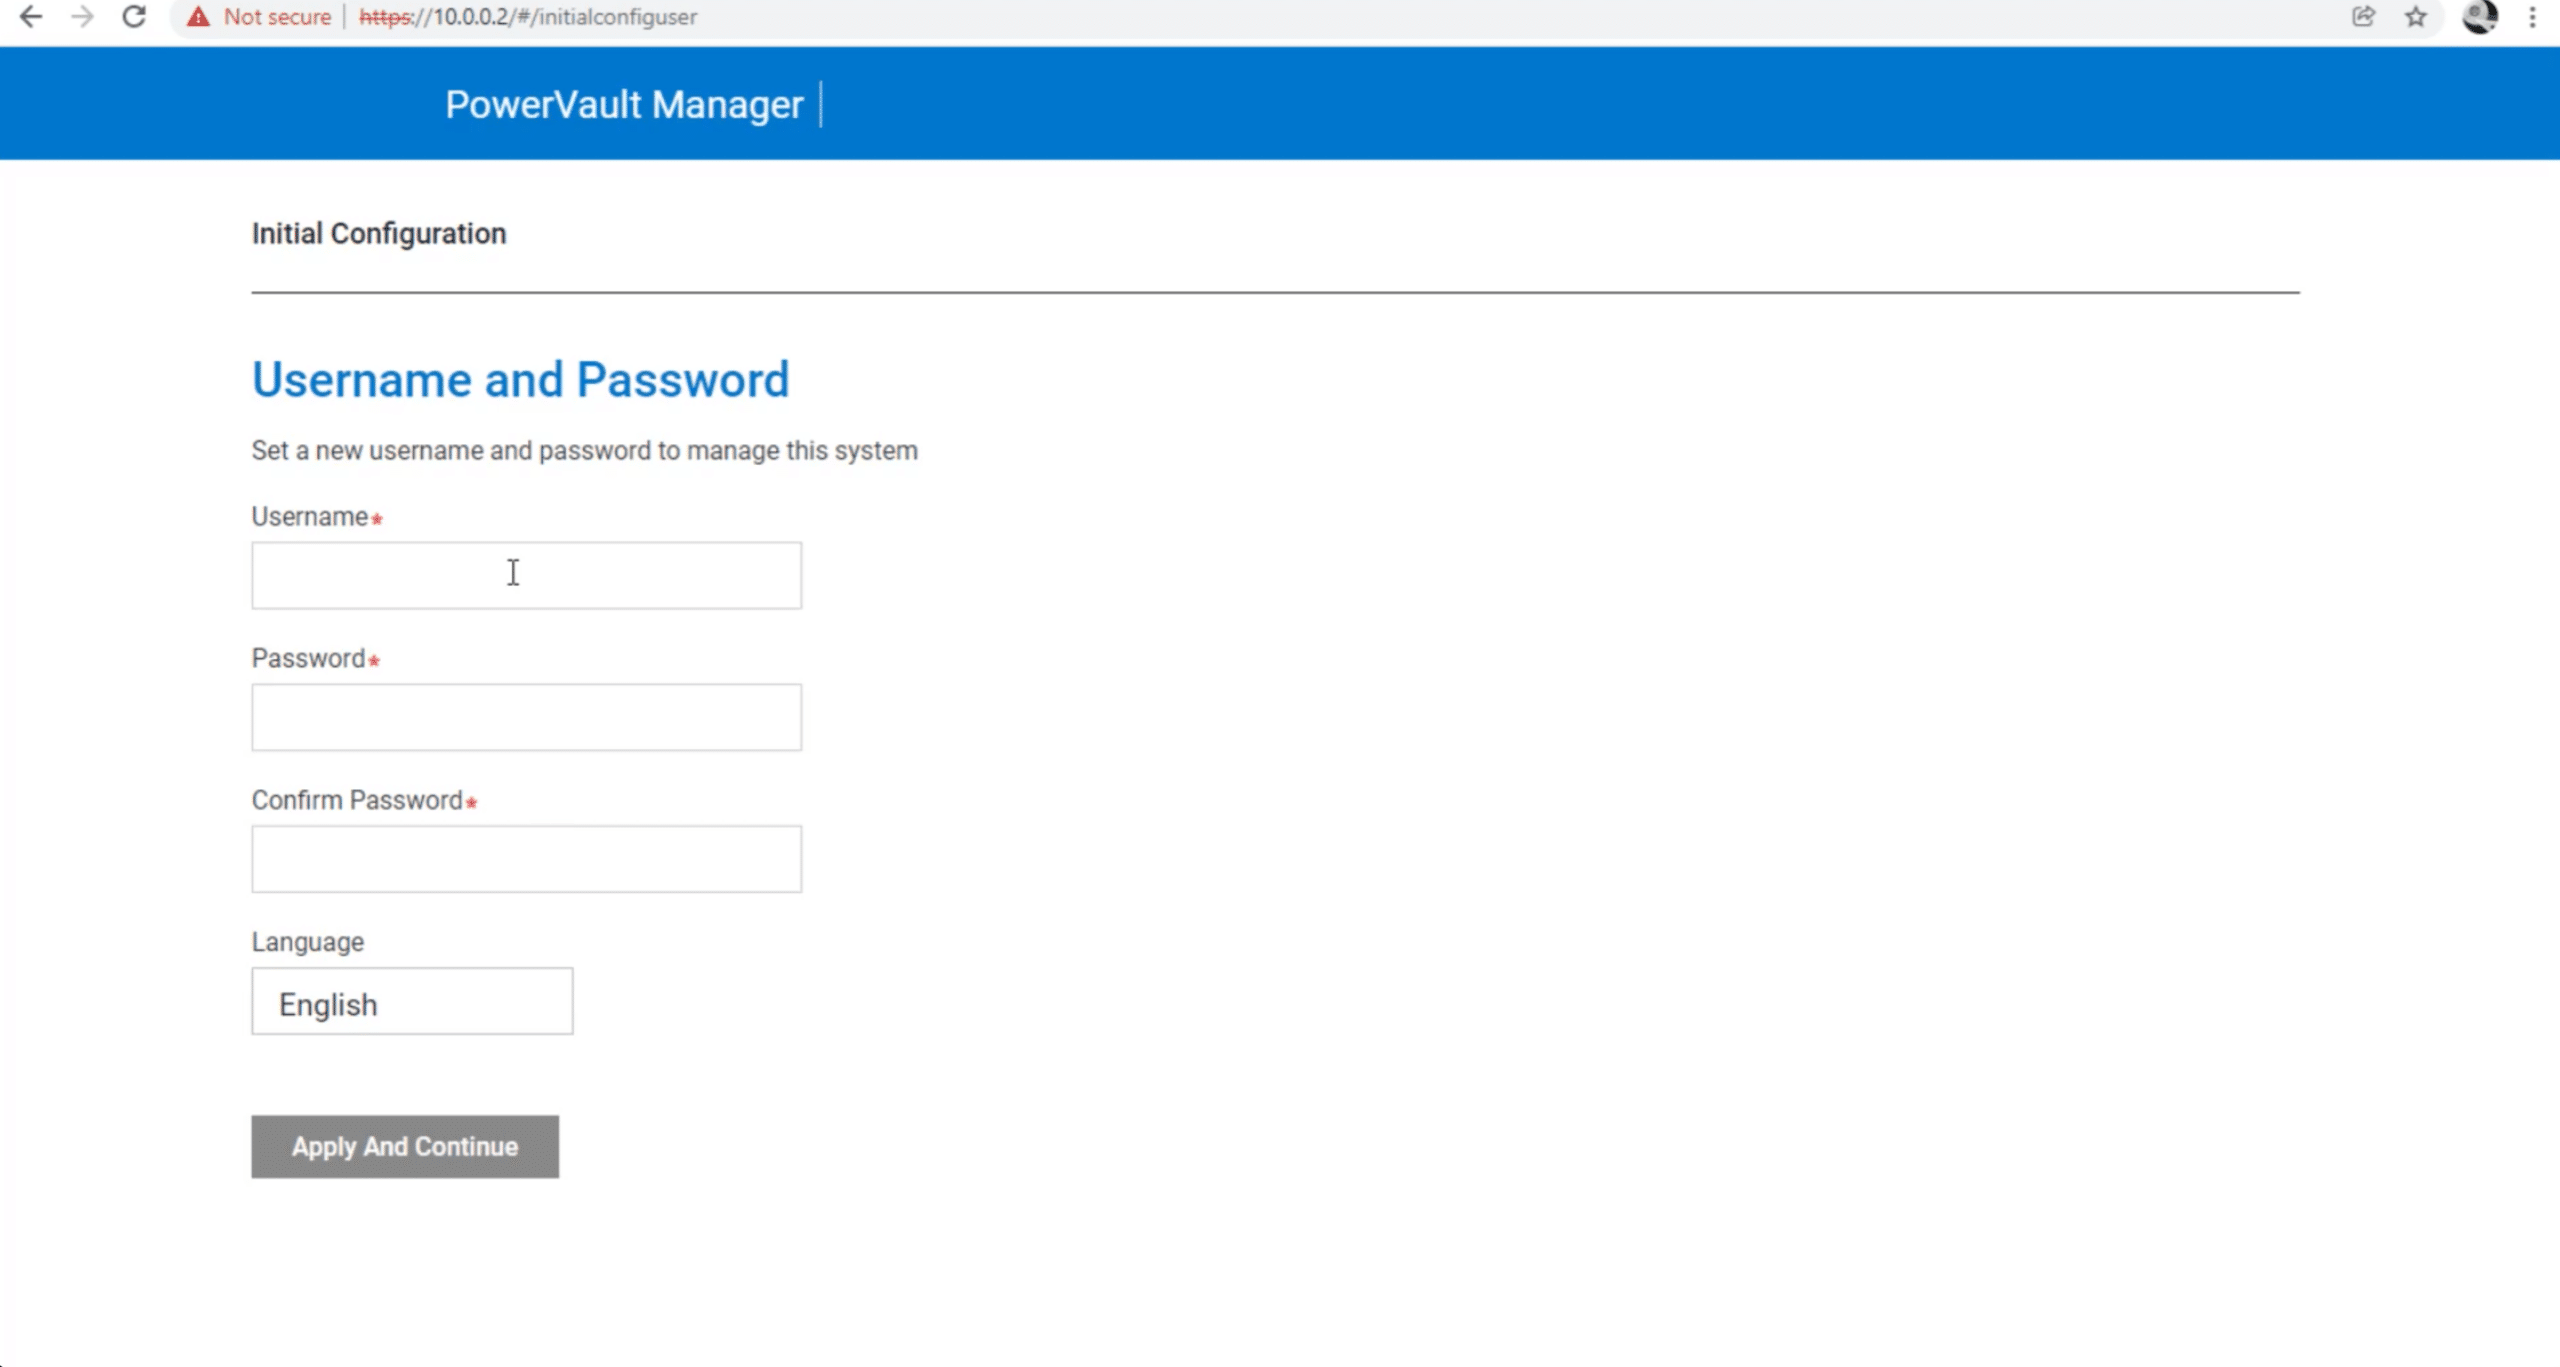
We had a PowerVault ME5 5012 system in the lab to run through the setup and record some performance numbers. The configuration is performed through the included PowerVault Manager with an easy-to-follow interface, along with suggestions making the process relatively simple. Out of the box, the PowerVault ME5 has a common pre-configured static IP configuration so you know what to go to with a web browser as it powers on. Everything is handled through its HTML5 web interface during this deployment, so no need to dust off your favorite SSH or Telnet client. Counting the time to bring it out of the box, get it into the rack, and cabled up, we were able to hit the web interface in under 10 minutes. The additional steps we outline below take about 3-5 minutes to get through. We spent more time finding the FC ports on our switch and available PDU ports than we did working through the initial configuration.
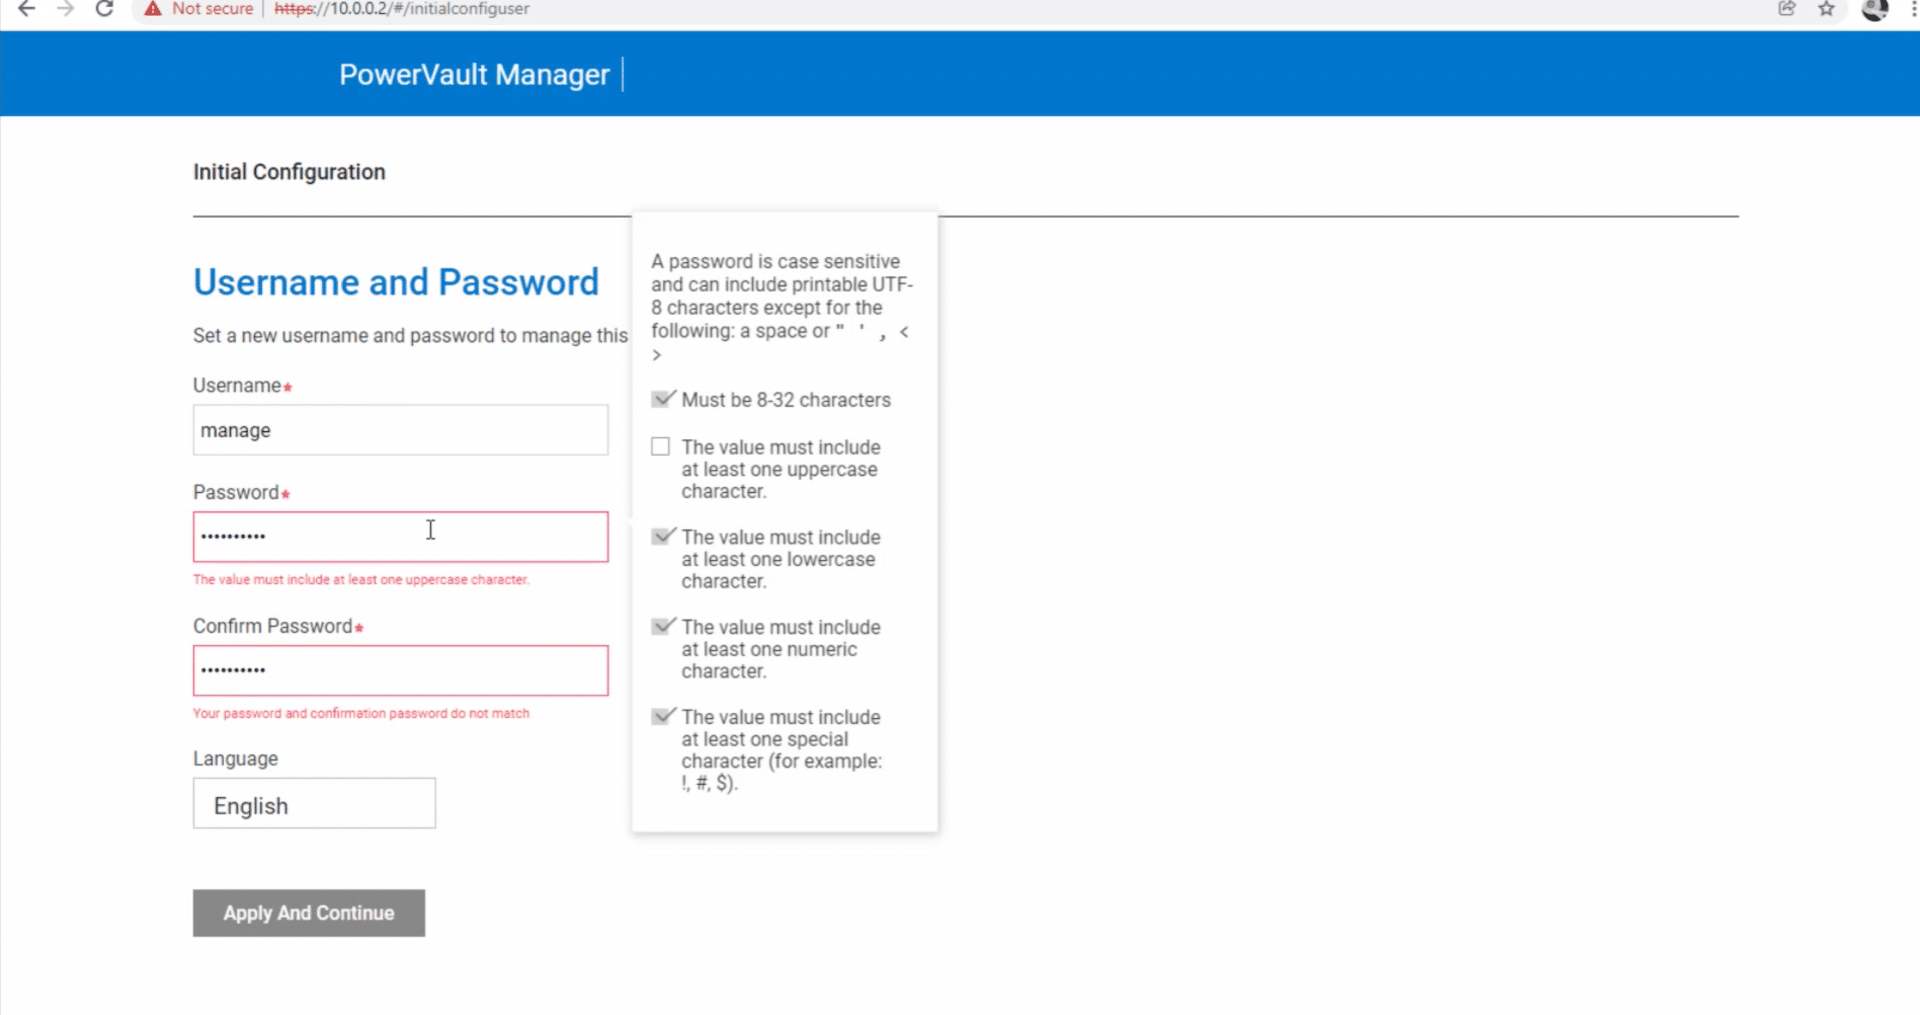
To get started, create a user account on the initial configuration display. Password restrictions will prompt the administrator with a pop-up window if the password entered does not meet the requirements.
Once the account is set up, the manager displays a prompt to check for updated firmware. If everything is current, the manager will open the System Configuration Page. The PowerVault Manager will step through the configuration process to ensure the system is set up successfully and indicate if the steps have been completed.
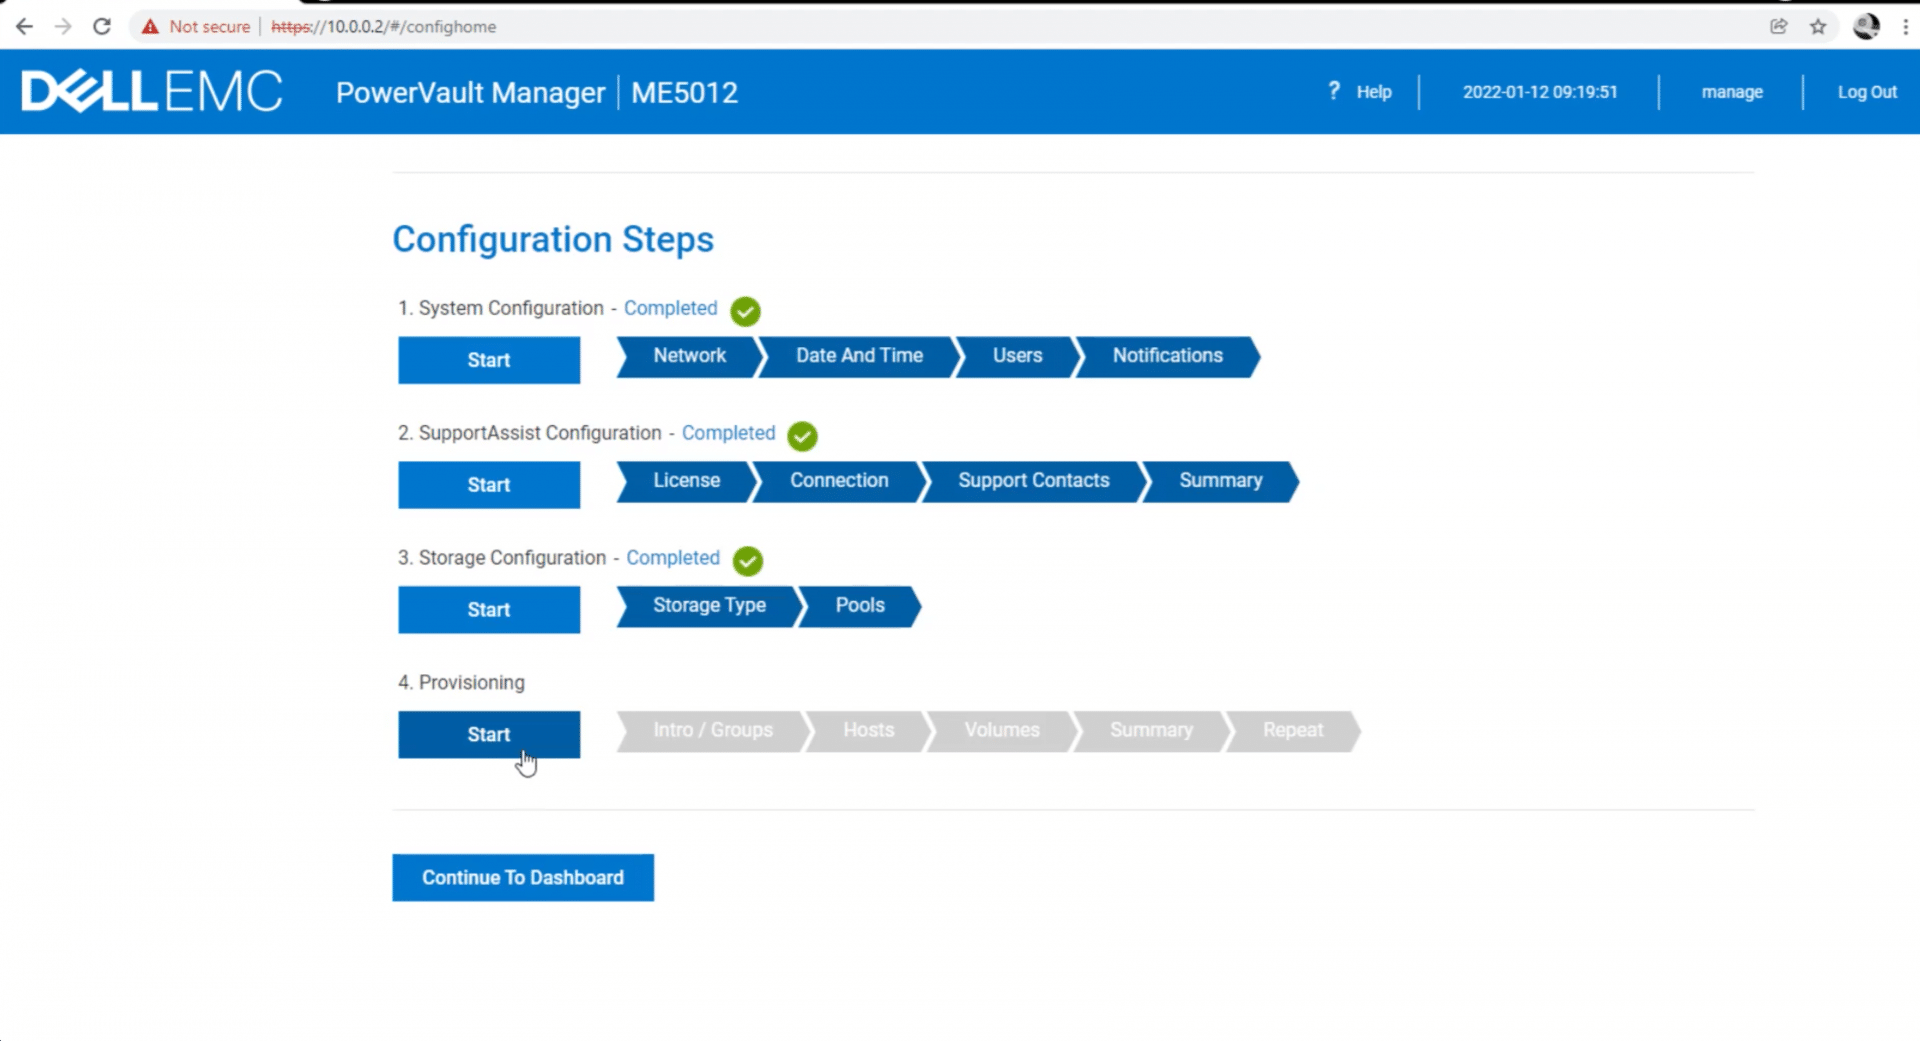
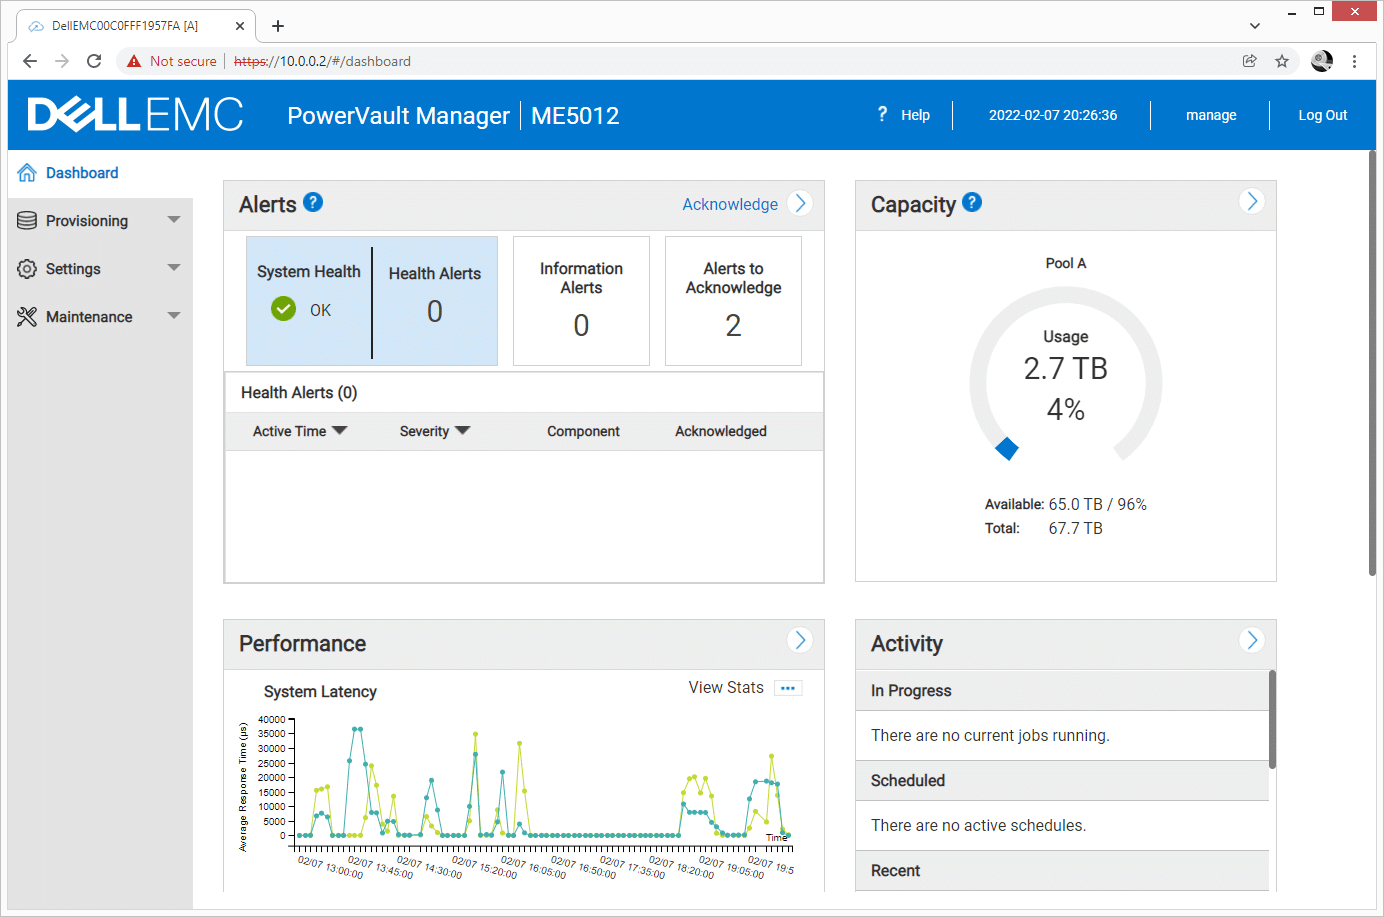
Once the initial configuration is complete, and storage has been configured, the option to proceed to the Dashboard is made available. You can see the system health information view from the Dashboard and acknowledge alerts.
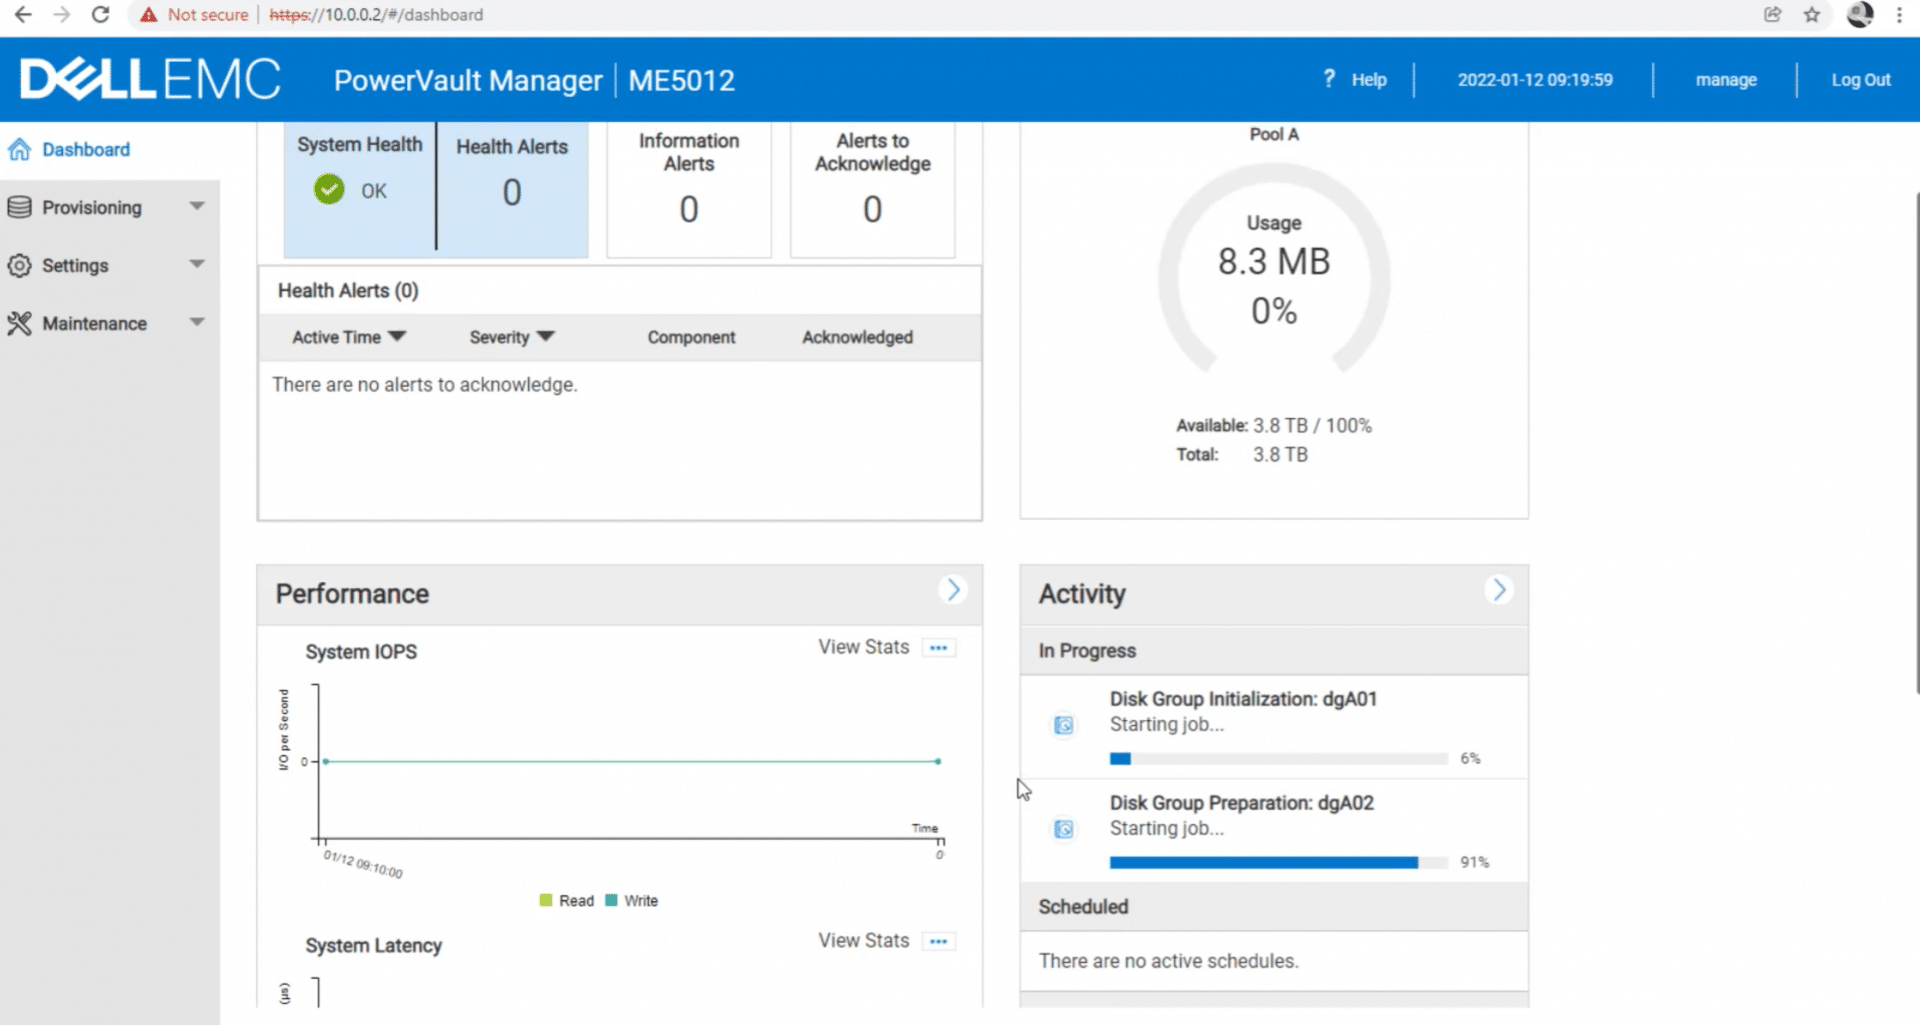
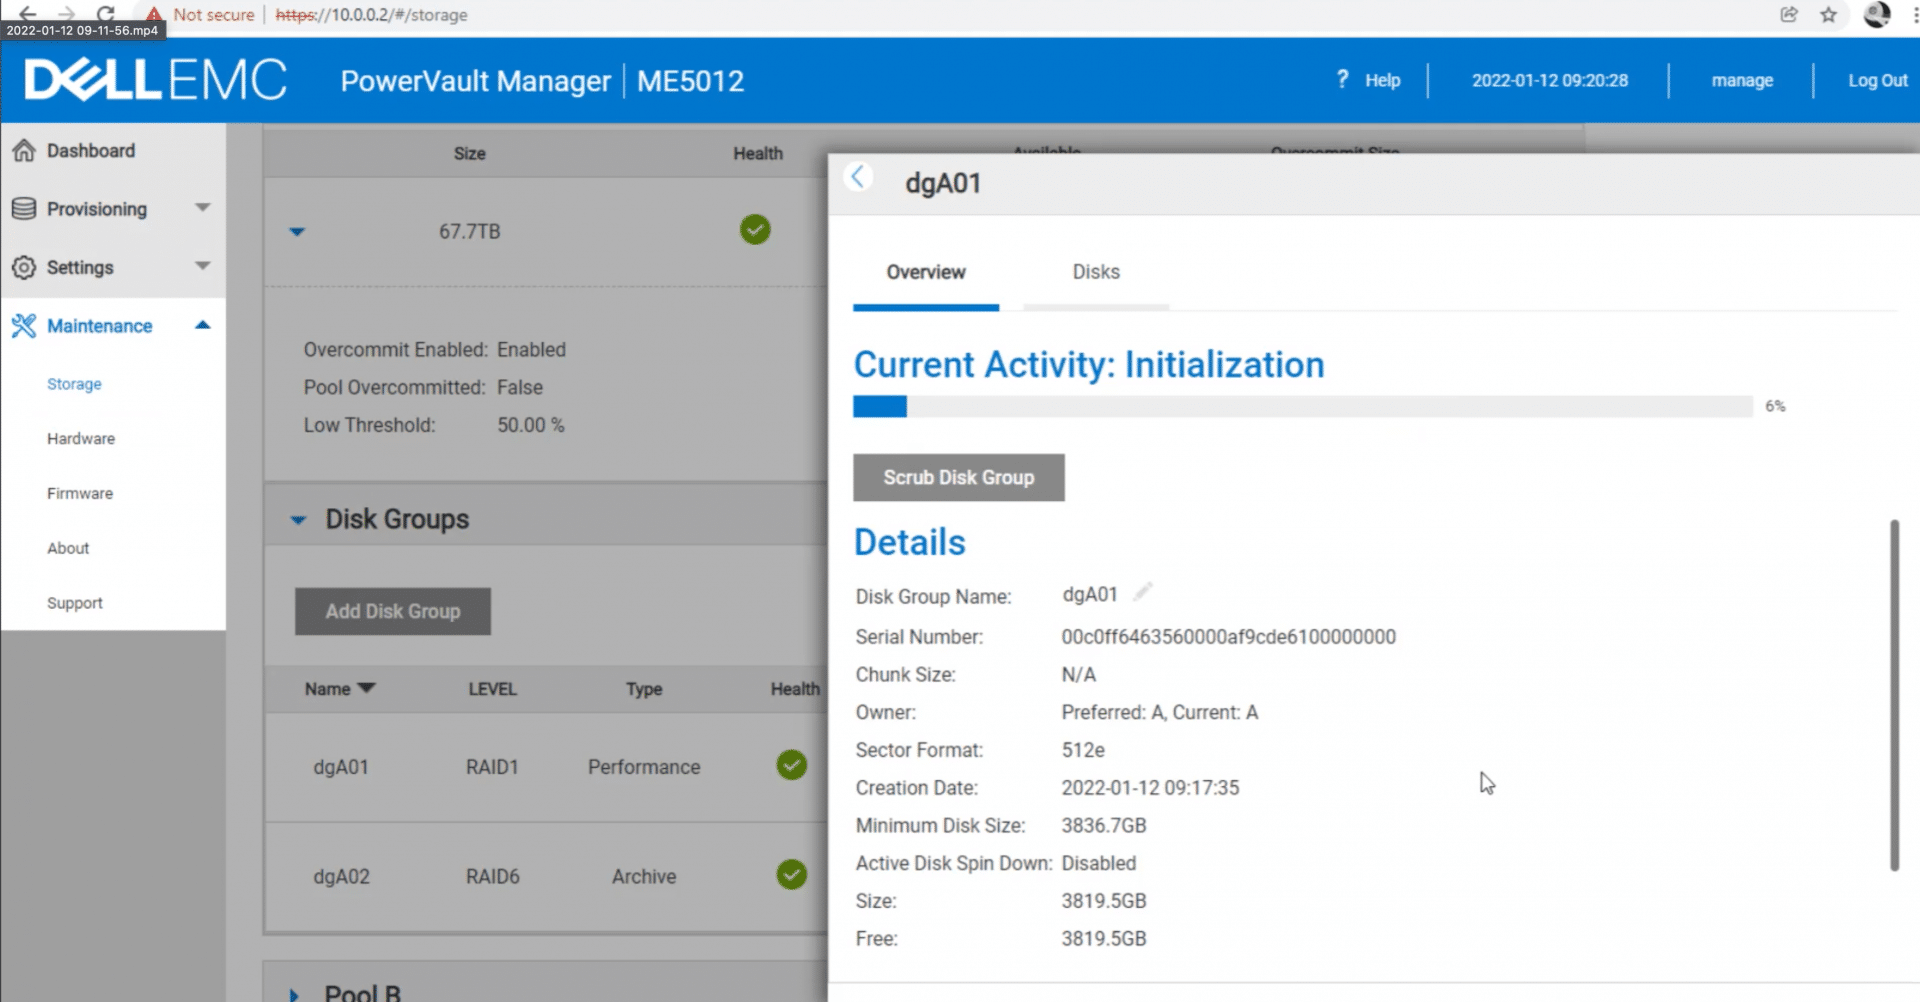
From the Maintenance dropdown menu, you can view the disk groups running through their initialization kicked off earlier.
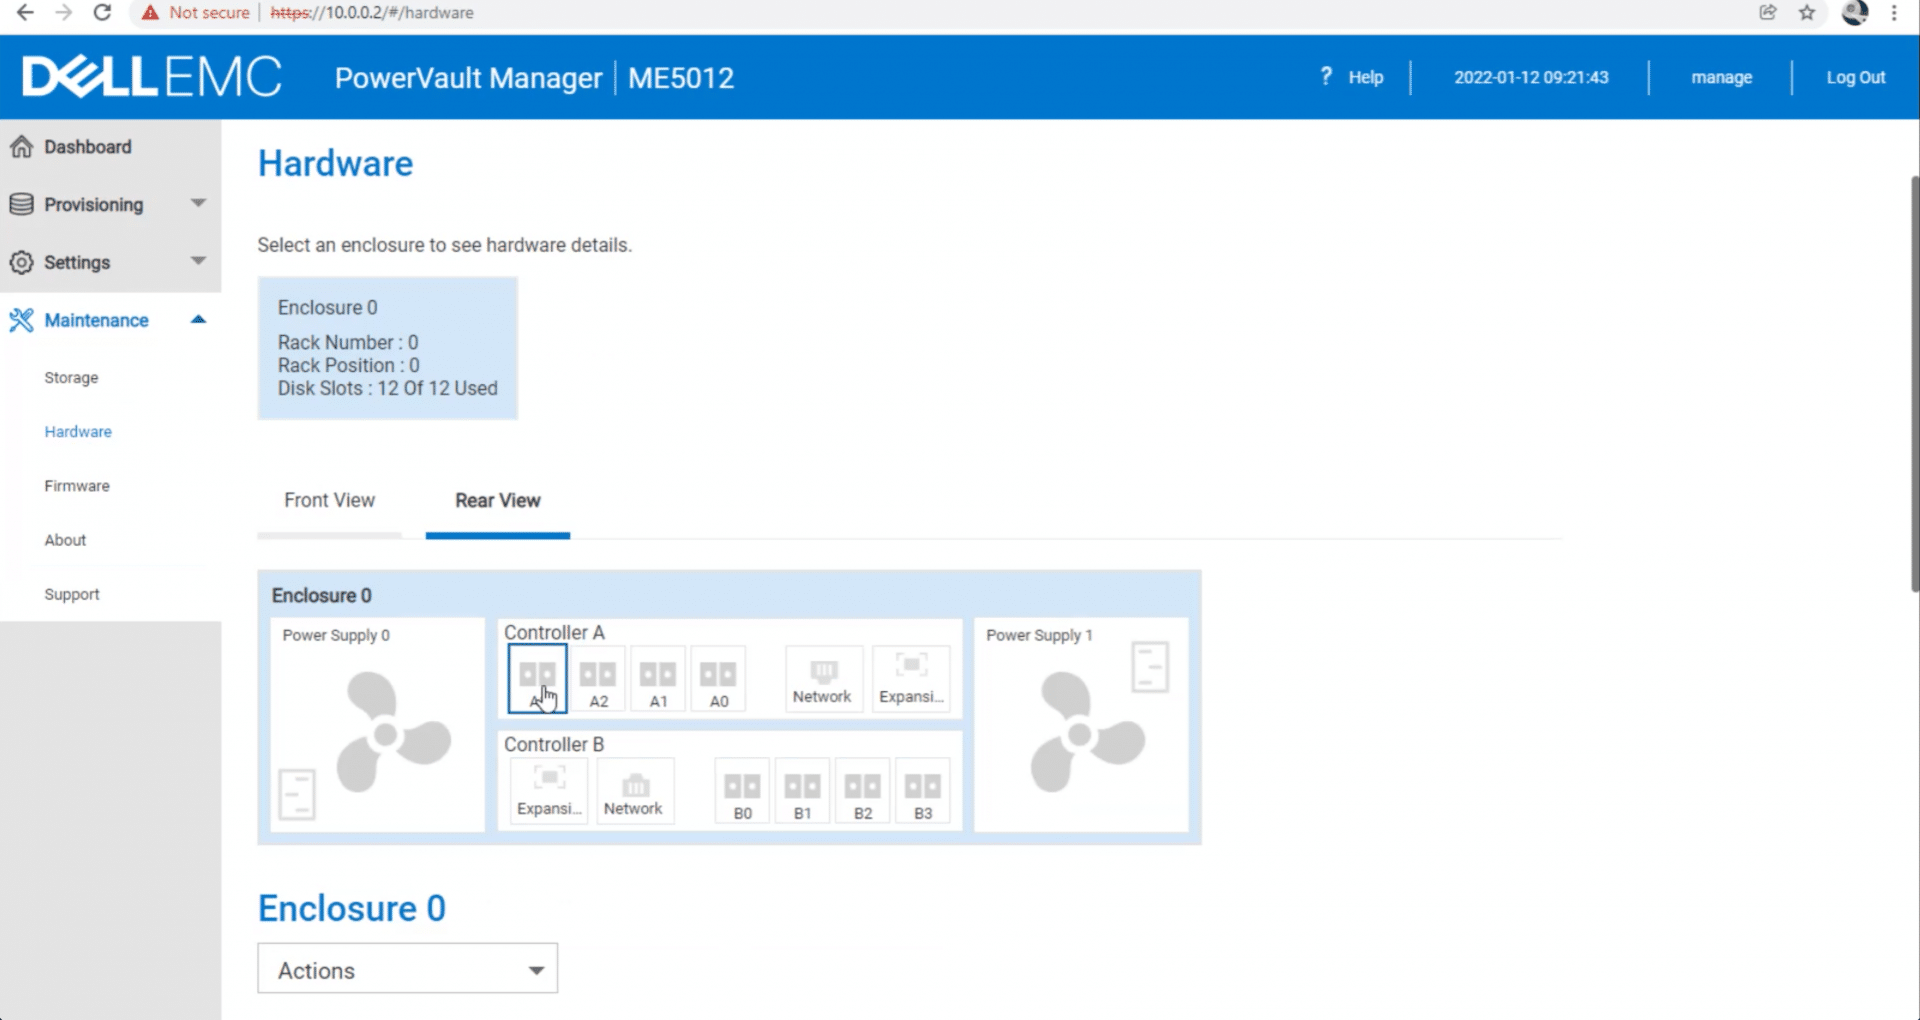
From the Dashboard, you can view the system status and verify hardware details at any time. There is an option to view both front and rear views. From the settings menu, properties for all aspects of the system can be examined via simple dropdown menus.
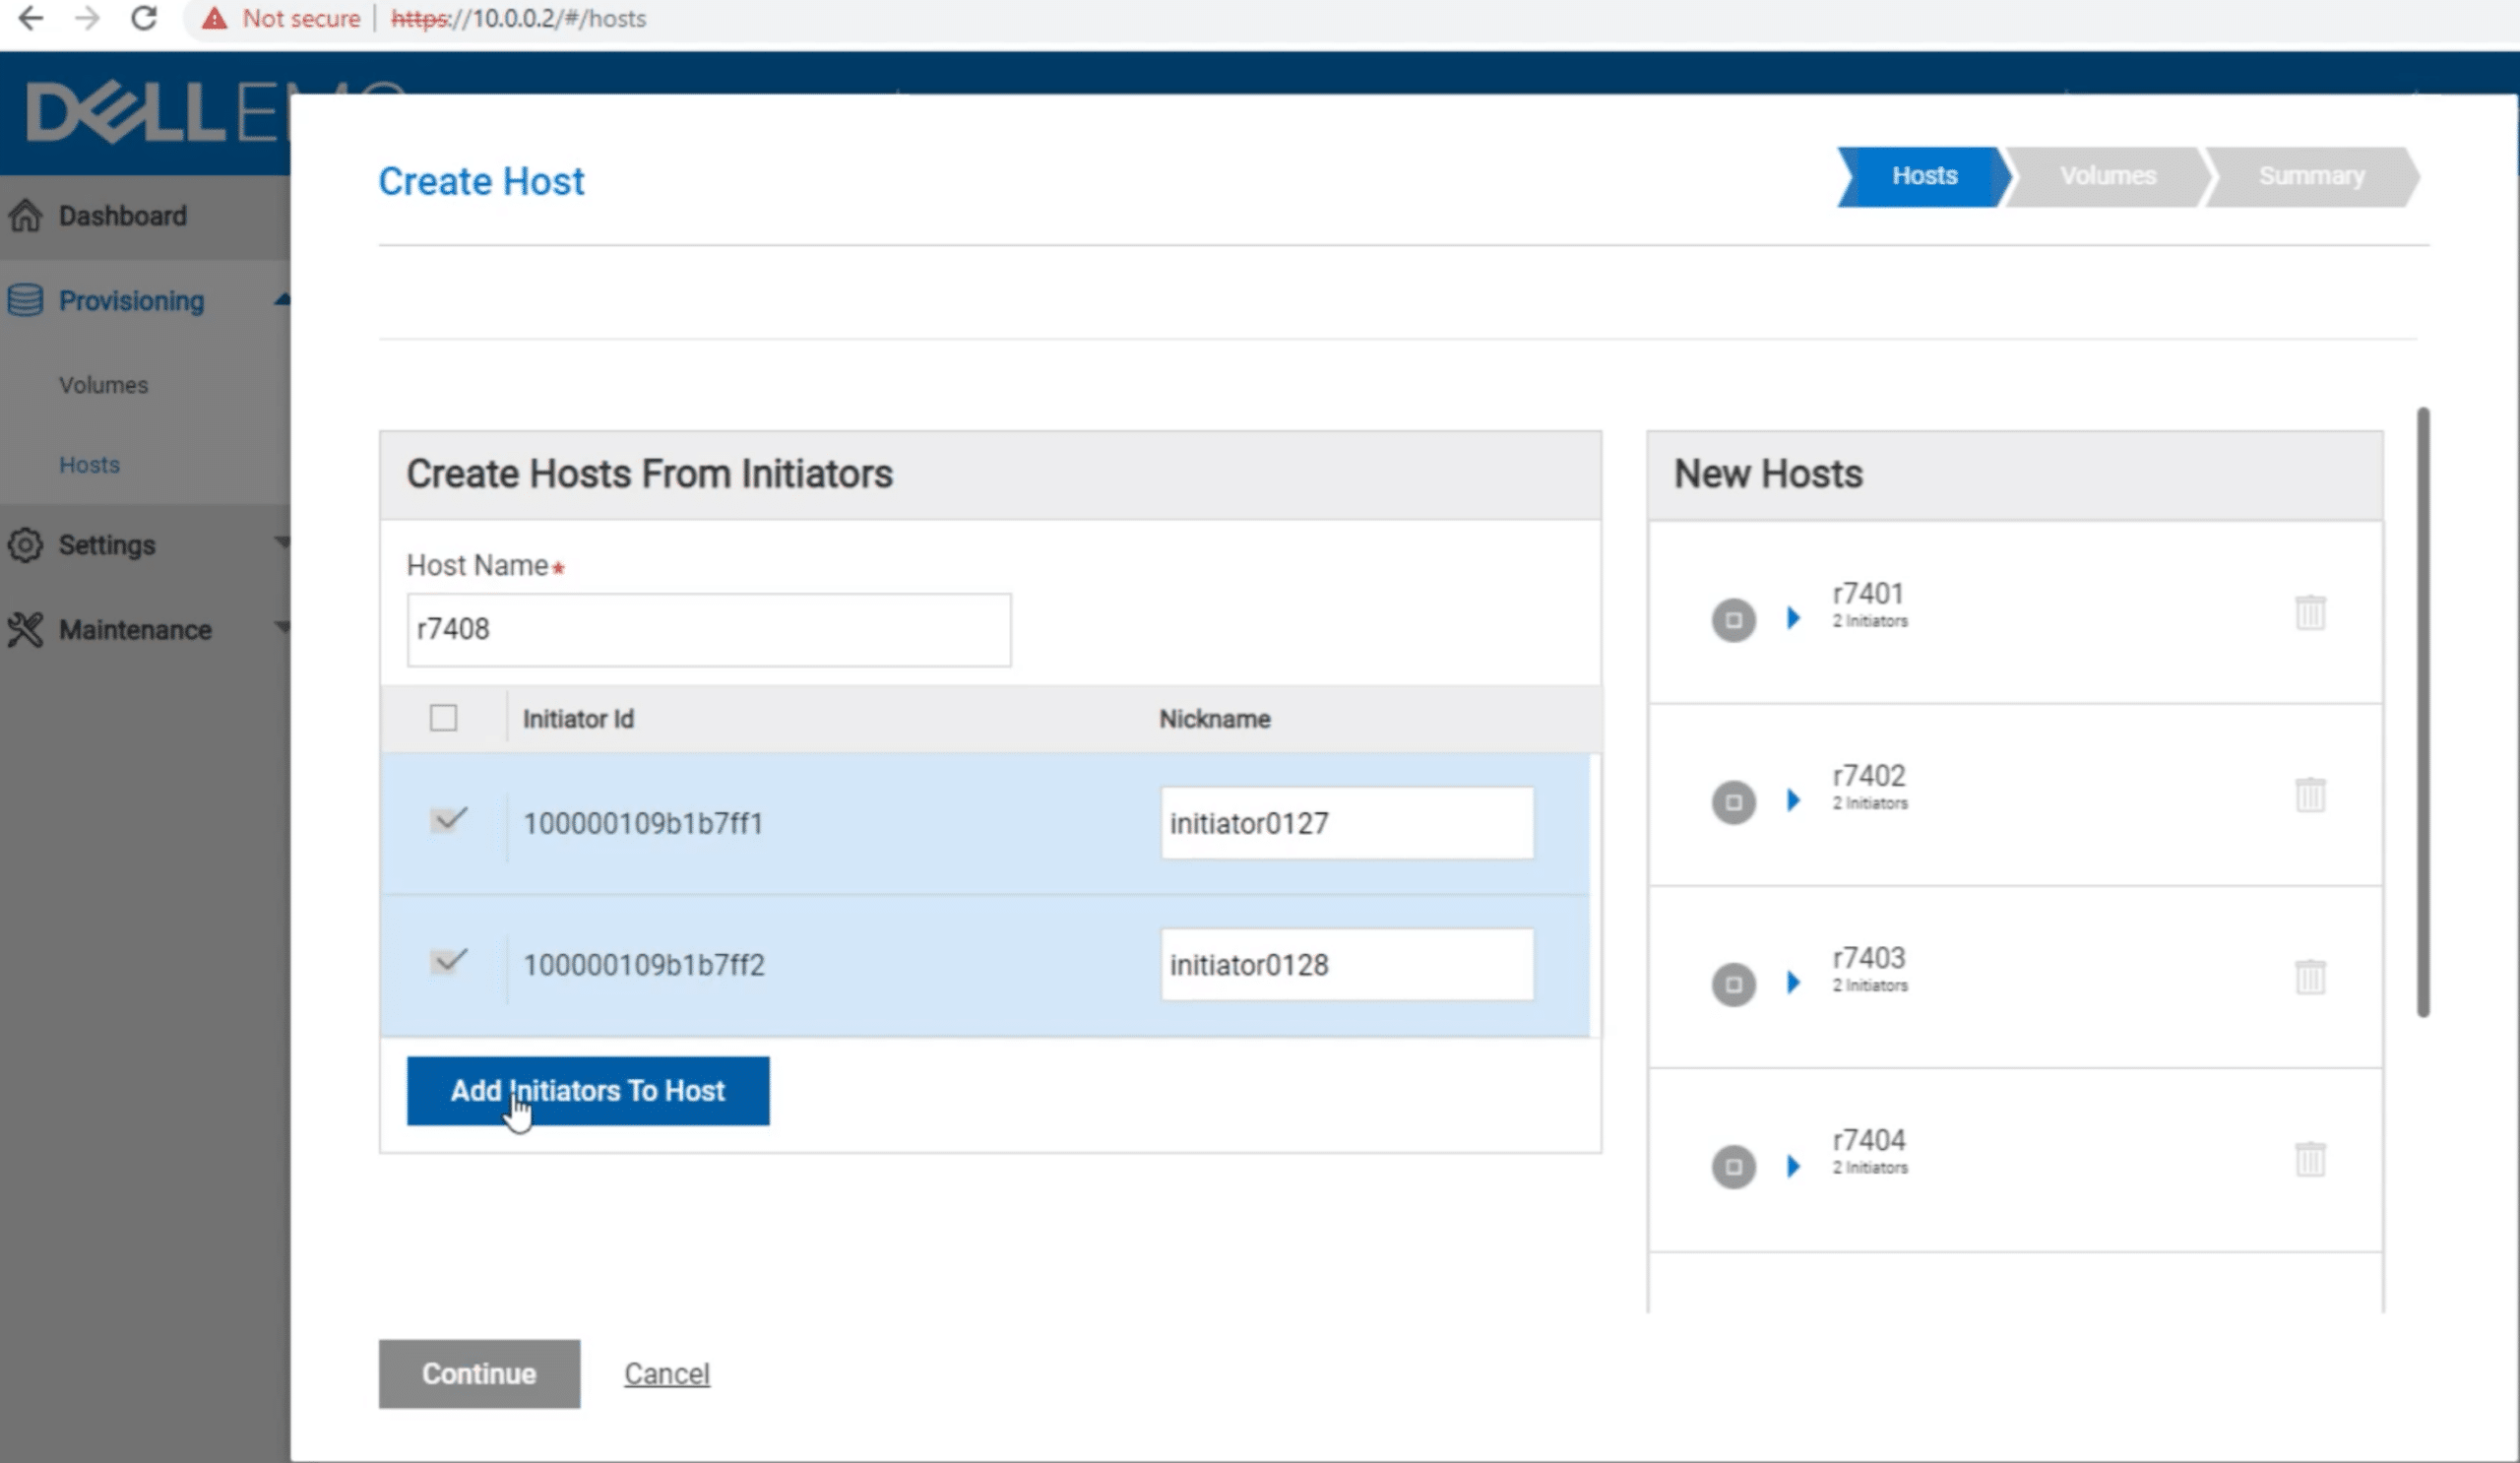
Following disk group initialization, you are prompted to set up host initiators. Here we see available initiators and assign them to a hostname we create.
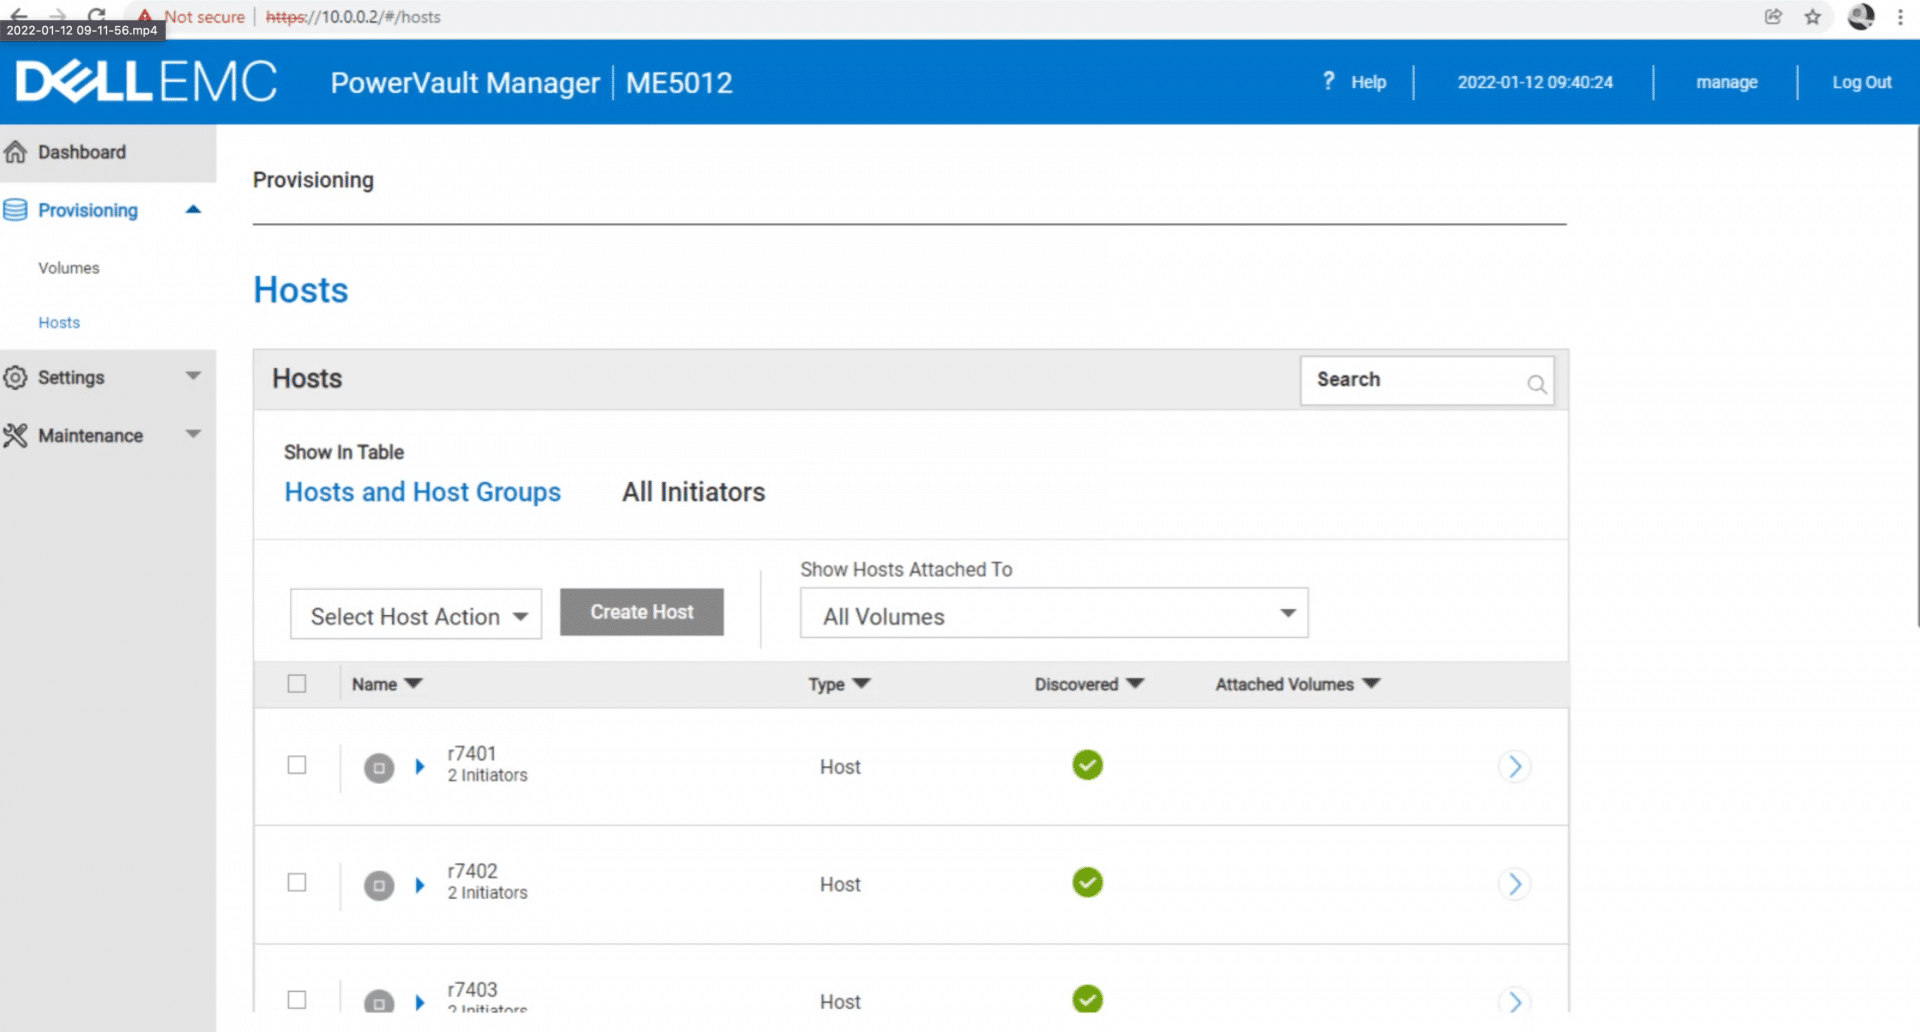
When the create-host step is completed, you are able to view the host’s setup and provision storage volumes.
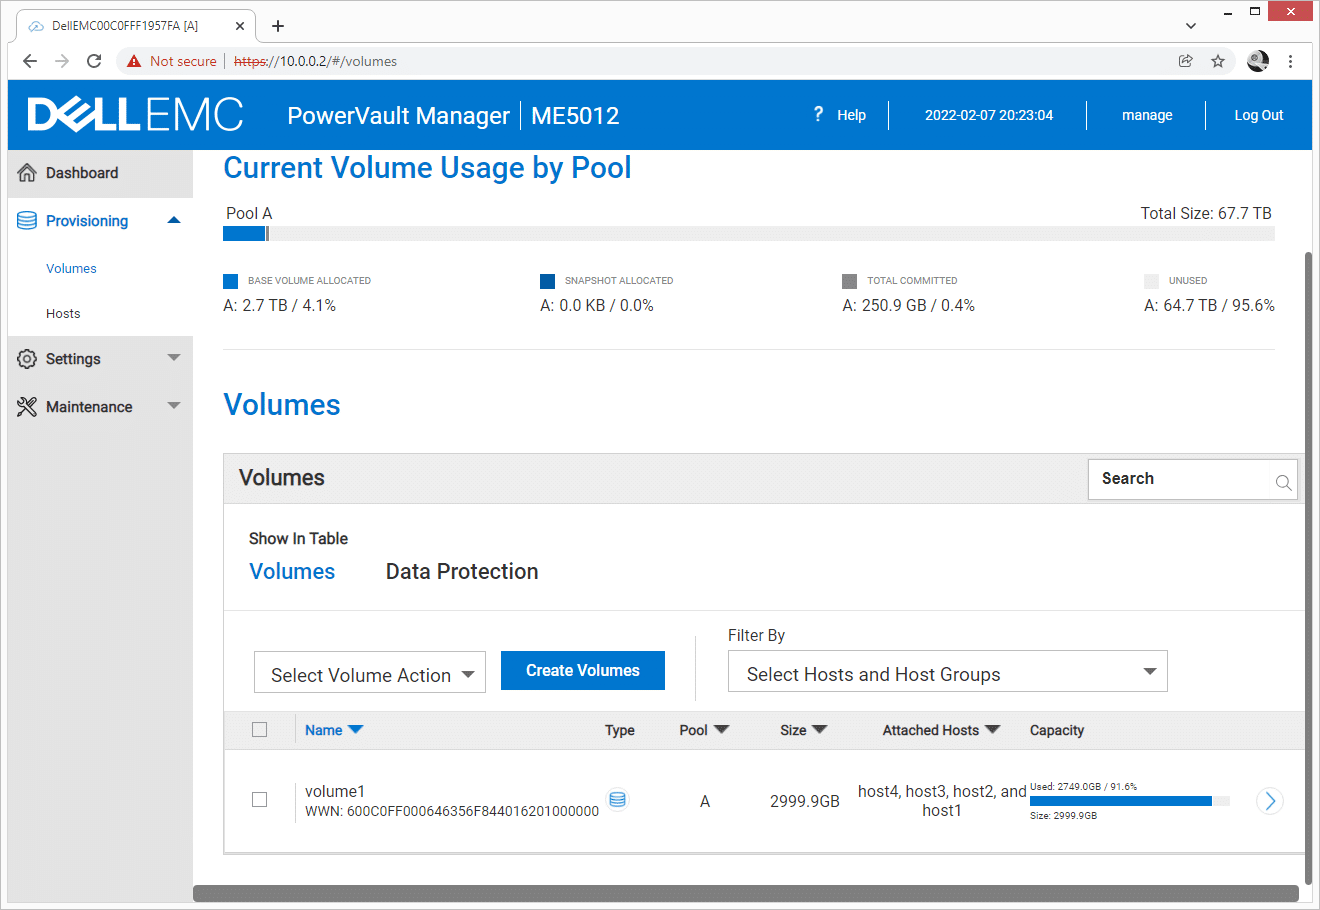
Provisioning and managing storage is a very simple process on the ME5 using PowerVault Manager. Under Provisioning and Volumes, with a simple glance, you can view the current Pool resources consumed, how much is unused and available to still be provisioned. To make a new volume, you click “Create Volumes” and assign a name, how much storage and which hosts you want the storage to be addressed to.
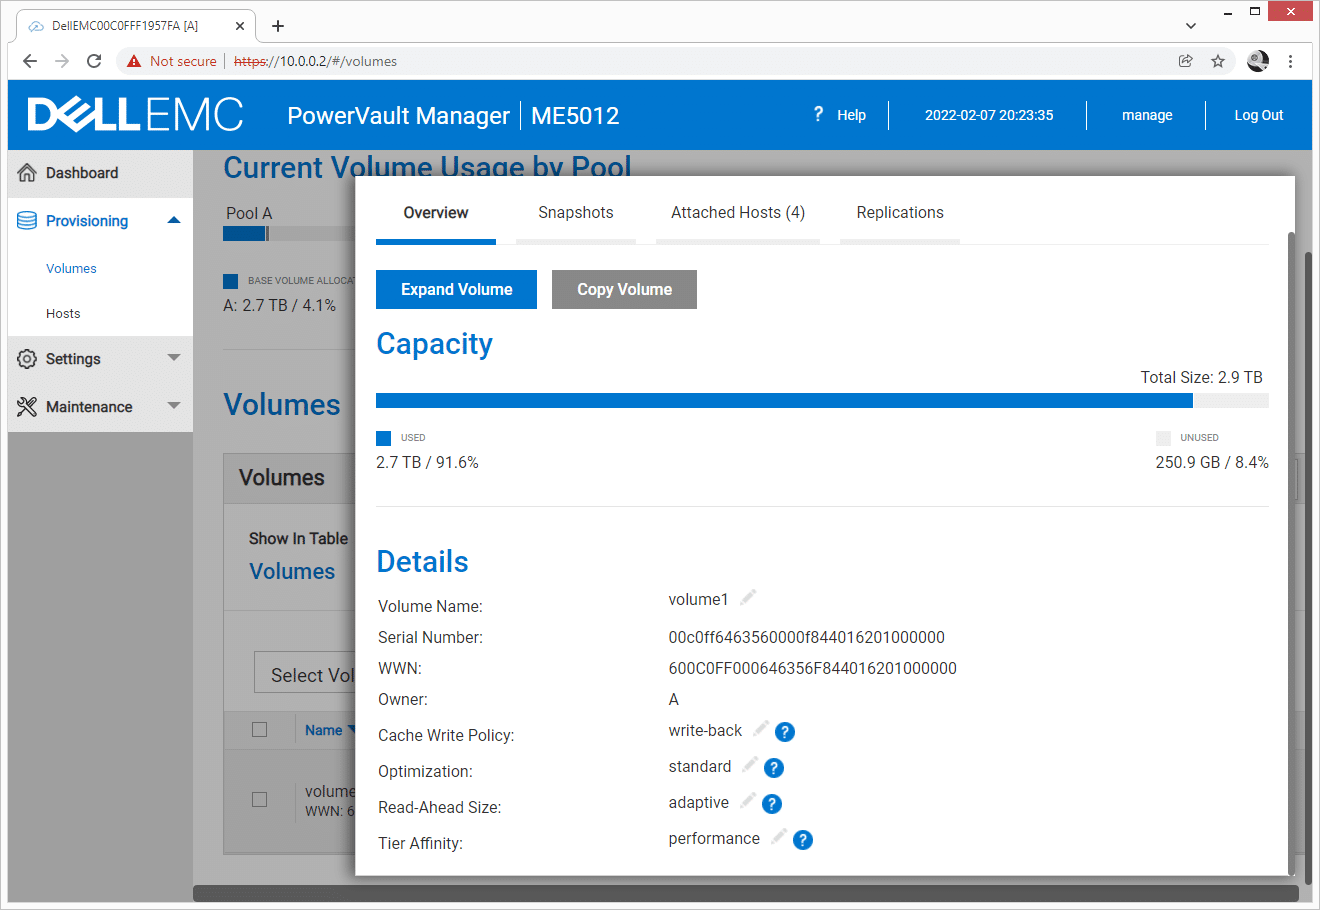
Volumes can also be adjusted for different environments, with settings for Cache Write Policy, Optimization, Read-Ahead Size, and Tier-Affinity being adjustable. Tier-Affinity offers different options to position your data on the array, with no affinity being defaulted, performance to keep hot data in flash, and archive to keep known cold data in your capacity tier.
Once the system has been fully configured and is operational, you can use the environment of your choice to use the storage. In this case, we leverage VMware’s vSphere Client to associate new LUNs with a new Datastore. After Day 1 operations, PowerVault Manager has performance monitoring to keep an eye on how well the storage is performing. The home page keeps a real-time view into the status of the array with capacity, performance, alerts, and background activities within eyeshot.
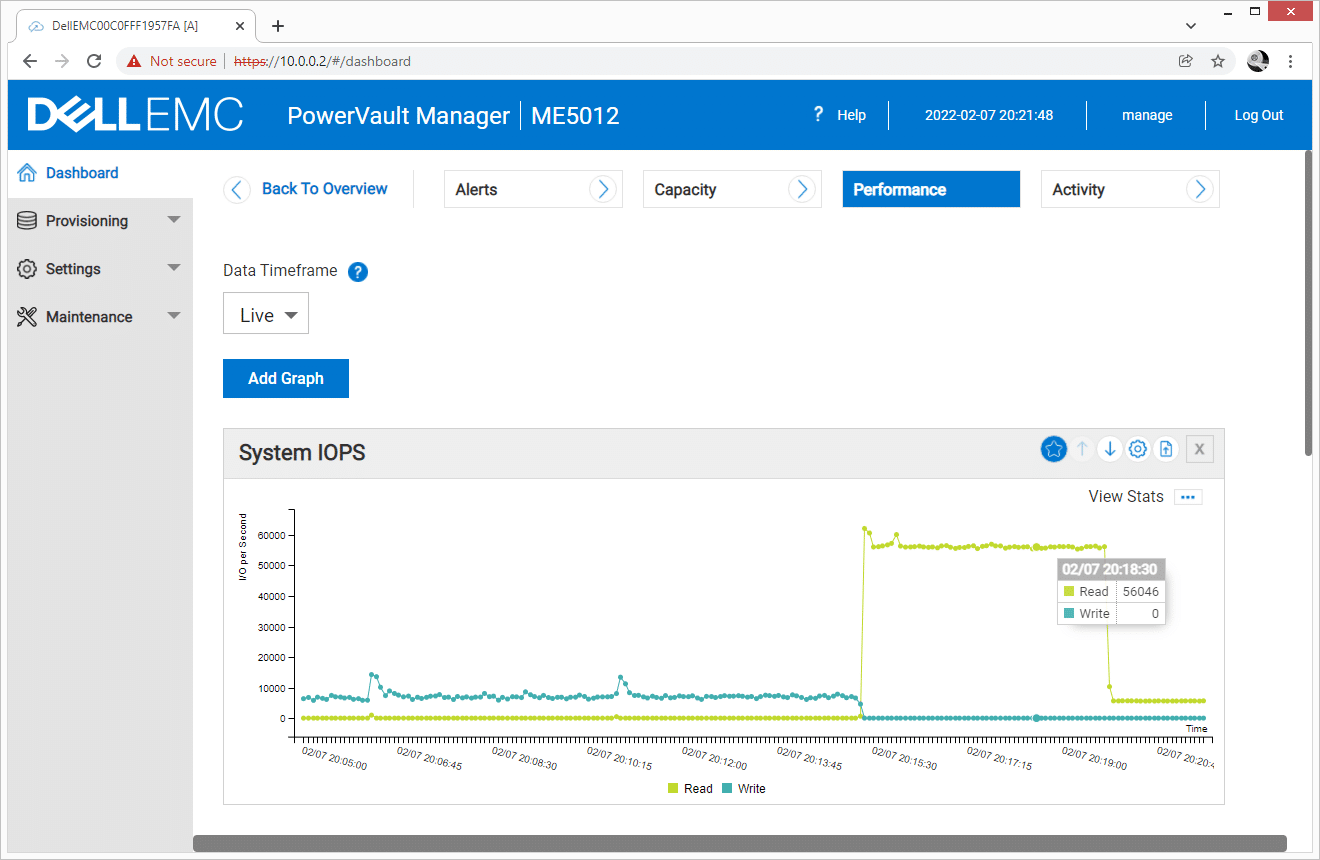
Administrators are also able to drill into the performance counters for a better view, expanding the performance monitoring section. Here we can see a live graph on System IOPS, with customizable graphs available to see the stats you are most interested in. You are also able to expand the timeframe of the performance counters to better track historical data.
The system specs on the PowerVault ME5 are impressive. Management and expansion options make this system a top choice for growing small and medium businesses.
Dell PowerVault ME5 Performance
Configuration
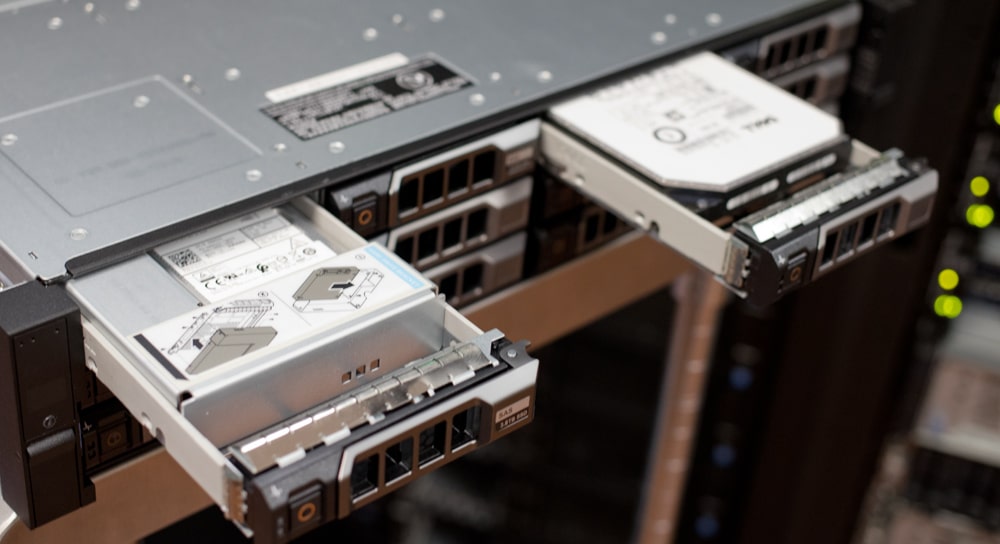
We configured the Dell PowerVault ME5 5012 with two read-intensive 3.84TB SSDs, with the remaining ten bays filled with 8TB SAS hard drives. For disk groups in our storage pool, we used the two SSDs to create a RAID1 performance tier and the remaining hard drives in a single RAID6 archive tier. This configuration offered the benefits of strong performance for hot data and a large capacity for bulk storage. With the ME5 5012, this did put all storage under the control of one controller or in other words, an active-passive configuration. Different drive counts or the 24-bay 2.5″ chassis would allow for pools split evenly across both controllers putting the ME5 into an active-active configuration.
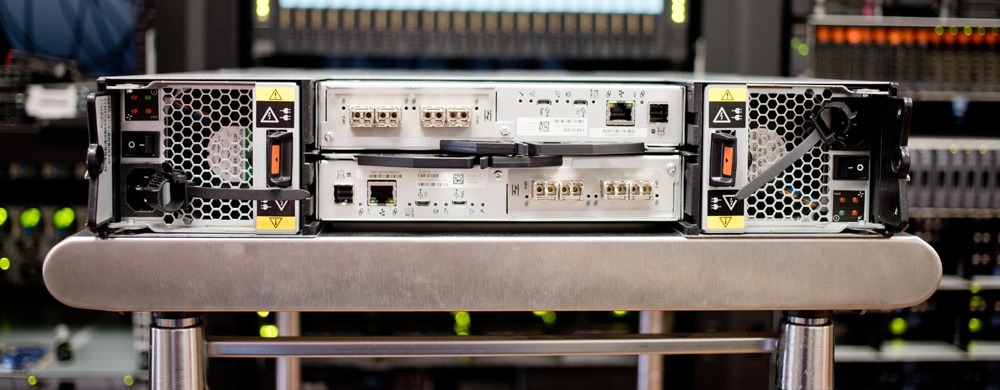
For connectivity, we went with a Fibre Channel setup leveraging the 32Gb speed offered by the new ME5 controllers. In the first setup, we used a dual-fabric configuration where each controller was evenly split across two Brocade G620 32Gb FC switches, connecting four hosts with dual-port Marvell QLE2772 32Gb HBAs touching each fabric. In the second setup, we opted for an edge deployment type where the four hosts were direct-attached to the ME5. With four 32Gb ports per controller or eight per array, this direct-attached method offered redundant connectivity to each host.
In terms of how the storage was leveraged once provisioned to the hosts, we created a single 3TB LUN which was then presented to our four VMware hosts. Our testing model was designed around having our hot data sized to fit inside the flash tier for optimal performance. Using 16 VMs, we attached two 80GB vmdks each, or 2.56TB total for our Vdbench workloads. In our Sysbench test containing four MySQL VMs, the data footprint was 300GB per VM, while the SQL Server workload of 1VM used about 650GB of storage.
SQL Server Performance
StorageReview’s Microsoft SQL Server OLTP testing protocol employs the current draft of the Transaction Processing Performance Council’s Benchmark C (TPC-C), an online transaction processing benchmark that simulates the activities found in complex application environments. The TPC-C benchmark comes closer than synthetic performance benchmarks to gauging the performance strengths and bottlenecks of storage infrastructure in database environments.
Each SQL Server VM is configured with two vDisks: 100GB volume for boot and a 500GB volume for the database and log files. From a system resource perspective, we configured each VM with 16 vCPUs, 64GB of DRAM and leveraged the LSI Logic SAS SCSI controller. While our Sysbench workloads tested previously saturated the platform in both storage I/O and capacity, the SQL test looks for latency performance.
This test uses SQL Server 2014 running on Windows Server 2012 R2 guest VMs, and is stressed by Dell’s Benchmark Factory for Databases. While our traditional usage of this benchmark has been to test large 3,000-scale databases on local or shared storage, in this iteration we focus on spreading out four 1,500-scale databases evenly across our servers.
SQL Server Testing Configuration (per VM)
- Windows Server 2012 R2
- Storage Footprint: 600GB allocated, 500GB used
- SQL Server 2014
- Database Size: 1,500 scale
- Virtual Client Load: 15,000
- RAM Buffer: 48GB
- Test Length: 3 hours
- 2.5 hours preconditioning
- 30 minutes sample period
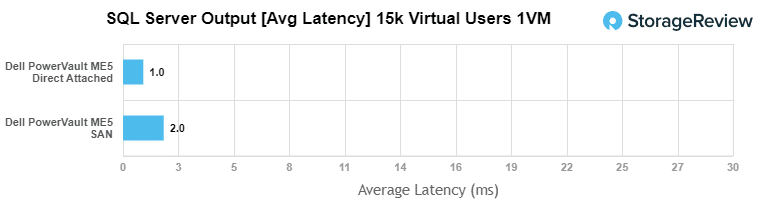
In our SQL Server application workload, we measured an average latency of 1ms with the Direct Attached ME5 configuration and 2ms under SAN attached.
Sysbench MySQL Performance
Our first local-storage application benchmark consists of a Percona MySQL OLTP database measured via SysBench. This test measures average TPS (Transactions Per Second), average latency, and average 99th percentile latency as well.
Each Sysbench VM is configured with three vDisks: one for boot (~92GB), one with the pre-built database (~447GB), and the third for the database under test (270GB). From a system resource perspective, we configured each VM with 16 vCPUs, 60GB of DRAM and leveraged the LSI Logic SAS SCSI controller.
Sysbench Testing Configuration (per VM)
- CentOS 6.3 64-bit
- Percona XtraDB 5.5.30-rel30.1
- Database Tables: 100
- Database Size: 10,000,000
- Database Threads: 32
- RAM Buffer: 24GB
- Test Length: 3 hours
- 2 hours preconditioning 32 threads
- 1 hour 32 threads
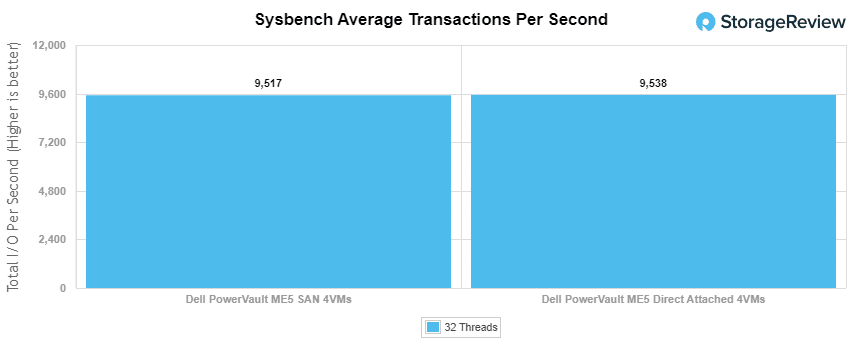
In our Sysbench workload, both PowerVault ME5 configurations were very closely matched. We measured 9,517 TPS from the SAN attached configuration while the Direct Attached setup measured 9,538 TPS.
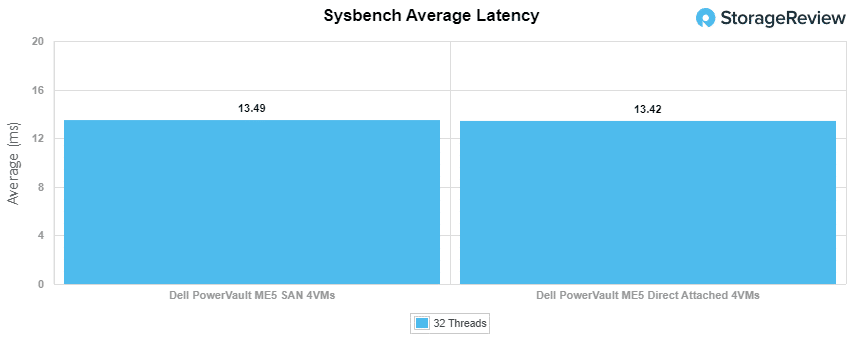
Average latency across the 4VM workload measured 13.49ms from the SAN-attached ME5 while the Direct Attached ME5 measured 13.42ms.
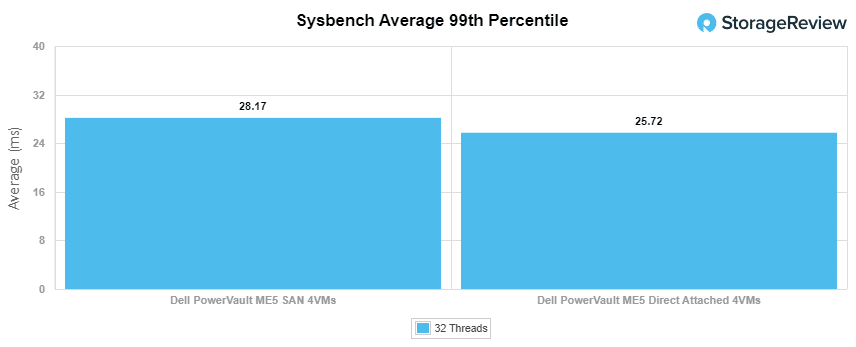
In our last Sysbench test measuring average 99th percentile latency, we saw 28.17ms from the SAN-attached ME5 versus 25.72ms when the ME5 was direct attached.
VDBench Workload Analysis
When it comes to benchmarking storage arrays, application testing is best, and synthetic testing comes in second place. While not a perfect representation of actual workloads, synthetic tests do help to baseline storage devices with a repeatability factor that makes it easy to do apples-to-apples comparisons between competing solutions. These workloads offer a range of different testing profiles ranging from “four corners” tests, common database transfer size tests, as well as trace captures from different VDI environments. All of these tests leverage the common vdBench workload generator, with a scripting engine to automate and capture results over a large compute testing cluster. This allows us to repeat the same workloads across a wide range of storage devices, including flash arrays and individual storage devices.
Profiles:
- 4K Random Read: 100% Read, 128 threads, 0-120% iorate
- 4K Random Write: 100% Write, 64 threads, 0-120% iorate
- 64K Sequential Read: 100% Read, 16 threads, 0-120% iorate
- 64K Sequential Write: 100% Write, 8 threads, 0-120% iorate
- Synthetic Database: SQL and Oracle
- VDI Full Clone and Linked Clone Traces
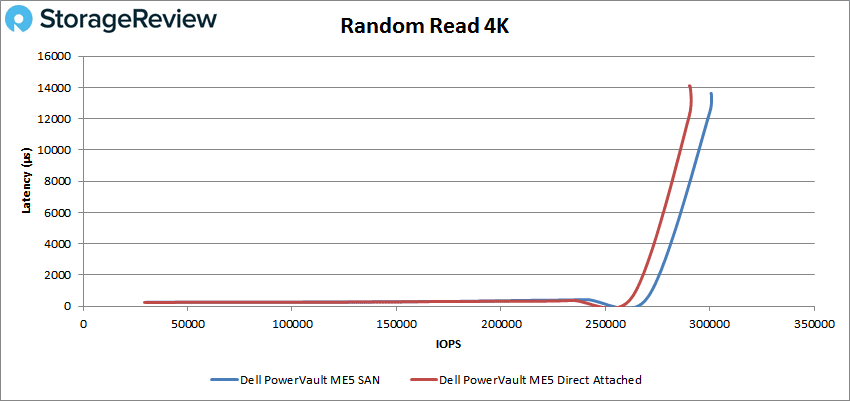
Throughout our tests, the performance for switched or switchless was close. You will notice from the graphs below that everything from latency, IOPs, and throughput were almost identical. Ultimately, the results speak for themselves when it comes to virtually any workload test we performed.
Starting with our four-corners workload (peak throughput and peak bandwidth), we looked at the small-block I/O saturation in a 4K random read workload. Here we saw both configurations of the PowerVault ME5 show strong sub-1ms latency up through 260k IOPS before peaking out at 300.6k IOPS and 290.5k IOPS for the SAN and Direct Attached configurations respectively.
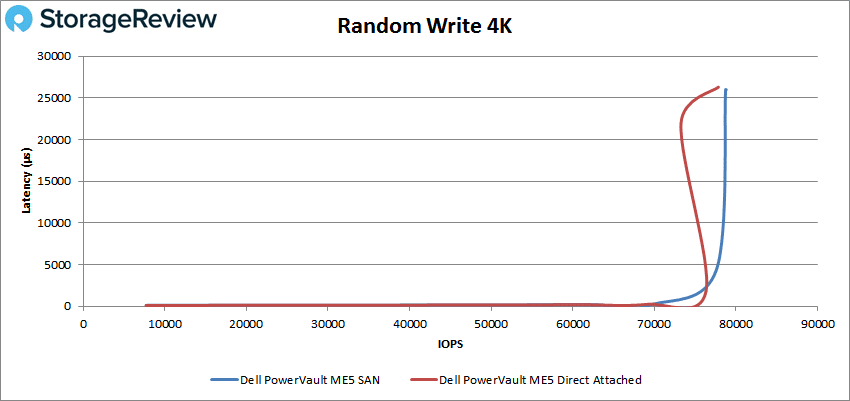
Moving to a 4K random write workload, the ME5 saw sub-1ms latency through 70k IOPS before it peaked at 78k IOPS in each configuration.
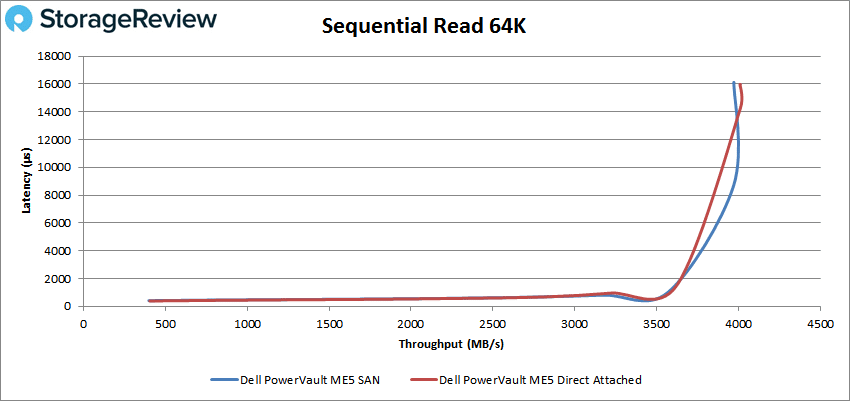
With our two SSDs in RAID1 configuration, as well as measuring the performance of data located inside that hot tier, we saw strong 64K read bandwidth topping out at 4GB/s from the ME5. With additional SSDs, especially a second pair to leverage the other controller, these figures would be much higher.
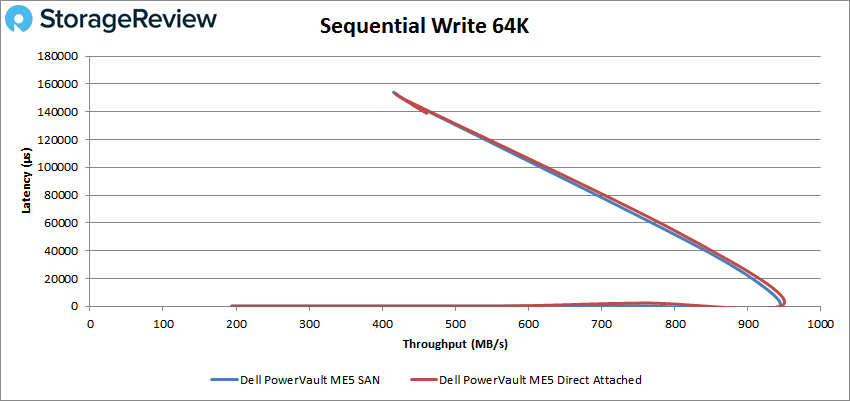
In our 64K sequential write workload, the write performance topped out at 950MB/s, which again is more of a limit of the number of SSDs installed in the unit, with a lot of upward potential based on how the system is configured.
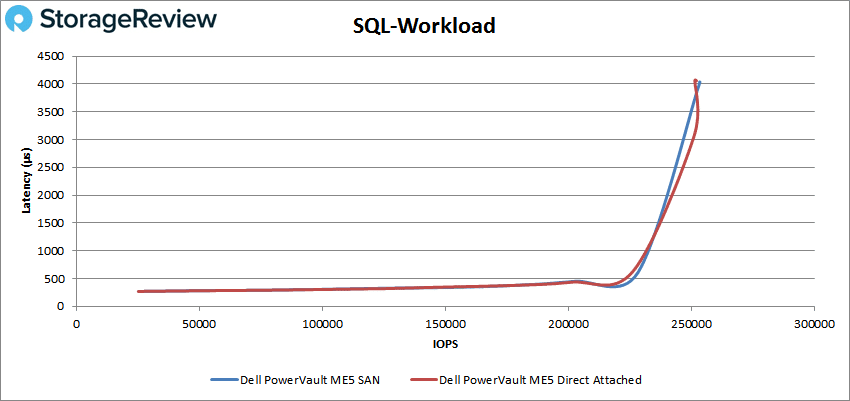
Our next set of tests cover three synthetic SQL workloads: SQL, SQL 90-10, and SQL 80-20. Starting with SQL, we saw both PowerVault ME5 configurations stay lockstep with one another up to 225k IOPS in sub-1ms latency, before topping out at 252k IOPS with a peak latency of 4.1ms.
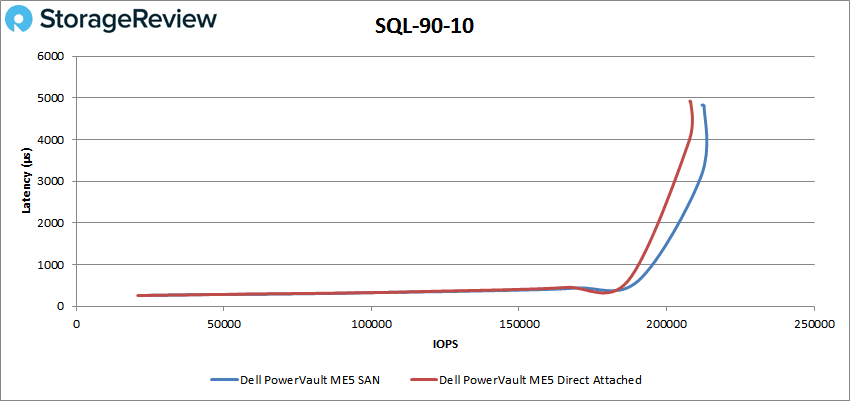
In our SQL 90-10 workload, the SAN-attached ME5 configuration had a very subtle lead, although for performance before the point of saturation, they were both very closely matched. Here we measured sub-ms performance up to 186k IOPS before topping out at 208k and 212k IOPS for the Direct Attached and SAN configurations respectively.
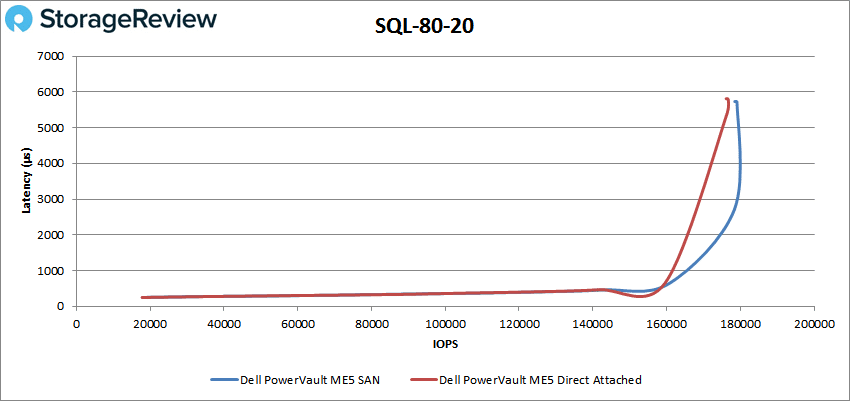
With a higher write percentage in the SQL 80-20 workload, we measured sub-ms performance up to 160k IOPS, before topping out at 176k and 179k IOPS for the Direct Attached and SAN configurations.
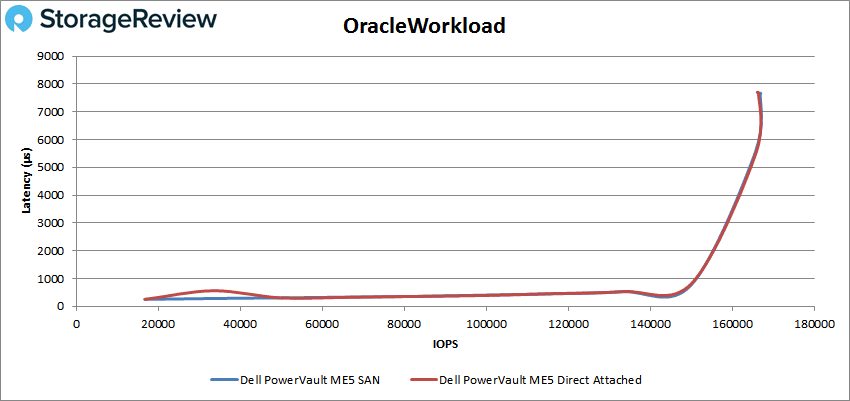
Next we have our synthetic Oracle workloads: Oracle, Oracle 90-10, and Oracle 80-20. In our first Oracle workload, both configurations performed identically, up to 150k IOPS before latency exceeded 1ms, and topped out at 166k IOPS.
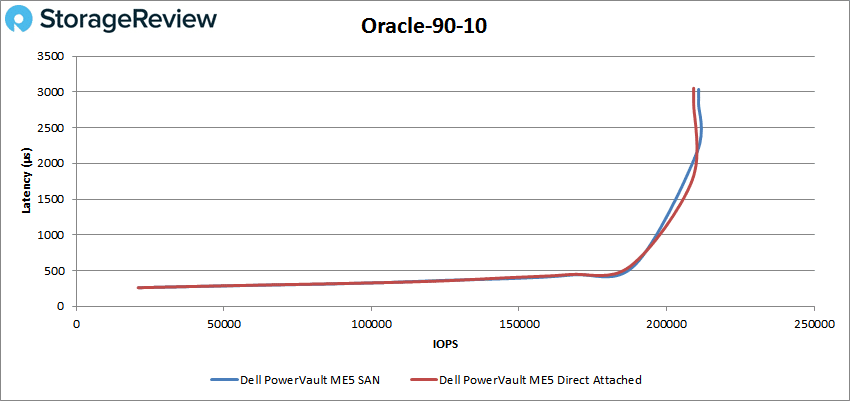
For our Oracle 90-10 workload, we measured sub-ms performance up to just below 200k IOPS, before each configuration peaked at 209k IOPS.
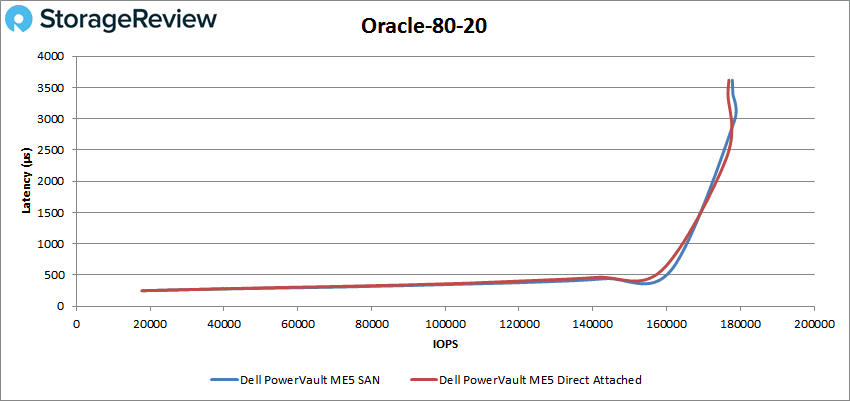
In our Oracle 80-20 workload, we measured sub-ms performance up through 161k IOPS before each configuration topped out at 177k IOPS.
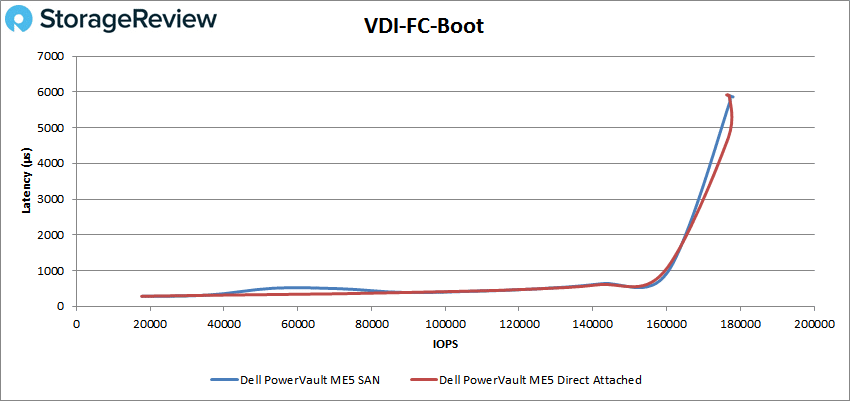
In our last section of benchmarks, we look at synthetic VDI performance measuring both Full Clone and Linked Clone scenarios. We start with Full Clone looking at Boot, Initial Login and Monday Login events. In Boot, both configurations stayed below 1ms up through 159k IOPS and offered peak performance of up to 177k IOPS.
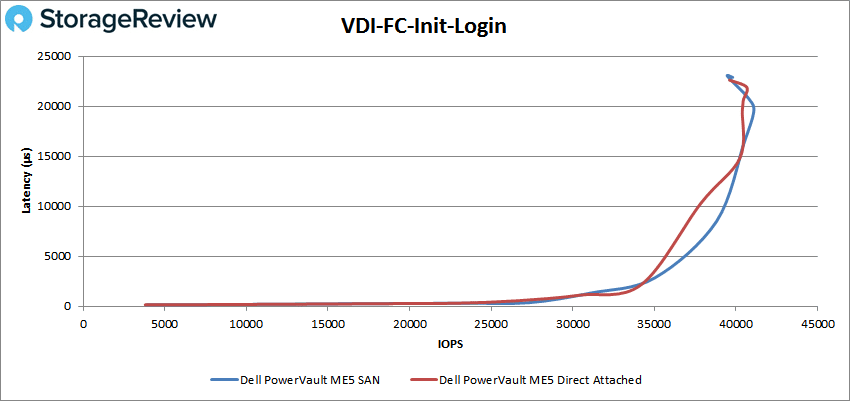
In the FC Initial Login workload, the PowerVault ME5 saw a sub-ms performance up to just under 30k IOPS before peaking out at 40.6k IOPS.
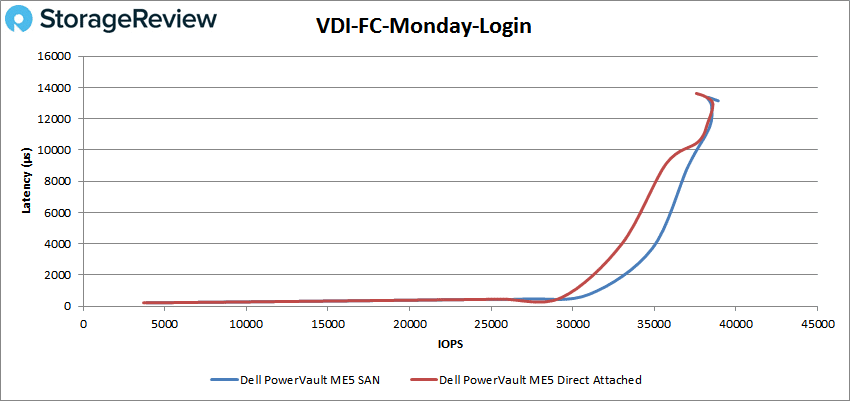
In our Monday Login workload, both the SAN and Direct Attached configuration offered sub-ms performance through 30k IOPS and both topped out at 38.5k IOPS.
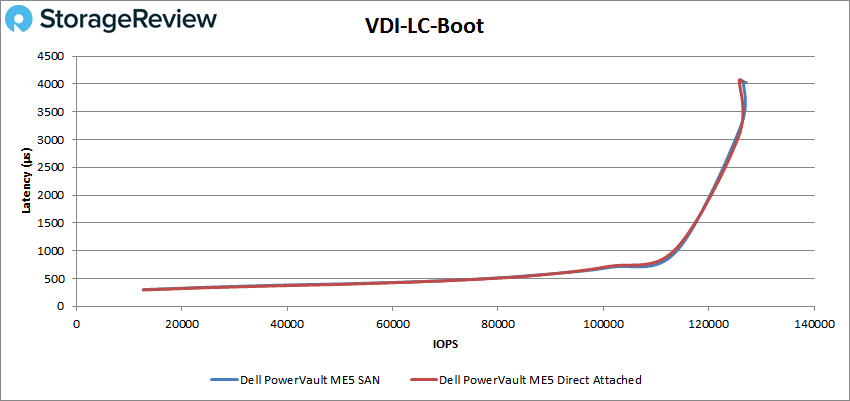
In our final group of synthetic tests, we look at Linked Clone VDI performance, starting with Boot performance. Here we saw both ME5 configurations again nearly identical. In terms of sub-ms performance, we measured up to 113k IOPS before ramping up to 126k IOPS.
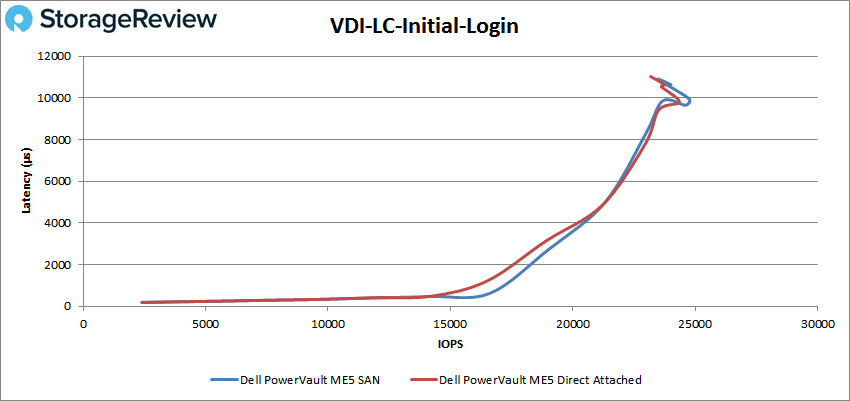
Switching to Initial Login, both configurations of the ME5 offered sub-ms performance up through 15k IOPS before peaking at 24.7k IOPS.
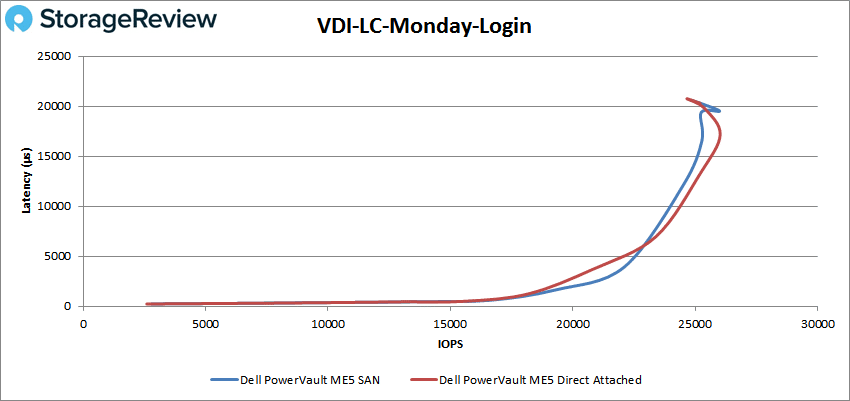
In our last test measuring Monday Login performance, both configurations kept latency below 1ms up through 17k IOPS and topped out at 26k IOPS.
Final Thoughts
When it comes to storage, small to medium businesses need strong performing, reliable and affordable storage arrays, not necessarily an array with a bunch of features that will never be turned on. This is the spot where platforms such as the Dell PowerVault ME5 come in, as an entry enterprise storage offering, with the speed and price point geared for most SMB/edge use cases. The ME5 knocks it out of the park on this front, with a sub-$12K starting price and a pricing model that allows businesses to build out as needed.
A big part of the pricing value comes from the all-inclusive software model. This helps to reduce OPEX and improve operational efficiencies while offering customers simplicity in deployment and management. Further, Dell’s support system and supply chain management make the ME5 Series a top candidate for a variety of use cases. One last thing to note, the ME5 brings substantive performance gains over the ME4, making it a worthy migration candidate for existing PowerVault users.
In terms of performance, the PowerVault ME5 is specified at offering up to 640k IOPS. Our tests revealed very respectable results for a storage platform in this market segment. While our configuration centered around an entry hybrid build with two SSDs and the remainder being HDDs, it still offered strong I/O performance for a number of workloads. We tested the performance in both a SAN configuration leveraging a dual 32Gb FC fabric, as well as a direct-attached approach more commonly seen in some edge locations.
Performance highlights include measuring 1 or 2ms of average latency in our SQL Server application workload and over 9,500TPS in our MySQL Sysbench workload across four VMs. In a four-corners workload, our two-SSD PowerVault ME5 topped 300k IOPS 4K random read and 78k IOPs 4K random write. Large-block sequential bandwidth in our 64K test measured 4GB/s read and 950MB/s write.
Overall, the ME5 knows its place in the market. The flexibility to start with HDDs and add SDDs for future growth and performance is a very positive aspect of the ME5. Should there be an application that can benefit from all-flash, it would be a simple task to create that environment with the ME5. The GUI is easy to understand and configure, and expansion options can take our review model up to 6.72PB, with future firmware upgrades allowing for growth to 8PB. Moreover, there’s a deep set of enterprise features. This complete package makes the ME5 an excellent option for SMBs, edge storage, or a number of other use cases where there’s a need for low-cost, fully-featured, reliable storage.
PowerVault ME5 Solution Best Practices
This report is sponsored by Dell Technologies All views and opinions expressed in this report are based on our unbiased view of the product(s) under consideration.


 Amazon