

We reviewed the Dell Precision 7875 once before, but that was a pre-production unit and we were limited to remote testing only. This time around we have the system in the lab, and after a few weeks of hands-on time with the system, the 7875 might be the ultimate workstation with a 96-core AMD Ryzen Threadripper Pro CPU and NVIDIA SLI-enabled graphics.
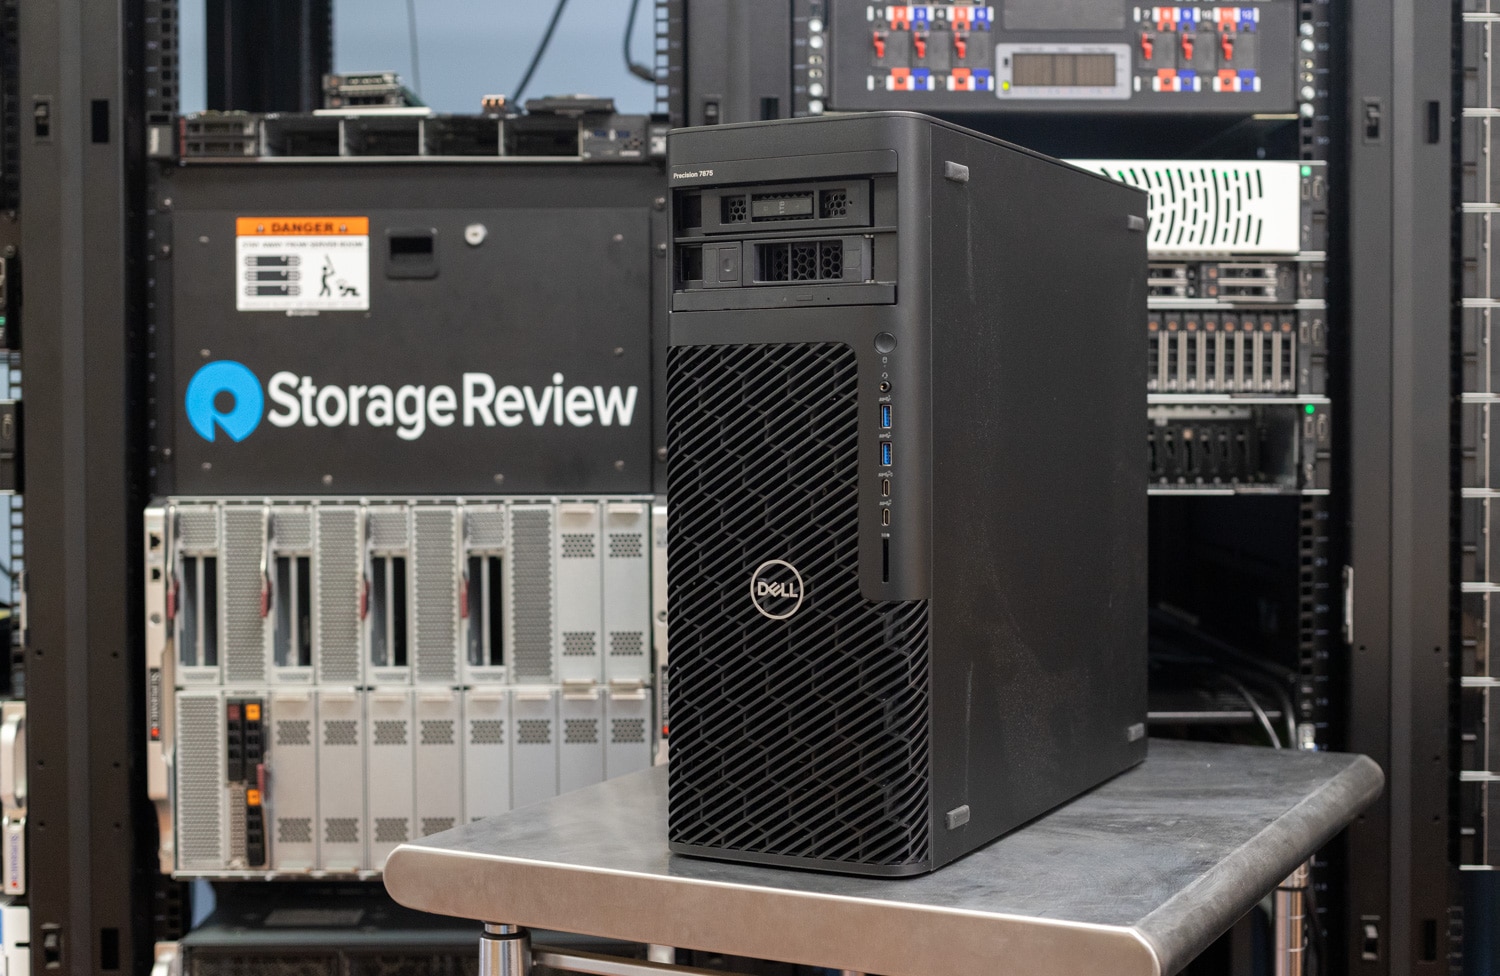
The Precision 7875 is Dell’s most powerful full-size workstation. Successor to the Precision 7865, it sports up to 96 CPU cores courtesy of AMD’s new Ryzen Threadripper Pro 7000 series.
The Precision 7875’s expansion capabilities include 2TB of DDR5 RAM, dual 300-watt GPUs, and 56TB of storage. Dell offers a variety of networking cards, and the workstation has many ISV certifications.
The full specifications of this tower are as follows:
| Processor | AMD Ryzen Threadripper Pro 7000WX series, 12 to 96 cores |
| Operating System | Windows 11, Ubuntu 22.04 |
| Power Supply | 1000 or 1350W |
| Memory | 16GB to 2TB DDR5-4800 ECC |
| Graphics | Up to two 300-watt AMD Radeon Pro W7600 or NVIDIA RTX 6000 Ada |
| Storage | Up to 56TB |
| Optical Drive | Optional half-height |
| Networking | Optional wireless; Intel X710 10GbE |
| Dimensions (HWD) | 17.6 x 7 x 19.2 inches |
| Weight | 56 pounds |
Dell Precision 7875 Build and Design
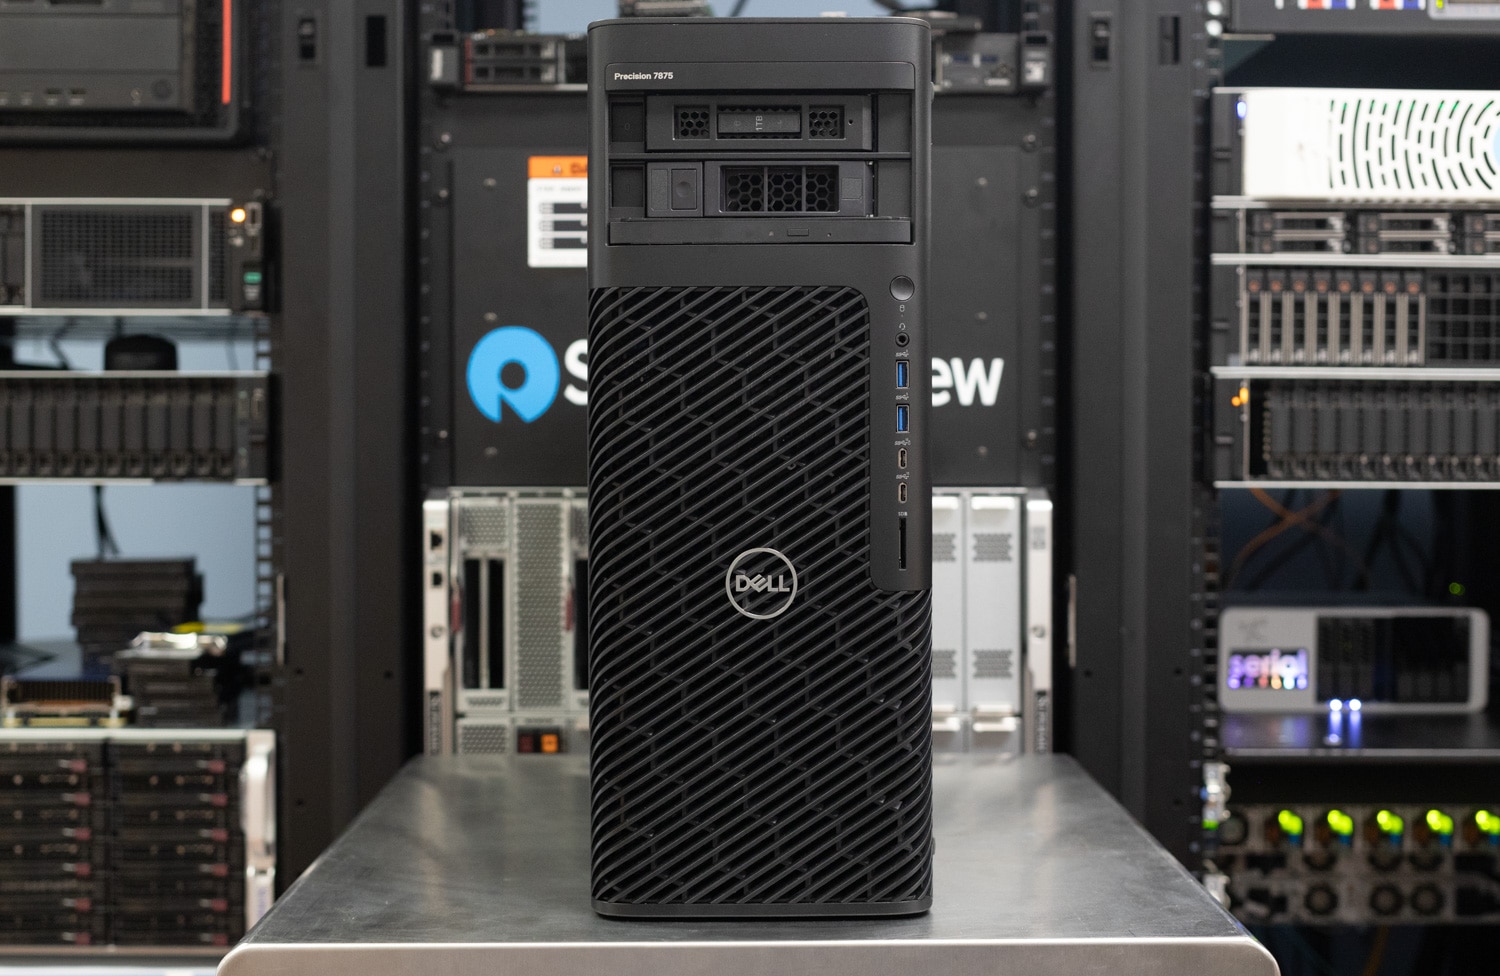
The Precision 7875 is larger than the Precision 7865, at 17.6 x 7 x 19.2 inches (HWD) and weighing up to 56 pounds. It can operate upright, on its side, or in a rack with the optional rackmount kit.
Most of the tower is metal, with a large plastic airflow grate on the front. Front buttons and ports include the power button, a hard drive activity light, a 3.5mm universal audio jack, two 5Gbps USB-A ports, two 10Gbps USB-C ports (one with power share), and an SD card reader.
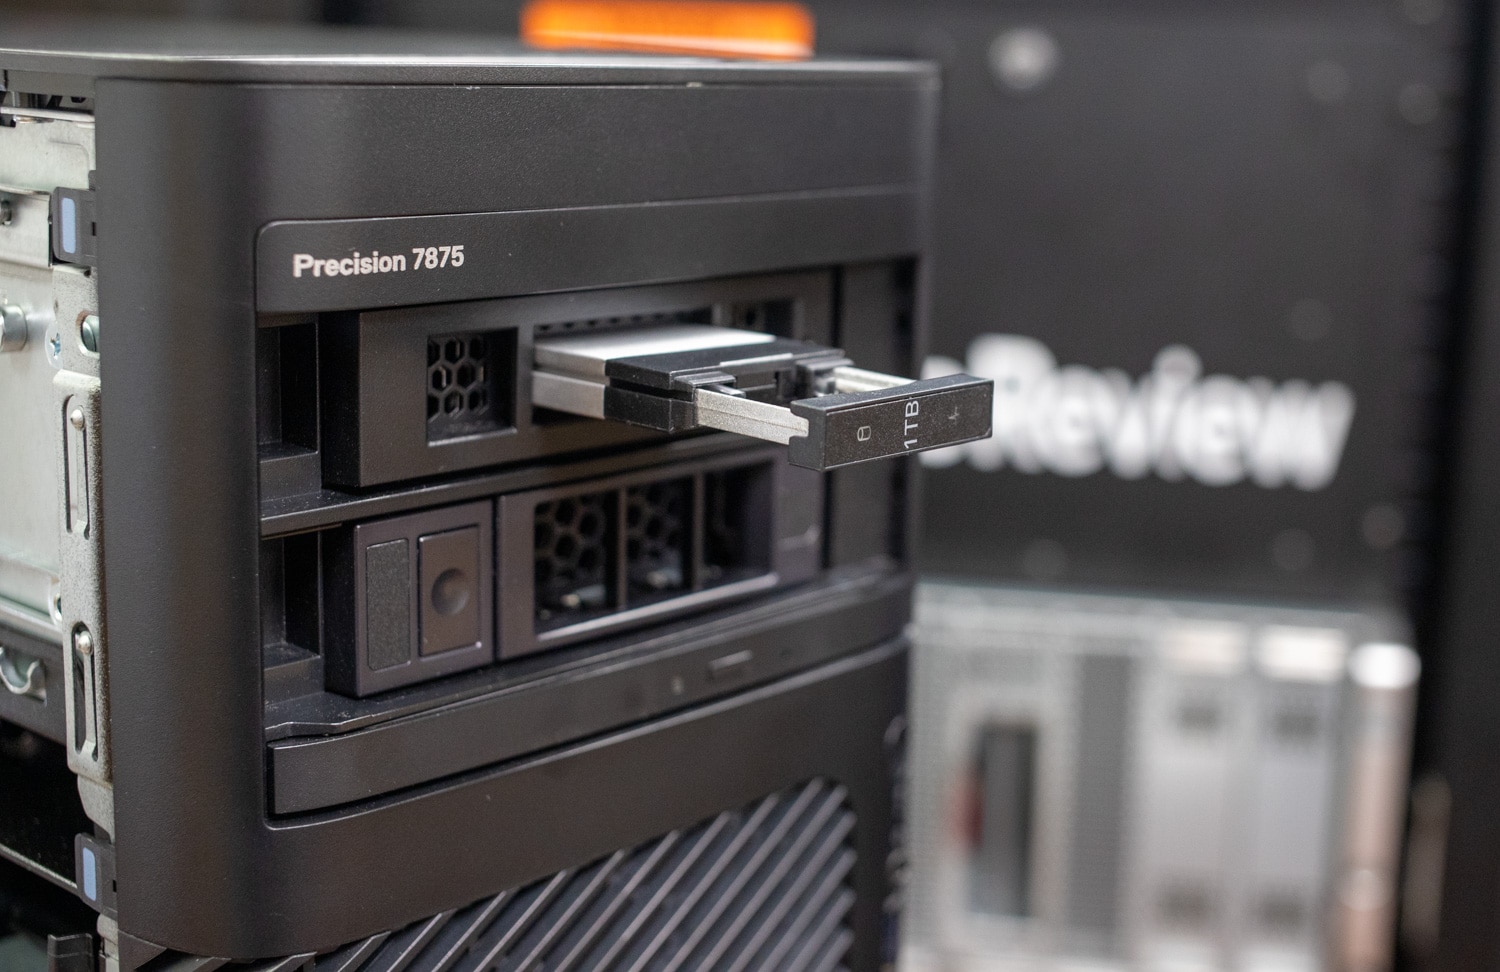
Our unit also has the front FlexBay, with two swappable M.2 drive caddies. This is highly convenient in secure organizations; drives with sensitive information can be swapped during the day and removed and secured afterward. Of course, here on StorageReview, we’d love to see more Enterprise-focused external drive options, such as U.2, or even better, any of the EDSFF form factors.
Moving around the back, ports here include audio line-out, 1GbE, and 10GbE Ethernet jacks, three 10Gbps USB-C ports, and three 5Gbps USB-A ports (one with Smart Power On). There is a spot for an optional Serial port. Dell offers many expansion cards if you want to add faster networking.
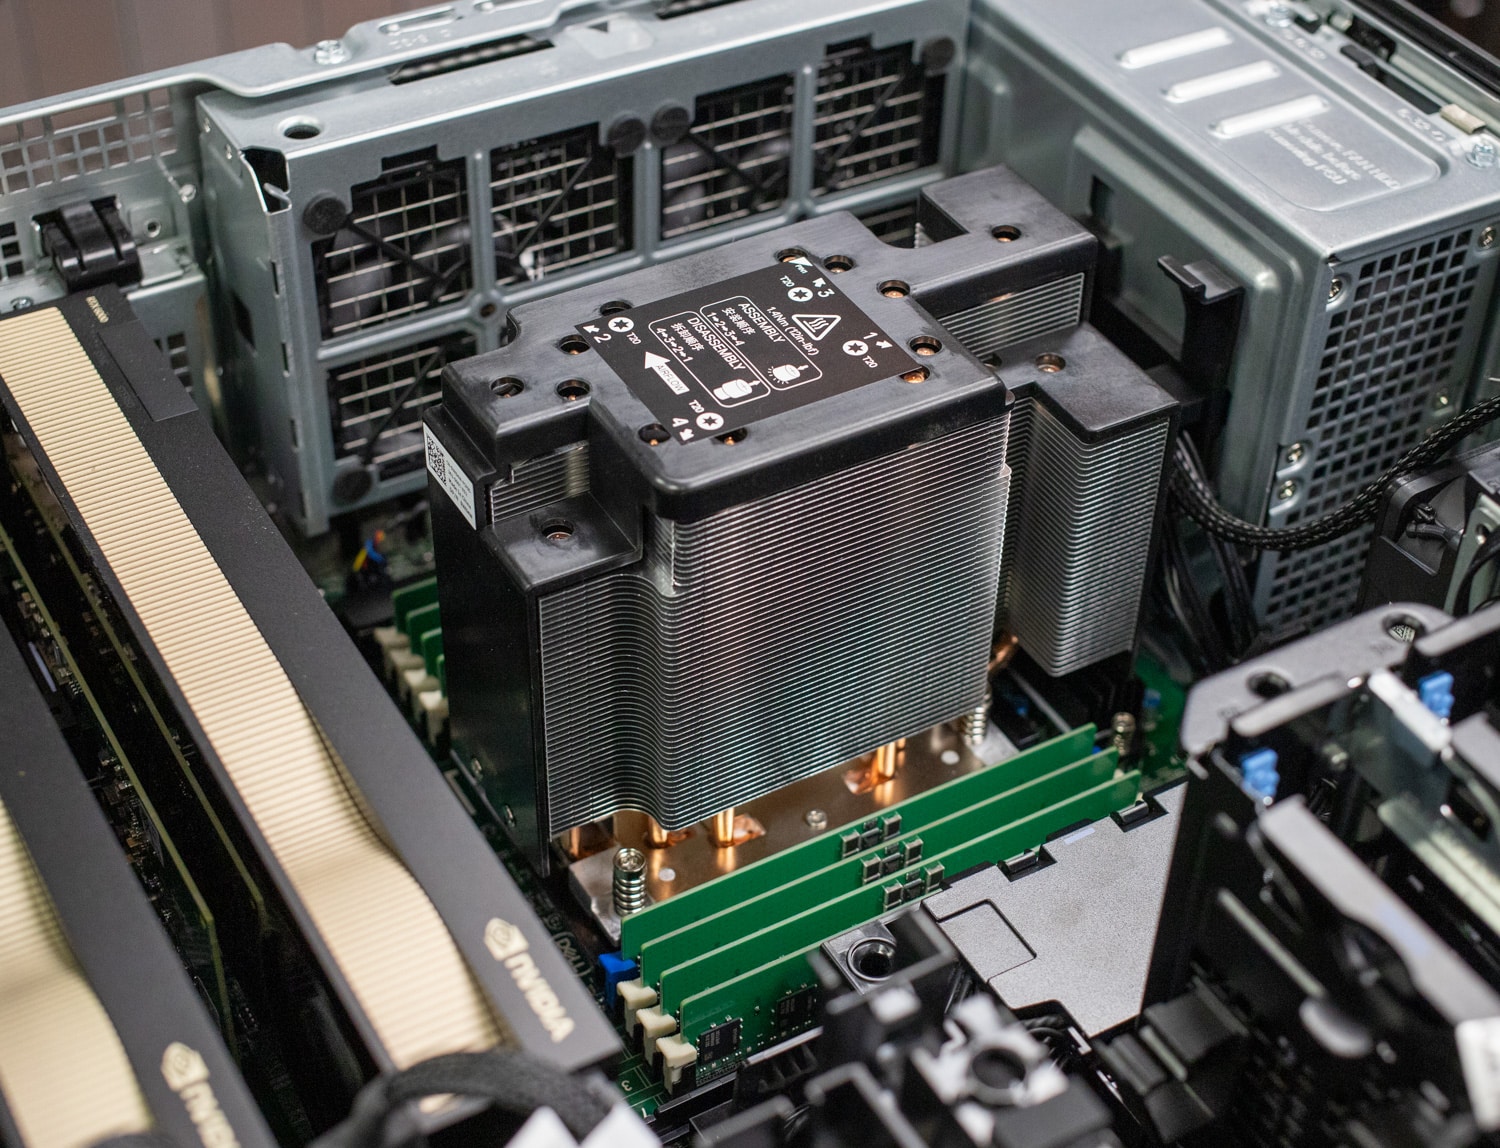
Dell makes it easy to get inside via the removable side door; it can be secured via cable and padlock and has an intrusion detection sensor. Initially, all you’ll see is the massive airflow guide over the CPU and RAM. Anything in blue is where you can place your hands to remove the part. Removing the airflow guide requires pinching the center and then lifting it out.
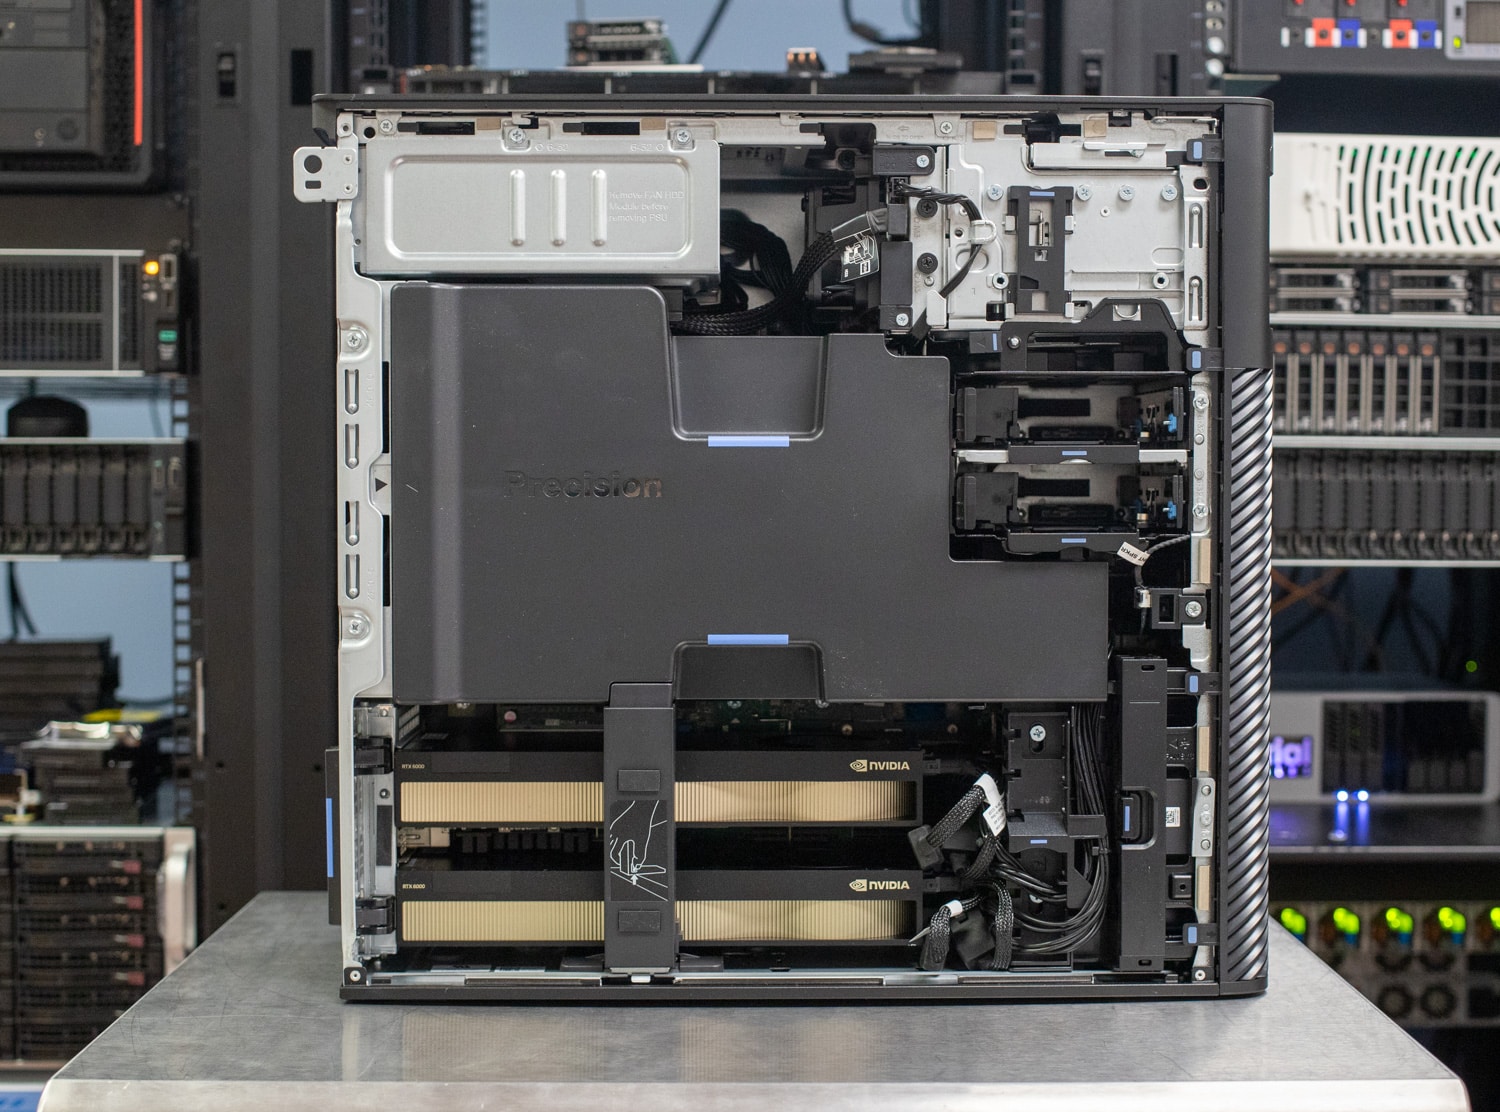
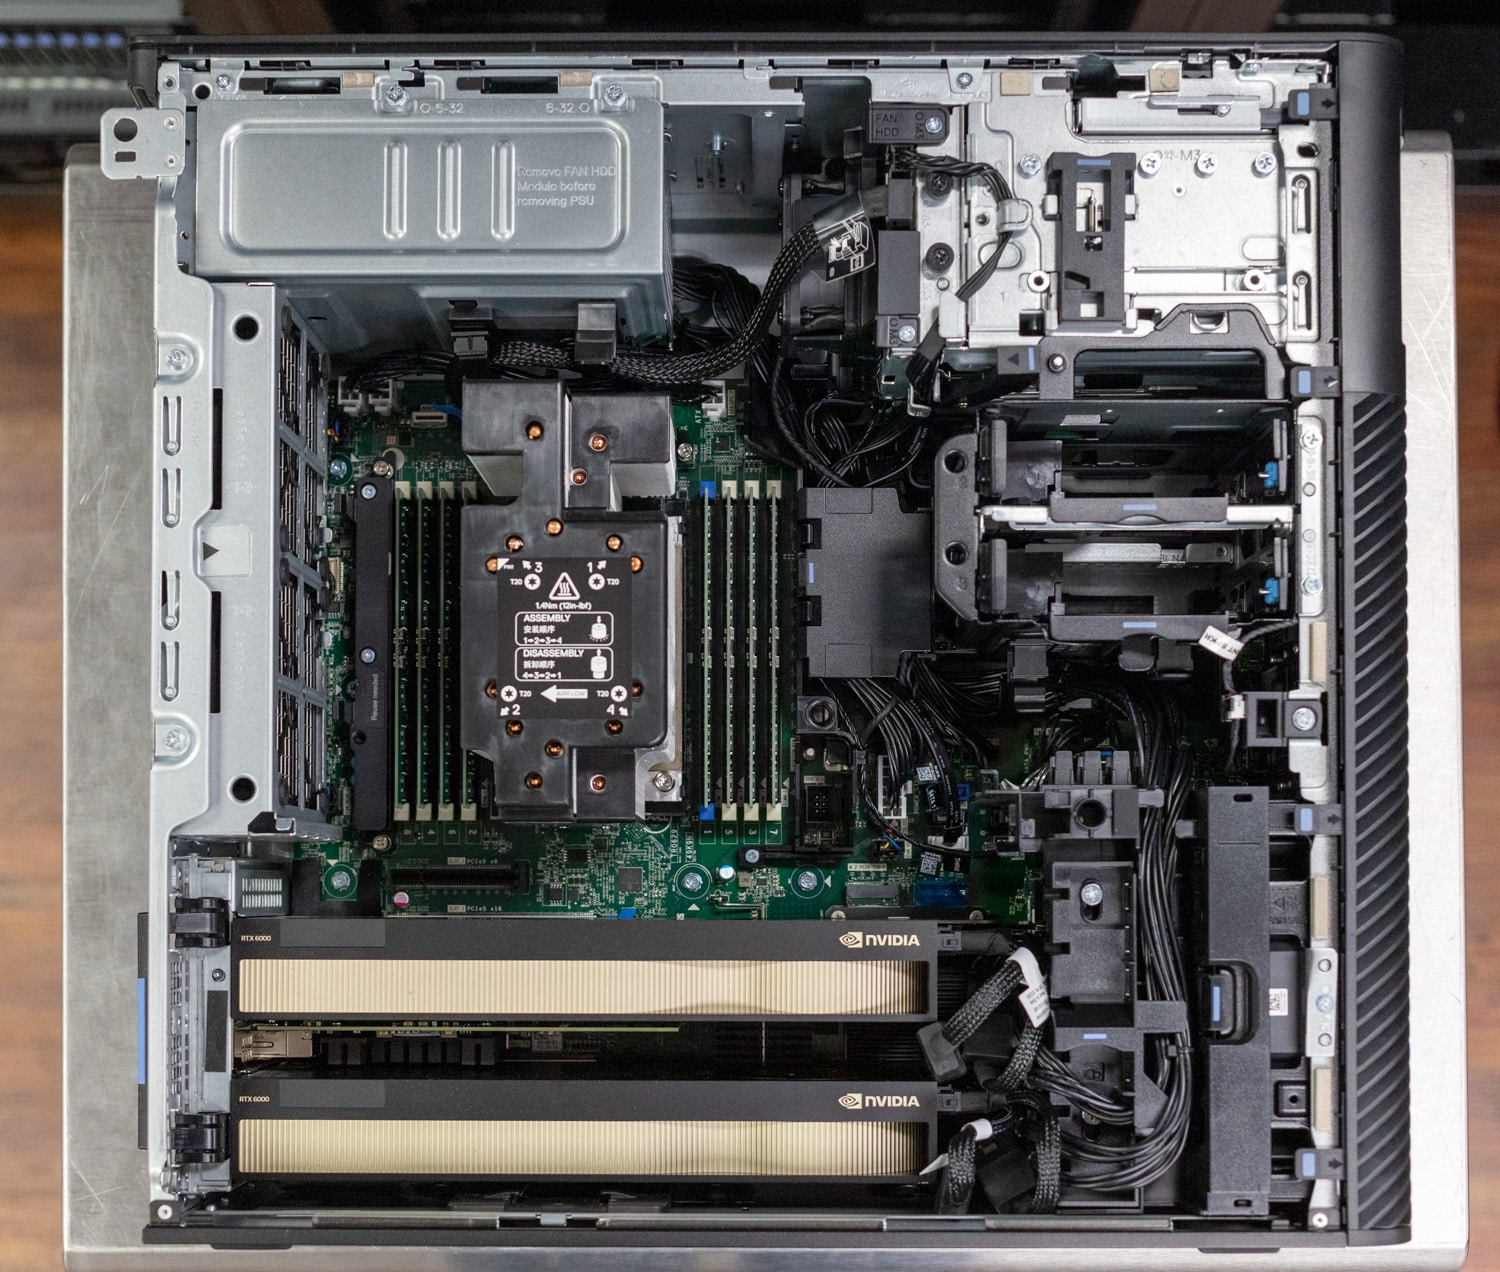
Like most high-end workstations, the Precision 7875 cools its CPU with a massive air cooler. The colorful copper heat pipes are clearly visible. Our review unit’s eight RDIMM RAM configuration maximized the Ryzen Threadripper Pro’s eight memory channels. This photo also shows the two rear exhaust fans.
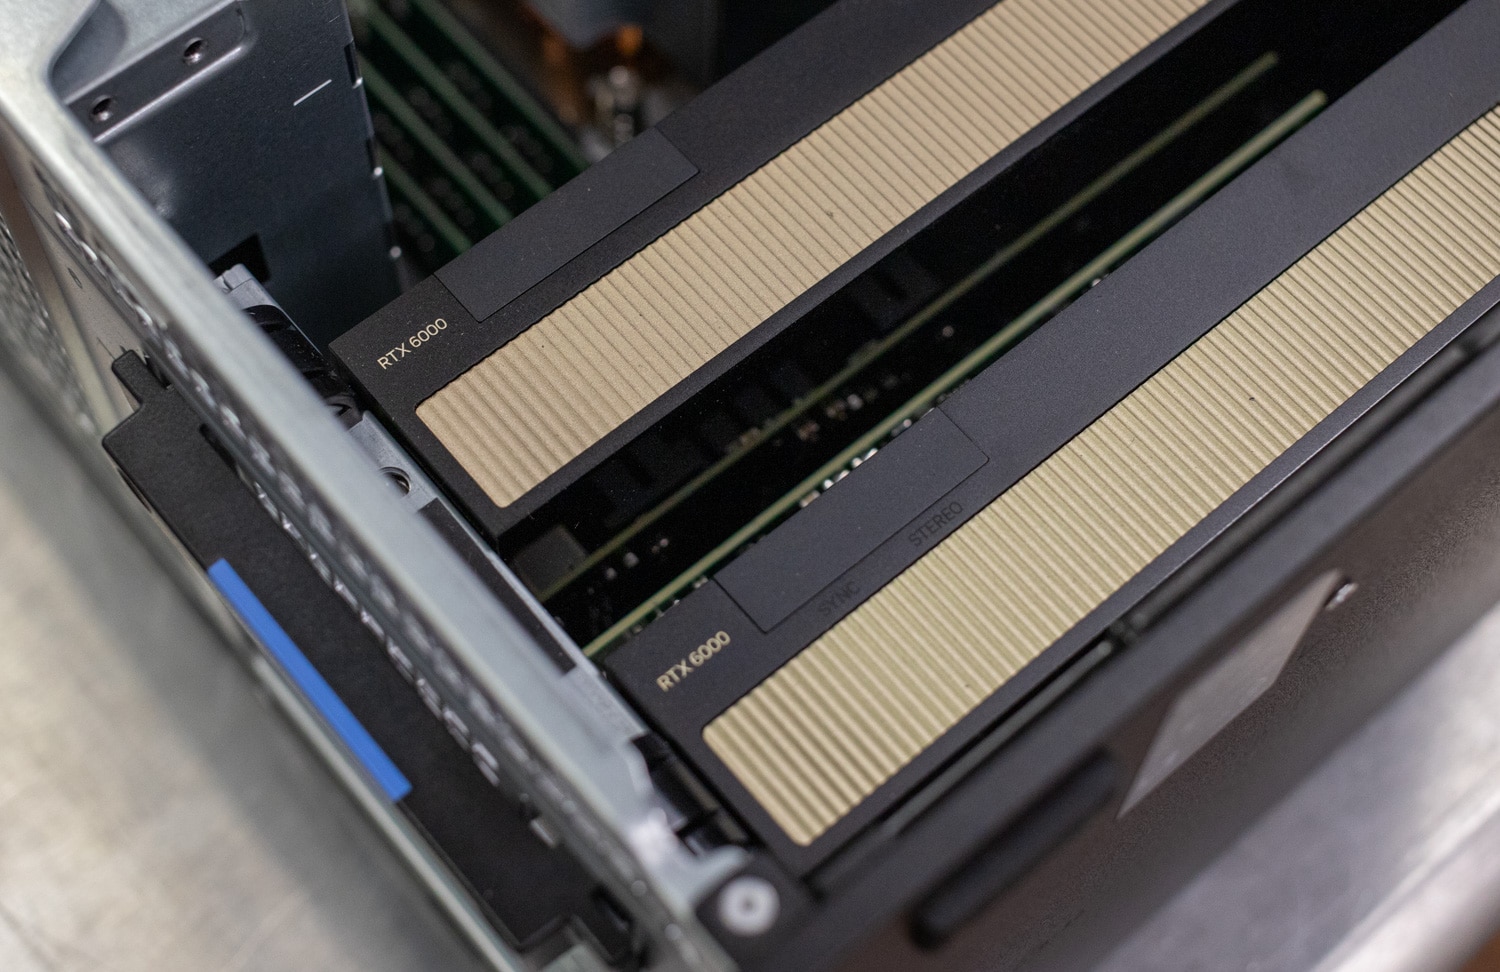
Our unit maxes out the Precision 7875’s graphics card capabilities with its twin NVIDIA RTX 6000 Ada Generation cards, each double-wide. They use a blower-style cooler, and there’s plenty of space between them for airflow.
Dell Precision 7875 Performance
Our Precision 7875 has the following specifications:
- AMD Ryzen Threadripper Pro 7995WX (96 cores/192 threads)
- Windows 11 Pro
- 1350W chassis
- 128GB (8x 16GB) DDR5-4800 RAM
- 2x NVIDIA RTX 6000 Ada 48GB GDDR6
- 2x 1TB M.2 SSD RAID 0
- 8X 9.5mm optical drive
The base price of this model is about $5,069; this configuration exceeds $31,000. That’s just the Dell.com price, though; Dell says only 1 percent of its workstations are sold there. Enterprises will want to contact their business reps for a better price, especially if they buy bulk units.
Our first comparison system is the HP Z6 G5 A with the same CPU but “only” one RTX 6000 Ada. Our other system is the Dell Precision 7960 with a 56-core Intel Xeon w9-3945X and one RTX 6000 Ada. We will have benchmarks for the Precision 7875 with SLI enabled and disabled, so we should have good numbers to compare with both systems.
SPECworkstation 3
SPECworkstation3 specializes in benchmarks designed for testing all key aspects of workstation performance; it uses over 30 workloads to test CPU, graphics, I/O, and memory bandwidth. The workloads fall into broader categories such as Media and Entertainment, Financial Services, Product Development, Energy, Life Sciences, and General Operations. We will list the broad-category results for each instead of the individual workloads. The results are an average of all the individual workloads in each category.
We only have numbers for the Precision 7875 without SLI here and no numbers for the Precision 7960. The Precision 7875 is evenly matched with the HP overall, an expected result given they share most hardware components.
| SPECworkstation 3 (Higher is better) | Dell Precision 7875 (Threadripper Pro 7995WX, 2x RTX A6000, no SLI) | HP Z6 G5 A (Threadripper Pro 7995WX, RTX 6000 Ada) |
| Media and Entertainment | 9.35 | 9.4 |
| Product Development | 13.72 | 11.91 |
| Life Sciences | 14.14 | 16.21 |
| Financial Services | 26.7 | 29.32 |
| Energy | 20.11 | N/A |
| General Operations | 3.53 | 3.56 |
| GPU Compute | 9.97 | 10.99 |
SPECviewperf 2020
Our next test is SPECviewperf 2020, the worldwide standard for measuring graphics performance of professional applications under the OpenGL and Direct X application programming interfaces. The viewsets (or benchmarks) represent graphics content and behavior from actual applications, without having to install the applications themselves. The newest version of this benchmark went through major updates late last year, including new viewsets taken from traces of the latest versions of 3ds Max, Catia, Maya, and Solidworks applications. In addition, they added support within all viewsets for both 2K and 4K resolution displays.
The numbers were close between the non-SLI Precision 7875 and the Z6 G5 A, but the SLI Precision 7875 didn’t perform as well for some reason. The Precision 7960 kept up in the GPU-limited tests but fell behind in pure CPU grunt, its Xeon chip not quite measuring up to the Threadripper Pro.
| SPECviewperf2020 Viewsets (Higher is better) | Dell Precision 7875 (Threadripper Pro 7995WX, 2x RTX A6000, SLI) | Dell Precision 7875 (Threadripper Pro 7995WX, 2x RTX A6000, no SLI) | Dell Precision 7960 (Xeon w9-3495X, RTX 6000 Ada) | HP Z6 G5 A (Threadripper Pro 7995WX, RTX 6000 Ada) |
| 3dsmax-07 | 197.31 | 214.09 | 218.62 | 214.1 |
| Catia-06 | 121.38 | 137.02 | 114.68 | 138.21 |
| Creo-03 | 146.18 | 192.08 | 128.74 | 181.24 |
| Energy-03 | 78.44 | 83.94 | 84.46 | 87.03 |
| Maya-06 | 554.54 | 582.49 | 424.08 | 573.38 |
| Medical-03 | 126.46 | 129.63 | 74.16 | 131.97 |
| Snx-04 | N/A | 971.26 | 932.85 | 993.48 |
| Solidworks-05 | 285.54 | 300.02 | 299.69 | 301.27 |
Blender 4.0
Blender is an open-source 3D modeling application. This benchmark was run using the Blender Benchmark utility. The score is samples per minute, with higher being better.
The numbers were about even for all the units; this test doesn’t benefit from SLI, so Precision 7875’s second GPU didn’t affect its score. The Precision 7960 and the Z6 G5 A seemed to outpace the Precision 7875 here.
| Blender 4.0 (Samples per minute, Higher is better) | Dell Precision 7875 (Threadripper Pro 7995WX, 2x RTX A6000, SLI) | Dell Precision 7875 (Threadripper Pro 7995WX, 2x RTX A6000, no SLI) | Dell Precision 7960 (Xeon w9-3495X, RTX 6000 Ada) | HP Z6 G5 A (Threadripper Pro 7995WX, RTX 6000 Ada) |
| Monster | 5,846.4 | 5,869.7 | 6,709.2 | 6,753.6 |
| Junkshop | 2,671.3 | 2,663.4 | 3,165.5 | 3,155.86 |
| Classroom | 2,775.2 | 2,796.1 | 3,176.0 | 3,162.94 |
Luxmark
Another 3D benchmark we will look at is LuxMark, an OpenCL GPU benchmarking utility. The Precision 7875 dominated with its dual RTX 6000 Ada GPUs; disabling SLI didn’t cause its score to go down.
| Luxmark (Higher is better) | Dell Precision 7875 (Threadripper Pro 7995WX, 2x RTX A6000, SLI) | Dell Precision 7875 (Threadripper Pro 7995WX, 2x RTX A6000, no SLI) | Dell Precision 7960 (Xeon w9-3495X, RTX 6000 Ada) | HP Z6 G5 A (Threadripper Pro 7995WX, RTX 6000 Ada) |
| Hallbench | 65,508 | 64,135 | 31,731 | 32,102 |
| food | 28,635 | 28,977 | 13,471 | 14,530 |
ESRI
Next up is the Environmental Systems Research Institute (Esri) benchmark. Esri is a supplier of Geographic Information System (GIS) software. Esri’s Performance Team designed their PerfTool add-in scripts to launch the ArcGIS Pro automatically. This application uses a “ZoomToBookmarks” function to browse various predefined bookmarks and create a log file with all the key data points required to predict the user experience. The script automatically loops the bookmarks three times to account for caching (memory and disk cache). In other words, this benchmark simulates heavy graphical use that one might see through Esri’s ArcGIS Pro software.
The tests consist of three primary datasets. Two are 3-D city views of Philadelphia, PA, and Montreal, QC. These city views contain textured 3-D multipatch buildings draped on a terrain model and draped aerial images. The third dataset is a 2-D map view of the Portland, OR region. This data contains detailed information for roads, land use parcels, parks and schools, rivers, lakes, and hill-shaded terrain.
The GPU-limited Montreal and Philly models saw the HP and Dell finishing similarly, though the HP did better in the CPU-driven Portland model.
First up is the Montreal model.
| ESRI ArcGIS Pro 2.3 Montreal | |
| Average FPS | Average |
| Dell Precision 7875 (Threadripper Pro 7995WX, 2x RTX A6000, SLI) | 673.3 |
| Dell Precision 7875 (Threadripper Pro 7995WX, 2x RTX A6000, no SLI) | 744.5 |
| Dell Precision 7960 (Xeon w9-3495X, RTX 6000 Ada) | 809.9 |
| HP Z6 G5 A (Threadripper Pro 7995WX, RTX 6000 Ada) | 809.6 |
| Minimum FPS | Average |
| Dell Precision 7875 (Threadripper Pro 7995WX, 2x RTX A6000, SLI) | 219.3 |
| Dell Precision 7875 (Threadripper Pro 7995WX, 2x RTX A6000, no SLI) | 335.7 |
| Dell Precision 7960 (Xeon w9-3495X, RTX 6000 Ada) | 345.5 |
| HP Z6 G5 A (Threadripper Pro 7995WX, RTX 6000 Ada) | 352.8 |
Next up is Philly.
| ESRI ArcGIS Pro 2.3 Philly | |
| Average FPS | Average |
| Dell Precision 7875 (Threadripper Pro 7995WX, 2x RTX A6000, SLI) | 519.7 |
| Dell Precision 7875 (Threadripper Pro 7995WX, 2x RTX A6000, no SLI) | 566.3 |
| Dell Precision 7960 (Xeon w9-3495X, RTX 6000 Ada) | 603.8 |
| HP Z6 G5 A (Threadripper Pro 7995WX, RTX 6000 Ada) | 616.6 |
| Minimum FPS | Average |
| Dell Precision 7875 (Threadripper Pro 7995WX, 2x RTX A6000, SLI) | 145.7 |
| Dell Precision 7875 (Threadripper Pro 7995WX, 2x RTX A6000, no SLI) | 286.5 |
| Dell Precision 7960 (Xeon w9-3495X, RTX 6000 Ada) | 321.1 |
| HP Z6 G5 A (Threadripper Pro 7995WX, RTX 6000 Ada) | 318.1 |
Last is the Portland model.
| ESRI ArcGIS Pro 2.3 Portland | |
| Average FPS | Average |
| Dell Precision 7875 (Threadripper Pro 7995WX, 2x RTX A6000, SLI) | 2,095.1 |
| Dell Precision 7875 (Threadripper Pro 7995WX, 2x RTX A6000, no SLI) | 2,438.1 |
| Dell Precision 7960 (Xeon w9-3495X, RTX 6000 Ada) | 2,172.2 |
| HP Z6 G5 A (Threadripper Pro 7995WX, RTX 6000 Ada) | 2,449.9 |
| Minimum FPS | Average |
| Dell Precision 7875 (Threadripper Pro 7995WX, 2x RTX A6000, SLI) | 1,028.0 |
| Dell Precision 7875 (Threadripper Pro 7995WX, 2x RTX A6000, no SLI) | 1,498.3 |
| Dell Precision 7960 (Xeon w9-3495X, RTX 6000 Ada) | 1,270.4 |
| HP Z6 G5 A (Threadripper Pro 7995WX, RTX 6000 Ada) | 1,179.1 |
OctaneBench
Next, we look at OctaneBench, a benchmarking utility for OctaneRender, another 3D renderer with RTX support similar to V-Ray. The Precision 7875 scored similarly with and without SLI and easily dominated the single-GPU Precision 7960 and Z6 G5 A.
| OctaneBench (Score, higher is better) | Kernel | Dell Precision 7875 (Threadripper Pro 7995WX, 2x RTX A6000, SLI) | Dell Precision 7875 (Threadripper Pro 7995WX, 2x RTX A6000, no SLI) | Dell Precision 7960 (Xeon w9-3495X, RTX 6000 Ada) | HP Z6 G5 A (Threadripper Pro 7995WX, RTX 6000 Ada) |
| Interior | Info channels | 89.37 | 90.40 | 42.64 | 45.22 |
| Interior | Direct lighting | 262.52 | 265.06 | 125.49 | 133.27 |
| Interior | Path tracing | 326.78 | 327.70 | 156.94 | 165.17 |
| Idea | Info channels | 53.65 | 53.88 | 24.40 | 27.06 |
| Idea | Direct lighting | 209.62 | 209.16 | 99.20 | 105.30 |
| Idea | Path tracing | 250.09 | 249.70 | 118.34 | 125.42 |
| ATV | Info channels | 138.54 | 141.04 | 67.51 | 70.72 |
| ATV | Direct lighting | 263.68 | 263.93 | 127.96 | 132.51 |
| ATV | Path tracing | 332.49 | 333.54 | 161.16 | 167.51 |
| Box | Info channels | 71.79 | 73.29 | 34.24 | 36.43 |
| Box | Direct lighting | 247.57 | 248.17 | 119.04 | 124.41 |
| Box | Path tracing | 269.89 | 269.98 | 130.36 | 135.52 |
Blackmagic RAW Speed Test
We have also started running Blackmagic’s RAW speed test, which tests video playback. This is another test that takes advantage of multiple GPUs, so the Precision 7875 had no competition.
| Blackmagic RAW Speed Test (Higher is better) | Dell Precision 7875 (Threadripper Pro 7995WX, 2x RTX A6000, SLI) | Dell Precision 7875 (Threadripper Pro 7995WX, 2x RTX A6000, no SLI) | Dell Precision 7960 (Xeon w9-3495X, RTX 6000 Ada) | HP Z6 G5 A (Threadripper Pro 7995WX, RTX 6000 Ada) |
| 8K CPU | 142 fps | 146 fps | 124 fps | 143 fps |
| 8K CUDA | 301 fps | 323 fps | 194 fps | 182 fps |
7-Zip Compression
The built-in memory benchmark in the popular 7-Zip utility is our next test. The Precision 7875 showed excellent numbers in this test, usually beating out the HP and crushing the Precision 7960.
| 7-Zip Compression Benchmark (Higher is better) | Dell Precision 7875 (Threadripper Pro 7995WX, 2x RTX A6000) | HP Z6 G5 A (Threadripper Pro 7995WX, RTX 6000 Ada) | Dell Precision 7960 (Xeon w9-3495X, RTX 6000 Ada) |
| Current CPU Usage | 3,302% | 3,321% | 3,279% |
| Current Rating/Usage | 9.963 GIPS | 9.752 GIPS | 6.917 GIPS |
| Current Rating | 329.003 GIPS | 323.905 GIPS | 226.810 GIPS |
| Resulting CPU Usage | 3,304% | 3,321% | 3,316% |
| Resulting Rating/Usage | 10.088 GIPS | 9.714 GIPS | 6.934 GIPS |
| Resulting Rating | 333.278 GIPS | 322.627 GIPS | 229.905 GIPS |
| Decompressing | |||
| Current CPU Usage | 6,095% | 6,113% | 6,106% |
| Current Rating/Usage | 6.080 GIPS | 5.784 GIPS | 3.760 GIPS |
| Current Rating | 370.569 GIPS | 353.596 GIPS | 229.591 GIPS |
| Resulting CPU Usage | 6,115% | 6,121% | 5,860% |
| Resulting Rating/Usage | 5.987 GIPS | 5.724 GIPS | 2.954 GIPS |
| Resulting Rating | 366.096 GIPS | 350.375 GIPS | 231.485 GIPS |
| Total Rating | |||
| Total CPU Usage | 4,710% | 4,721% | 4,588% |
| Total Rating/Usage | 8.037 GIPS | 7.719 GIPS | 5.444 GIPS |
| Total Rating | 349.687 GIPS | 336.501 GIPS | 230.695 GIPS |
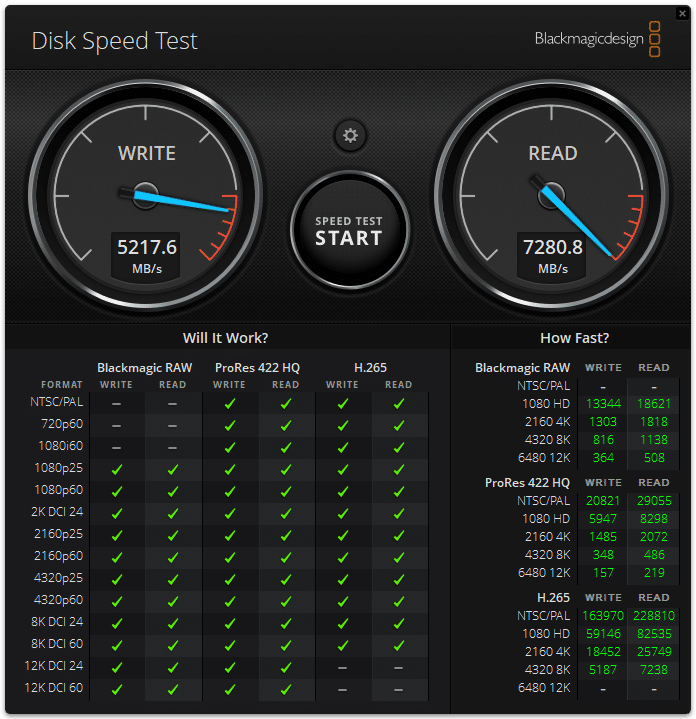
Blackmagic Disk Speed Test
We run the popular Blackmagic Disk Speed Test against the system’s primary storage drive.
UL Procyon AI Inference
UL’s Procyon estimates a workstation’s performance for professional apps. The numbers indicate this testing runs much slower on the CPU, but Dell’s Xeon chip often proved faster, especially in the Real-ESRGAN subtest.
| UL Procyon Average Inference Times (Lower is better) | Dell Precision 7875 (RTX 6000 Ada SLI) – Tensor RT | Dell Precision 7875 (RTX 6000 Ada SLI) – Windows ML | Dell Precision 7875 (Threadripper Pro 7995WX) | HP Z6 G5 A (RTX 6000 Ada) – Tensor RT | HP Z6 G5 A (RTX 6000 Ada) – Windows ML | HP Z6 G5 A (Threadripper Pro 7995WX) |
| MobileNet V3 | 0.45 | 0.50 | 3.47 | 0.42 | 0.51 | 3.57 |
| ResNet 50 | 1.02 | 0.92 | 6.57 | 1.06 | 0.94 | 6.25 |
| Inception V4 | 3.43 | 2.31 | 24.99 | 3.37 | 2.28 | 25.43 |
| DeepLab V3 | 2.54 | 10.72 | 24.23 | 2.78 | 13.46 | 25.25 |
| YOLO V3 | 2.75 | 4.22 | 32.68 | 2.71 | 4.04 | 33.37 |
| Real-ESRGAN | 92.70 | 95.62 | 557.17 | 83.80 | 85.73 | 2,891.39 |
| Overall Score | 1,579 | 1,227 | 154 | 1,597 | 1,204 | 149 |
y-cruncher
y-cruncher is a multi-threaded and scalable program that can compute Pi and other mathematical constants to trillions of digits. Since its launch in 2009, it has become a popular benchmarking and stress-testing application for overclockers and hardware enthusiasts. The Precision 7875 proved faster than the HP in the longer-running 2.5 and 10-billion-digit tests.
| y-cruncher (Total Computation time) | Dell Precision 7875 (Threadripper Pro 7995WX) | Dell Precision 7960 (Xeon w9-3495X) | HP Z6 G5 A (Threadripper Pro 7995WX) |
| 1 billion digits | 8.599 seconds | 12.788 seconds | 8.436 seconds |
| 2.5 billion digits | 17.803 seconds | 34.459 seconds | 18.835 seconds |
| 10 billion digits | 70.594 seconds | 157.770 seconds | 72.856 seconds |
Geekbench 6
Geekbench 6 is a cross-platform benchmark that measures overall system performance. You can find comparisons to any system you want in the Geekbench Browser. The Precision 7875 trailed in the GPU test, which didn’t appear to respond to its SLI GPUs, but it kept pace with the HP in the CPU tests.
| Geekbench 6 (Higher is better) | Dell Precision 7875 (Threadripper Pro 7995WX, 2x RTX 6000 Ada, SLI) | Dell Precision 7960 (Xeon w9-3495X, RTX 6000 Ada) | HP Z6 G5 A (Threadripper Pro 7995WX, RTX 6000 Ada) |
| CPU Single-Core | 2,673 | 2,302 | 2,655 |
| CPU Multi-Core | 24,521 | 18,157 | 24,519 |
| GPU | 293,824 | 303,158 | 319,290 |
Cinebench R23
This benchmark uses all CPU cores and threads to generate an overall score. The single-core results were close across the board, but the Precision 7875 and the Z6 G5 A dominated multi-core, the latter scoring a few hundred points higher to crest the magical 100,000-point threshold.
| Cinebench R23 (Higher is better) | Dell Precision 7875 (Threadripper Pro 7995WX, 2x RTX 6000 Ada, SLI) | Dell Precision 7960 (Xeon w9-3495X, RTX 6000 Ada) | HP Z6 G5 A (Threadripper Pro 7995WX, RTX 6000 Ada) |
| Multi-Core | 96,501 | 58,774 | 100,562 |
| Single-Core | 1,761 | 1,689 | 1,709 |
Cinebench 2024
We also started running the latest Cinebench test. SLI GPUs helped the Precision 7875’s GPU score tremendously.
| Cinebench R23 (Higher is better) | Dell Precision 7875 (Threadripper Pro 7995WX, 2x RTX 6000 Ada, SLI) | HP Z6 G5 A (Threadripper Pro 7995WX, RTX 6000 Ada) |
| Multi-Core | 5,501 | 5,683 |
| Single-Core | 107 | 102 |
| GPU | 56,480 | 31,457 |
Conclusion
Dell’s Precision 7875 is a highly impressive high-end workstation. There’s no workload too large for this monster, with an AMD Ryzen Threadripper Pro 7000WX series CPU, dual 300-watt professional GPUs, 2TB of RAM, and 56TB of possible storage (officially supported).
The 96-core CPU and dual NVIDIA RTX 6000 Ada graphics cards in our review unit made it very competitive with the HP Z6 G5 A, and it dominated Dell’s own Precision 7960 workstation with a 56-core Xeon. The Dell Precision 7875 also offers the excellent serviceability we’ve come to expect from this line.
Overall the Precision 7875 is one of our favorite high-end workstations that can be equipped to handle the most demanding desktop AI or Creative Pro applications. What’s even better, with efficient fan profiles that move only the air that’s required to cool these components, the system is good at preventing excess noise.


 Amazon