

|
 Whatever the case, we’ve witnessed relatively little buzz about Fujitsu’s MAP3147. Like Seagate’s Cheetah 10K.6, the MAP combines up to four 36-gigabyte platters to yield a flagship capacity of 147 GB in a low-profile chassis. Fujitsu specifies the drive’s seek time at a speedy 4.5 milliseconds. An eight-megabyte buffer rounds out the vital specs.
In an interesting move, Fujitsu has deployed fluid dynamic bearing (FDB) motors in the family’s 147 GB flagship but sticks with traditional ball-bearing motors in the smaller members. This may result in the higher platter-count drive featuring an idle noise floor lower than that of the other models.
There’s been some buzz both here at SR as well as on other sites about a defective third-party chip on Fujitsu PCBs that supposedly moved the company to issue a recall. The problem only afflicts the firm’s ATA models; SCSI units are unaffected. Fujitsu (coincidentally?) withdrew from the ruthless ATA market some time ago with the 20 GB/platter MPG series as the manufacturer’s final release. The MAP line is backed by an enterprise-standard 5-year warranty.
 The MAP is one of the first Ultra320 SCSI drives to hit our testbed. Ultra320’s most highly-touted feature is, of course, an increase in the throughput ceiling to 320 MB/sec. Keep in mind that the current transfer rate champion, Seagate’s Cheetah 15K.3, pushes 76 MB/sec in its outer sectors. While figures like these threaten Ultra2 SCSI’s 80 MB/sec barrier, Ultra160’s 160 MB/sec limit maintains plenty of headroom. It is only in multi-drive scenarios that 160 MB/sec bottlenecks arise. Our base drive tests occur with a single unit as the only active device on the host adapter. In such a setup, any performance advantages that Ultra320 (along with the requisite higher-bandwidth 64-bit PCI slots) would deliver over 160 are negligible. For our performance tests, we’re going to take advantage of the specification’s backwards compatibility and run the drive in Ultra160 mode off of our current host adapter. Bear in mind that improved bandwidth is only one of the benefits that Ultra320 delivers. A host of improvements in protocol and error correction should elevate data integrity and device interoperability to new levels.
Low-Level ResultsFor diagnostic purposes only, StorageReview measures the following low-level parameters: Average Read Access Time– An average of 25,000 random accesses of a single sector each conducted through IPEAK SPT’s AnalyzeDisk suite. The high sample size permits a much more accurate reading than most typical benchmarks deliver and provides an excellent figure with which one may contrast the claimed access time (claimed seek time + the drive spindle speed’s average rotational latency) provided by manufacturers. WB99 Disk/Read Transfer Rate – Begin– The sequential transfer rate attained by the outermost zones in the hard disk. The figure typically represents the highest sustained transfer rate a drive delivers. WB99 Disk/Read Transfer Rate – End– The sequential transfer rate attained by the innermost zones in the hard disk. The figure typically represents the lowest sustained transfer rate a drive delivers. |
For more information, please click here.
|
Note: Scores on top are better. |
|
|||||||||||||||||||||||||||||||||
|
|
||||||||||||||||||||||||||||||||
MAP3147 Average Read Service Time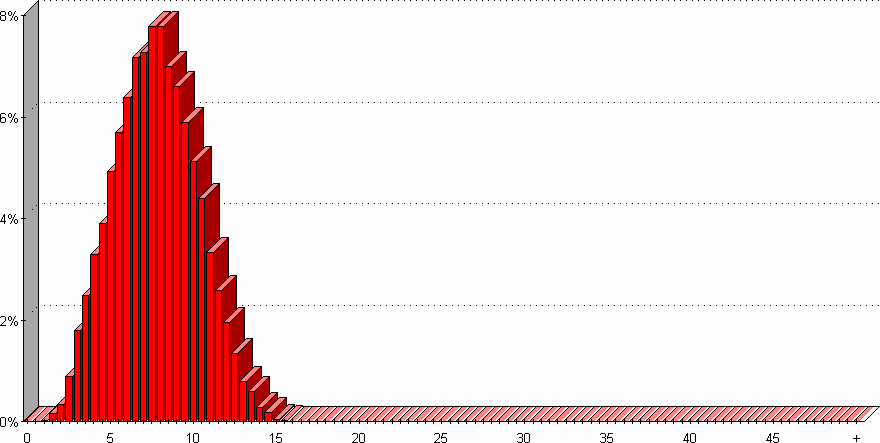 |
MAP3147 Average Write Service Time
|
||||||||||||||||||||||||||||||||
The MAP3147 delivers an average access time of 7.9 milliseconds, a figure practically identical to much of the competition. Subtracting three milliseconds to account for the rotational latency of a 10,000 RPM drive yields a measured seek time of 4.9 ms, a bit higher than Fujitsu’s 4.5 ms spec. Average writes clock in a bit higher than Seagate’s latest as well as the MAP’s own predecessor at 8.7 milliseconds.
|
Note: Scores on top are better. |
|
|||||||||||||||||||||||||||||||||
|
|
||||||||||||||||||||||||||||||||
MAP3147 Transfer Rate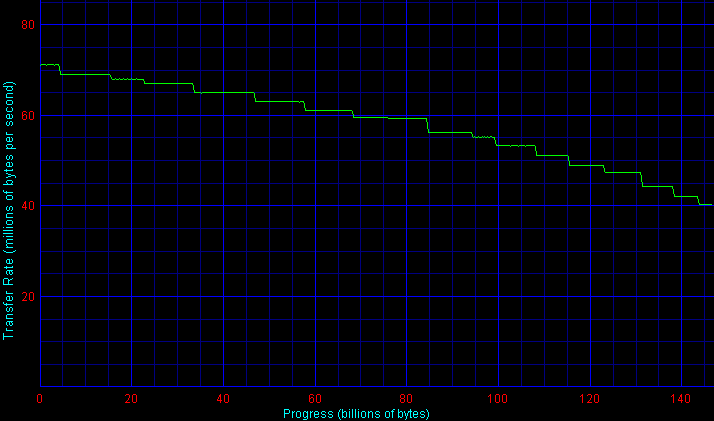
|
|||||||||||||||||||||||||||||||||
WinBench 99’s quantitative results record an outer-zone transfer rate of 69.6 MB/sec. The output graph, interestingly, indicates that the outermost zone actually exceeds 70 MB/sec by a significant margin. WB99’s transfer rate tests are unfortunately prone to these discrepancies every once in a while. At any rate, however, either score places the MAP3147 at the top of the heap.
Inner-zone transfer rates are just as impressive; 42.5 MB/sec is the highest we’ve seen from any 10K drive save Seagate’s Cheetah 36ES (an oddball drive that exhibits unusually low levels of decay in transfer rates between its outermost and innermost zones).
Single-User PerformanceStorageReview uses the following tests to assess non-server use: StorageReview.com Office DriveMark 2002– A capture of 30 minutes of actual computer productivity use that exactingly recreates a typical office-style multitasking environment. The applications include: Outlook XP, Word XP, Excel XP, PowerPoint XP, Calypso (a freeware e-mail client), SecureCRT v3.3 (a telnet/SSH client), CuteFTP Pro v1.0 (an FTP/SSH client), ICQ 2000b), Palm Hotsync 4.0, Gravity 2.3 (a Usenet/newsgroups client), PaintShop Pro v7.0, Media Player v8 for the occasional MP3, and Internet Explorer 6.0. StorageReview.com High-End DriveMark 2002– A capture of VeriTest’s Content Creation Winstone 2001 suite. Applications include Adobe Photoshop v5.5, Adobe Premiere v5.1, Macromedia Director v8.0, Macromedia Dreamweaver v3.0, Netscape Navigator v4.73, and Sonic Foundry Sound Forge v4.5. Unlike typical productivity applications, high-end audio- and video- editing programs are run in a more serial and less multitasked manner. The High-End DriveMark includes significantly more sequential transfers and write (as opposed to read) operations. |
StorageReview.com Bootup DriveMark 2002– A capture of the rather unusual Windows XP bootup process. Windows XP’s boot procedure involves significantly different access patterns and queue depths than those found in other disk accesses. This test recreates Windows XP’s bootup from the initial bootstrap load all the way to initialization and loading of the following memory-resident utilities: Dimension4 (a time synchronizer), Norton Antivirus 2002 AutoProtect, Palm Hotsync v4.0, and ICQ 2000b.
StorageReview.com Gaming DriveMark 2002– A weighted average of the disk accesses featured in five popular PC games: Lionhead’s Black & White v1.1, Valve’s Half-Life: Counterstrike v1.3, Blizzard’s Diablo 2: Lord of Destruction v1.09b, Maxis’s The Sims: House Party v1.0, and Epic’s Unreal Tournament v4.36. Games, of course, are not multitasked- all five titles were run in a serial fashion featuring approximately half an hour of play time per game.
For more information, please click here.
|
Note: Scores on top are better. |
Traditionally, Fujitsu’s SCSI line has exhibited excellent multi-user performance but usually left things to be desired when it came to single-user desktop/workstation scenarios. As a result, we were pleasantly surprised by the MAP3147’s outstanding showing in our Desktop DriveMark suite.
The MAP delivers a StorageReview.com Office DriveMark 2002 of 490 I/Os per second. This score places the drive second only to the 15,000 RPM Seagate Cheetah 15K.3 and substantially ahead of 10,000 RPM competitors such as the Cheetah 10K.6 and Maxtor Atlas 10k III.
This impressive showing continues throughout the High-End, Bootup, and Gaming DriveMarks. In fact, in the Bootup DriveMark 2002, the MAP3147 ties the Cheetah 15K.3 to deliver the highest score we’ve ever recorded.
Since it is a 15K disk that really belongs in a separate class, we’ve left the Cheetah 15K.3 out of the above performance graphs to depict the 10K RPM landscape unfettered. As always, however, readers may construct their own custom sorts and comparisons in the versatile StorageReview.com Drive Performance Database.
Multi-User PerformanceStorageReview uses the following tests to assess server performance: StorageReview.com File Server DriveMark 2002– A mix of synthetically-created reads and writes through IOMeter that attempts to model the heavily random access that a dedicated file server experiences. Individual tests are run under loads with 1 I/O, 4 I/Os, 16 I/Os, and 64 I/Os outstanding. The Server DriveMark is a convenient at-a-glance figure derived from the weighted average of results obtained from the four different loads. StorageReview.com Web Server DriveMark 2002– A mix of synthetically-created reads through IOMeter that attempts to model the heavily random access that a dedicated web server experiences. Individual tests are run under loads with 1 I/O, 4 I/Os, 16 I/Os, and 64 I/Os outstanding. The Server DriveMark is a convenient at-a-glance figure derived from the weighted average of results obtained from the four different loads. For more information click here. |
|
Note: Scores on top are better. |
|
|||||||||||||||||||||||||||||||||
|
|
||||||||||||||||||||||||||||||||
Rather than forging into new grounds when it comes to server performance, the MAP3147 pretty much matches the performance delivered by its predecessor. The MAN3735 was no slouch when it came to multi-user setups, however. The MAP, the MAN, and the Cheetah 10K.6 together crowd up the top tier of 10K server speed.
Legacy PerformanceeTesting Lab’s WinBench 99 Disk WinMark tests are benchmarks that attempt to measure desktop performance through a rather dated recording of high-level applications. Despite their age, the Disk WinMarks are somewhat of an industry standard. The following results serve only as a reference; SR does not factor them into final judgments and recommends that readers do the same. |
|
Note: Scores on top are better. |
|
|||||||||||||||||||||||||||||||||
|
|
||||||||||||||||||||||||||||||||
Heat and NoiseIdle Noise– The sound pressure emitted from a drive measured at a distance of 18 millimeters. The close-field measurement allows for increased resolution between drive sound pressures and eliminates interactions from outside environmental noise. Note that while the measurement is an A-weighted decibel score that weighs frequencies in proportion to human ear sensitivity, a low score does not necessarily predict whether or not a drive will exhibit a high-pitch whine that some may find intrusive. Conversely, a high score does not necessarily indicate that the drive exhibits an intrusive noise envelope. Net Drive Temperature– The highest temperature recorded from a 16-point sample of a drive’s top plate after it has been under heavy load for 80 minutes. The figures provided are net temperatures representing the difference between the measured drive temperature and ambient temperature. For more information, please click here. |
|
Note: Scores on top are better. |
|
|||||||||||||||||||||||||||||||||
|
|
||||||||||||||||||||||||||||||||
Equipped with FDB motors, the MAP3147 delivers objective noise measurements substantially lower than the competition. Remember, however, that FDB motors come only on the flagship 147-gig MAP unit. Lower-capacity models feature traditional ball-bearing motors and may not exhibit the same noise profile. Seek noises are comparable to that of the Cheetah 10K.6- louder than most ATA drives but still audible under normal use.
While it can’t quite achieve the low operating temperature of the Cheetah 10K.6, the MAP3147 nonetheless significantly improves on the heat levels turned in by its predecessor. There should be little trouble incorporating the drive into any well-ventilated enclosure.
ConclusionFujitsu’s MAP3147 delivers the solid server-class performance that we’ve come to expect from the company’s offerings. The drive also delivers record-breaking speed when it comes to single-user applications. Finally, FDB motors give the unit the quietest 10K RPM noise floor around. It has been quite a while since we’ve been this excited about a new disk from Fujitsu. The MAP3147 sets the standard that drives from the competition must beat, and it’s a formidable standard indeed. And just think: What does the MAP’s outstanding showing hint about the firm’s upcoming 15,000 RPM MAS family? We can’t wait to find out! |


 Amazon