

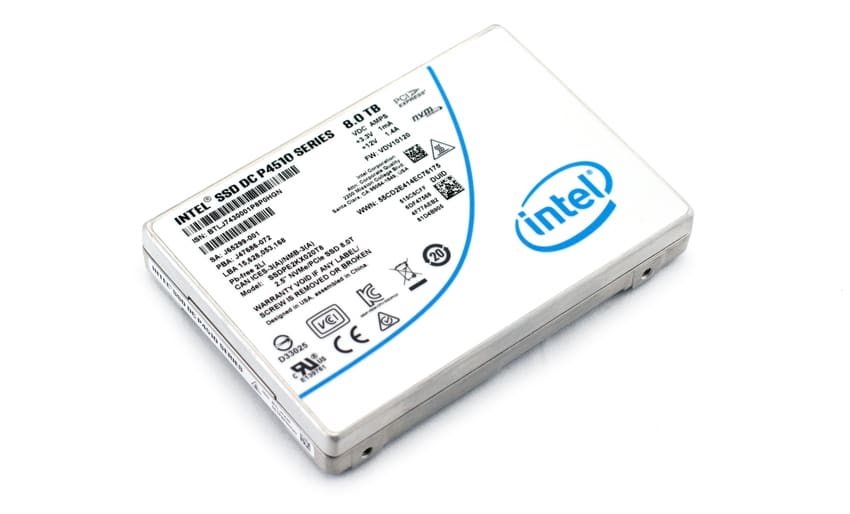
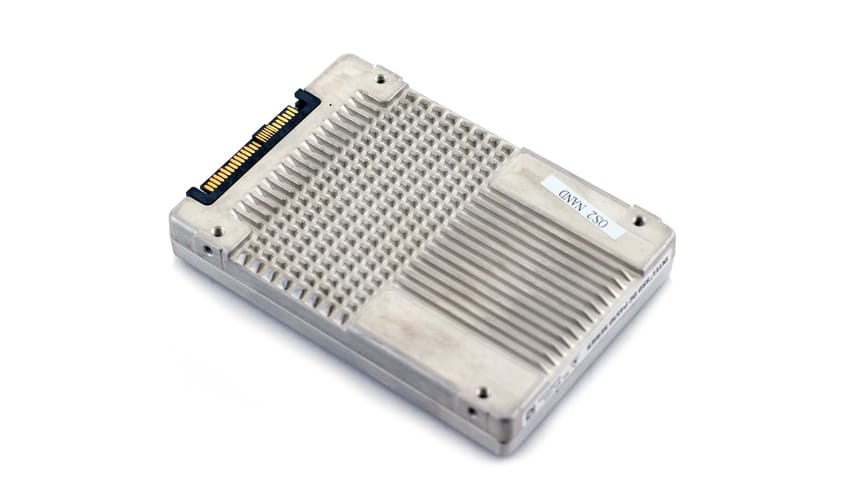
Introduced earlier this year, the DC P4510 Series is Intel’s new data center NVMe SSD. Designed specifically for the Cloud (with the tagline “Cloud Inspired. Storage Optimized.”), the P4510 is Intel’s first enterprise 64-layer 3D NAND SSD. Leveraging this technology, the company was able to drive the capacity of the drive up to 8TB, all the while being able to fit it in a U.2, 15mm form factor.
The expanded capacity can help companies either consolidate workloads or support broader cloud workloads better, enabling service providers to increase the number of users and improve data service levels. Along with the high capacity, the drive has improved QoS that utilizes an intelligent firmware algorithm that keeps host and background read/write data at an optimum balance. The P4510 has quoted performance of 3.2GB/s read and 3GB/s write, as well as 637K IOPS read and 139K IOPs write.
The drive series also minimizes service disruptions through enhanced SMART monitoring of drive health and status, using an in-band mechanism and out-of-band access. This helps in the event of sudden power loss as well to prevent data from being lost along with it. The P4510 has firmware enhancements built into its new 3D NAND that prioritizes host workloads, thus ensuring better service levels.
The Intel DC P4510 comes in capacities of 1TB, 2TB, 4TB, and 8TB and uses the NVMe specification 1.2. For this review we will be looking at both the 2TB and the 8TB models.
Intel DC P4510 specifications
| Capacity | 1TB | 2TB | 4TB | 8TB |
| Interface | PCIe 3.1 x4, NVMe 1.2 | |||
| Form factor | U.2 2.5” 15mm | |||
| NAND | Intel 3D NAND Technology, 64-layer, TLC | |||
| Performance | ||||
| 128k sequential read | up to 3,200MB/s | |||
| 128k sequential write | up to 3,000MB/s | |||
| 4k random read | up to 637,000 IOPS | |||
| 4k random write | up to 139,000 IOPS | |||
| Latency read/write | 110µs | |||
| Reliability | ||||
| Lifetime write | 13.88PB | |||
| DWPD | 1 | |||
| MTBF | 2 million hours | |||
| UBER | 1 sector per 10^17 bits read | |||
| Vibration | ||||
| Operating | 2.17 GRMS (5-700 Hz) | |||
| Non-operating | 3.13 GRMS (5-800 Hz) | |||
| Shock | 1000G (0.5ms) | |||
| Power | ||||
| Active | 16W | |||
| Idle | 5W | |||
Performance
Testbed
Our Enterprise SSD reviews leverage a Lenovo ThinkSystem SR850 for application tests and a Dell PowerEdge R740xd for synthetic benchmarks. The ThinkSystem SR850 is a well-equipped quad-CPU platform, offering CPU power well in excess of what's needed to stress high-performance local storage. Synthetic tests that don't require a lot of CPU resources use the more traditional dual-processor server. In both cases, the intent is to showcase local storage in the best light possible that aligns with storage vendor maximum drive specs.
Lenovo ThinkSystem SR850
- 4 x Intel Platinum 8160 CPU (2.1GHz x 24 Cores)
- 16 x 32GB DDR4-2666Mhz ECC DRAM
- 2 x RAID 930-8i 12Gb/s RAID Cards
- 8 NVMe Bays
- VMware ESXI 6.5
Dell PowerEdge R740xd
- 2 x Intel Gold 6130 CPU (2.1GHz x 16 Cores)
- 16 x 16GB DDR4-2666MHz ECC DRAM
- 1x PERC 730 2GB 12Gb/s RAID Card
- Add-in NVMe Adapter
- Ubuntu-16.04.3-desktop-amd64
Testing Background and Comparables
The StorageReview Enterprise Test Lab provides a flexible architecture for conducting benchmarks of enterprise storage devices in an environment comparable to what administrators encounter in real deployments. The Enterprise Test Lab incorporates a variety of servers, networking, power conditioning, and other network infrastructure that allows our staff to establish real-world conditions to accurately gauge performance during our reviews.
We incorporate these details about the lab environment and protocols into reviews so that IT professionals and those responsible for storage acquisition can understand the conditions under which we have achieved the following results. None of our reviews are paid for or overseen by the manufacturer of equipment we are testing. Additional details about the StorageReview Enterprise Test Lab and an overview of its networking capabilities are available on those respective pages.
Comparables for this review:
- Memblaze PBlaze5 3.2TB
- Memblaze PBlaze4 3.2TB
- Intel P3700 2TB
- Intel P4500 2TB
- HGST SN100 3.2TB
- Toshiba PX04 1.6TB
Application Workload Analysis
In order to understand the performance characteristics of enterprise storage devices, it is essential to model the infrastructure and the application workloads found in live-production environments. Our benchmarks for the Intel P4510 are therefore the MySQL OLTP performance via SysBench and Microsoft SQL Server OLTP performance with a simulated TCP-C workload. For our application workloads, each drive will be running 2-4 identically configured VMs.
SQL Server Performance
Each SQL Server VM is configured with two vDisks: 100GB volume for boot and a 500GB volume for the database and log files. From a system-resource perspective, we configured each VM with 16 vCPUs, 64GB of DRAM and leveraged the LSI Logic SAS SCSI controller. While our Sysbench workloads tested previously saturated the platform in both storage I/O and capacity, the SQL test is looking for latency performance.
This test uses SQL Server 2014 running on Windows Server 2012 R2 guest VMs, and is stressed by Quest's Benchmark Factory for Databases. StorageReview’s Microsoft SQL Server OLTP testing protocol employs the current draft of the Transaction Processing Performance Council’s Benchmark C (TPC-C), an online transaction-processing benchmark that simulates the activities found in complex application environments. The TPC-C benchmark comes closer than synthetic performance benchmarks to gauging the performance strengths and bottlenecks of storage infrastructure in database environments. Each instance of our SQL Server VM for this review uses a 333GB (1,500 scale) SQL Server database and measures the transactional performance and latency under a load of 15,000 virtual users.
SQL Server Testing Configuration (per VM)
- Windows Server 2012 R2
- Storage Footprint: 600GB allocated, 500GB used
- SQL Server 2014
- Database Size: 1,500 scale
- Virtual Client Load: 15,000
- RAM Buffer: 48GB
- Test Length: 3 hours
- 2.5 hours preconditioning
- 30 minutes sample period
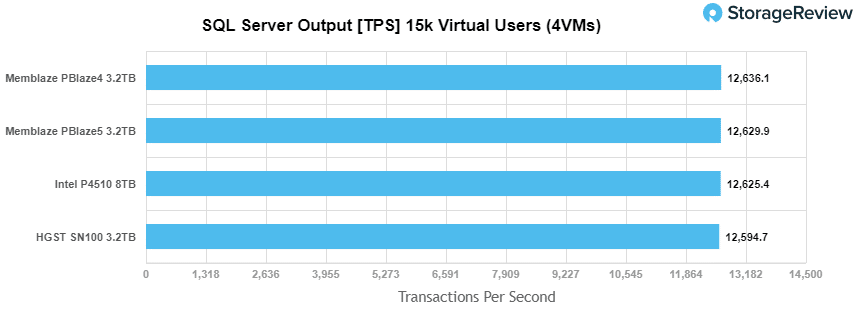
For our SQL Server transactional benchmark, the P4510 landed in third with 12,625.4 TPS, 10.7 behind the top performer, the PBlaze4.
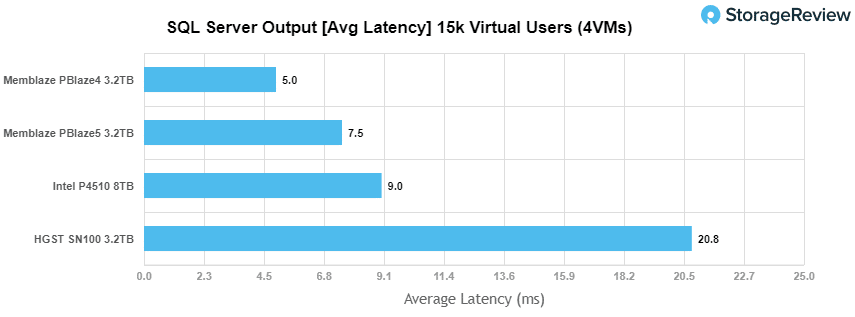
For SQL average latency, the P4510 again came in third with 9ms.
Sysbench Performance
The next application benchmark consists of a Percona MySQL OLTP database measured via SysBench. This test measures average TPS (Transactions Per Second), average latency, and average 99th percentile latency as well.
Each Sysbench VM is configured with three vDisks: one for boot (~92GB), one with the pre-built database (~447GB), and the third for the database under test (270GB). From a system resource perspective, we configured each VM with 16 vCPUs, 60GB of DRAM and leveraged the LSI Logic SAS SCSI controller.
Sysbench Testing Configuration (per VM)
- CentOS 6.3 64-bit
- Percona XtraDB 5.5.30-rel30.1
- Database Tables: 100
- Database Size: 10,000,000
- Database Threads: 32
- RAM Buffer: 24GB
- Test Length: 3 hours
- 2 hours preconditioning 32 threads
- 1 hour 32 threads
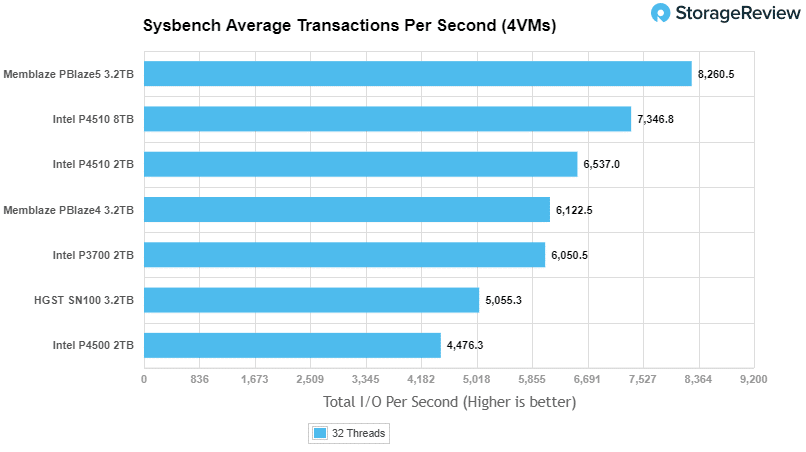
With the Sysbench transactional benchmark, the P4510 came in second and third with 7,346.8 TPS for the 8TB and 6,537 TPS for the 2TB.
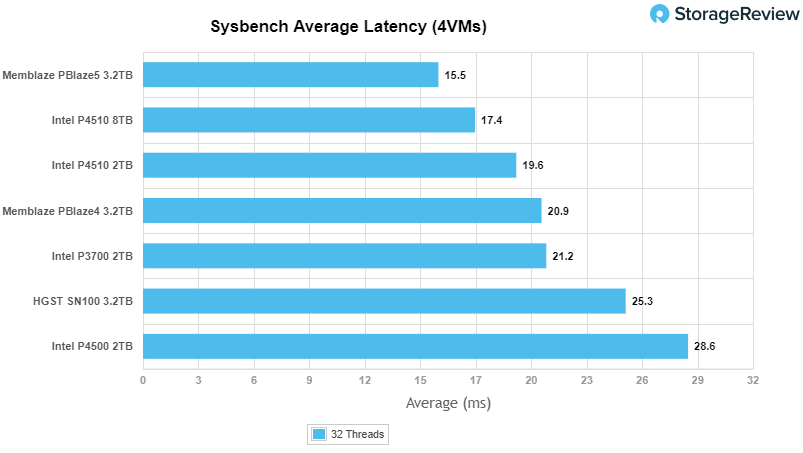
With average latency, the P4510 had the same placing as the above with the 8TB in second with a latency of 17.4ms and the 2TB in third with 19.6ms
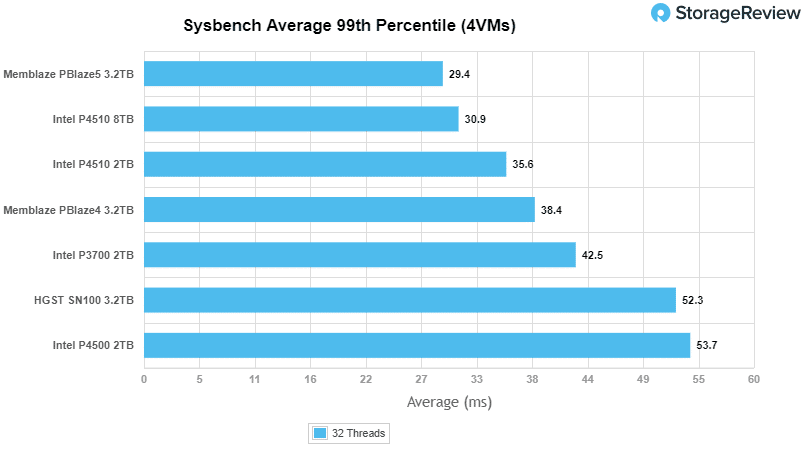
Our worst-case scenario latency benchmark once again had the same placing with the 8TB P4510 in second with 30.9ms and the 2TB version in third with 35.6ms.
Houdini by SideFX
The Houdini test is specifically designed to evaluate storage performance as it relates to CGI rendering. The test bed for this application is a variant of the core Dell PowerEdge R740xd server type we use in the lab with dual Intel 6130 CPUs and 64GB DRAM. In this case, we installed Ubuntu Desktop (ubuntu-16.04.3-desktop-amd64) running bare metal. Output of the benchmark is measured in seconds to complete, with fewer being better.
The Maelstrom demo represents a section of the rendering pipeline that highlights the performance capabilities of storage by demonstrating its ability to effectively use the swap file as a form of extended memory. The test does not write out the result data or process the points in order to isolate the wall-time effect of the latency impact to the underlying storage component. The test itself is composed of five phases, three of which we run as part of the benchmark, which are as follows:
- Loads packed points from disk. This is the time to read from disk. This is single threaded, which may limit overall throughput.
- Unpacks the points into a single flat array in order to allow them to be processed. If the points do not have dependency on other points, the working set could be adjusted to stay in-core. This step is multi-threaded.
- (Not Run) Process the points.
- Repacks them into bucketed blocks suitable for storing back to disk. This step is multi-threaded.
- (Not Run) Write the bucketed blocks back out to disk.
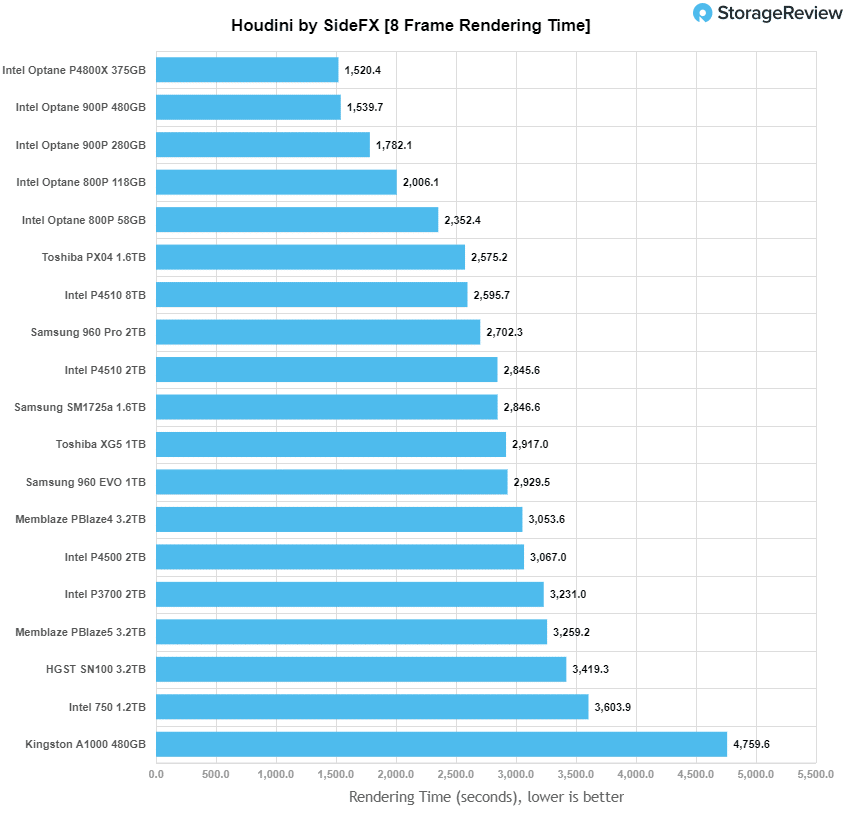
The Intel P4510 did pretty well on the Houdini test, coming in second of the non-Optane drives with 2,595.7 seconds. Overall it placed seventh. The 2TB didn't fare as well with 2,845.6 seconds.
VDBench Workload Analysis
When it comes to benchmarking storage devices, application testing is best, and synthetic testing comes in second place. While not a perfect representation of actual workloads, synthetic tests do help to baseline storage devices with a repeatability factor that makes it easy to do apples-to-apples comparison between competing solutions. These workloads offer a range of different testing profiles ranging from "four corners" tests, common database transfer size tests, to trace captures from different VDI environments. All of these tests leverage the common vdBench workload generator, with a scripting engine to automate and capture results over a large compute testing cluster. This allows us to repeat the same workloads across a wide range of storage devices, including flash arrays and individual storage devices. Our testing process for these benchmarks fills the entire drive surface with data, then partitions a drive section equal to 25% of the drive capacity to simulate how the drive might respond to application workloads. This is different than full entropy tests which use 100% of the drive and take them into steady state. As a result, these figures will reflect higher-sustained write speeds.
Profiles:
- 4K Random Read: 100% Read, 128 threads, 0-120% iorate
- 4K Random Write: 100% Write, 64 threads, 0-120% iorate
- 64K Sequential Read: 100% Read, 16 threads, 0-120% iorate
- 64K Sequential Write: 100% Write, 8 threads, 0-120% iorate
- Synthetic Database: SQL and Oracle
- VDI Full Clone and Linked Clone Traces
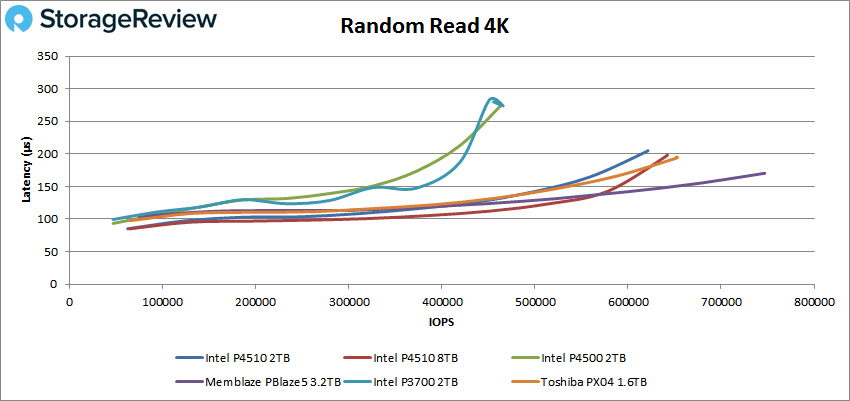
In our first VDBench Workload Analysis, Random 4K Read, the 8TB Intel DC P4510 had a peak performance of 642,149 IOPS and a latency of 198µs. This placed the drive third behind the Memblaze PBlaze5 and just behind the Toshiba PX04. The 2TB version came in fourth with a peak performance of 621,469 IOPS and a latency of 205µs.
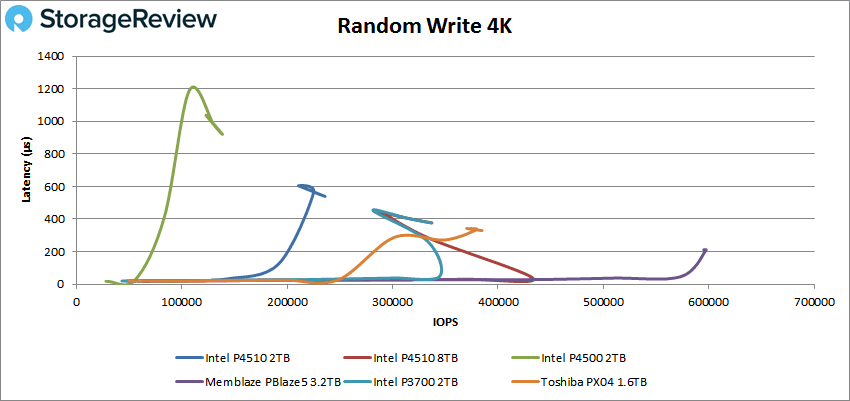
For random 4K write, the 8TB P4510 peaked at around 433K IOPS with 36µs. However, it immediately saw a drop in performance and a spike in latency, placing it on par with the P3700 and in third place. The 2TB came in next to last, with a peak performance of 233,299 IOPS with a latency of 540µs.
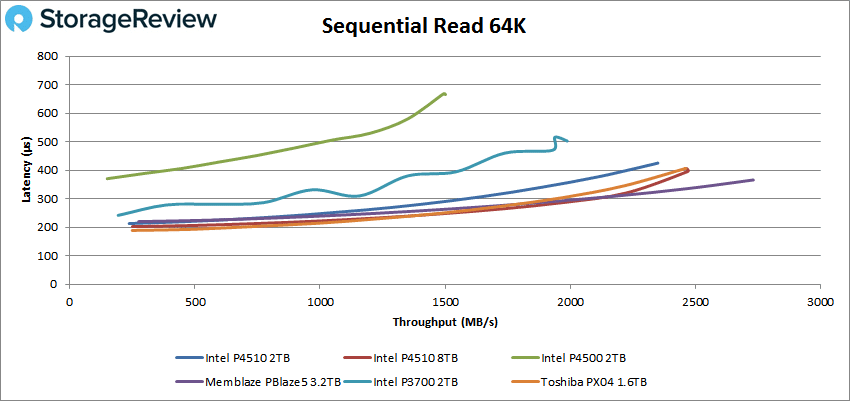
Switching over to sequential workloads, the 8TB P4510 was able to just edge out the Toshiba PX04 for second place in 64K reads with a peak score of 39,502 IOPS or 2.5GB/s with a latency of 396µs. The 2TB again came in fourth with 37,582 IOPS or 2.35GB/s and a latency of 425µs.
For 64K writes, the 8TB P4510 came in third once more with a peak performance of 26,150 IOPS or 1.63GB/s and a latency of 605µs. Again the 2TB had much more poor write performance, coming in second to last with 15,453 IOPS or 966MB/s and a latency of 1.02ms.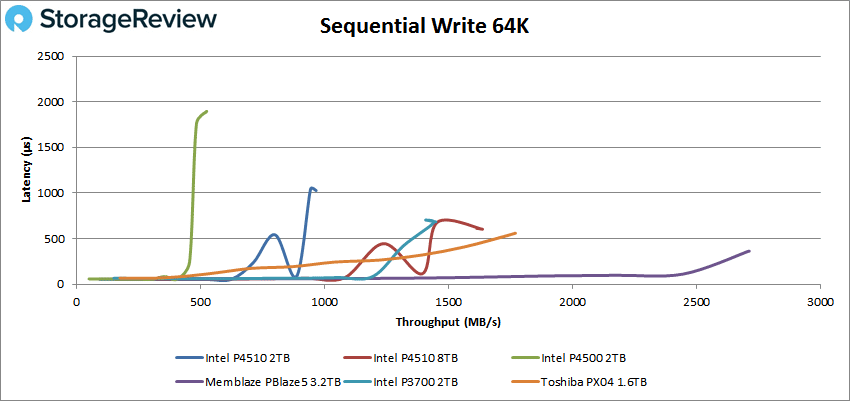
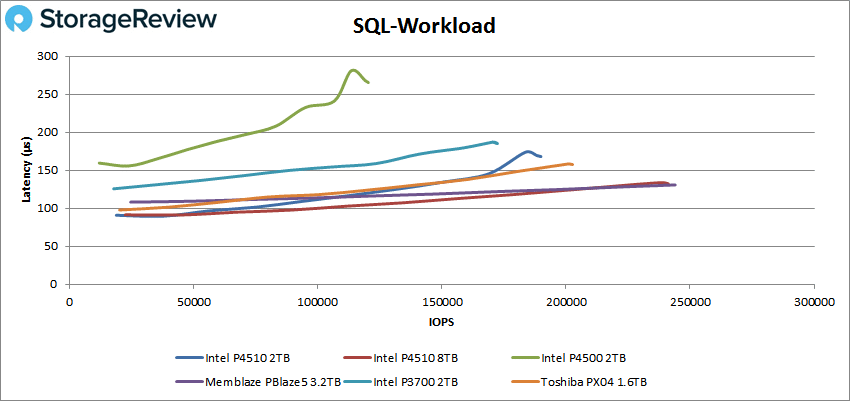
Next we look at SQL workloads. For the first benchmark, the 8TB P4510 narrowly came in second with a peak performance of 241,242 IOPS and a latency of 132µs. The 2TB P4510 came in fourth with a peak performance of 188,170 IOPS and 170µs.
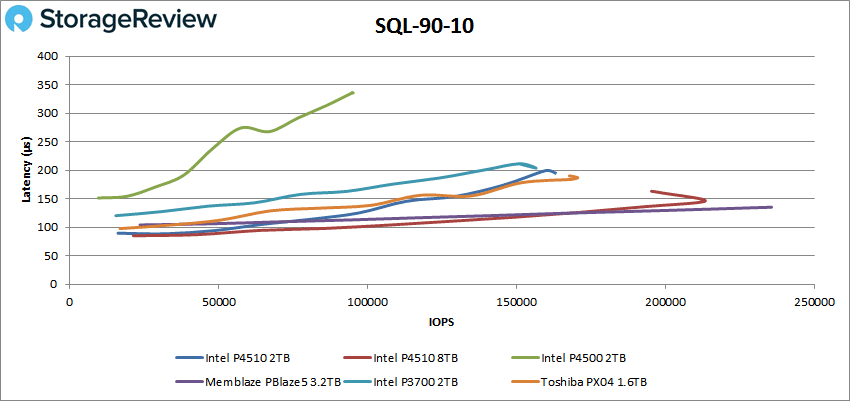
In SQL 90-10, again the 8TB drive came in second, peaking at 213,390 IOPS with a latency of 146µs before dropping off below 200K IOPS and latency rising slightly. The 2TB version had a peak performance of 182,868 IOPS with a latency of 196µs, placing fourth.
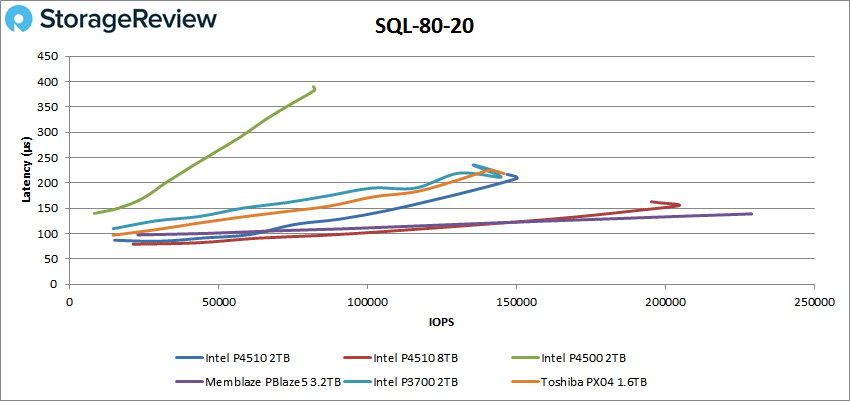
In SQL 80-20, we saw the same placement with a similar effect of the 8TB P4510 peaking at 204,683 IOPS with 156µs latency before dropping off a bit. The 2TB version peaked at 150,201 IOPS with a latency of 209µs before dropping off slightly in performance, placing third.
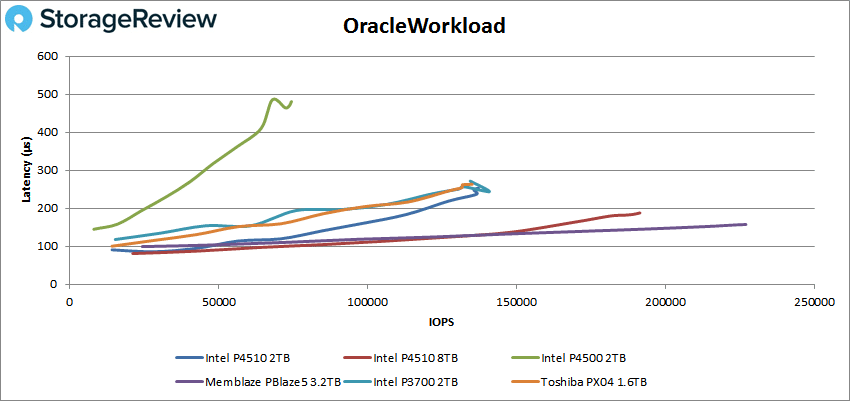
Our next batch of benchmarks look at Oracle workloads. The first showed the 8TB P4510 coming in second with a peak performance of 191,472 IOPS and a latency of 188µs. The 2TB hit peak performance of 136,675 IOPS with a latency of 237µs taking fourth.
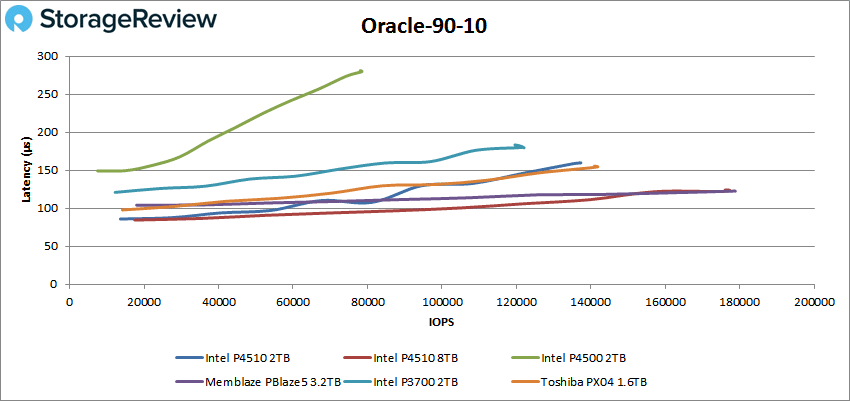
For Oracle 90-10, the 8TB P4510 just missed overtaking the PBlaze5 with a peak performance of 177,256 IOPS and a latency of 124µs. The 2TB version hit a peak of 137,302 IOPS with a latency of 160µs.
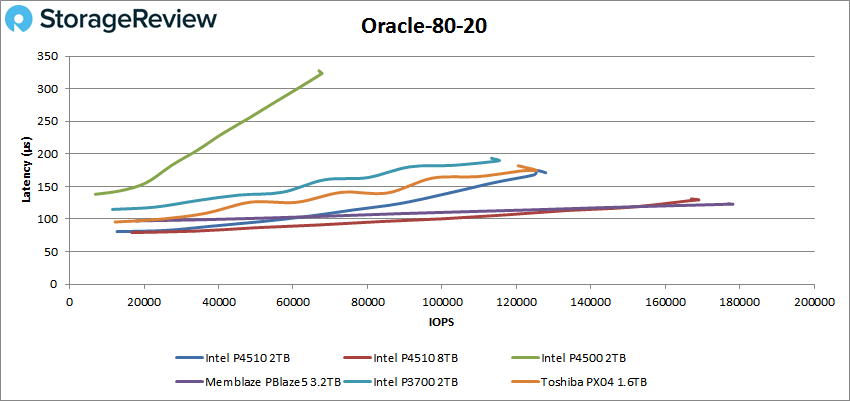
With the Oracle 80-20 test, the 8TB P4510 once again landed in the second spot with a peak performance of 177,851 IOPS and a latency of 130µs. The 2TB drive hit a peak of 127,888 IOPS and a latency of 171µs putting it in third place.
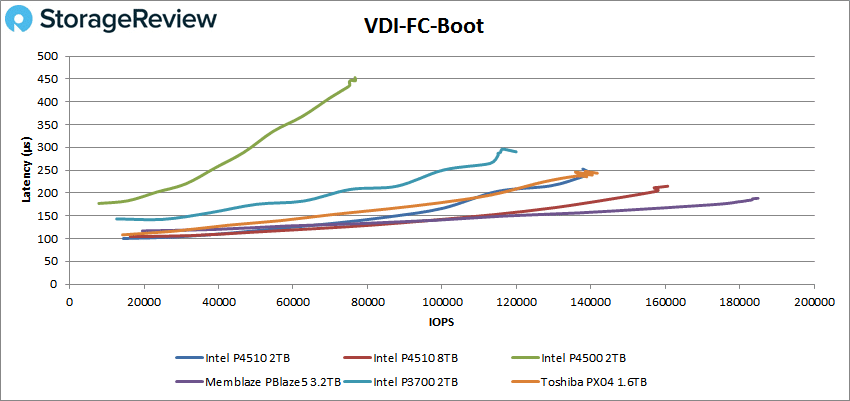
Next we switched over to our VDI clone test, Full and Linked. For VDI Full Clone Boot, the 8TB P4510 found itself in second place with a peak performance of 160,678 IOPS and a latency of 215µs. The 2TB version was neck-and-neck with the Toshiba drive with a peak performance of 138,821 IOPS and a latency of 244µs.
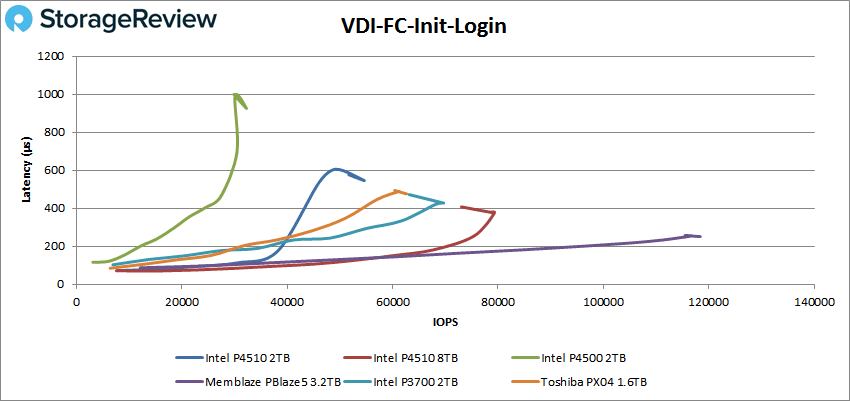
With VDI FC Initial Login the 8TB P4510 peaked at 79,306 IOPS with a latency of 375µs before dropping off a bit in performance. It once again took second place. The 2TB version was next to last with a peak performance of 54,562 IOPS and a latency of 546µs.
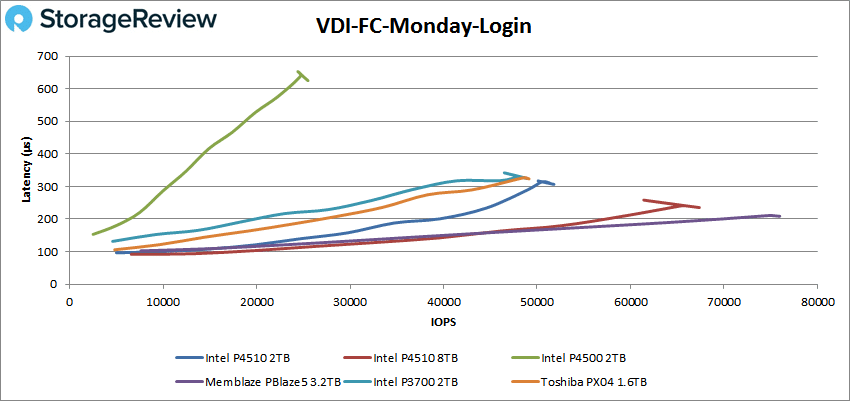
The VDI FC Monday Login saw the 8TB P4510 take second place with a peak performance of 67,351 IOPS and a latency of 236µs. The 2TB P4510 took third with a peak performance of 51,803 IOPS and a latency of 307µs.
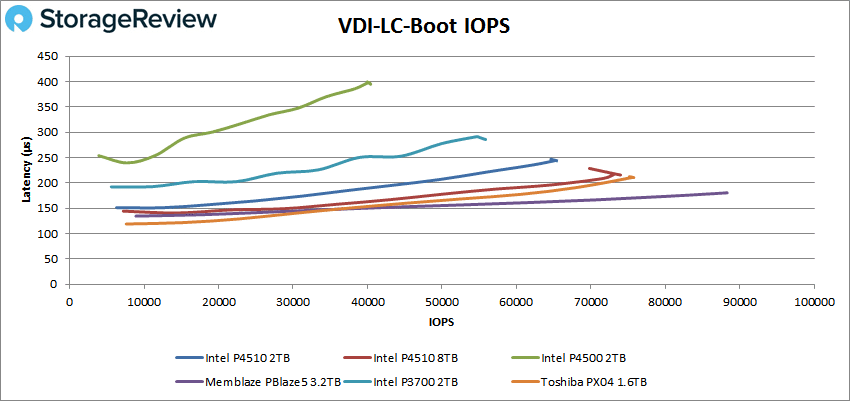
On the VDI LC Boot test, we saw the 8TB P4510 come in third here behind the Memblaze and Toshiba with a peak performance of 75,572 IOPS and a latency of 211µs. Coming in right behind it was the 2TB P4510 with 65,274 IOPS and a latency of 244µs.
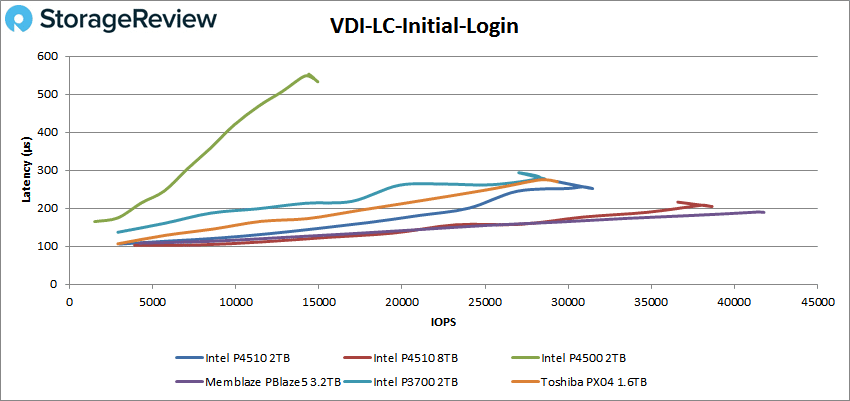
VDI LC Initial Login saw a better placement for the 8TB P4510 coming in second with a peak performance of 48,495 IOPS and a latency of 205µs. In third place was the 2TB version with 31,468 IOPS and a latency of 252µs.
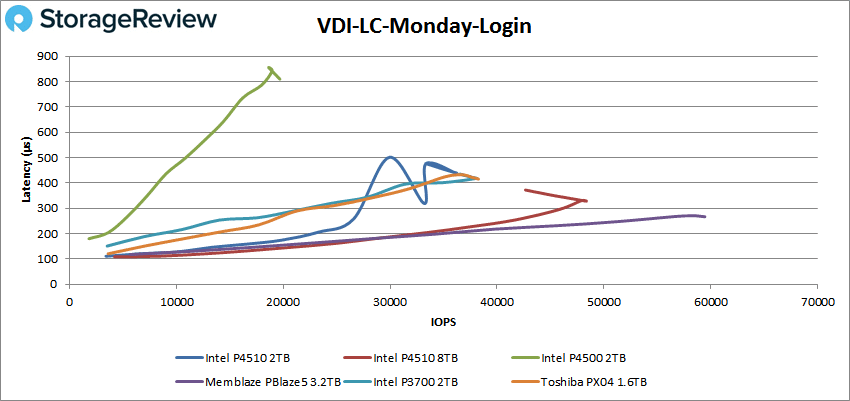
And finally our VDI LC Monday Login had the 8TB P4510 come in second with a peak performance of 48,324 IOPS and a latency of 328µs. The 2TB drive dropped to second to last with 35,999 IOPS and 439µs latency.
Conclusion
The Intel DC P4510 NVMe SSD Series is the company’s new data center drives designed with the cloud in mind. The drives come in a U.2 form factor with an impressive 8TB maximum capacity leveraging Intel’s 64-layer 3D NAND. This capacity translates to broader cloud workloads, more users, and better service levels. The P4510 has an enhanced QoS that balances host and background reads and writes. It also monitors drive health and status to help ensure availability and data protection.
Looking at performance in our application workload analysis, the Intel SSD DC P4510 put up good numbers in our SQL Server test with 12,625.4 TPS and 9ms average latency. Both Memblaze drives beat it out by a small margin. With Sysbench, the 8TB P4510 came in second across the board with 7,346.8 TPS, an average latency of 17.4ms, and a worst-case scenario of 30.9ms, while the 2TB hit 6,537 TPS, 17.4ms average latency, and 35.6ms worst-case scenario. With the Houdini test, the 8TB P4510 came in second for a non-Optane drive with 2,595.7 seconds, it placed seventh overall. The 2TB version was able to hit 2,845.6 seconds.
For VDBench workload analysis, the 8TB P4510 came in either second or third in all of the benchmarks. It did put up impressive numbers though, for example, in random 4K it was able to hit over 642K IOPS read and 433K IOPS write (though it saw a sharp drop in performance after it peaked). In sequential workloads, the drive hit 2.5GB/s read and 1.63GB/s write. For SQL workloads, the P4510 was able to hit over 241K IOPS, 213K IOPS for 90-10, and over 204K IOPS for 80-20. For our Oracle workloads, the Intel drive was able to hit over 191K IOPS as well as 177K IOPS for 90-10 and 80-20. In the Oracle 90-10, the Intel almost caught up with the frontrunner, PBlaze5. For our VDI FC tests, the drive was able to hit over 160K IOPS for boot, 79K IOPS for Initial Login, and 67K IOPS for Monday Login. For VDI LC, the drive hit over 75K IOPS for boot, 48K IOPS for Initial Login, and 48K IOPS for Monday Login.
The P4510 did well in most of the benchmarks, easily improving on the P4500 before it. With the variety of capacity offerings and form factors, Intel has positioned the P4510 well to be their NVMe workhorse, especially with the highest capacity 8TB model.
The Bottom Line
The Intel SSD DC P4510 is an NVMe SSD that comes in capacities as high as 8TB and ample performance to allow service providers to do more with their data services.


 Amazon