

Just last week Intel released their 3rd Gen Xeon CPUs, which builds on their ecosystem play that includes Optane SSD storage in the P5800X and of course the latest 200 Series persistent memory modules (PMem). With our initial Intel storage reviews out, we decided to repurpose the Intel server and storage tech we have in the lab. We installed Windows Server 2019 to test Optane PMem 200, Optane P5800X SSD and TLC NAND P5510 SSDs head-to-head. The purpose of this review is to evaluate the Intel storage performance in Windows Server so we may better understand where the strengths of each of these technologies lie in a bare metal scenario.
Optane PMem vs. Optane SSD vs. NAND SSD
There are a number of questions still about which storage technology is right for a particular application or use case, despite the long-favored storage pyramid from Intel. Sure, DRAM is the fastest, but unfortunately, it’s expensive as well. Optane PMem can be used like DRAM, providing persistent storage that doesn’t need rehydration on reboot. PMem also leverages traditional DIMM slots, so it’s easy to drop in. PMem also has an impressive performance profile when compared to traditional SSDs.
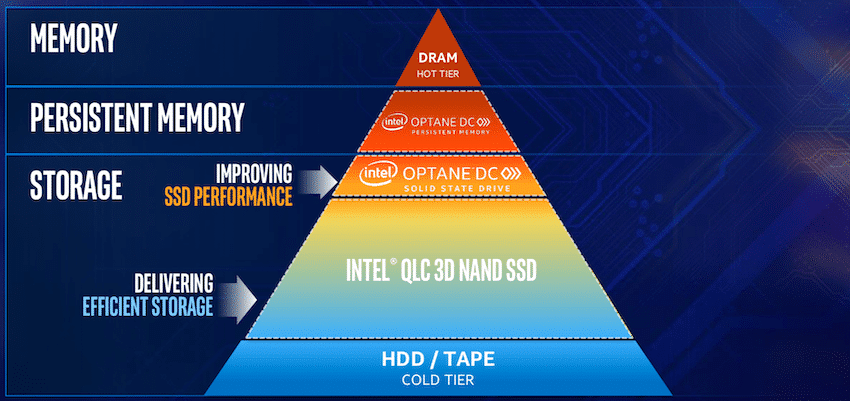
Then of course you have Optane SSDs, which have been optimized to absorb writes, a job traditional SSDs can struggle with. This is why they’re typically used as part of a multi-tier storage architecture as a cache or tiering pool. Optane SSDs though are more expensive than TLC NAND SSDs and have a tremendous capacity disadvantage, the P5800X tops out at 1.6TB for example.
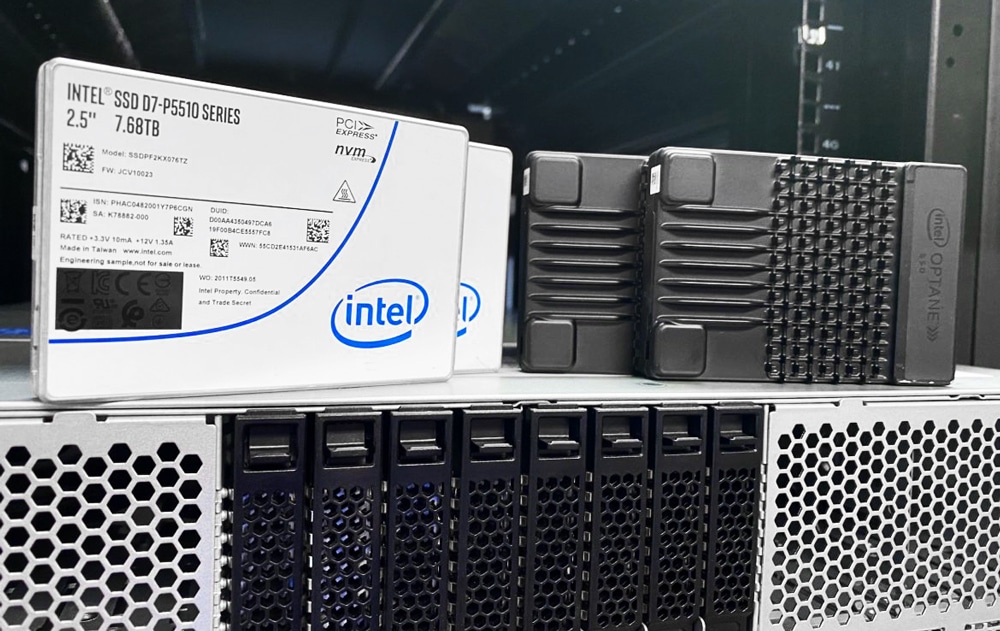
Moving down the line we have TLC SSDs, like the Intel P5510, which fits the sweet spot for performance per dollar. Lastly in the flash realm, we have QLC SSDs. These offer the greatest capacity and value per terabyte, but really prefer to be in a read-heavy environment, even better if they’re behind a cache or tier that aggregates writes and delivers them to the QLC SSDs in a gentle and loving manner. From there the storage pyramid devolves into a morass of hard drives, tape drives, and permutations of cloud storage.
Intel Storage Performance in Windows Server
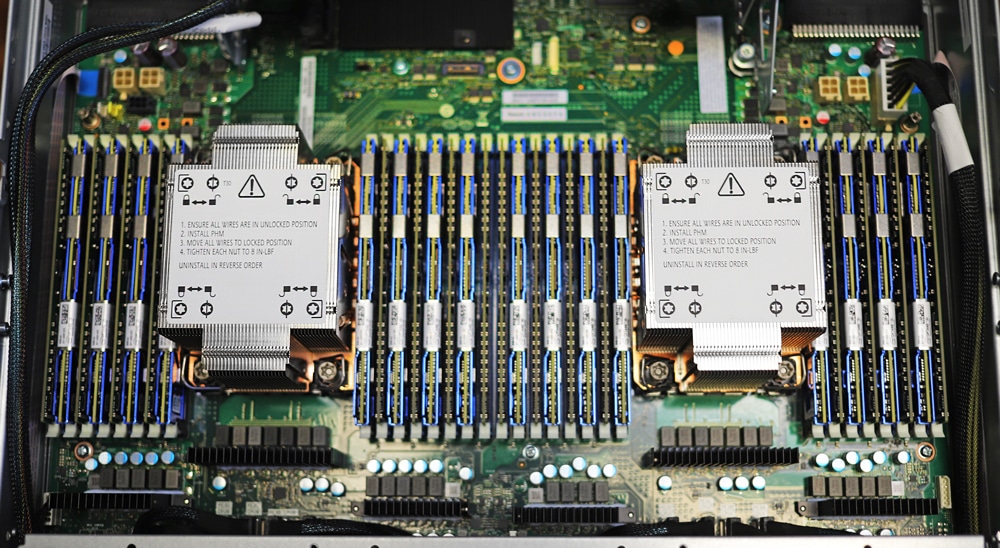
To evaluate the performance of these latest Intel storage technologies, we wanted a situation with as little overhead as possible, while still finding good support for PMem specifically, and our existing testing methodology. The first candidate is Microsoft Windows Server 2019. We are testing on an Intel OEM server that was designed to showcase the latest platform technologies like 3rd Gen Xeon, PMem 200, and the support for PCIe Gen4 storage.
Intel OEM Server Specifications
- 2 x Intel Xeon Platinum 8380 @ 2.3GHz 40-cores
- 16 x 32GB DDR4 3200MHz
- 16 x 128GB Intel Persistent Memory 200 Series
- Boot SSD: Intel 1TB SATA
- OS: Windows Server 2019
Enterprise Synthetic Workload Analysis
Our enterprise shared storage benchmark process preconditions each device into steady-state with the same workload the device will be tested with under a heavy load of 16 threads with an outstanding queue of 16 per thread, and then tested in set intervals in multiple thread/queue depth profiles to show performance under light and heavy usage. Since we are testing a small 20% footprint of storage on each device, we only graph out the main sections of each test.
Preconditioning and Primary Steady-State Tests:
- Throughput (Read+Write IOPS Aggregate)
- Average Latency (Read+Write Latency Averaged Together)
- Max Latency (Peak Read or Write Latency)
- Latency Standard Deviation (Read+Write Standard Deviation Averaged Together)
Our Enterprise Synthetic Workload Analysis includes four profiles based on real-world tasks, with a 1T/1Q 4K workload to focus on low load performance. These profiles have been developed to make it easier to compare to our past benchmarks as well as widely-published values such as max 4k read and write speed and 8k 70/30, which is commonly used for enterprise drives.
- 4K 1T/1Q
- 100% Read or 100% Write
- 100% 4K
- 4K 16T/16Q
- 100% Read or 100% Write
- 100% 4K
- 8K 70/30
- 70% Read, 30% Write
- 100% 8K
- 8K (Sequential)
- 100% Read or 100% Write
- 100% 8K
- 128K (Sequential)
- 100% Read or 100% Write
- 100% 128K
For our testing, we looked at three configurations of storage inside the Intel 3rd Gen server platform. These included the following:
- 16 x 128GB Intel Persistent Memory 200 Series in two namespaces (each with about 1TB of storage)
- 2 x 800GB Intel P5800X Optane SSDs
- 8 x 7.68TB Intel P5510 SSDs
Each device group or namespace was tested directly with an FIO job, using a 20% device capacity footprint to measure sustained performance. Each device per group was given its own job, and the results were aggregated. For example, for two devices being tested, each was given a 1T/1Q workload, so two threads at 1 queue total for that workload. Eight devices would be eight total threads at one queue and so on.
In our first test, we focused on a single thread, single queue depth 4K random read and write workload. Off-the-line performance is important for many applications, as some devices don’t need a heavy queue depth of I/O behind them to shine.
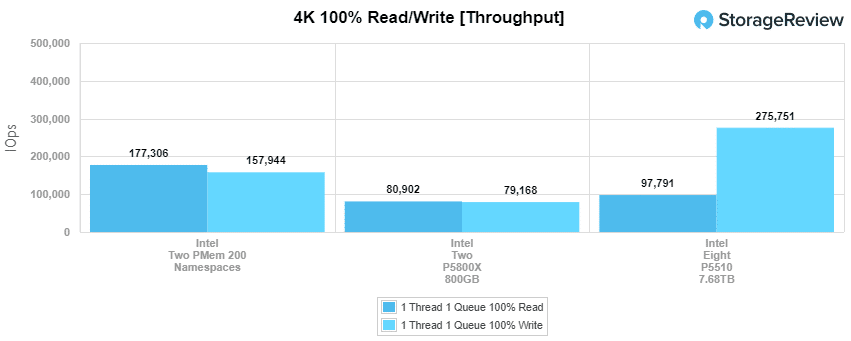
Intel PMem showed significant advantages in read performance, measuring nearly double compared to dual Intel P5800X SSDs or eight Intel P5510 SSDs. Looking at write performance, PMem still had an edge over the P5800X SSDs, but eight P5510 drives were able to provide higher throughput.
Next, we look at the average latency impact of our 1T/1Q 4K read and write test.
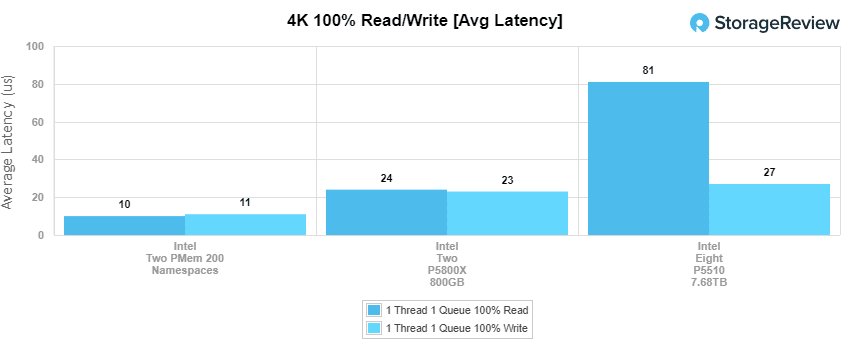
Intel PMem measured 10 microseconds of latency in 4K random read, followed by the P5800X with 24 microseconds and the P5510 SSDs with 81 microseconds. Looking at write latency we saw 11 microseconds from PMem, 23 from the P5800x SSDs, and 27ms from the P5510 SSDs.
Moving up to a heavier form of the same 4K read and write test, we look at where each device type topped out.
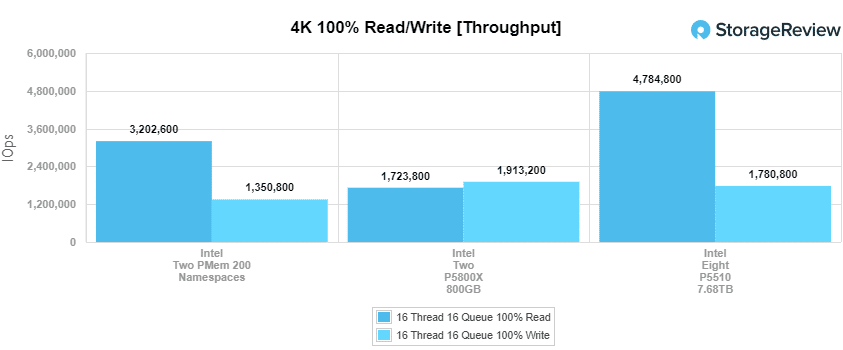
The group of eight Intel P5510 SSDs offered the most read throughput measuring nearly 4.8M IOPS, followed by PMem with 3.2M IOPS and the dual P5800X SSDs with 1.7M IOPS. In 4K random write the two P5800X SSDs had the lead with 1.91M IOPS, followed by the eight P5510 SSDs with 1.78M IOPS and the two PMem namespaces with 1.35M IOPS.
While throughput matters, one of the most interesting aspects of Optane, both as PMem and SSD, is how well it handles storage latency. We see this come through in our heavier 4K random read and write workload as well.
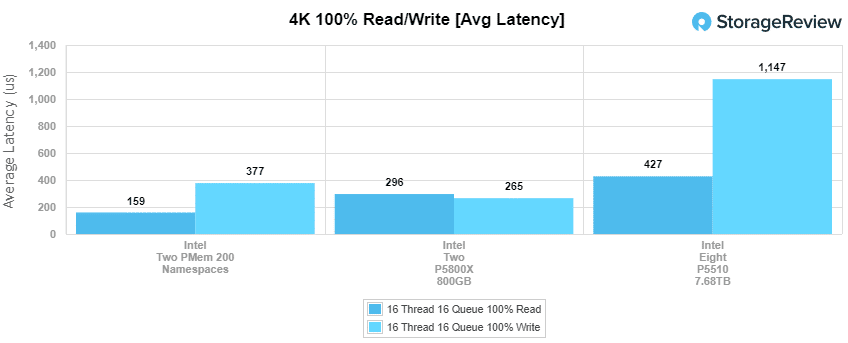
Intel PMem had the lowest read latency measuring 159 microseconds, followed by the two P5800X SSDs with 296 microseconds, and the eight P5510 SSDs at the back with 427 microseconds. Write latency had the two P5800X SSDs in the lead with 265 microseconds, with PMem trailing with 377 microseconds, and the eight traditional P5510 SSDs with 1.147ms.
Moving up the blocksize to our 8K 70/30 workload we look at the three different storage types and how they respond to an ever-increasing thread and queue count.
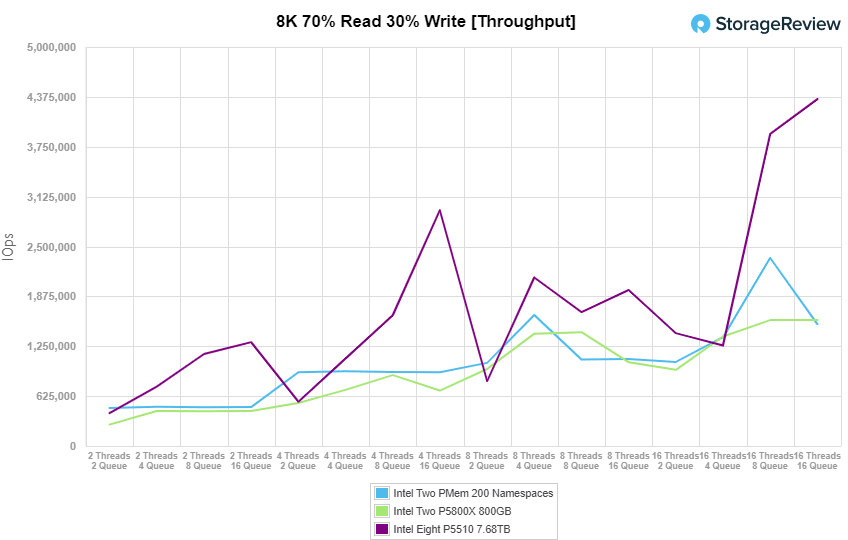
In terms of peak performance, the group of eight Intel P5510 SSDs really stretched its legs and offered some impressive peak numbers. At the top, it maxed out with 4.34M IOPS at 16T/16Q, although what’s interesting is seeing where PMem and the two P5800X were able to jump ahead slightly at some of the lower thread and queue points.
Switching the focus to average latency we see a different picture painted across the different storage types. Intel PMem, while it didn’t have the highest throughput, was able to squeak by with some of the lowest average latency in this test, followed closely by the P5800X SSDs. The eight P5510 SSDs at a much higher (relatively) latency level than the two Optane technologies, even though they did offer the highest throughput by far.
Next up we move over to our sequential workloads first starting with our 8K transfer size.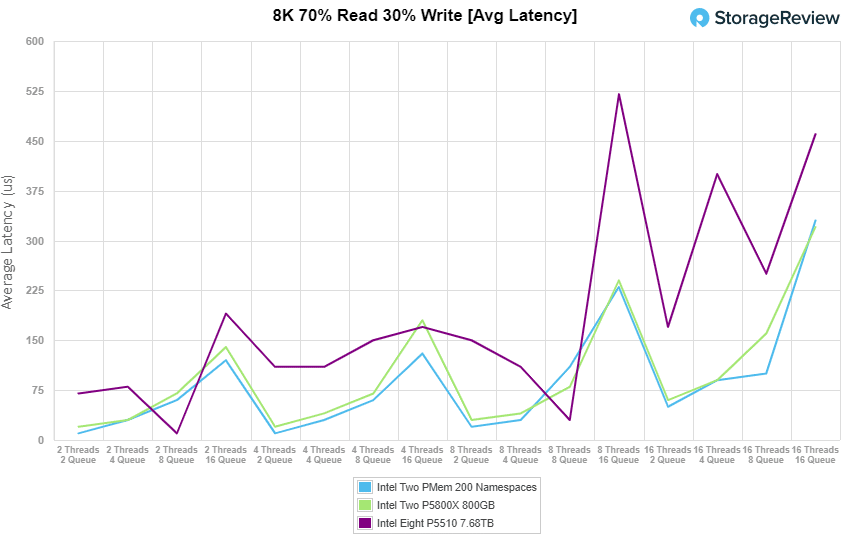
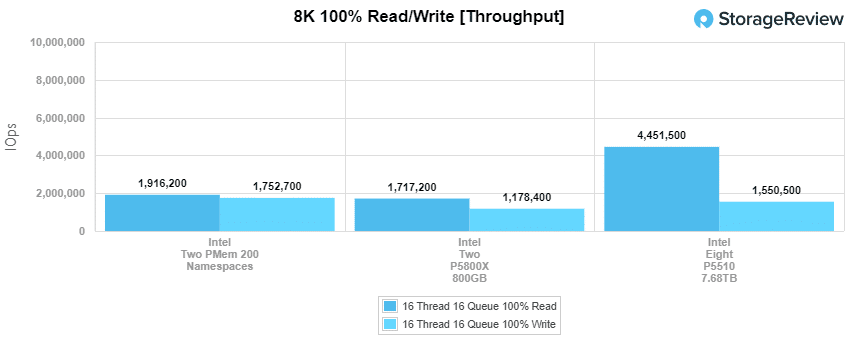
The group of eight Intel P5510 SSDs easily topped out this test with 4.45M IOPS, followed by PMem with 1.92M IOPS, trailed by the two P5800X SSDs with 1.71M IOPS. In write, PMem came in at the top with 1.75M IOPS, followed by the eight P5510 SSDs with 1.55M IOPS followed by the two P5800X SSDs with 1.18M IOPS.
In our last test, we look at peak bandwidth from the three different storage mediums. With both U.2 device types, some of the limited top-end comes from the number of lanes for each deployment.
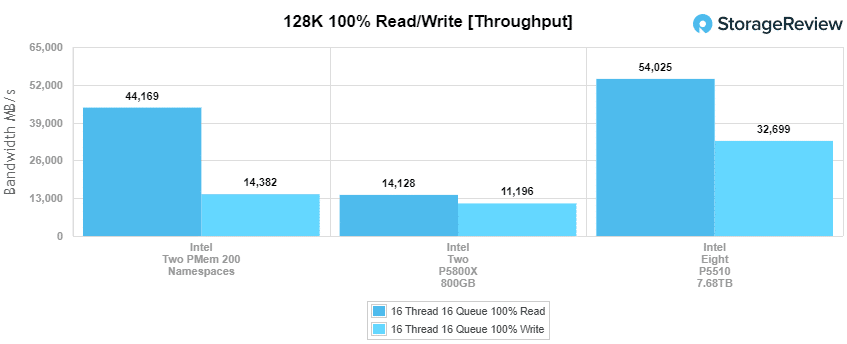
Starting off at the top in read bandwidth the eight P5510s came in with an impressive 54GB/s, followed by PMem with two namespaces offering 44GB/s, and the two P5800X SSDs trailing with 14GB/s read. It’s interesting to see just how high PMem can go when it comes to bandwidth. Switching to large-block write the eight P5510 SSDs came in at the top with 32.7GB/s, followed by PMem with 14.3GB/s, and then the two P5800X SSDs with 11.1GB/s. Overall very impressive numbers across the board.
Conclusion
Intel has been hard at work with Optane over the last few years with both the PMem and SSD variants. It’s clear to see that this storage technology is fundamentally important to them as they weave together a comprehensive Intel platform story in an effort to fend off AMD in the data center. And for mission-critical workloads, the results bear this out. For storage tiering, the P5800X neatly sits on top of the NVMe device hierarchy, seeing a gigantic boost in performance over the previous generation model thanks largely in part to PCIe Gen4. This boost is so big in fact that it starts to come close to the throughput, but not bandwidth, offered by PMem.
Throughout our testing, we saw exactly what we expected to see. PMem showed tremendous performance value when it comes to latency and throughput at low queue depths. It also offers huge bandwidth gains in read performance. The P5800X Optane SSD, even in deployments of two, starts to get really close to PMem across the board. This allows the P5800X to be a fantastic pairing to TLC or QLC drives in a solution that can leverage them as a cache or tier.
No matter where we look at the Intel Gen3 Xeon platform, there is a lot to love when it comes to storage. Our findings are highlighted by PMem’s immense read bandwidth topping 44GB/s read, and 10-microsecond latency in low-queue depth 4K random read and write workloads. The P5800X offers similar latency benefits, with a wider reach in the more common U.2 bay, measuring roughly double the latency of Intel PMem at low queue and thread counts. Even the P5510 SSDs showed their strength when it came to higher-queue workloads, offering chart-topping numbers in sequential or random-IO benchmarks.
The bottom line is that the latest round of Intel storage devices, both PMem and SSDs, have made substantive advances when compared to the prior generation products. This is especially true now that Intel is able to deliver the faster BUS for DRAM and the PCIe Gen4 slots. With this bare metal data, we can see the specific spots where each technology excels. Understanding this data will let system builders intelligently design platforms that can make any application excel.


 Amazon