

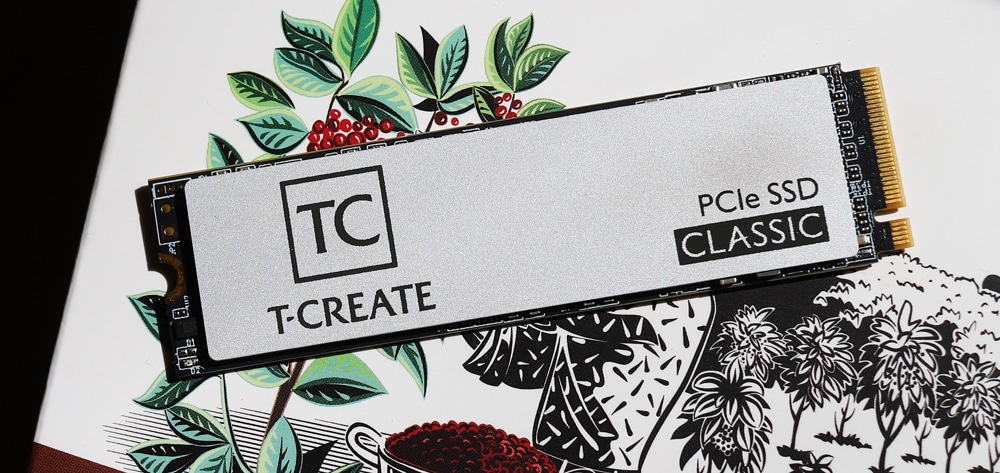
The TEAMGROUP T-CREATE CLASSIC is the company’s newest PCIe SSD to hit the market and is the Gen3 model of the line (there’s also a Gen4 version). Though this NVMe drive is certainly an entry-level consumer release, the company claims that the T-CREATE CLASSIC is designed specifically for the creative professionals whose daily tasks include the simultaneous use of multiple programs. Featuring 3D TLC flash, the DRAM-less T-CREATE drive is equipped with an RTS5763DL controller and comes in capacities of 1TB and 2TB.
For performance, TEAMGROUP expects their new drive to reach speeds up to 2.1GB/s read and 1.7GB/s write for the 1TB capacity (using the Crystal Disk Mark benchmarking software), while both models are quoted to deliver a maximum of 220,000 IOPS read and 200,000 IOPS write. It also features an MTBF rating of 1.5 million hours and supports high-rate LDPC (Low-Density Parity Check) ECC functionality to help ensure data safety and integrity.
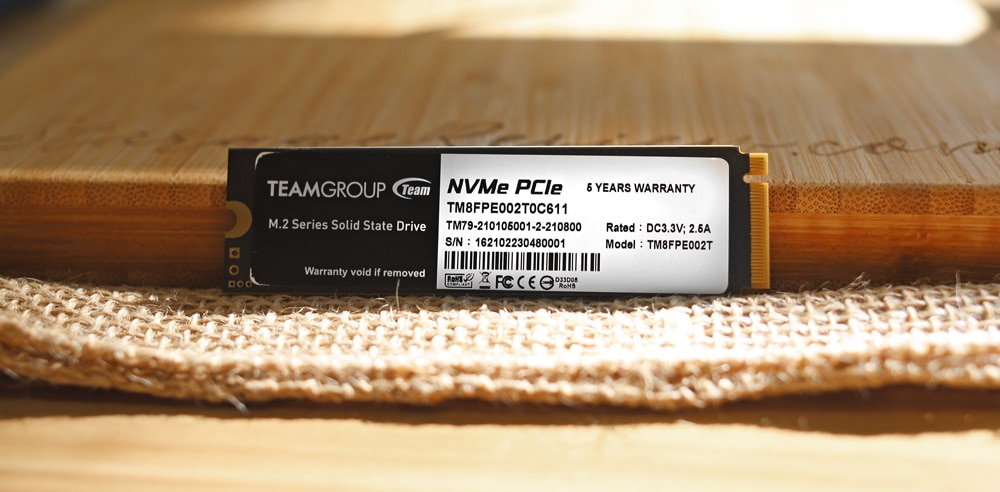
Other than that, TEAMGROUP doesn’t go into many details about the drive. After looking over the drive, we did discover that it does feature a Realtek RTS5763DL controller. This a client-based controller launched in 2018 that can feature a range of different NAND configurations. It should be noted that Realtek no longer features storage controllers on its website.
The white label on the drive doubles as a heat sync, it’s actually constructed from aluminum. It can be easily removed if need be. The drive is backed by a 5-year warranty, and goes for roughly $100 (1TB) and $200 (2TB), respectively.
TEAMGROUP T-CREATE CLASSIC Specifications
| Model | CLASSIC PCIe SSD |
| Interface | PCIe Gen3x4 with NVMe 1.3 |
| Capacity | 1TB / 2TB |
| Voltage | DC +3.3V |
| Operation Temperature | 0˚C ~ 70˚C |
| Storage Temperature | -40˚C ~ 85˚C |
| Terabyte Written | 1TB: 600TB 2TB: 1000TB[2] |
| Performance | Crystal Disk Mark:
IOPS:
|
| Weight | 11g |
| Dimensions | 80.0(L) x 22.0(W) x 3.7(H) mm |
| Humidity | RH 90% under 40°C (operational) |
| Vibration | 80Hz~2,000Hz/20G |
| Shock | 1500G/0.5ms |
| MTBF | 1,500,000 hours |
| Warranty | 5-year limited warranty |
TEAMGROUP T-CREATE CLASSIC Performance
Testbed
The test platform leveraged in these tests is a Dell PowerEdge R740xd server. We measure SATA performance through a Dell H730P RAID card inside this server, although we set the card in HBA mode only to disable the impact of the RAID card cache. NVMe is tested natively through an M.2 to PCIe adapter card. The methodology used better reflects end-user workflow with the consistency, scalability, and flexibility testing within virtualized server offers.
A large focus is put on drive latency across the entire load range of the drive, not just at the smallest QD1 (Queue-Depth 1) levels. We do this because many of the common consumer benchmarks don’t adequately capture end-user workload profiles.
SQL Server Performance
Each SQL Server VM is configured with two vDisks: 100GB volume for boot and a 500GB volume for the database and log files. From a system resource perspective, we configured each VM with 16 vCPUs, 64GB of DRAM and leveraged the LSI Logic SAS SCSI controller. While our Sysbench workloads tested previously saturated the platform in both storage I/O and capacity, the SQL test is looking for latency performance.
This test uses SQL Server 2014 running on Windows Server 2012 R2 guest VMs and is stressed by Quest’s Benchmark Factory for Databases. StorageReview’s Microsoft SQL Server OLTP testing protocol employs the current draft of the Transaction Processing Performance Council’s Benchmark C (TPC-C), an online transaction-processing benchmark that simulates the activities found in complex application environments.
The TPC-C benchmark comes closer than synthetic performance benchmarks to gauging the performance strengths and bottlenecks of storage infrastructure in database environments. Each instance of our SQL Server VM for this review uses a 333GB (1,500 scale) SQL Server database and measures the transactional performance and latency under a load of 15,000 virtual users.
SQL Server Testing Configuration (per VM)
- Windows Server 2012 R2
- Storage Footprint: 600GB allocated, 500GB used
- SQL Server 2014
- Database Size: 1,500 scale
-
-
- Virtual Client Load: 15,000
- RAM Buffer: 48GB
-
- Test Length: 3 hours
-
-
- 2.5 hours preconditioning
- 30 minutes sample period
-
Looking at SQL Server average latency, the CLASSIC had an average latency of 50ms placing it near at the very bottom of the leaderboard (by a large margin and just above the Samsung 980).

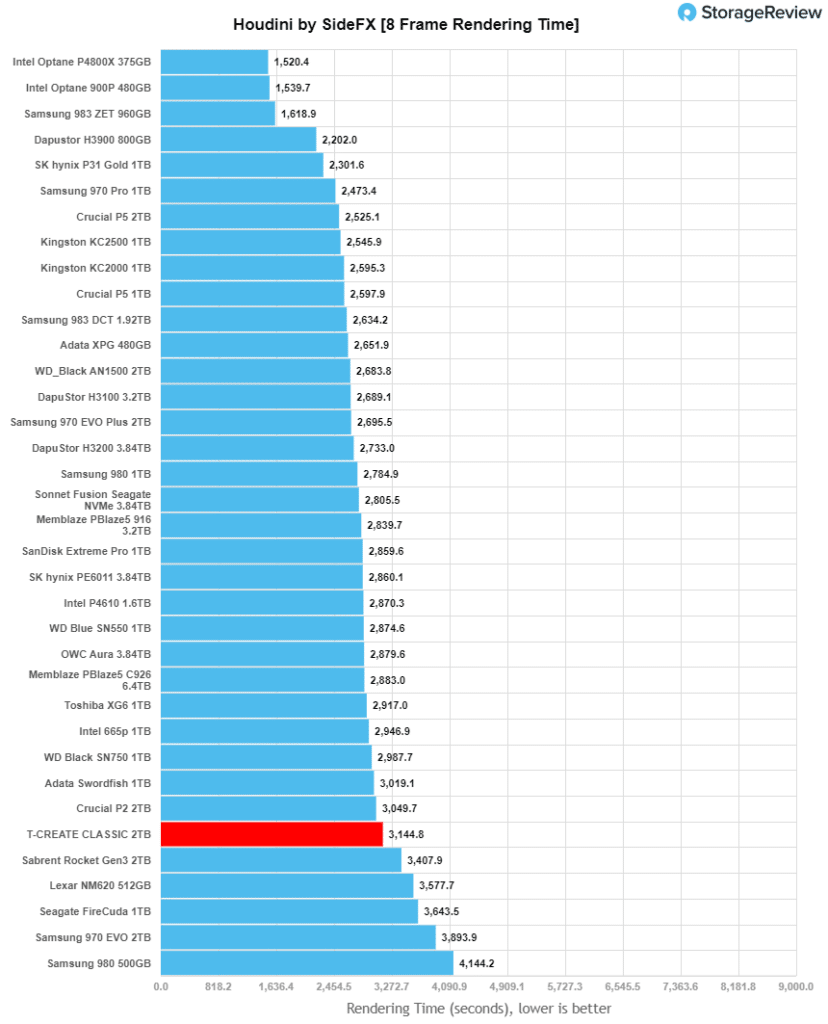
Houdini by SideFX
The Houdini test is specifically designed to evaluate storage performance as it relates to CGI rendering. The testbed for this application is a variant of the core Dell PowerEdge R740xd server type we use in the lab with dual Intel 6130 CPUs and 64GB DRAM. In this case, we installed Ubuntu Desktop (ubuntu-16.04.3-desktop-amd64) running bare metal. The output of the benchmark is measured in seconds to complete, with fewer being better.
The Maelstrom demo represents a section of the rendering pipeline that highlights the performance capabilities of storage by demonstrating its ability to effectively use the swap file as a form of extended memory. The test does not write out the result data or process the points in order to isolate the wall-time effect of the latency impact to the underlying storage component. The test itself is composed of five phases, three of which we run as part of the benchmark, which is as follows:
- Loads packed points from disk. This is the time to read from the disk. This is single-threaded, which may limit overall throughput.
- Unpacks the points into a single flat array in order to allow them to be processed. If the points do not have a dependency on other points, the working set could be adjusted to stay in-core. This step is multi-threaded.
- (Not Run) Processes the points.
- Repacks them into bucketed blocks suitable for storing back to disk. This step is multi-threaded.
- (Not Run) Writes the bucketed blocks back out to disk.
Here, we see the Gen3 CLASSIC hit 3,144.82 seconds, which places it near the bottom part of the leaderboard.
VDBench Workload Analysis
When it comes to benchmarking storage devices, application testing is best, and synthetic testing comes in second place. While not a perfect representation of actual workloads, synthetic tests do help to baseline storage devices with a repeatability factor that makes it easy to do apples-to-apples comparison between competing solutions. These workloads offer a range of different testing profiles ranging from “four corners” tests, common database transfer size tests, to trace captures from different VDI environments.
All of these tests leverage the common vdBench workload generator, with a scripting engine to automate and capture results over a large compute testing cluster. This allows us to repeat the same workloads across a wide range of storage devices, including flash arrays and individual storage devices. Our testing process for these benchmarks fills the entire drive surface with data, then partitions a drive section equal to 5% of the drive capacity to simulate how the drive might respond to application workloads. This is different than full entropy tests which use 100% of the drive and take them into a steady state. As a result, these figures will reflect higher-sustained write speeds.
Profiles:
- 4K Random Read: 100% Read, 128 threads, 0-120% iorate
- 4K Random Write: 100% Write, 64 threads, 0-120% iorate
- 64K Sequential Read: 100% Read, 16 threads, 0-120% iorate
- 64K Sequential Write: 100% Write, 8 threads, 0-120% iorate
Comparables for this review:
- Crucial P5
- Sabrent Rocket Gen3
- WD Black
- SK hynix Gold P31
- Samsung 970 EVO Plus 1TB
- Samsung 980 1TB
- Lexar NM620
First up is random 4K read. Here the CLASSIC was dead last by a hugely significant margin, as it only was able to reach a peak of 5,988 IOPS (at 513.7 µs) with serious spikes along the way. To show just how slow this result was, the next best drive hit 83,401 IOPS, which was already far from the leaders’ performance.
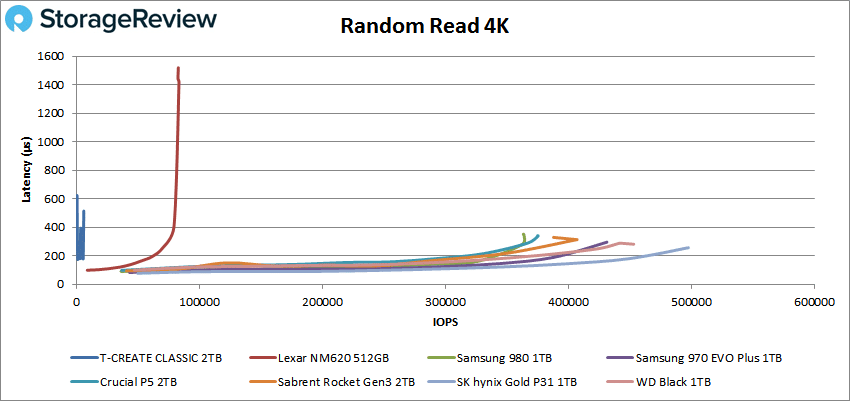
After a retest to see if the low 4K read performance was an anomaly, we saw the same low speed again. It appears the drive gets so bogged down from the 4K write workload before the reads, that it can’t recover in time before the 4K read workload starts. As this is the process all other drives are tested with, we will be keeping this number to ensure fair results for other drives.
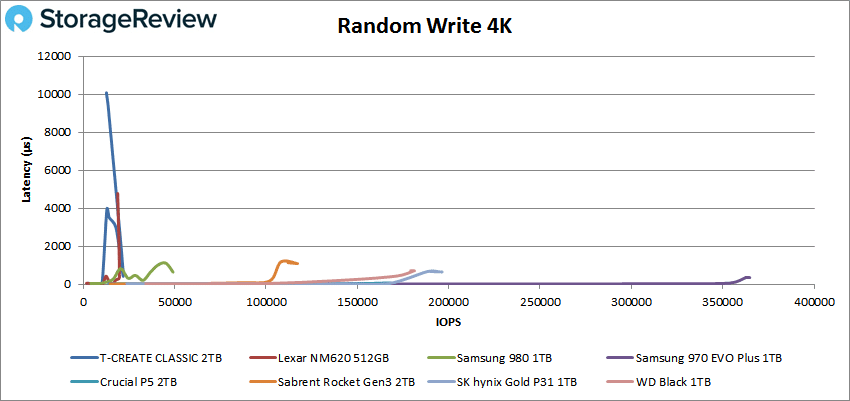
For 4K write the CLASSIC remained in last place with a peak of 24,580 IOPS before it took a huge hit in performance, ending at 12,700 IOPS at a latency of just over 10,000 µs.
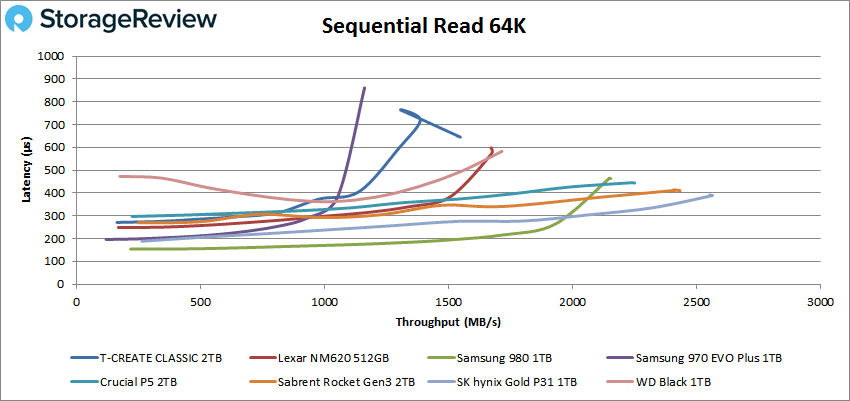
Switching over to our 64K sequential workloads, the CLASSIC came in just behind the Lexar drive for 2nd-last in reads with a peak of 24,731 IOPS or 1.53GB/s at a latency of 646.2µs.
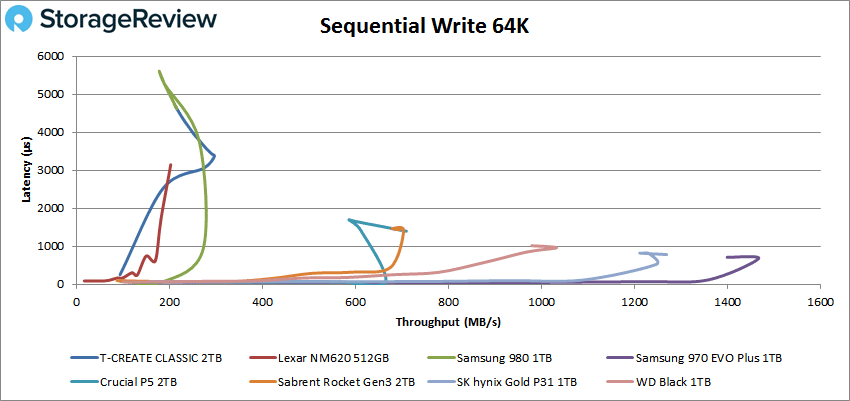
In 64K write, the TEAMGROUP showed a peak of 4,741 IOPS or 296.3MB/s at a latency of 3,359 µs before dropping off to 3,399 IOPS at the end.
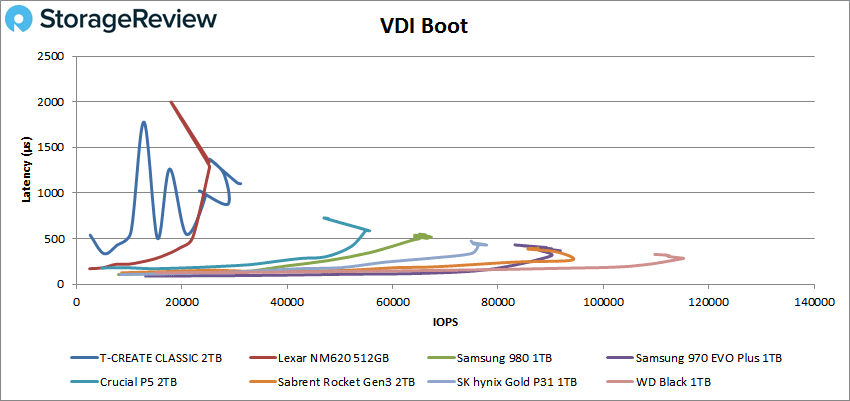
Next, we looked at our VDI benchmarks, which are designed to tax the drives even further. Here, it’s obvious that the TEAMGROUP CLASSIC struggled in all of these tests; however, like all entry-level drives, it was expected that read performance is the focus. Nonetheless, these tests include Boot, Initial Login, and Monday Login.
For the Boot test, the CLASSIC showed a peak of about 31,180 IOPS at 1,102µs, placing it behind only in front of the Lexar drive.
VDI Initial Login had the CLASSIC place last again with a peak of 7,574 IOPS and a latency of 3,189µs before it took a huge dip in performance ending up with 5,733 IOPS.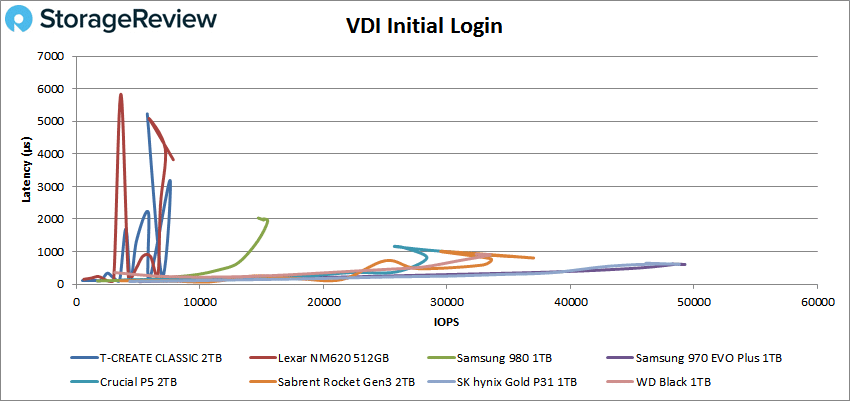
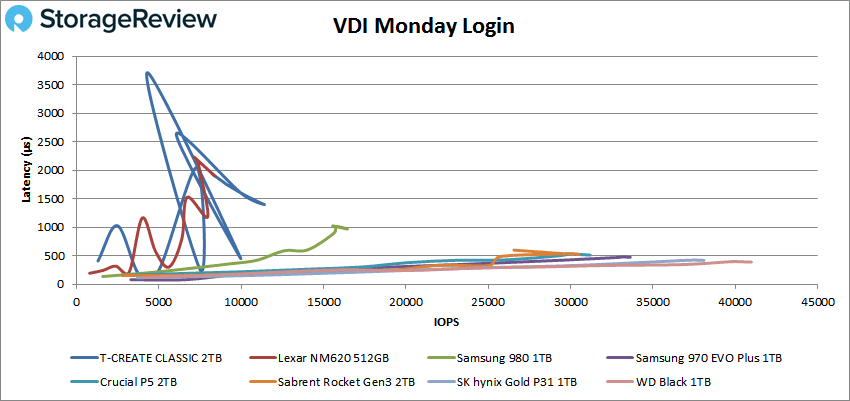
Finally, VDI Monday Login saw the TEAMGROUP drive with its most uneven results yet as you can see in the graph below. The drive peaked at 11,421 (at 1.397µs) before taking its last performance spike, which ended up at 8,252 IOPS.
Conclusion
The TEAMGROUP T-CREATE CLASSIC is the company’s latest consumer-grade M.2 SSD to hit the market, indicating that it is best suited for creative professionals like video editing and image design. However, it is certainly more entry-level than what TEAMGROUP describes on their product page, as it’s more appropriate for consumers looking to upgrade from an old HDD-based system (it’s probably best to avoid using this drive in any demanding workload environment).
That said, it leverages the PCIe Gen3 interface and quoted speeds up to 2.1GB/s read and 1.7GB/s write. The drive also uses an aging Realtek RTS5763DL controller, features built-in LDPC for reliability, and comes in just two capacity models (1TB and 2TB).
For performance, we ran Houdini by SFX, SQL and VDBench tests. The T-CREATE CLASSIC showed very disappointing results, placing at the bottom of the leaderboard in virtually every test (and sometimes by a huge margin). First up is Houdini, where rendered in at 3,144.82 seconds, which placed it near the bottom of the leaderboard. Looking at Peak VDBench scores, the CLASSIC recorded 5,988 IOPS in 4K read (the lowest we’ve ever seen in a few years), 24,580 IOPS in 4K write, 1.53GB/s in 64K read, and 296.3MB/s in 64K write. In our VDI tests, the drive hit 31,180 IOPS in boot, 7,574 IOPS IOPS in Initial Login, and 11,421 in Monday Login.
The TEAMGROUP T-CREATE CLASSIC is a drive meant for creative (i.e., intensive) applications; however, as you can see from the performance above, it really shouldn’t be used for that, or much of anything to be honest. Overall, the CLASSIC might have satisfactory performance in day-to-day use, but it must be dirt cheap even for this modest need. To spend $100-$200 on a drive like this when there are so many other faster and less expensive choices readily available is lunacy.


 Amazon