

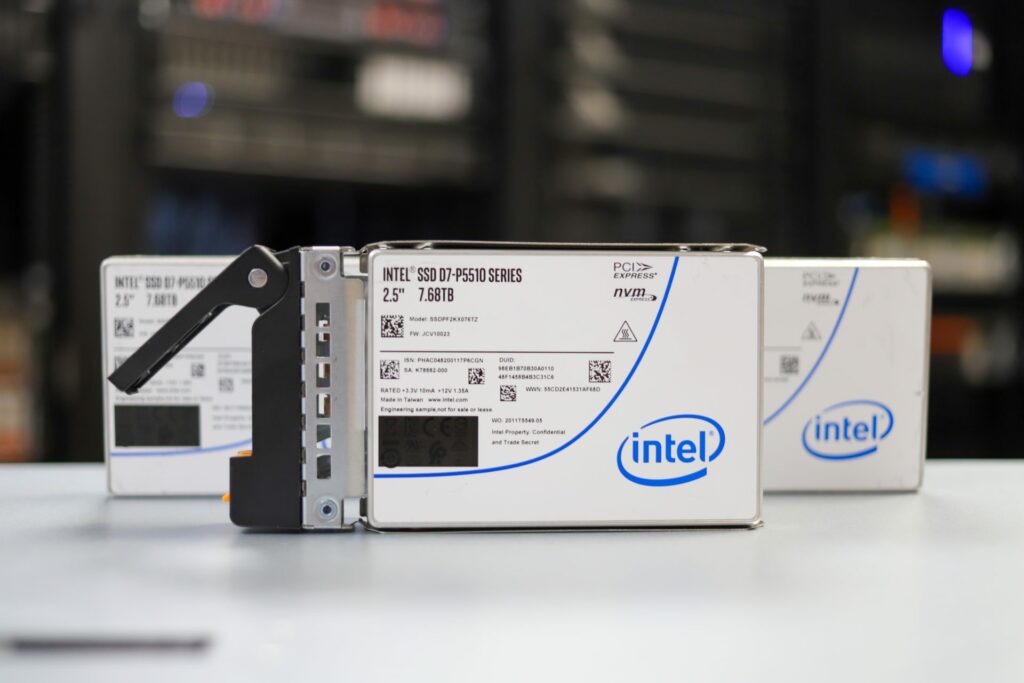
The Intel SSD D7-P5510 is dubbed the world’s first 144-Layer TLC drive (first to market) and is the latest addition to the company’s family of data center drives, which focus on broad cloud workloads at reduced costs. Available in a U.2 form factor in two models (3.84TB and 7.68TB), the P5510 utilizes TLC NAND, which means it fits an ideal spot for performance per dollar.
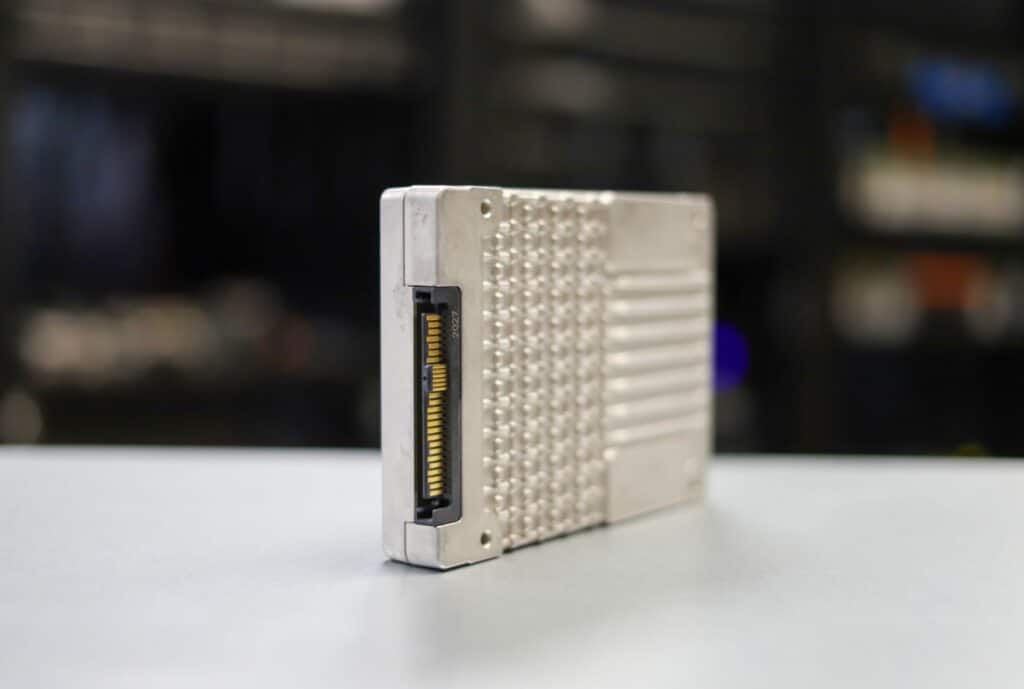
The NAND technology also allows for much higher capacity points compared to other types of SSDs like Optane drives. In addition, the P5510 features the PCIe 4.0 interface, which means servers that use Intel’s 3rd Gen Xeon CPUs will be able to leverage its performance potential. The Intel data center drive also comes with numerous enterprise features and enhancements, such as dynamic namespace management, security, and data integrity/protection, and is endurance-rated at 1 drive-write per day.
As far as performance goes, the P5510 quotes performance of up to 7GB/s read and 4.19GB/s write, with random performance up to 930K IOPS read and 190K IOPS write. This is a vast improvement over the P5500 (launched earlier in Q2 2020), indicating double the performance in sequential reads, 50% lower latencies, and a 50% improvement in mixed workload IOPs (70% read, 30% write).
Intel SSD D7-P5510 Enterprise Features
As we mentioned above, the Intel SSD D7-P5510 comes with a range of firmware enhancements, all of which are designed to improve workflow efficiency (particularly with IT) and data security. For example, Dynamic namespace management allows for more users and scale deployment, while security features like TCG Opal 2.0 and a built-in AES-XTS 256-bit encryption engine help to add more protection to sensitive server data. The drive also features enhanced SMART monitoring, which uses an in-band mechanism and out-of-band access so that it can report drive health status without impeding on I/O data flow.
Telemetry 2.0 is another important feature with the P5510. This technology allows for a wide range of stored data to be accessible via intelligent error tracking and logging, which helps IT to better locate and mitigate data issues while supporting accelerated qualification cycles. Moreover, its optimized TRIM architecture runs as a background process so that it does not interfere with workloads.
Lastly, the drive’s Power-Loss imminent (PLI) protection scheme features include built-in self-testing and helps to protect drive/data integrity during sudden power loss. This coupled with its end-to-end data path protection scheme brings a lot of peace of mind to organizations when it comes to the integrity of their data centers.
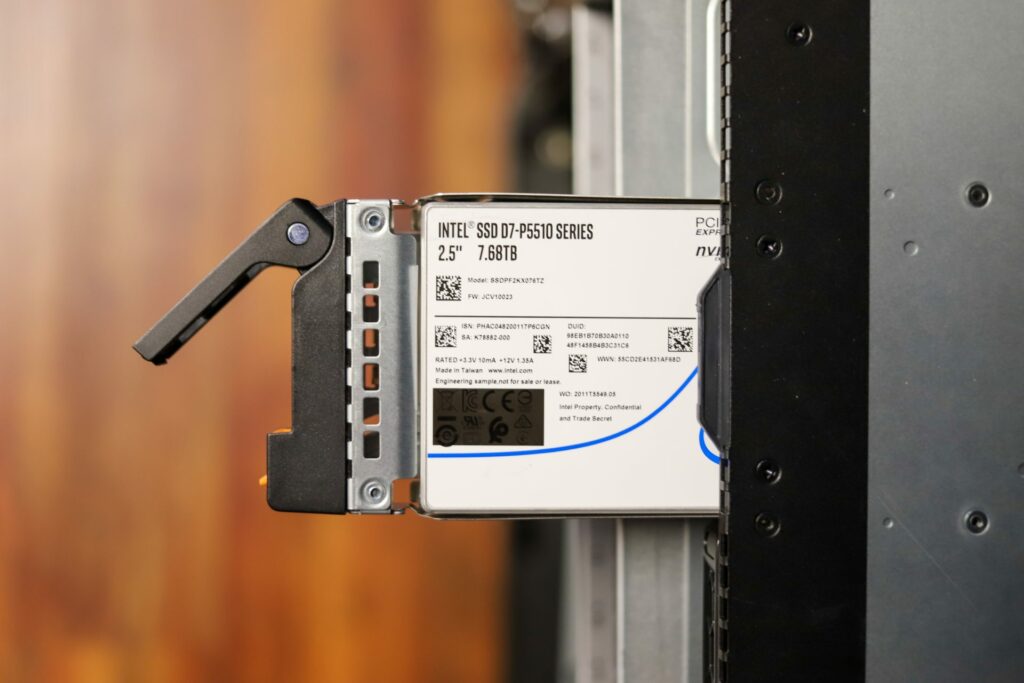
Backed by a 5-year warranty, the Intel SSD D7-P5510 Series is available in capacities of 1.92 TB, 3.84 TB, 7.68 TB. We will be looking at the 7.86TB model.
Intel SSD D7-P5510 Specifications
| Model | Intel SSD D7-P5510 Series |
| Capacity and Form Factor | U.2 15mm: 3.84TB, 7.68TB |
| Interface | PCIe 4.0 x4, NVMe 1.3c |
| Media | Intel 3D NAND Technology, 96-layer, TLC |
| Performance |
|
| Endurance | 1 DWPD (up to 14 PBW) |
| Reliability |
|
| Power | Max Avg. Active Write: 18W
Idle: 5W |
| Warranty | 5-year limited warranty |
| Temperature |
|
| Weight | 156g |
Intel SSD D7-P5510 Performance
Testing Background and Comparables
The StorageReview Enterprise Test Lab provides a flexible architecture for conducting benchmarks of enterprise storage devices in an environment comparable to what administrators encounter in real deployments. The Enterprise Test Lab incorporates a variety of servers, networking, power conditioning, and other network infrastructure that allows our staff to establish real-world conditions to accurately gauge performance during our reviews.
We incorporate these details about the lab environment and protocols into reviews so that IT professionals and those responsible for storage acquisition can understand the conditions under which we have achieved the following results. None of our reviews are paid for or overseen by the manufacturer of equipment we are testing. Additional details about the StorageReview Enterprise Test Lab and an overview of its networking capabilities are available on those respective pages.
SQL Server Performance
Each SQL Server VM is configured with two vDisks: 100GB volume for boot and a 500GB volume for the database and log files. From a system resource perspective, we configured each VM with 8 vCPUs, 64GB of DRAM and leveraged the LSI Logic SAS SCSI controller. While our Sysbench workloads tested previously saturated the platform in both storage I/O and capacity, the SQL test is looking for latency performance.
This test uses SQL Server 2014 running on Windows Server 2012 R2 guest VMs and is stressed by Quest’s Benchmark Factory for Databases. StorageReview’s Microsoft SQL Server OLTP testing protocol employs the current draft of the Transaction Processing Performance Council’s Benchmark C (TPC-C), an online transaction-processing benchmark that simulates the activities found in complex application environments. The TPC-C benchmark comes closer than synthetic performance benchmarks to gauging the performance strengths and bottlenecks of storage infrastructure in database environments. Each instance of our SQL Server VM for this review uses a 333GB (1,500 scale) SQL Server database and measures the transactional performance and latency under a load of 15,000 virtual users.
SQL Server Testing Configuration (per VM)
- Windows Server 2012 R2
- Storage Footprint: 600GB allocated, 500GB used
- SQL Server 2014
-
- Database Size: 1,500 scale
- Virtual Client Load: 15,000
- RAM Buffer: 48GB
- Test Length: 3 hours
-
- 2.5 hours preconditioning
- 30 minutes sample period
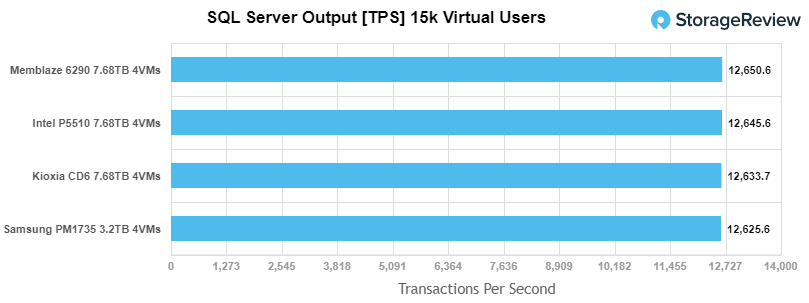
For our SQL Server transactional benchmark, the Intel P5510 placed just behind the Memblaze 6920 and Samsung PM1735 drives with 12,645.61 TPS.
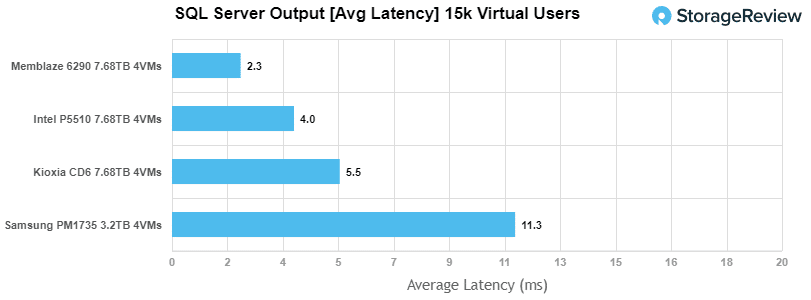
With SQL Server average latency, the Intel P5510 posted a solid average latency of just 4ms, placing second.
Sysbench Performance
The next application benchmark consists of a Percona MySQL OLTP database measured via SysBench. This test measures average TPS (Transactions Per Second), average latency, and average 99th percentile latency as well.
Each Sysbench VM is configured with three vDisks: one for boot (~92GB), one with the pre-built database (~447GB), and the third for the database under test (270GB). From a system resource perspective, we configured each VM with 8 vCPUs, 60GB of DRAM and leveraged the LSI Logic SAS SCSI controller.
Sysbench Testing Configuration (per VM)
- CentOS 6.3 64-bit
- Percona XtraDB 5.5.30-rel30.1
-
- Database Tables: 100
- Database Size: 10,000,000
- Database Threads: 32
- RAM Buffer: 24GB
- Test Length: 3 hours
-
- 2 hours preconditioning 32 threads
- 1 hour 32 threads
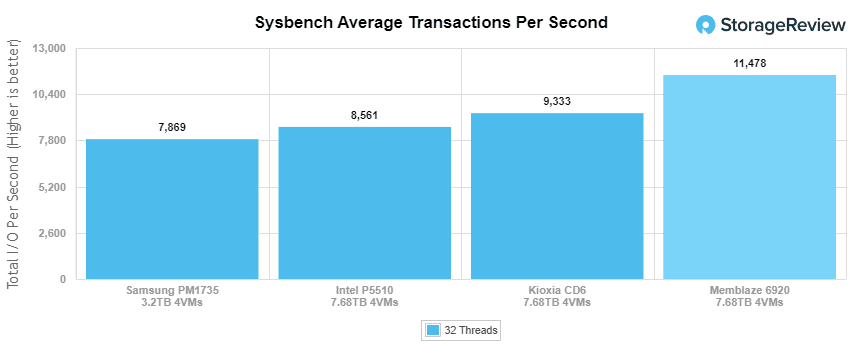
Looking at our Sysbench transactional benchmark, the Intel P5510 had 8,561.02 TPS, placing it third among the comparables.
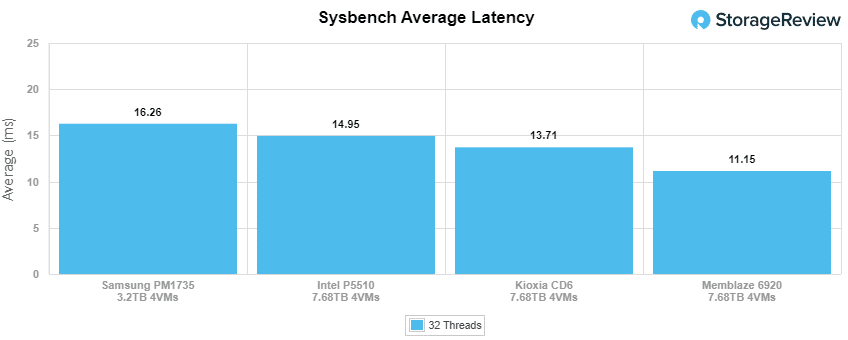
With Sysbench average latency, the P5510 posted 14.95ms, which placed in the middle of the leaderboard again.
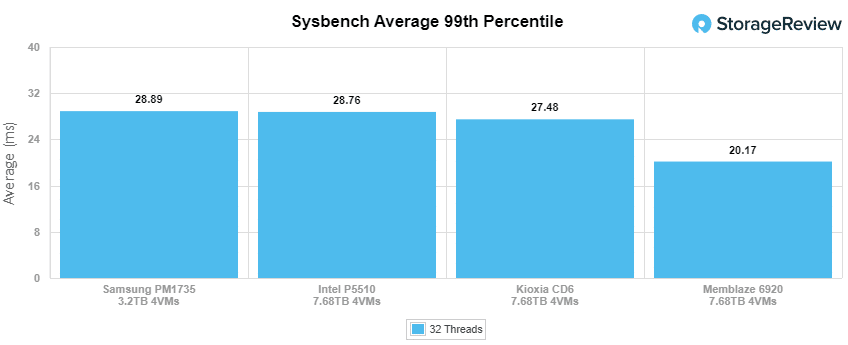
For our worst-case scenario latency (99th percentile) the P5510 showed 28.76ms, placing third.
VDBench Workload Analysis
When it comes to benchmarking storage devices, application testing is best, and synthetic testing comes in second place. While not a perfect representation of actual workloads, synthetic tests do help to baseline storage devices with a repeatability factor that makes it easy to do apples-to-apples comparisons between competing solutions. These workloads offer a range of different testing profiles ranging from “four corners” tests, common database transfer size tests, to trace captures from different VDI environments.
All of these tests leverage the common vdBench workload generator, with a scripting engine to automate and capture results over a large compute testing cluster. This allows us to repeat the same workloads across a wide range of storage devices, including flash arrays and individual storage devices. Our testing process for these benchmarks fills the entire drive surface with data, then partitions a drive section equal to 25% of the drive capacity to simulate how the drive might respond to application workloads. This is different than full entropy tests which use 100% of the drive and takes them into a steady state. As a result, these figures will reflect higher-sustained write speeds.
Profiles:
- 4K Random Read: 100% Read, 128 threads, 0-120% iorate
- 4K Random Write: 100% Write, 128 threads, 0-120% iorate
- 4K Random Read (high load): 100% Read, 512 threads, 0-120% iorate
- 4K Random Write (high load): 100% Write, 512 threads, 0-120% iorate
- 64K Sequential Read: 100% Read, 32 threads, 0-120% iorate
- 64K Sequential Write: 100% Write, 16 threads, 0-120% iorate
- 64K Sequential Read (high load): 100% Read, 64 threads, 0-120% iorate
- 64K Sequential Write (high load): 100% Write, 64 threads, 0-120% iorate
- Synthetic Database: SQL and Oracle
- VDI Full Clone and Linked Clone Traces
Comparables:
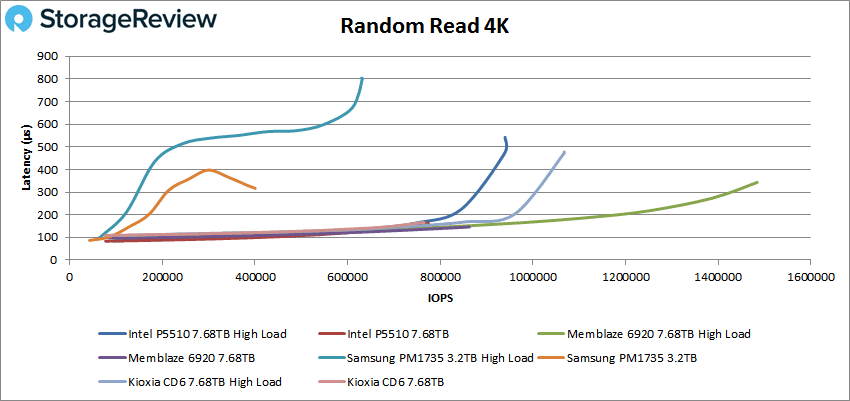
In our first VDBench Workload Analysis, Random 4K Read, the P5510 had a peak performance of 940k IOPS (high load) at a latency of 542µs. In a normal load, the Intel drive peaked at 774,422 IOPS with a latency of 165.6µs.
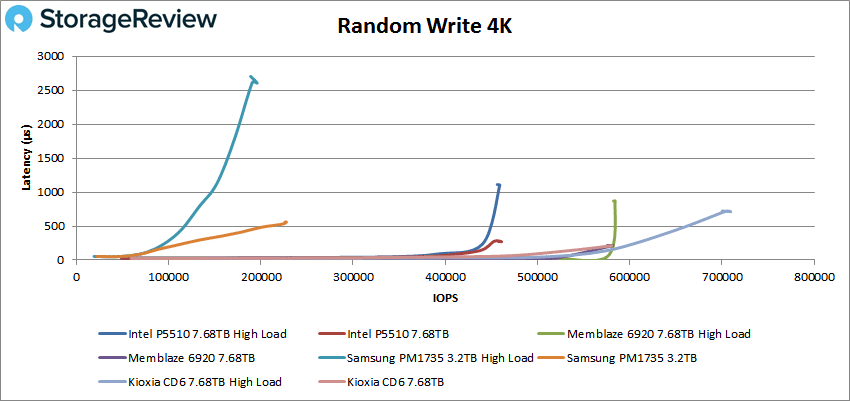
4K random write gave us a peak, as the P5510 took the second spot with a peak performance of 459k IOPS at a latency of 1,106µs during a high load. In a normal workload, the Intel drive posted a peak of 461,024 IOPS with a latency of 271.8µs.
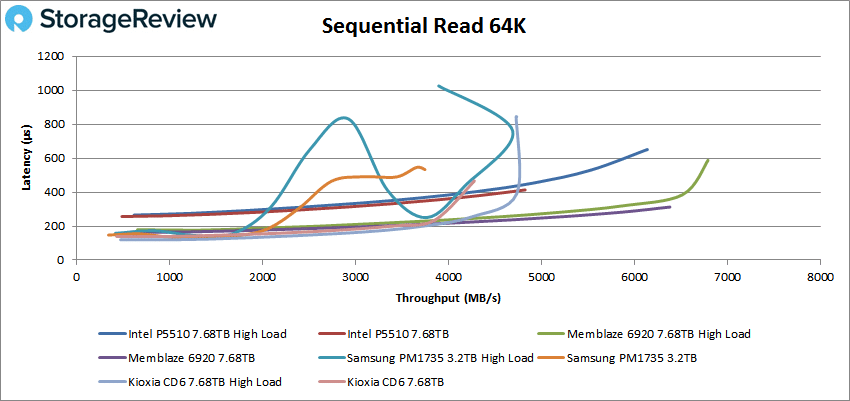
Switching over to 64k sequential workloads, the P5510 measured towards the top of the pack, peaking at 980k IOPS or 6.13GB/s with a latency of 650µs. During a normal load, the Intel performed well, peaking at 77,109 IOPS (or 4.82GB/s) with a latency of 413.1µs.
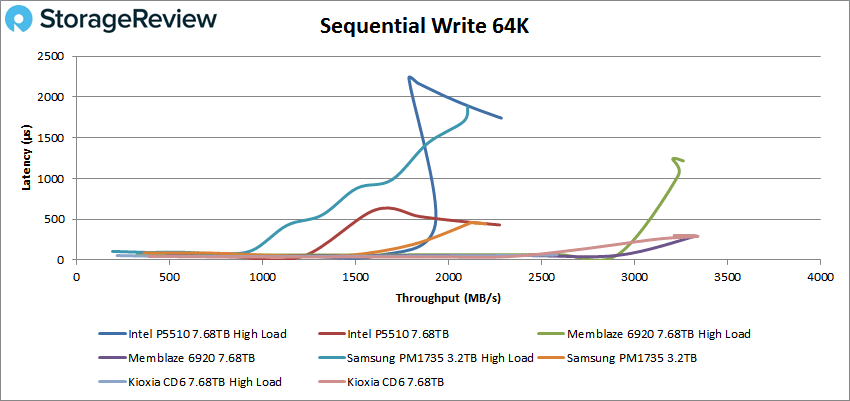
In 64K write, the P5510 saw strong performance again with 36,518 IOPS or about 2.23GB/s at a latency of 1,742µs during a high load. In a normal load, the Intel drive peaked at 36,378 IOPS (or 2.27GB/s) with latency at 431.8 µs.
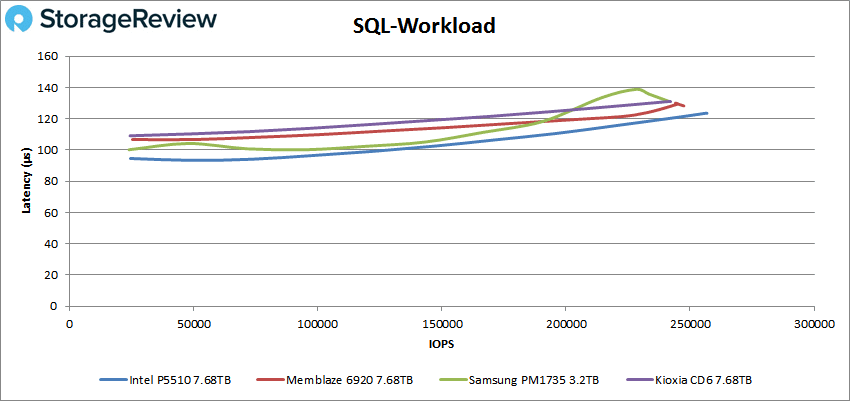
Our next set of tests are our SQL workloads: SQL, SQL 90-10, and SQL 80-20, all of which showed the P5510 with great results. Starting with SQL, the new Intel drive placed first with a peak performance of 256,571 IOPS at a latency of 123.6µs.
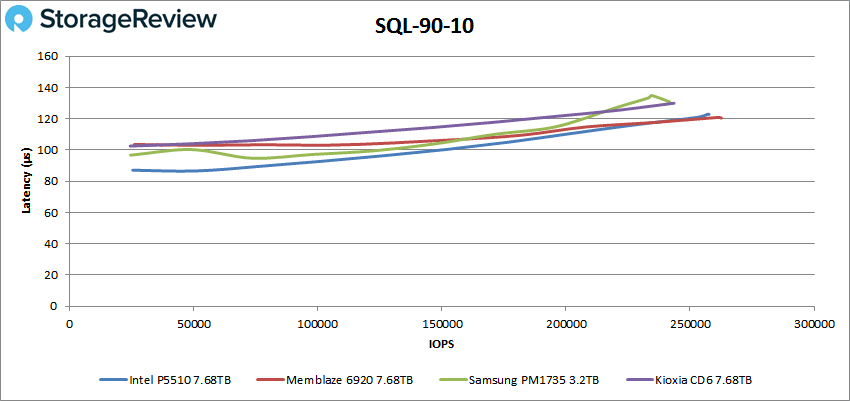
 SQL 90-10 saw the P5510 just a hair behind the Memblaze again for second with a peak performance of 257,298 IOPS at a latency of 123µs.
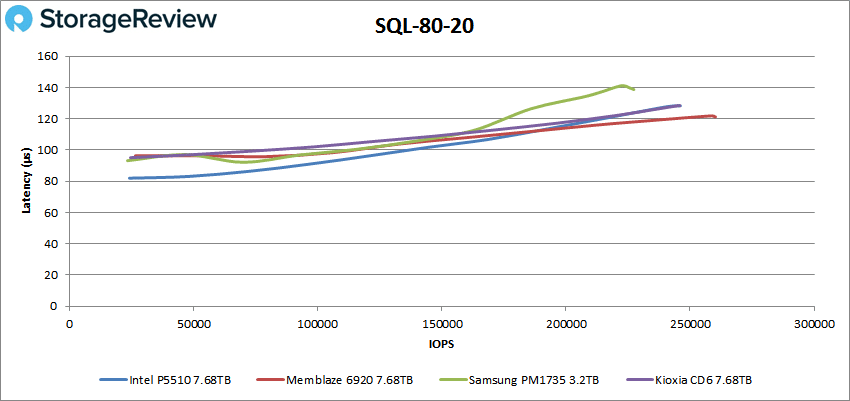
With SQL 80-20, the new Intel drive landed second again with a peak performance of 245,957 IOPS at a latency of 128.3µs, which was identical to the Kioxia and just behind the Memblaze.
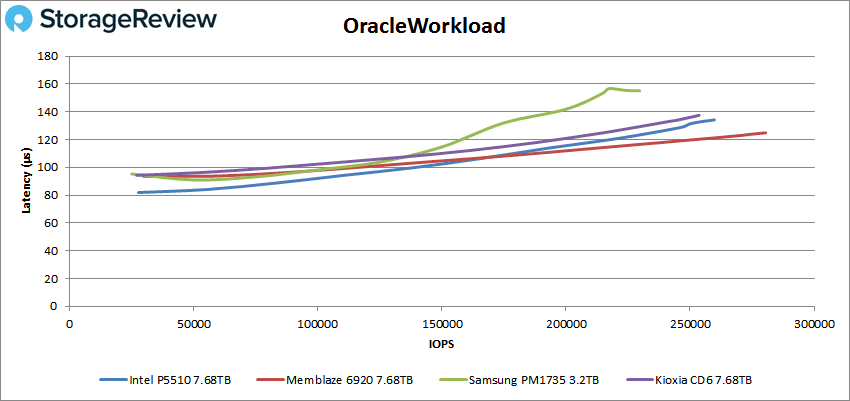
Next up are our Oracle workloads: Oracle, Oracle 90-10, and Oracle 80-20. Like with the SQL benchmarks, the Intel P5510 showed solid performance throughout the workloads. Starting with Oracle, the P5510 placed second with a peak performance of 259,799 IOPS at 134.2µs.
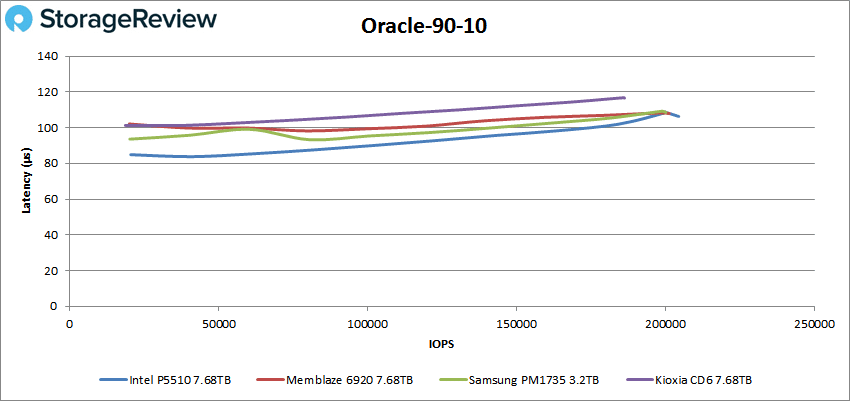
 For Oracle 90-10, the P5510 posted a peak score of 204,521 IOPS at a latency of 106.3µs, just edging out the Memblaze and Samsung drives.
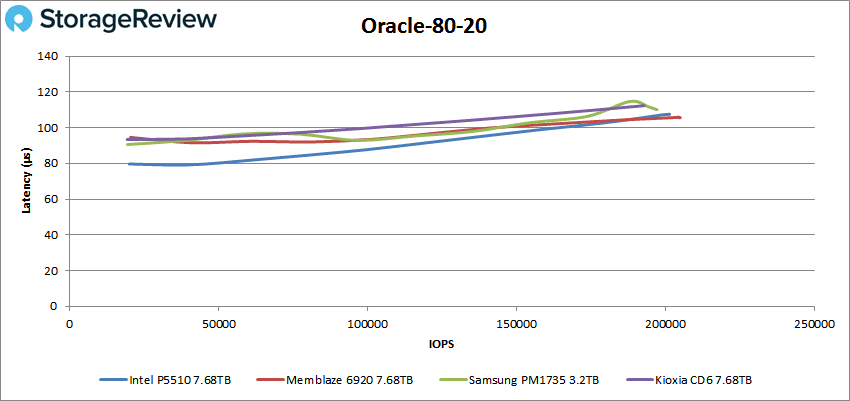
Looking at Oracle 80-20, the P5510 took second this time (though just a hair behind the speedy Memblaze) with a peak performance of 201,493 IOPS at 107.5µs.
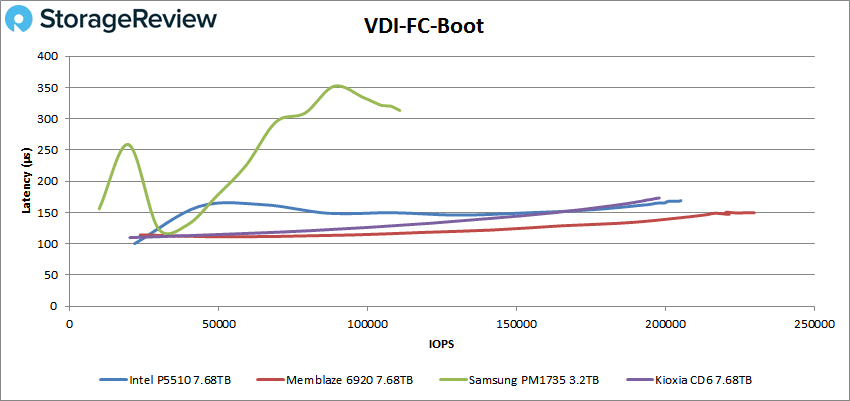
Next, we switched over to our VDI clone test, Full and Linked. For VDI Full Clone (FC) Boot, the Intel P5510 placed second trailing the Memblaze drive with a peak of 204,466 IOPS at a latency of 168.1µs.
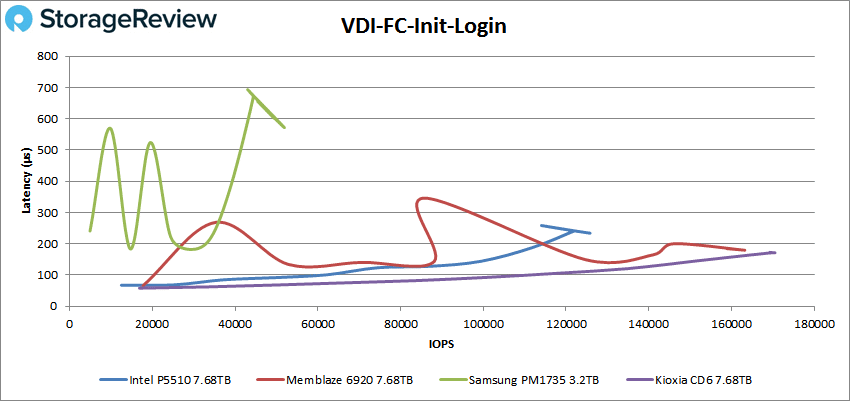
 VDI FC Initial Login, the P5510 fell to third place with a peak of 125,104 IOPS with 235.5µs for latency, showing a small spike in performance at the end.
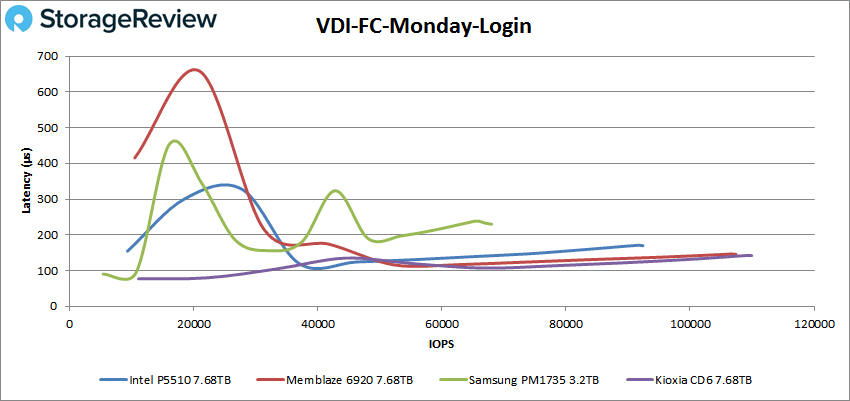
With VDI FC Monday Login, the P5510 placed third again with a peak of 92,234 IOPS with a latency of 169.8µs.
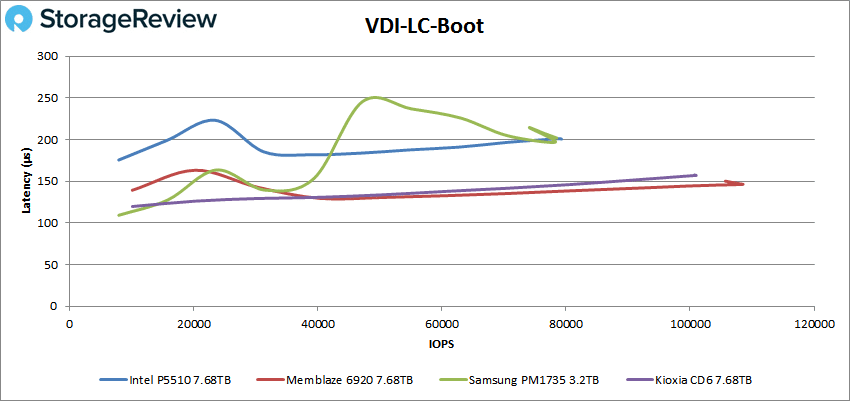
For VDI Linked Clone (LC) Boot, the P5510 fell back from the leaders with a peak of 79,028 IOPS at a latency of 201.2µs.
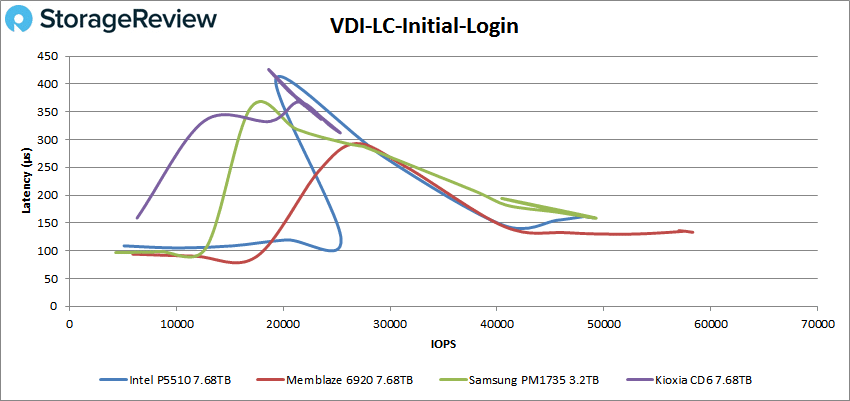
 VDI LC Initial Login saw the Intel at second place with 49,041 IOPS at a latency of 159.4µs.
Finally, with VDI LC Monday Login, the P5510 showed a peak performance of 70,739 IOPS at a latency of 222.3µs.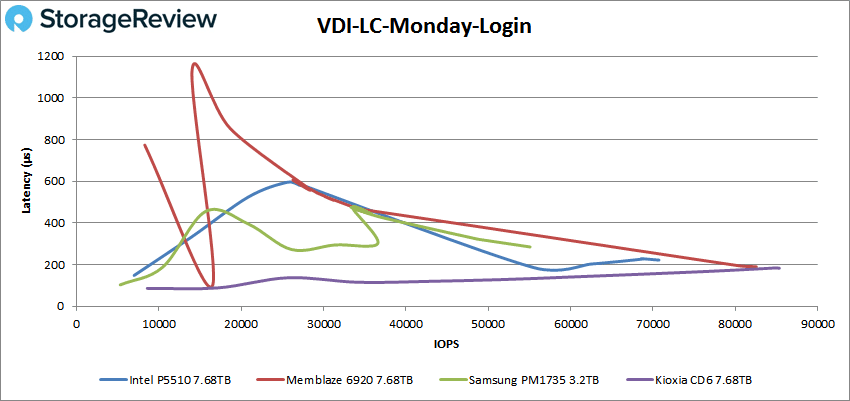
Conclusion
The Intel D7-P5510 is a solid addition to the company’s enterprise TLC SSD line. This U.2 SSD leverages 144-Layer TLC NAND (allowing it to offer a good performance per dollar ratio, which is ideal for many organizations) and is packed with enterprise features that focus on improving workflow efficiency for IT and data security.
Intel quotes performance of up to 7GB/s read and 4.2GB/s write, with random performance up to 1 million IOPS read and 1.3 million IOPS write. The drive is equipped with an Intel PCIe 4.0 controller and firmware, which helps to lower latency and increase performance. It is available in capacities up to 7.86TB (our review model) and is useful in a range of enterprise data center use cases, though it is mainly ideal in cloud data center workload environments.
For performance, we tested the Intel D7-P5510 SSD against several other PCIe Gen4 enterprise SSDs, looking at both application workload analysis and VDBench. In our first series of tests, we saw the P5510 perform well in SQL Server transactional with an aggregate of 12,645.61 TPS and an average latency aggregate of 4ms. The drive kept the top spot in Sysbench with aggregate scores of 8,561.02 TPS, an average latency of 14.95ms, and a worst-case scenario of 28.76ms.
Switching over to our VDBench the P5510 placed first on a few occasions and stayed among the leaders for most of the other tests. Highlights include 940k IOPS in 4K read high-load, 774K IOPS in 4K read, 459K IOPS in 4K write high-load, and 461K IOPS in 4K write. In sequential work we saw 6.13GB/s in 64K read high-load, 4.82GB/s in 64K read, 2.23GB/s in 64K write high-load, and 2.27GB/s in 64K write.
In our SQL testing, the P5510 saw peaks of 257K IOPS, 257K IOPS (again) in SQL 90-10, and 246K IOPS in SQL 80-20. With Oracle, we saw 260K IOPS, 204K IOPS in Oracle 90-10, and 201K IOPS in Oracle 80-20. Next up were our VDI Clone tests, Full and Linked. In Full Clone, we saw 204K IOPS in boot, 125K IOPS in Initial Login, and 92K IOPS in Monday Login. In Linked Clone we saw 79K IOPS in boot, 49K IOPS in Initial Login, and 71K IOPS in Monday Login.
The Intel P5510 offers great performance at an affordable cost while delivering on Intel’s legacy of reliability and compatibility. The P5510 is a highly recommended data center SSD and is a great choice for a range of enterprise and cloud environments that need a drive like this for primary workloads or as part of a tiered data structure that potentially can use Optane and/or QLC SSDs.


 Amazon