

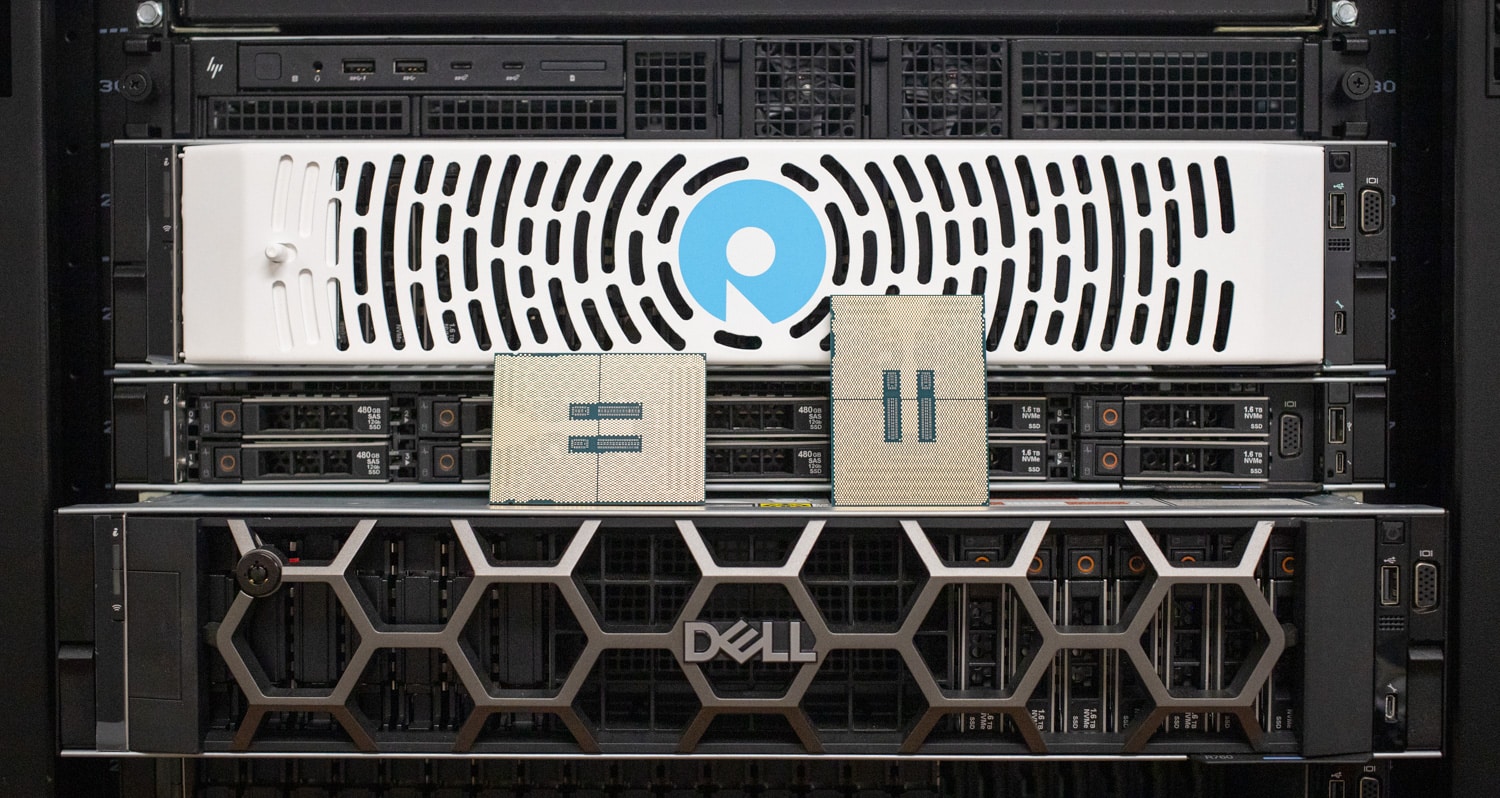
We’ve already reviewed the Dell PowerEdge R760 and found it to be highly capable, per usual from Dell. After the recent launch of the 5th Gen Intel Xeon Scalable chips, we got our hands on a set of top-bin Intel Xeon Platinum 8592+ CPUs. We figured, what better than to retrofit one of our Poweredge R760s to combine the best of both worlds and see if Intel’s latest effort should have the enterprise green with envy.
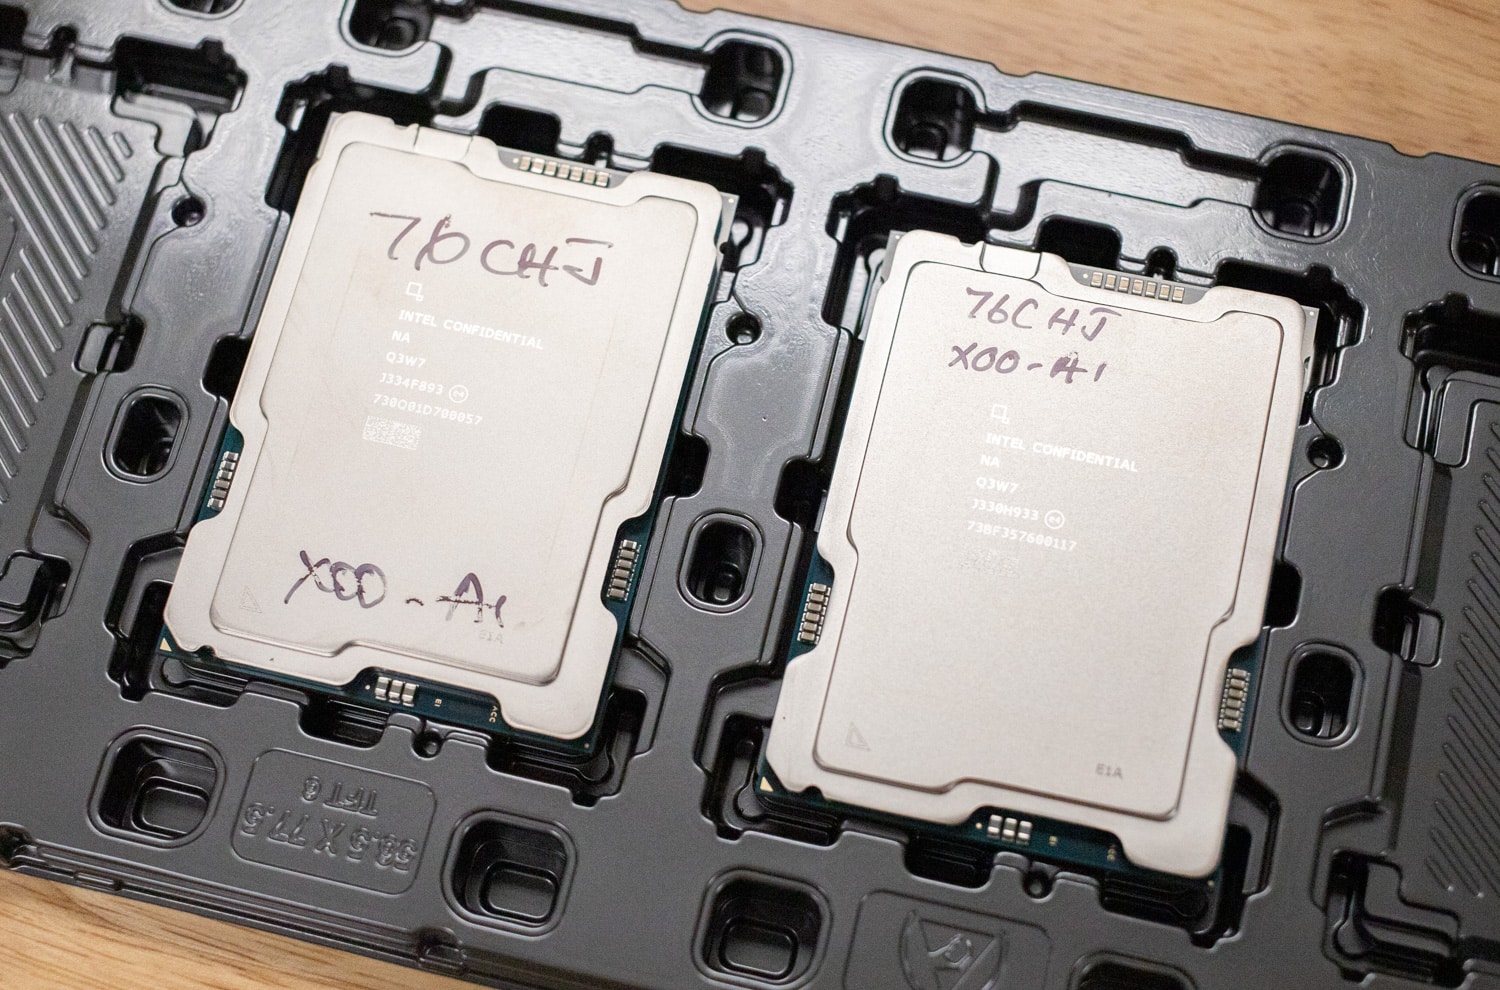
Intel Xeon Platinum 8592+ Specifications
We started with the shipped configuration from Dell in our R760, which was dual Intel 6430 CPUs and 1TB of DDR5 4800 RAM, before swapping in the 8592+ CPUs. While the Xeon 6340 wasn’t the top of the Sapphire Rapids Family, We’re still going to compare it to the Xeon 8592+. We’re lining these two up in this review not to show them as direct competitors, but to show the potential of existing platforms with the release of the new Emerald Rapids CPUs.
We brought in the numbers for the Sapphire Rapids Platinum 8480+ as well as from an HP ML350 as a comparison to the Xeon 8592+ to get some closer numbers. The 8480+ in the ML350 Ge11 is one spot from being the top CPU in the Sapphire Rapids Lineup. It should be noted that we’re only looking at CPUs here, not comparing the servers themselves against each other.
| Intel Xeon Platinum 8592+ Processor (R760) | Intel Xeon Gold 6430 Processor (R760) | Intel Xeon Platinum 8480+ Processor (ML350 G11) | |
|---|---|---|---|
| Generation | 5th, Emerald Rapids | 4th, Sapphire Rapids | 4th, Sapphire Rapids |
| Cores | 64 | 32 | 56 |
| Threads | 128 | 64 | 112 |
| Base Frequency | 1.9 GHz | 2.10 GHz | 2.0 GHz |
| Turbo Frequency | 3.9 GHz | 3.4 GHz | 3.8 GHz |
| Cache | 320 MB | 60 MB | 105 MB |
| Intel UPI Speed | 20 GT/s | 16 GT/s | 16 GT/s |
| Max UPI Links | 4 | 3 | 4 |
| TDP | 350 W | 270 W | 350 W |
| Launch Date | Q4 ’23 | Q1 ’23 | Q1 ’23 |
| Max Memory Size | 4TB | ||
| Memory Types | DDR5 5600 MT/s (1 DPC) | Up to DDR5 4400 MT/s (1DPC and 2DPC) | Up to DDR5 4800 MT/s 1DPC Up to DDR5 4400 MT/s 2DPC |
| Max # Memory Channels | 8 | ||
| PCIe Rev | 5 | ||
| Max # PCIe Lanes | 80 | ||
| High Priority Cores | 20 @ 2.1 GHz | 12 @ 2.2 GHz | 16 @ 2.1 GHz |
| Low Priority Cores | 44 @ 1.7 GHz | 20 @ 1.8 GHz | 40 @ 1.7 GHz |
| Default Max EPC size for Intel SGX | 512 GB | 128 GB | 512 GB |
| Product Page | Link | Link | Link |
Intel Xeon Platinum 8592+ Performance
The high-level tested system specs for each CPU are as follows. Each System had two of the listed CPUs.
Xeon Platinum 8592+
- Dell Poweredge R760
- 1TB DDR5 4800MHz
Xeon Gold 6430
- Dell Poweredge R760
- 1TB DDR5 4800MHz
Xeon Platinum 8480+
- HP ML350 Gen 11
- 256GB DDR5 4800MHz
Intel Xeon Platinum 8592+
Blender OptiX
First up is Blender OptiX–an open-source 3D modeling application. This benchmark was run using the Blender Benchmark CLI utility. The score is samples per minute, with higher being better.
The Xeon 8592+s come off to a great start with over double the performance of the Xeon 6430s, reflecting the data shown on the spec sheets. The Xeon 8480+s however, came as close as 81 points to the Xeon 8592+ in Classroom.
| Blender 4.0 CPU | 2x Xeon Platinum 8592+(ER) (R760 – 1TB DDR5 4800MHz) | 2x Xeon Gold 6430(SR) (R760 – 1TB DDR5 4800MHz) |
2x Xeon Platinum 8480+(SR) (ML350 G11 – 256GB DDR5 4400MHz) |
|---|---|---|---|
| Monster | 1115.057 | 540.039 | 943.300 |
| Junkshop | 780.408 | 361.066 | 627.662 |
| Classroom | 556.550 | 278.228 | 475.144 |
Cinebench R23
Maxon’s Cinebench R23 is a CPU rendering benchmark that utilizes all CPU cores and threads. We ran it for both multi- and single-core tests. Higher scores are better. In this test, we see roughly double the results on the Emerald Rapids Xeon 8592+s than we did on the Sapphire Rapids 6430s. We did see some better single-core performance out of the Xeon 8480+ than the Xeon 8592+, but this doesn’t come to much of a surprise as the Xeon 8480+ held a higher base clock speed. The Xeon 8592+ did pull way ahead in the multi-core test.
| Cinebench R23 | 2x Xeon Platinum 8592+(ER) (R760 – 1TB DDR5 4800MHz) | 2x Xeon Gold 6430(SR) (R760 – 1TB DDR5 4800MHz) |
2x Xeon Platinum 8480+(SR) (ML350 G11 – 256GB DDR5 4400MHz) |
|---|---|---|---|
| CPU Multi Core | 110,498 | 69,663 | 79,164 |
| CPU Single Core | 1,144 | 1,022 | 1,461 |
| MP Ratio | 96.63x | 68.17x | 54.20x |
Cinebench 2024
Here are the CPU results for the 2024 version of Cinebench.
We did see a similar performance pattern between the three CPUs as Cinebench R23.
| Cinebench 2024 | 2x Xeon Platinum 8592+(ER) (R760 – 1TB DDR5 4800MHz) | 2x Xeon Gold 6430(SR) (R760 – 1TB DDR5 4800MHz) |
2x Xeon Platinum 8480+(SR) (ML350 G11 – 256GB DDR5 4400MHz) |
|---|---|---|---|
| CPU Multi Core | 6,001 | 3,746 | 4,699 |
| CPU Single Core | 68 | 59 | 76 |
| MP Ratio | 88.48x | 63.22x | 61.44x |
Geekbench 6
Geekbench 6 is a cross-platform benchmark measuring overall system performance. Higher scores are better. Geekbench offers a GPU benchmark, but without a GPU, we only have CPU Results.
*We had issues with the Emerald Rapids Xeon 8592+s in this test and it would not complete, so we will revisit this when we can get performance numbers. Until then we only have numbers for the Xeon 6430s and Xeon 8480+s*
| Geekbench 6 | 2x Xeon Platinum 8592+(ER) (R760 – 1TB DDR5 4800MHz) | 2x Xeon Gold 6430(SR) (R760 – 1TB DDR5 4800MHz) |
2x Xeon Platinum 8480+(SR) (ML350 G11 – 256GB DDR5 4400MHz) |
|---|---|---|---|
| CPU Benchmark -Single Core | N/A | 1,488 | 1,939 |
| CPU Benchmark – Multi Core | N/A | 16,054 | 15,218 |
Y-Cruncher
Y-cruncher is a popular benchmarking and stress-testing application that launched back in 2009. This test is multi-threaded and scalable, computing Pi and other constants up to the trillions of digits. Faster is better in this test.
We do see results following the same pattern as the other tests, with the Xeon 6430 being in the back, and the Xeon 8480+ just tailing behind the numbers from the Xeon 8592+.
| Y-Cruncher (lower is better) | 2x Xeon Platinum 8592+(ER) (R760 – 1TB DDR5 4800MHz) | 2x Xeon Gold 6430(SR) (R760 – 1TB DDR5 4800MHz) |
2x Xeon Platinum 8480+(SR) (ML350 G11 – 256GB DDR5 4400MHz) |
|---|---|---|---|
| 1 Billion | 4.239 seconds | 6.060 seconds | 5.136 seconds |
| 2.5 Billion | 11.466 seconds | 16.896 seconds | 13.768 seconds |
| 5 Billion | 25.325 seconds | 36.843 seconds | 29.889 seconds |
| 10 Billion | 54.921 seconds | 80.574 seconds | 65.194 seconds |
| 25 Billion | 156.923 seconds | 229.017 seconds | 186.841 seconds |
7-Zip Compression
The popular 7-Zip utility has a built-in memory benchmark, that demonstrates the CPU performance very well. In this test, we run it at a 128MB dictionary size when possible. Expectedly we still see better results on the Xeon 8592+ CPUs.
| 2x Xeon Platinum 8592+(ER) (R760 – 1TB DDR5 4800MHz) | 2x Xeon Gold 6430(SR) (R760 – 1TB DDR5 4800MHz) |
2x Xeon Platinum 8480+(SR) (ML350 G11 – 256GB DDR5 4400MHz) | |
|---|---|---|---|
| Compressing | |||
| Current CPU Usage | 5,609% | 5,732% | 5,482% |
| Current Rating/Usage | 4.912 GIPS | 3.912 GIPS | 4.628 GIPS |
| Current Rating | 275,503 GIPS | 224.209 GIPS | 253.724 GIPS |
| Resulting CPU Usage | 5,605% | 5,669% | 5,475% |
| Resulting Rating/Usage | 4.883 GIPS | 3.923 GIPS | 4.628 GIPS |
| Resulting Rating | 273.716 GIPS | 222.407 GIPS | 253.382 GIPS |
| Decompressing | |||
| Current CPU Usage | 6,243% | 5,852% | 6,219% |
| Current Rating/Usage | 3.635 GIPS | 3.423 GIPS | 3.745 GIPS |
| Current Rating | 226.917 GIPS | 200.350 GIPS | 231.916 GIPS |
| Resulting CPU Usage | 6,232% | 5,894% | 6,129% |
| Resulting Rating/Usage | 3.654 GIPS | 3.385 GIPS | 3.871 GIPS |
| Resulting Rating | 227.744 GIPS | 199.363 GIPS | 237.259 GIPS |
| Total Rating | |||
| Total CPU Usage | 5,919% | 5,781% | 5,802% |
| Total Rating/Usage | 4.269 GIPS | 3.654 GIPS | 4.249 GIPS |
| Total Rating | 250.730 GIPS | 210.363 GIPS | 245.320 GIPS |
UL Procyon AI Inference
UL’s Procyon AI Inference benchmark suite tests how various AI inference engines perform using state-of-the-art neural networks. We ran these tests on the CPU only. Each number here is an average inference time, where lower is better, and the last row is an overall score where higher is better. The differences between these CPUs is a lot less defined in this test, with the Xeon 8480+ actually pulling ahead in some tests, but in the end, the Xeon 8592+ still did get a higher Overall score.
| 2x Xeon Platinum 8592+(ER) (R760 – 1TB DDR5 4800MHz) | 2x Xeon Gold 6430(SR) (R760 – 1TB DDR5 4800MHz) |
2x Xeon Platinum 8480+(SR) (ML350 G11 – 256GB DDR5 4400MHz) | |
|---|---|---|---|
| MobileNet V3 | 3.17 | 3.71 | 2.34 |
| ResNet 50 | 5.23 | 4.37 | 5.76 |
| Inception V4 | 18.66 | 22.59 | 21.70 |
| DeepLab V3 | 23.99 | 28.25 | 23.00 |
| YOLO V3 | 35.47 | 40.28 | 30.81 |
| REAL-ESRGAN | 1021.49 | 1277.08 | 1535.27 |
| Overall Score | 196 | 161 | 191 |
CPU Z
Though this isn’t exactly a benchmark, we thought it was worth mentioning the differences in memory speeds, with the only change being the installed CPU.
First is a shot of the memory tab for the Sapphire Rapids Xeon 6430s that were originally installed in our R760.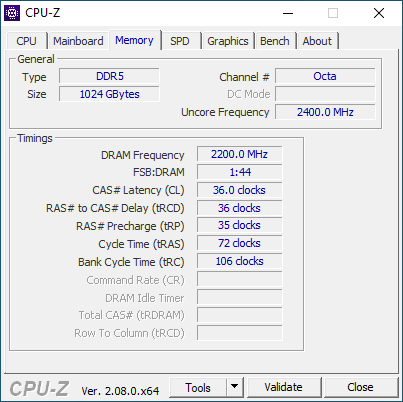
Next is a shot from the memory tab for the Emerald Rapids Xeon 8592+.
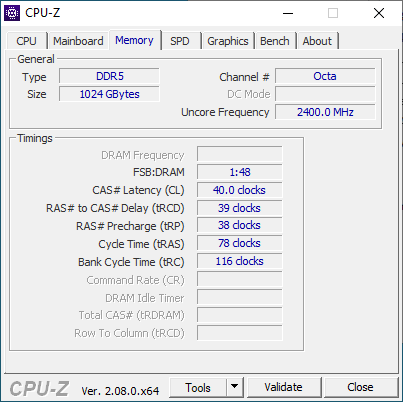
There is a definite difference in the memory timing on the Xeon 8592+, bringing it a little lower than our Xeon 6430, but likely not enough to impact performance in most real-world applications.
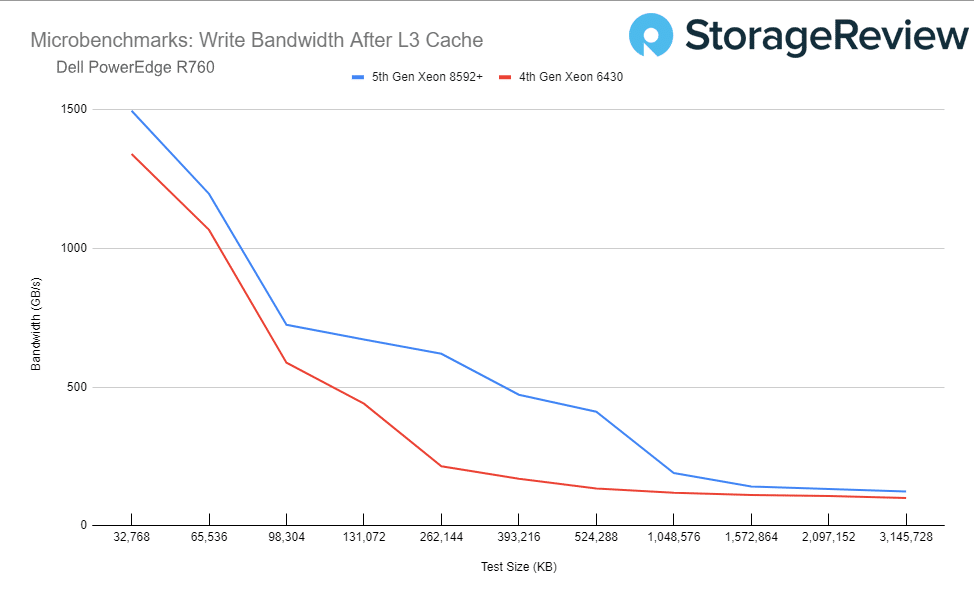
Memory Testing
Looking at the CPU-Z information on the memory, we can run Microbenchmarks from Clamchowder, which is designed to help assess CPU/memory-related parameters including ROB/register file sizes, lock/cache coherency latency, and cache/memory performance. We selected this test to profile the performance improvements between the generations of CPU, and across different access sizes.
For this test, we used 64 threads and ran a whole profile from 64kb to 3,145,728kb. Focusing on the performance once we leave the CPU Cache and go to system memory, we can see a significant lift in throughput with the 5th Gen Xeon across the board on the Write test.
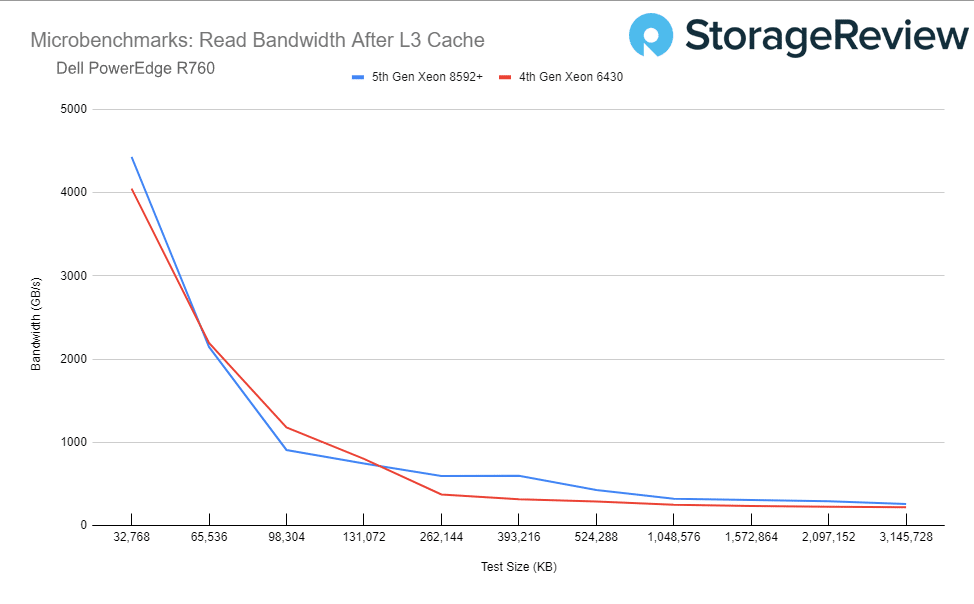
Looking at read bandwidth, the story isn’t as dramatic, but notable. The difference in clock speeds between the 4th Gen CPU and 5th Gen CPU we tested becomes a little clearer here in this test. Despite the slight disadvantage of the 5th Gen, we can still see that the 5th Gen Xeon Scalable can deliver a drop in performance increase.
Conclusion
As expected, the Intel Xeon Platinum 8592+ performed vastly better in most tests than the Xeon 6430s, but that makes sense as they are not direct competing chips. When adding the Xeon 8480+ into the mix, we see the performance gaps close up quite a bit as these serve closer as a direct predecessor to the Xeon 8592+. A large benefit of the 5th generation Xeon chips is that they utilize the same socket as the 4th generation, allowing older platforms to be upgraded in the field as we did to some of our other servers here.
We saw significant improvements in performance across all of our workloads between the two 4th-gen Intel Xeon processors and the 5th-gen Xeon 8592+. The biggest improvements were visible in our computational workloads, such as y-cruncher. In our 25-billion digit runs we measured times on the Gold 6430 and Platinum 8480+ of 229 and 187 seconds respectively dropping to just 157 seconds on the Platinum 8592+. There was also a huge boost in performance in Cinebench R23 and 2024, going from just the 4th-gen Platinum 8480+ to the 5th-gen 8592+. In R23 we saw performance jump from 79k to 110k, and in 2024 the speeds increased from 4,699 to 6,001.
The Intel Xeon Platinum 8592+ marks a big step forward for the company and even though it can’t go core-to-core with AMD’s beefy chips, the 8592+ does have unique strengths that make it a compelling choice. Intel has significantly optimized these processors for AI and HPC workloads, offering robust performance across the board.


 Amazon