

Released in March of this year, the Kingston Data Center DC500M is a SATA enterprise SSD that leverages the latest 3D TLC NAND. Kingston's new SSD implements the company’s strict QoS requirements to ensure predictable random I/O performance as well as predictable low latencies over a wide range of read and write workloads. Where the DC500R (R stands for read intensive) tended fall behind as write activity increased, the DC500M is built to excel in these types of workloads.
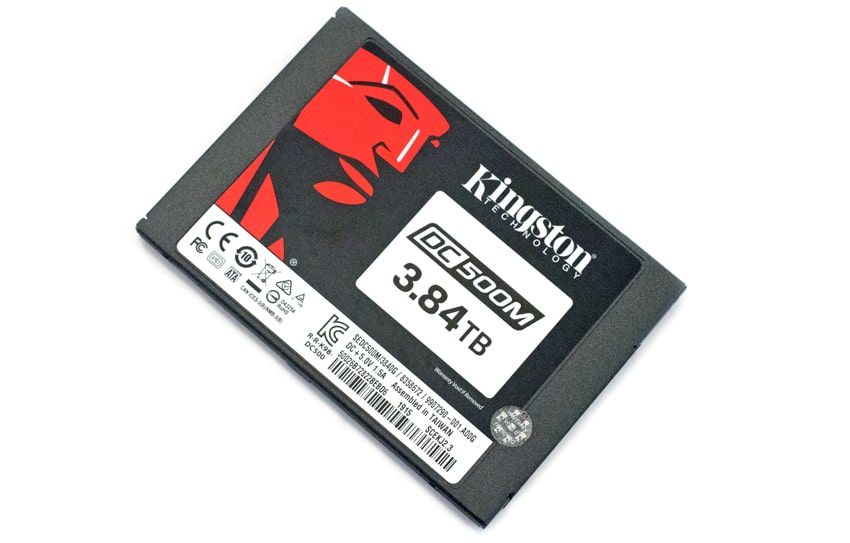
As such, the new Kingston SSD is targeted to use cases such mainstream enterprise server, hyperscale data center servers and cloud service providers requiring low-cost, high-performance storage. It also features on-board Power Loss Protection (PLP) with power capacitors, which writes in-flight-data to the NAND to help decrease the chances of corrupt data during events like sudden power loss.
Performance-wise, the DC500M is quoted to deliver sequential read and write speeds up to 555MB/s and 520MB/s, respectively, while hitting steady 4k read and writes of 98,000 IOPS and 75,000 IOPS (for the two highest capacities only).
Backed by a 5-year warranty and free technical support, the Kingston DC500M is available in capacities of 480GB, 960GB, 1.92TB and 3.84TB. For this review we will be looking at the 3.84TB capacity.
Kingston Data Center DC500M Specifications
| Form Factor | 2.5 Inch |
| Interface | SATA Rev. 3.0 (6Gb/s) – with backwards compatibility to SATA Rev. 2.0 (3Gb/s) |
| NAND | 3D TLC |
| Self-Encrypting Drive (SED) | AES 256-bit Encryption |
| Performance | |
| Sequential Read/Write |
480GB – 555MB/s, 520MB/s |
| Steady-State 4k Read/Write |
480GB – 98,000, 58,000 IOPS |
| Quality of Service (Latency) | TYP Read/Write: <500 µs / <2 ms |
| Hot-Plug Capable | |
| Static and Dynamic Wear Leveling | |
| Enterprise SMART tools | |
| Endurance |
480GB – 1,139TBW (1.3 DWPD) |
| Power Consumption |
Idle: 1.56W |
| Storage temperature | -40°C ~ 85°C |
| Operating temperature | 0°C ~ 70°C |
| Dimensions | 69.9mm x 100mm x 7mm |
| Weight | 92.34g |
| Vibration | Vibration operating: 2.17G Peak (7–800Hz) Vibration non-operating: 20G Peak (10–2000Hz) |
| MTBF | 2 million hours |
| Warranty/support | Limited 5-year warranty with free technical support |
Kingston DC500M Performance
Testbed
Our Enterprise SSD reviews leverage a Lenovo ThinkSystem SR850 for application tests and a Dell PowerEdge R740xd for synthetic benchmarks. The ThinkSystem SR850 is a well-equipped quad-CPU platform, offering CPU power well in excess of what's needed to stress high-performance local storage. Synthetic tests that don't require a lot of CPU resources use the more traditional dual-processor server. In both cases, the intent is to showcase local storage in the best light possible that aligns with storage vendor maximum drive specs.
Lenovo ThinkSystem SR850
- 4 x Intel Platinum 8160 CPU (2.1GHz x 24 Cores)
- 16 x 32GB DDR4-2666Mhz ECC DRAM
- 2 x RAID 930-8i 12Gb/s RAID Cards
- 8 NVMe Bays
- VMware ESXI 6.5
Dell PowerEdge R740xd
- 2 x Intel Gold 6130 CPU (2.1GHz x 16 Cores)
- 4 x 16GB DDR4-2666MHz ECC DRAM
- 1x PERC 730 2GB 12Gb/s RAID Card
- Add-in NVMe Adapter
- Ubuntu-16.04.3-desktop-amd64
Testing Background
The StorageReview Enterprise Test Lab provides a flexible architecture for conducting benchmarks of enterprise storage devices in an environment comparable to what administrators encounter in real deployments. The Enterprise Test Lab incorporates a variety of servers, networking, power conditioning, and other network infrastructure that allows our staff to establish real-world conditions to accurately gauge performance during our reviews.
We incorporate these details about the lab environment and protocols into reviews so that IT professionals and those responsible for storage acquisition can understand the conditions under which we have achieved the following results. None of our reviews are paid for or overseen by the manufacturer of equipment we are testing.
Application Workload Analysis
In order to understand the performance characteristics of enterprise storage devices, it is essential to model the infrastructure and the application workloads found in live-production environments. Our benchmarks for the Kingston DC500M are therefore the MySQL OLTP performance via SysBench and Microsoft SQL Server OLTP performance with a simulated TCP-C workload. For our application workloads, each drive will be running 2-4 identically configured VMs.
SQL Server Performance
Each SQL Server VM is configured with two vDisks: 100GB volume for boot and a 500GB volume for the database and log files. From a system-resource perspective, we configured each VM with 16 vCPUs, 64GB of DRAM and leveraged the LSI Logic SAS SCSI controller. While our Sysbench workloads tested previously saturated the platform in both storage I/O and capacity, the SQL test is looking for latency performance.
This test uses SQL Server 2014 running on Windows Server 2012 R2 guest VMs, and is stressed by Quest's Benchmark Factory for Databases. StorageReview’s Microsoft SQL Server OLTP testing protocol employs the current draft of the Transaction Processing Performance Council’s Benchmark C (TPC-C), an online transaction-processing benchmark that simulates the activities found in complex application environments. The TPC-C benchmark comes closer than synthetic performance benchmarks to gauging the performance strengths and bottlenecks of storage infrastructure in database environments. Each instance of our SQL Server VM for this review uses a 333GB (1,500 scale) SQL Server database and measures the transactional performance and latency under a load of 15,000 virtual users.
SQL Server Testing Configuration (per VM)
- Windows Server 2012 R2
- Storage Footprint: 600GB allocated, 500GB used
- SQL Server 2014
- Database Size: 1,500 scale
- Virtual Client Load: 15,000
- RAM Buffer: 48GB
- Test Length: 3 hours
- 2.5 hours preconditioning
- 30 minutes sample period
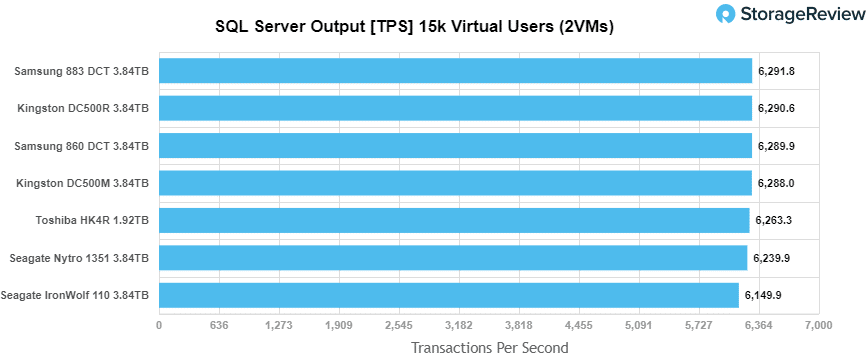
For our SQL Server transactional benchmark, the Kingston DC500M performed well and just slightly behind the DC500R with a total of 6,288.0 TPS.
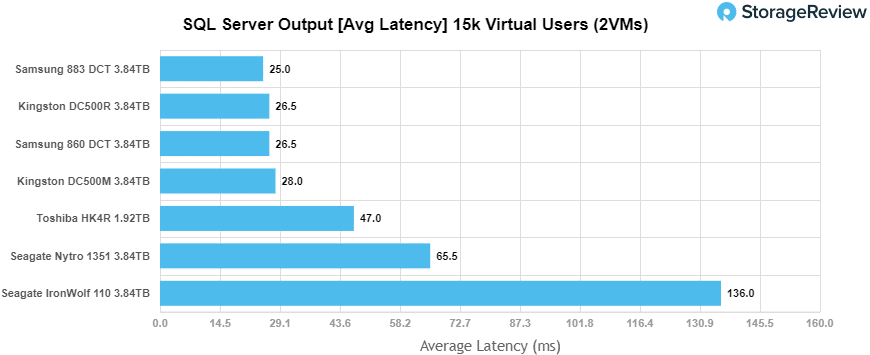
A better indication of SQL Server performance is latency compared to TPS. Here, we see the Kingston DC500M trailing slightly behind the leaders with 28.0ms.
Sysbench Performance
The next application benchmark consists of a Percona MySQL OLTP database measured via SysBench. This test measures average TPS (Transactions Per Second), average latency, and average 99th percentile latency as well.
Each Sysbench VM is configured with three vDisks: one for boot (~92GB), one with the pre-built database (~447GB), and the third for the database under test (270GB). From a system-resource perspective, we configured each VM with 16 vCPUs, 60GB of DRAM and leveraged the LSI Logic SAS SCSI controller.
Sysbench Testing Configuration (per VM)
- CentOS 6.3 64-bit
- Percona XtraDB 5.5.30-rel30.1
- Database Tables: 100
- Database Size: 10,000,000
- Database Threads: 32
- RAM Buffer: 24GB
- Test Length: 3 hours
- 2 hours preconditioning 32 threads
- 1 hour 32 threads
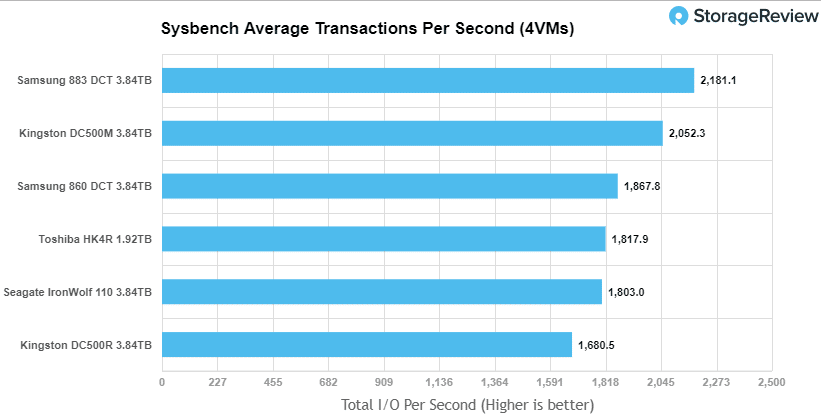
With the Sysbench transactional benchmark, the DC500M came in second (and surpassing the DC500R) with a solid 2,052.3 TPS.
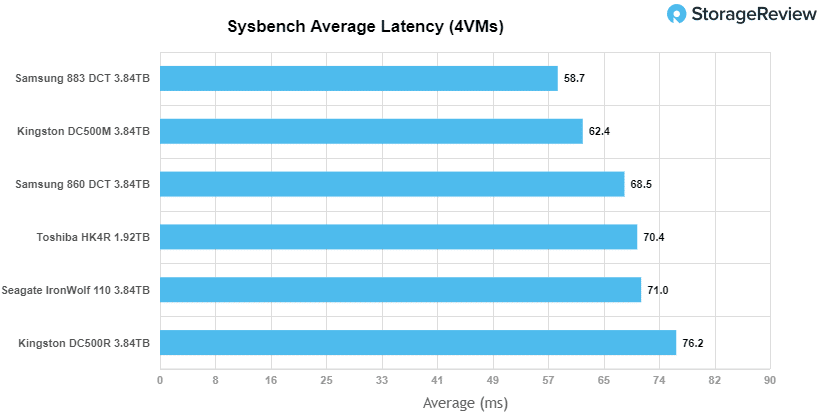
In Sysbench average latency, the DC500M also showed second place results with 62.4ms.
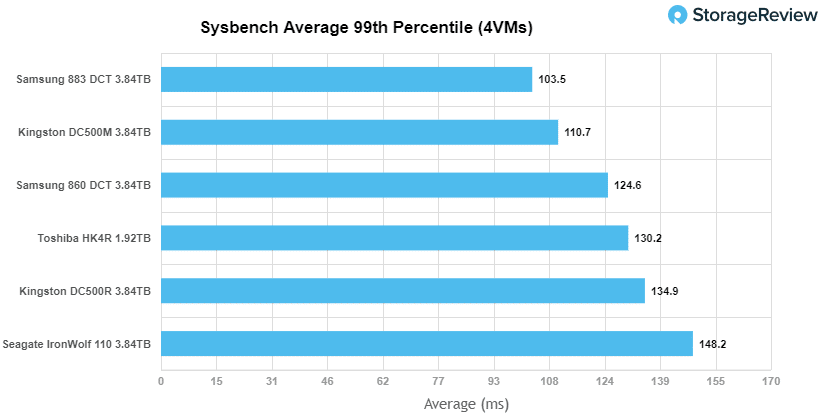
For our worst-case scenario latency (99thpercentile), the DC500M finished its impressive sysbench performance at second place once again with 110.7ms in latency.
VDBench Workload Analysis
When it comes to benchmarking storage devices, application testing is best, and synthetic testing comes in second place. While not a perfect representation of actual workloads, synthetic tests do help to baseline storage devices with a repeatability factor that makes it easy to do apples-to-apples comparison between competing solutions. These workloads offer a range of different testing profiles ranging from "four corners" tests, common database transfer size tests, to trace captures from different VDI environments. All of these tests leverage the common vdBench workload generator, with a scripting engine to automate and capture results over a large compute testing cluster. This allows us to repeat the same workloads across a wide range of storage devices, including flash arrays and individual storage devices. Our testing process for these benchmarks fills the entire drive surface with data, then partitions a drive section equal to 25% of the drive capacity to simulate how the drive might respond to application workloads. This is different than full entropy tests which use 100% of the drive and take them into steady state. As a result, these figures will reflect higher-sustained write speeds.
Profiles:
- 4K Random Read: 100% Read, 128 threads, 0-120% iorate
- 4K Random Write: 100% Write, 64 threads, 0-120% iorate
- 64K Sequential Read: 100% Read, 16 threads, 0-120% iorate
- 64K Sequential Write: 100% Write, 8 threads, 0-120% iorate
- Synthetic Database: SQL and Oracle
- VDI Full Clone and Linked Clone Traces
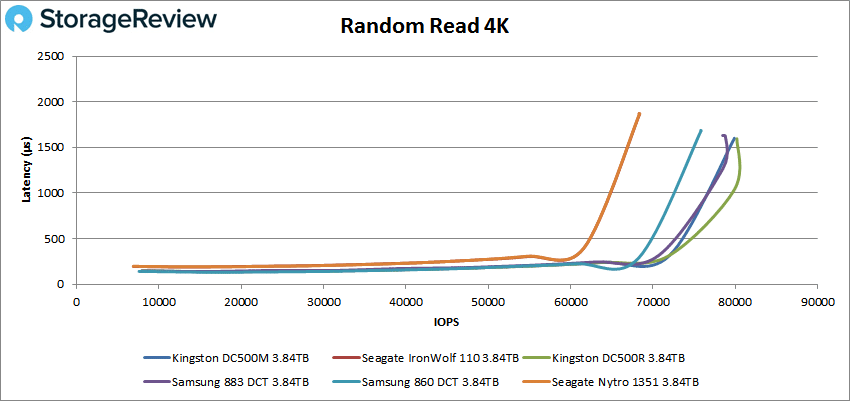
In our first VDBench Workload Analysis, Random 4K Read, the Kingston DC500M had impressive performance figures, staying under 1ms latency until nearly 77,000 IOPS. It also showed a peak performance of 79,891 IOPS (1.6ms), which was a hair short of the DC500R's 80,209 IOPS.
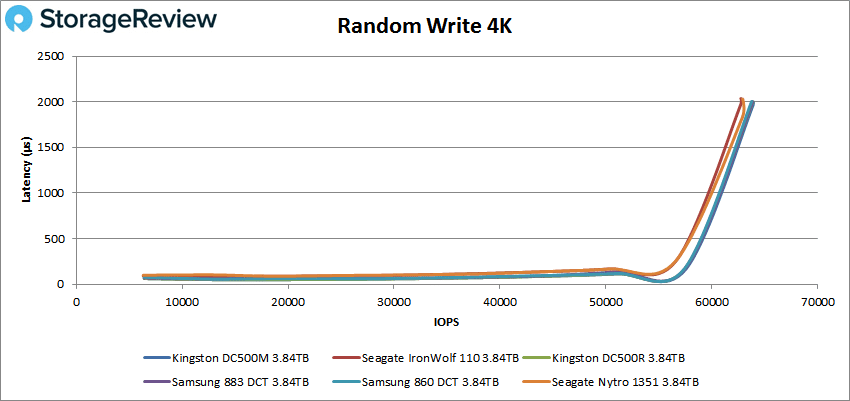
With random 4K writes, all tested drives had nearly identical results, posting just over 63,000 IOPS with a latency of 2ms.
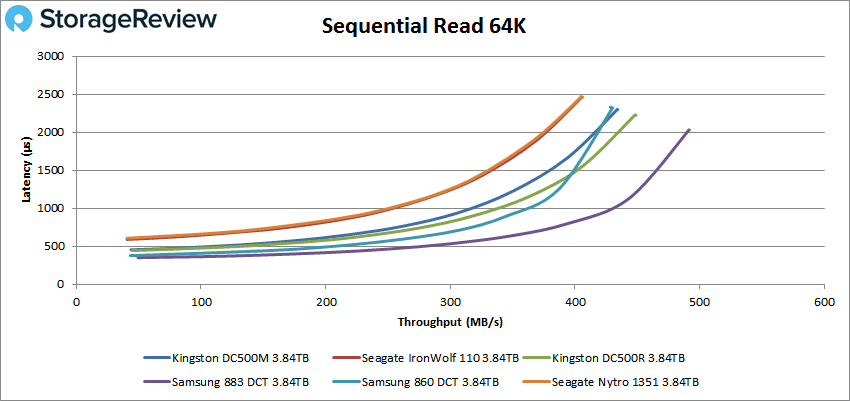
Moving on to the sequential workloads, we first look at our 64K read test. In this scenario, the Kingston DC500M had sub-millisecond latency until a tad over 5,000 IOPS or 360MB/s. For peak performance, the Kingston drive peaked in second place at 6,948 IOPS or 434.3MB/s with a latency of 2.3ms, right next to the Samsung 860 DCT.
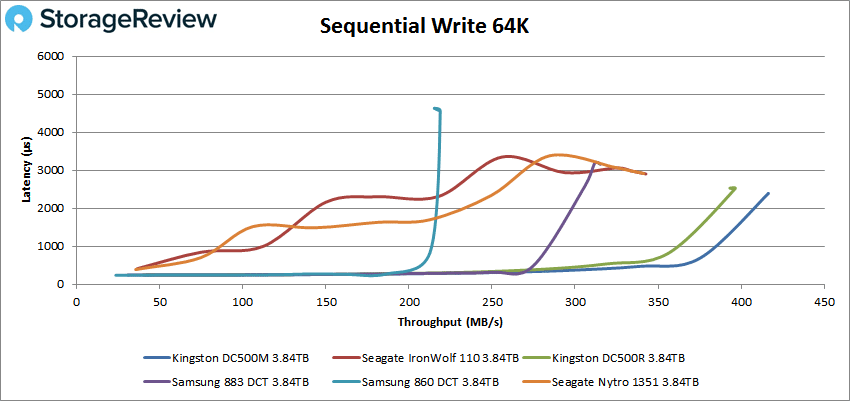
Looking at sequential writes, the Kingston drive posted the best overall best performance, keeping sub-millisecond latency until around 6,200 IOPS or 380MB/s, and peaking at 6,662 IOPS or 416MB/s with a latency of 2.38ms.
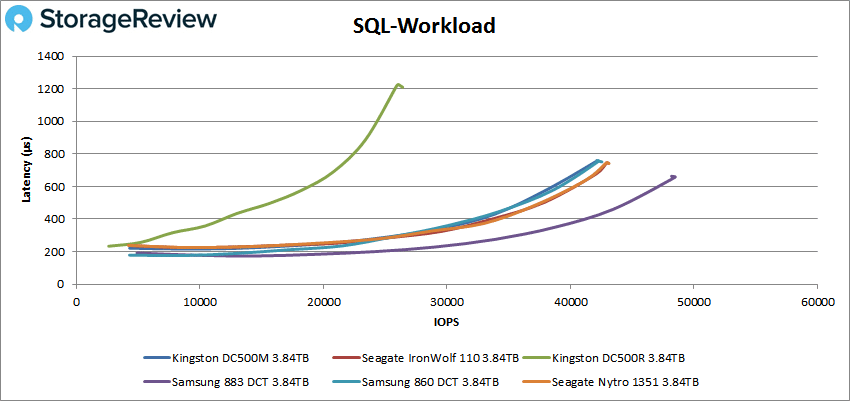
Next, we move on to our SQL workloads where the Kingston DC500M had sub-millisecond latency in all three tests (the DC500R was the only drive that didn’t). Here, the DC500M had a peak performance of 42,178 IOPS and a latency of 0.76ms right alongside the Samsung 860 DCT
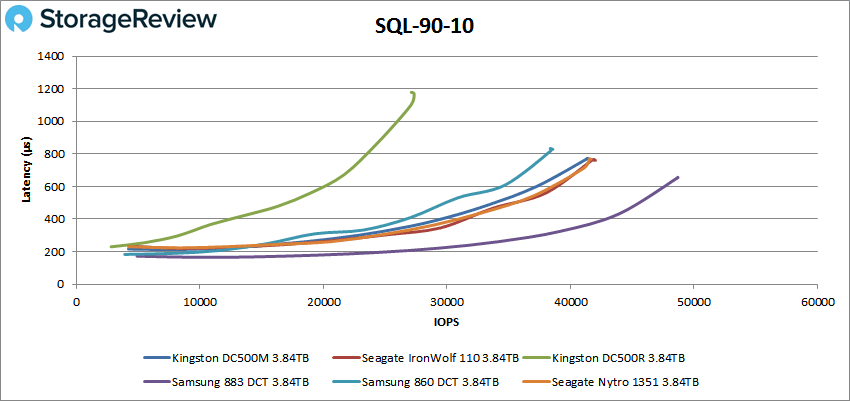
For SQL 90-10, the Kingston drive stayed behind the other drives with a peak performance of 41,476 IOPS and a latency of 0.77ms.
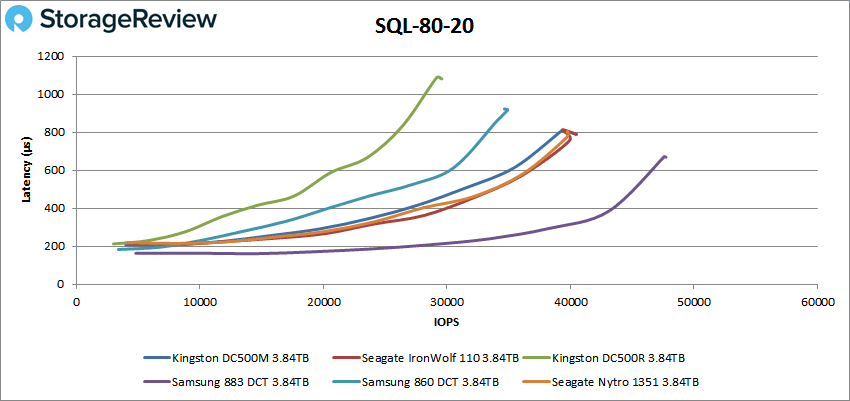
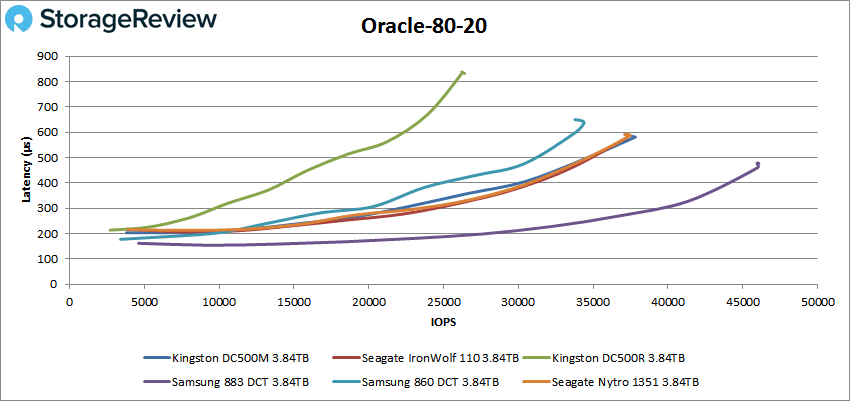
In SQL 80-20, the trend continues. Here, the DC500M had a peak performance of 40,453 IOPS and a latency of 0.79ms.
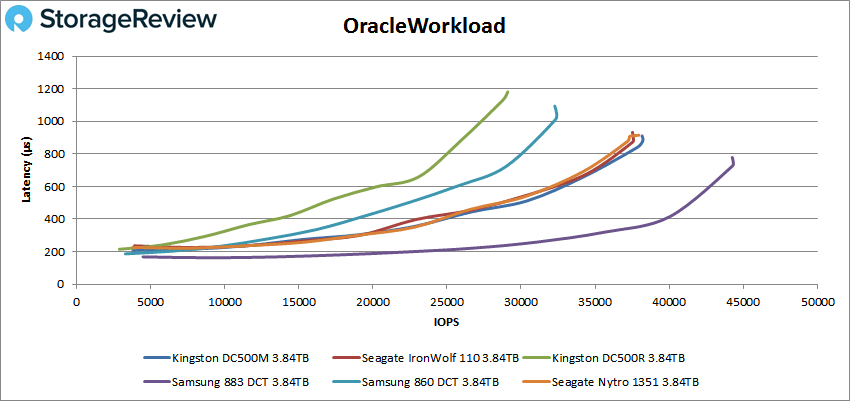
Moving on to Oracle workloads, the DC500M found itself hovering around 2nd place and maintained sub-millisecond latency throughout. For the first test, the Kingston drive had a peak performance of 38,164 IOPS with a latency of 912 μs.
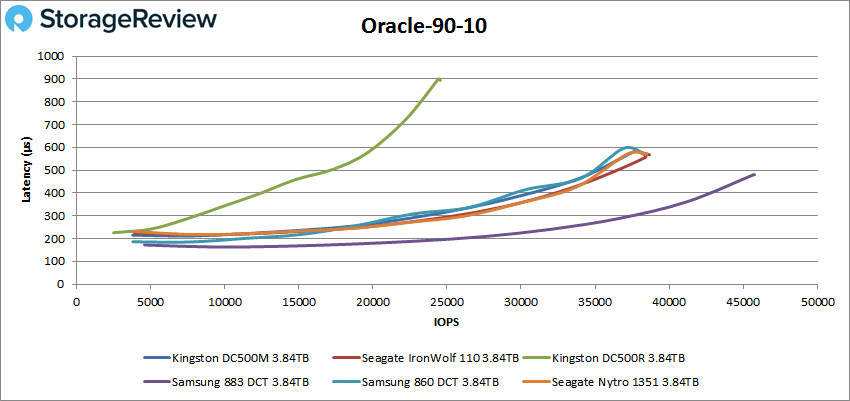
With Oracle 90-10, the DC500M had a peak performance of 37,824 IOPS with a latency of 580μs.
Oracle 80-20 had the DC500M drive at 37,611 IOPS with a latency of 581μs, which was neck and neck with the Seagate Nytro and IronWolf drives.
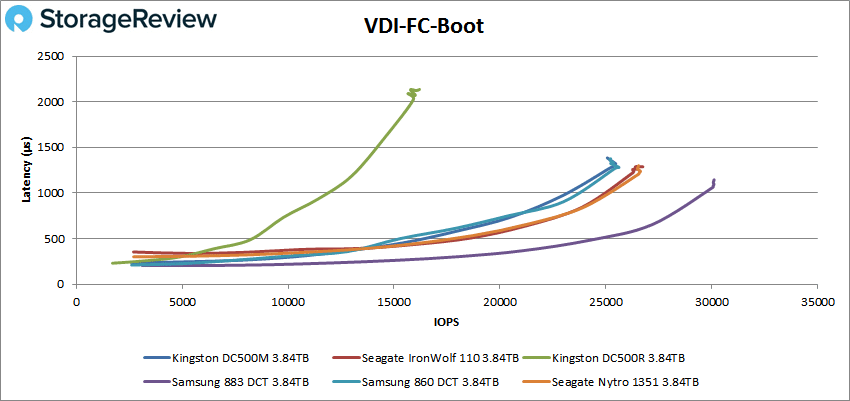
Next, we switched over to our VDI clone test, Full and Linked. For VDI Full Clone Boot, the DC500M again mirrored the Samsung 860 DCT in performance, breaking sub-millisecond latency at around 20,000 IOPS and peaking at 25,069 IOPS with a latency of 1.39ms.
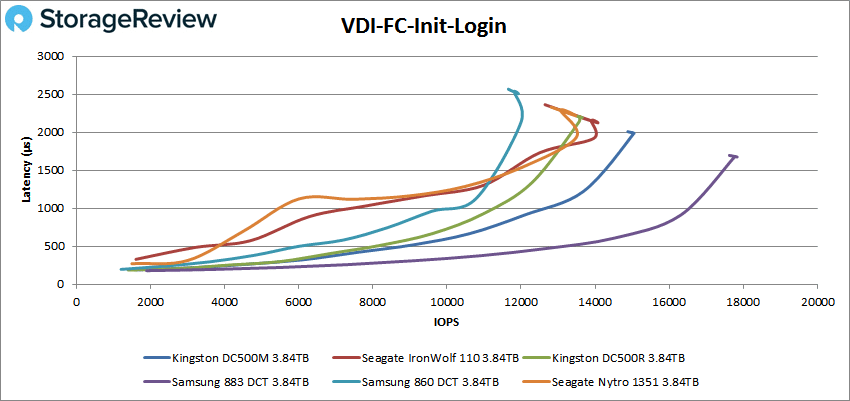
VDI FC Initial Login saw the DC500M maintaining sub-millisecond latency up until around 13,000 IOPS and went on to peak at around 15,000 IOPS with a latency of 1.99ms.
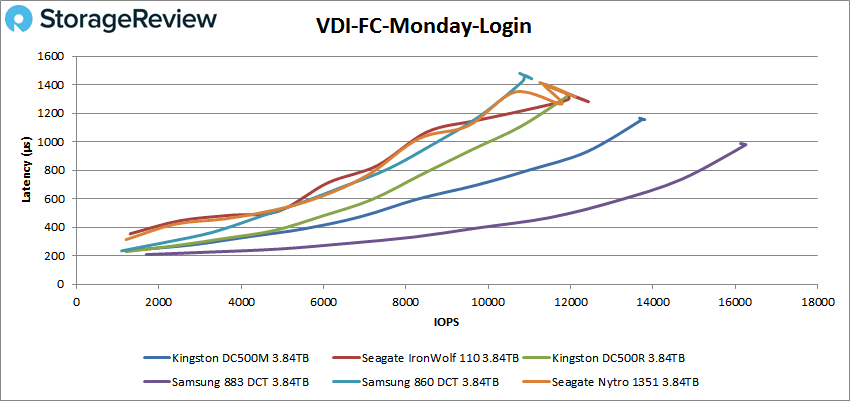
The DC500M was alone in second place by a significant margin in VDI FC Monday Login. Here, the Kingston drive had a peak performance of 13,800 IOPS with a latency of 1.15ms.
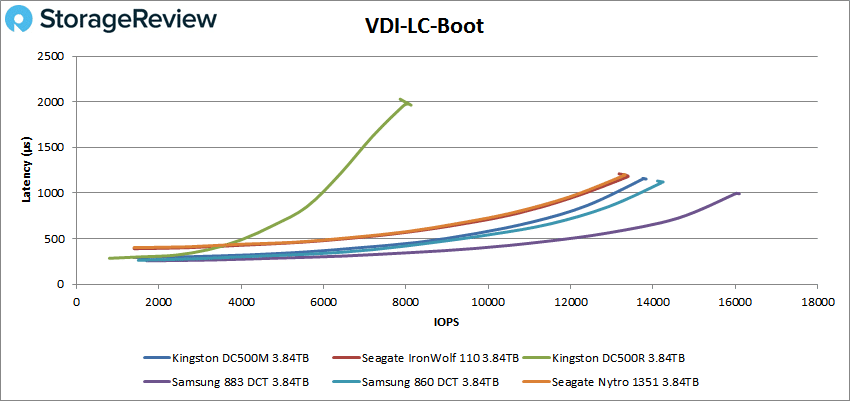
Switching over to Linked Clone (LC), the DC500M came in 3rd during the boot test, breaking sub-millisecond latency around 9,000 IOPS. The Kingston drive had a peak performance of 13,831 IOPS and a latency of 1.15ms.
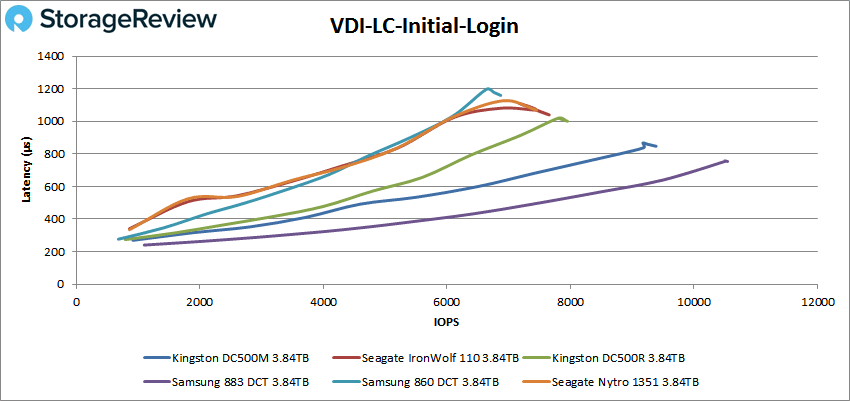
Looking at VDI LC Initial Login, the Kingston drive took second place had sub-millisecond latency throughout the test. At its peak, the drive showed 9,385 IOPS at a latency of 0.847ms.
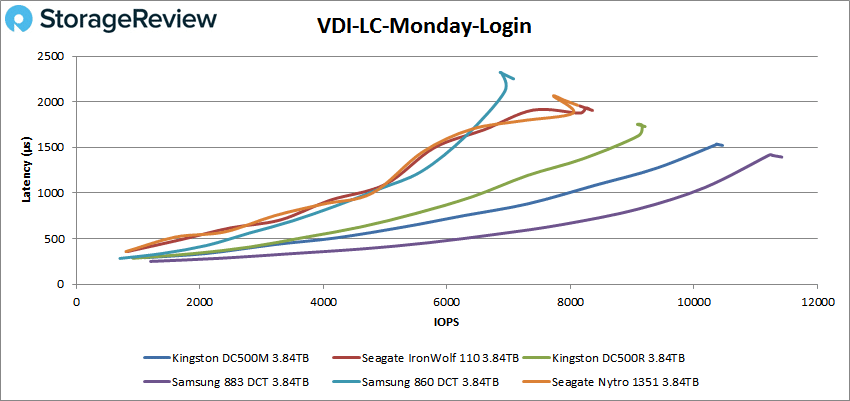
For our final test, we look at VDI LC Monday Login. Here, the drive performed well again with a peak performance of 10,434 IOPS and a latency of 1.52ms. The DC500M had sub-millisecond latency until about 8,000 IOPS.
Conclusion
The DC500M is one of Kingston's newest SATA SSD offerings designed for enterprises require greater write-performance generally found in a mixed-use workload environment. Available in capacities ranging from 480GB to 3.84TB, the DC500M features 3D TLC NAND, AES 256-bit Encryption and strict QoS requirements. It also has built-in ECC data integrity protection to safeguard against data corruption for end-to-end data protection, and on-board power loss protection during power failures via power capacitors and firmware. Kingston quotes an endurance figure of 9,110TBW for the 3.84TB model, sequential speeds up to 555MB/s read and 520MB/s write, and throughput going as high as 98,000 IOPS read and 75,000 IOPS write.
To test performance, we pitted the Kingston DC500M against a range of popular SATA SSDs, including its DC500R brethren. Overall, the Kingston DC500M showed impressive results, though it did fall behind a bit in our SQL application with TPS performance of 6,288.0 keeping up with a lower latency profile at 28.0ms. Things picked up during our Sysbench workload, which features a heavier write profile though. Here, the DC500M picked up its pace with 2,052.3 TPS, an average latency of 62.4ms, and a worst-case scenario latency of 110.7ms.
In our 4K random tests, the Kingston DC500M measured reads at 79,891 IOPS with a latency of 1.6ms and posted roughly 63,000 IOPS with a latency of 2ms. In 64K read and write, the DC500M showed read speeds of 6,948 IOPS or 434.3MB/s with a latency of 2.3ms, and 6,662 IOPS or 416MB/s with a latency of 2.38ms, respectively.
In synthetic workloads such as SQL and Oracle, the DC500M continued its solid performance as the drive was specifically designed to excel in write-heavy environments. In our SQL workloads, remained in sub-millisecond latency territory throughout, though it fell a tad in the leaderboard. Our Oracle tests, however, showed the DC500M hovering around second place in all 3 tests. In Linked and Full Clone VDI benchmarks, the Kingston DC500M posted solid peak performance of 25,069 IOPS, 15,000 IOPS and 13,800 IOPS for full boot, login and Monday profiles, respectively, while LC showed 13,831 IOPS, 9,385 IOPS and 10,434 IOPS, respectively.
Overall the Kingston DC500M performed quite well, building on the strong performance we saw with the read-intensive DC500R, with increased write performance. In most of our benchmarks it stayed with the top of the pack, with certain benchmarks such as sequential write performance, led the pack. For enterprise buyers looking for a competitive SATA offering, either for boot or mixed workloads, the new DC500M is a very solid option.


 Amazon