

The Kingston KC2500 is an NVMe PCIe SSD designed for those looking to add next-gen performance to their machines. Featuring the common M.2 2280 form factor, the KC2500 uses 96-layer 3D TLC NAND and is available in a range of capacities from 250GB to 2TB. With its high endurance and performance capabilities, the KC2500 is ideal for workstations, desktops, and high-performance computing systems.
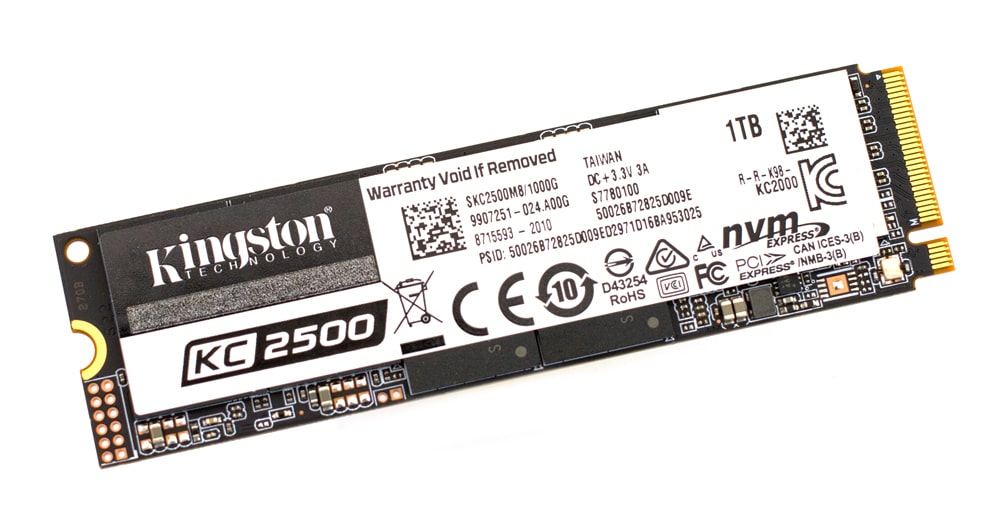
Like Kingston’s KC2000, the KC2500 is also equipped with Silicon Motion’s SMI 2262EN, a Gen3 x4 NVMe 1.3 high-performance controller known for its potential to hit some pretty decent sequential Read/Write and 4K random performance. As such, Kingston quotes the KC2500 with speeds up to 3,500MB/s read and 2,900MB/s write, and 375,000 IOPS read and 300,000 IOPS write, which is up a bit from its predecessor.
The Kingston KC2500 is a self-encrypting drive, as it supports end-to-end data protection via XTS-AES 256-bit hardware-based encryption. It also supports independent software vendors with TCG Opal 2.0 security management solutions, including Symantec, McAfee, WinMagic and more.
Here is a video review we did:
Backed by a 5-year warranty, the Kingston KC2500 comes in capacities of 250GB, 500GB, 1TB, and 2TB. We will be looking at the 1TB model for this review.
Kingston KC2500 Specifications
| Form Factor | M.2 2280 |
| Interface | NVMe PCIe Gen 3.0 x 4 Lanes |
| Capacities | 250GB, 500GB, 1TB, 2TB |
| Controller | SMI 2262EN |
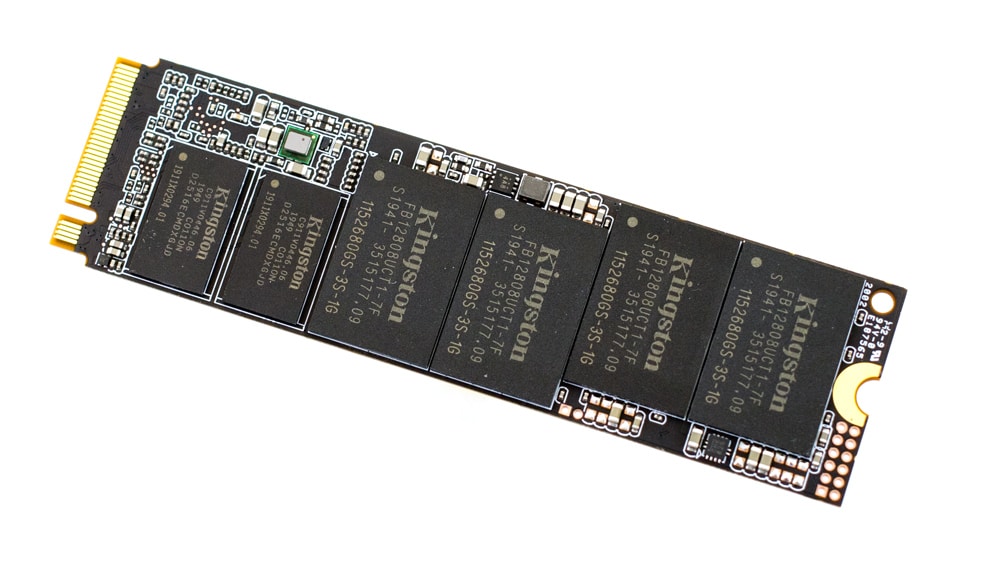
| NAND | 96-layer 3D TLC |
| Encrypted | XTS-AES 256 bit |
| Sequential Read/Write | 250GB – up to 3,500/1,200MB/s 500GB – up to 3,500/2,500MB/s 1TB – up to 3,500/2,900MB/s 2TB – up to 3,500/2,900MB/s |
| Random 4K Read/Write | 250GB – up to 375,000/300,000 IOPS 500GB – up to 375,000/300,000 IOPS 1TB – up to 375,000/300,000 IOPS 2TB – up to 375,000/300,000 IOPS |
| Total Bytes Written (TBW) | 250GB – 150TBW 500GB – 300TBW 1TB – 600TBW 2TB – 1.2PBW |
| Power Consumption | .003W Idle / .2W Avg / 2.1W (MAX) Read / 7W (MAX) Write |
| Storage Temperature | -40°C~85°C |
| Operating Temperature | 0°C~70°C |
| Dimensions | 80mm x 22mm x 3.5mm |
| Weight | 250GB – 8g 500GB – 10g 1TB – 10g 2TB – 11g |
| Vibration Operating | 2.17G Peak (7-800Hz) |
| Vibration Non-operating | 20G Peak (20-1000Hz) |
| MTBF | 2,000,000 |
| Warranty/Support | Limited 5-year warranty with free technical support |
Kingston KC2500 SSD Performance
Testbed
The test platform leveraged in these tests is a Dell PowerEdge R740xd server. We measure SATA performance through a Dell H730P RAID card inside this server, although we set the card in HBA mode only to disable the impact of RAID card cache. NVMe is tested natively through an M.2 to PCIe adapter card. The methodology used better reflects end-user workflow with the consistency, scalability and flexibility testing within virtualized server offers. A large focus is put on drive latency across the entire load range of the drive, not just at the smallest QD1 (Queue-Depth 1) levels. We do this because many of the common consumer benchmarks don’t adequately capture end-user workload profiles.
Houdini by SideFX
The Houdini test is specifically designed to evaluate storage performance as it relates to CGI rendering. The test bed for this application is a variant of the core Dell PowerEdge R740xd server type we use in the lab with dual Intel 6130 CPUs and 64GB DRAM. In this case, we installed Ubuntu Desktop (ubuntu-16.04.3-desktop-amd64) running bare metal. Output of the benchmark is measured in seconds to complete, with fewer being better.
The Maelstrom demo represents a section of the rendering pipeline that highlights the performance capabilities of storage by demonstrating its ability to effectively use the swap file as a form of extended memory. The test does not write out the result data or process the points in order to isolate the wall-time effect of the latency impact to the underlying storage component. The test itself is composed of five phases, three of which we run as part of the benchmark, which are as follows:
- Loads packed points from disk. This is the time to read from disk. This is single-threaded, which may limit overall throughput.
- Unpacks the points into a single flat array in order to allow them to be processed. If the points do not have dependency on other points, the working set could be adjusted to stay in-core. This step is multi-threaded.
- (Not Run) Processes the points.
- Repacks them into bucketed blocks suitable for storing back to disk. This step is multi-threaded.
- (Not Run) Writes the bucketed blocks back out to disk.
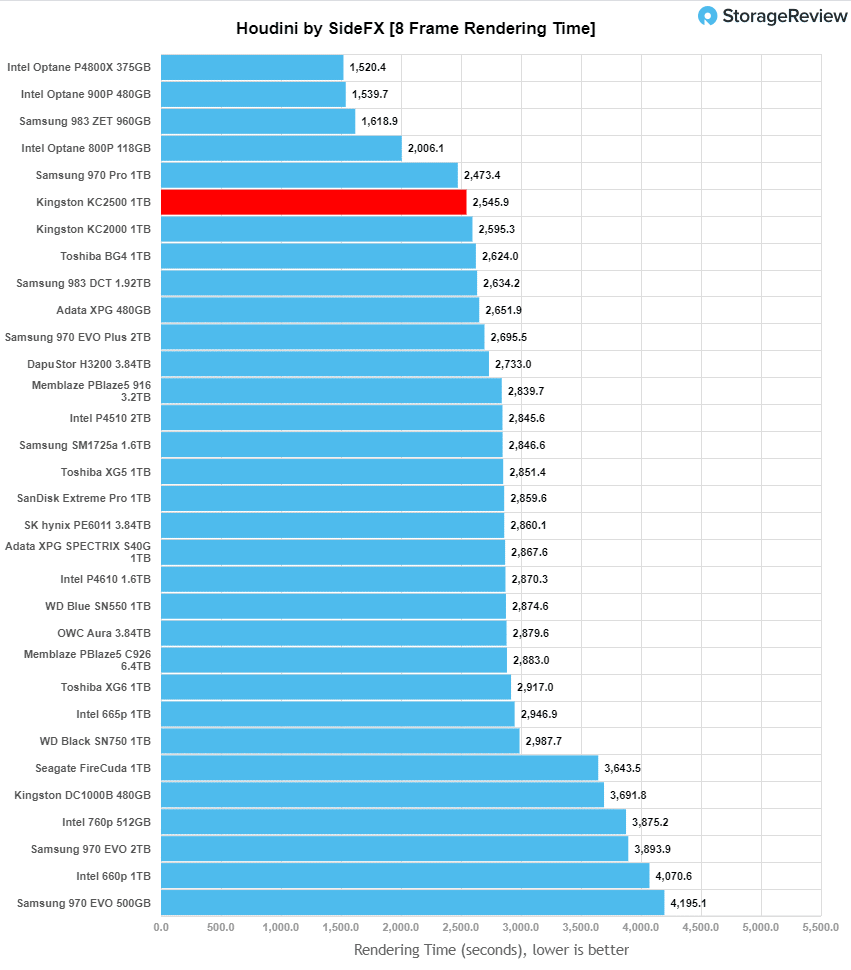
Here, we see the Kingston KC2500 near the very top of the leaderboard with an impressive rendering of 2,545.9 seconds, which is an improvement of roughly 50 seconds from the KC2000.
SQL Server Performance
Each SQL Server VM is configured with two vDisks: 100GB volume for boot and a 500GB volume for the database and log files. From a system-resource perspective, we configured each VM with 16 vCPUs, 64GB of DRAM and leveraged the LSI Logic SAS SCSI controller. While our Sysbench workloads tested previously saturated the platform in both storage I/O and capacity, the SQL test is looking for latency performance.
This test uses SQL Server 2014 running on Windows Server 2012 R2 guest VMs, and is stressed by Quest’s Benchmark Factory for Databases. StorageReview’s Microsoft SQL Server OLTP testing protocol employs the current draft of the Transaction Processing Performance Council’s Benchmark C (TPC-C), an online transaction-processing benchmark that simulates the activities found in complex application environments. The TPC-C benchmark comes closer than synthetic performance benchmarks to gauging the performance strengths and bottlenecks of storage infrastructure in database environments. Each instance of our SQL Server VM for this review uses a 333GB (1,500 scale) SQL Server database and measures the transactional performance and latency under a load of 15,000 virtual users.
SQL Server Testing Configuration (per VM)
- Windows Server 2012 R2
- Storage Footprint: 600GB allocated, 500GB used
- SQL Server 2014
-
- Database Size: 1,500 scale
- Virtual Client Load: 15,000
- RAM Buffer: 48GB
- Test Length: 3 hours
- 2.5 hours preconditioning
- 30 minutes sample period
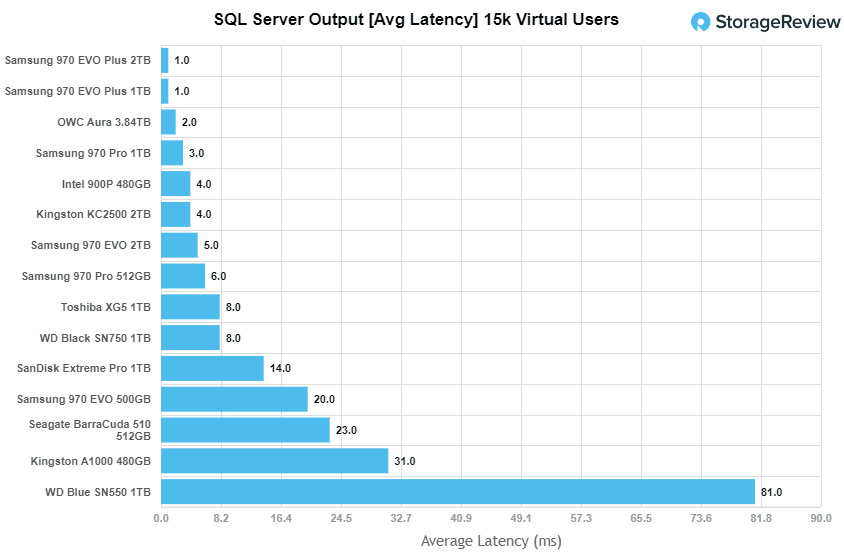
For our SQL Server transactional benchmark, the Kingston KC2500 had a strong showing of 3,160.0, which was the same as the Intel 900P.
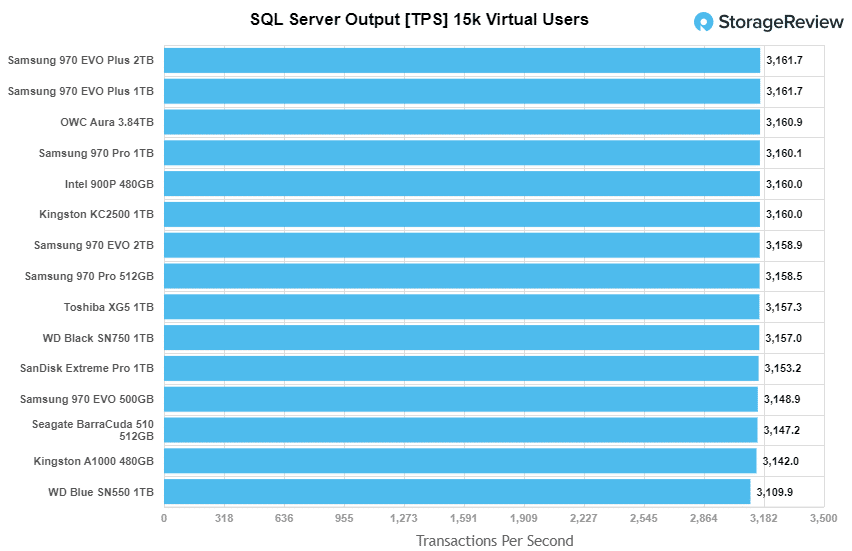
For latency, the Kingston drive showed great results again with 4.0ms, which was again the same as the Intel 900P.
VDBench Workload Analysis
When it comes to benchmarking storage devices, application testing is best, and synthetic testing comes in second place. While not a perfect representation of actual workloads, synthetic tests do help to baseline storage devices with a repeatability factor that makes it easy to do apples-to-apples comparison between competing solutions. These workloads offer a range of different testing profiles ranging from “four corners” tests, common database transfer size tests, to trace captures from different VDI environments. All of these tests leverage the common vdBench workload generator, with a scripting engine to automate and capture results over a large compute testing cluster. This allows us to repeat the same workloads across a wide range of storage devices, including flash arrays and individual storage devices. Our testing process for these benchmarks fills the entire drive surface with data, then partitions a drive section equal to 5% of the drive capacity to simulate how the drive might respond to application workloads. This is different than full entropy tests which use 100% of the drive and take them into steady state. As a result, these figures will reflect higher-sustained write speeds.
Profiles:
- 4K Random Read: 100% Read, 128 threads, 0-120% iorate
- 4K Random Write: 100% Write, 64 threads, 0-120% iorate
- 64K Sequential Read: 100% Read, 16 threads, 0-120% iorate
- 64K Sequential Write: 100% Write, 8 threads, 0-120% iorate
Comparables for this review:
- OWC Aura P12 3.84TB
- Samsung Evo Plus 2TB
- Kingston 2000 1TB
- Seagate FireCude 510 1TB
- WD Black 1TB
- WD Blue SN550 1TB
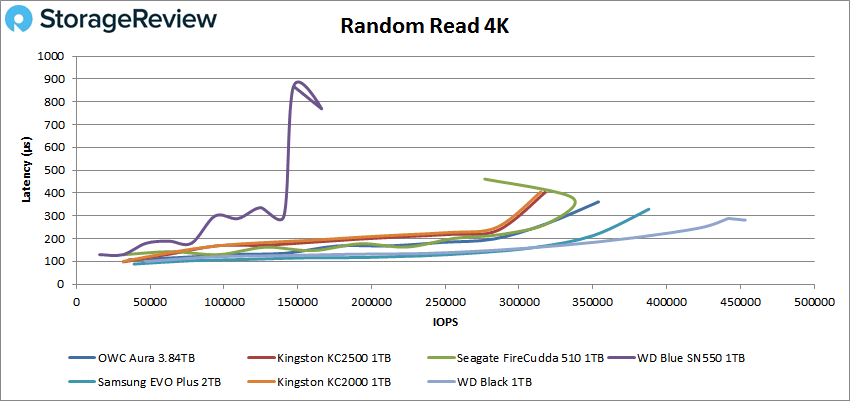
For 4K performance, the Kingston KC2500 started below 100µs throughout the test and went on to peak at 317,501 IOPS with 402µs.
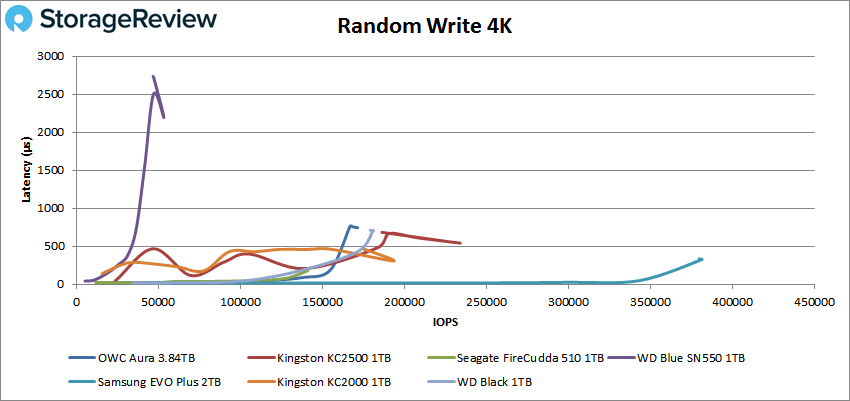
For 4K random write, the Kingston KC2500 reached 233,945 IOPS at a latency of 542.4µs before taking a steep dip in performance by the end of the test with 186,363 IOPS and 683.1ms.
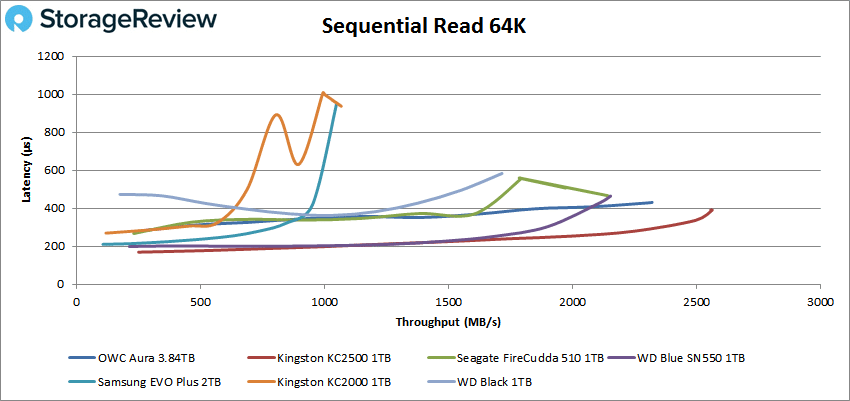
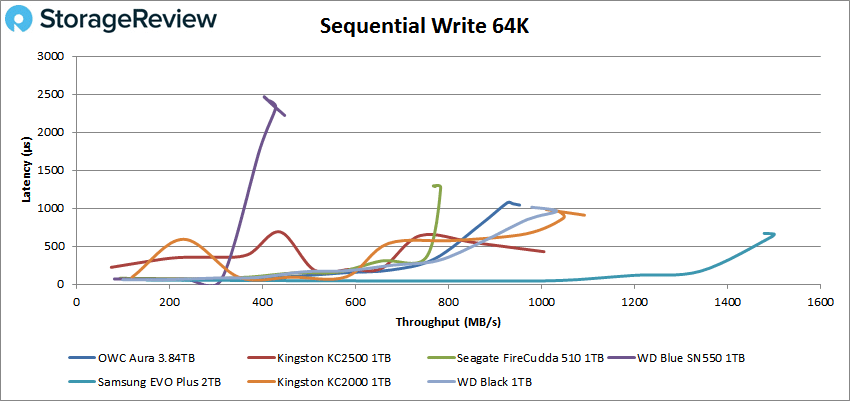
With 64K sequential performance, the Kingston KC2500 showed latency well below 1 millisecond throughout the test and went on to peak at 40,100 IOPS (or 2.56GB/s) with 390.1µs, which was the best performance of the tested drives by a significant margin.
In 64K write, the Kingston KC2500 showed a peak of 16,079 IOPS or 1.0GB/s at a latency of just 428µs.
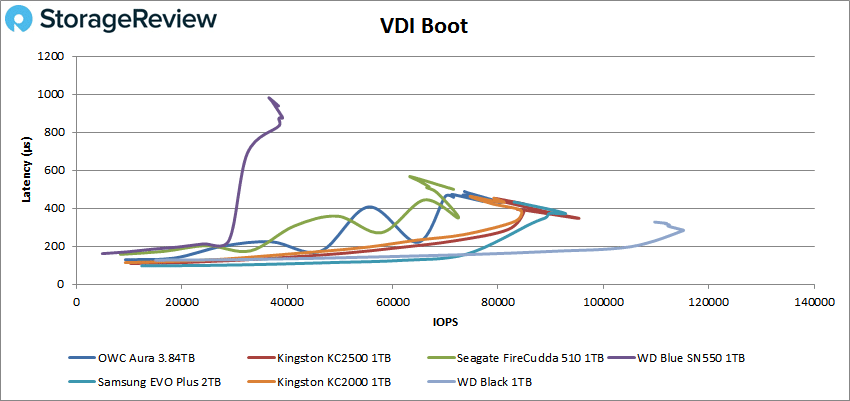
Next, we looked at our VDI benchmarks, which are designed to tax the drives even further. These tests include Boot, Initial Login, and Monday Login. Looking at the Boot test, the Kingston KC2500 showed an impressive peak of 95,192 IOPS at a latency of 347.1µs before it dipped in performance.
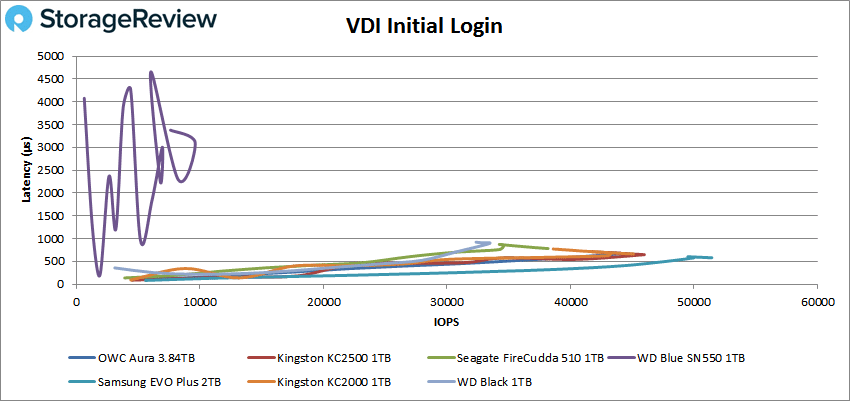
 In our VDI Initial Login Kingston KC2500 showed an impressive peak of 45,969 IOPS at a latency of 649.1µs before dropping off a bit once again.
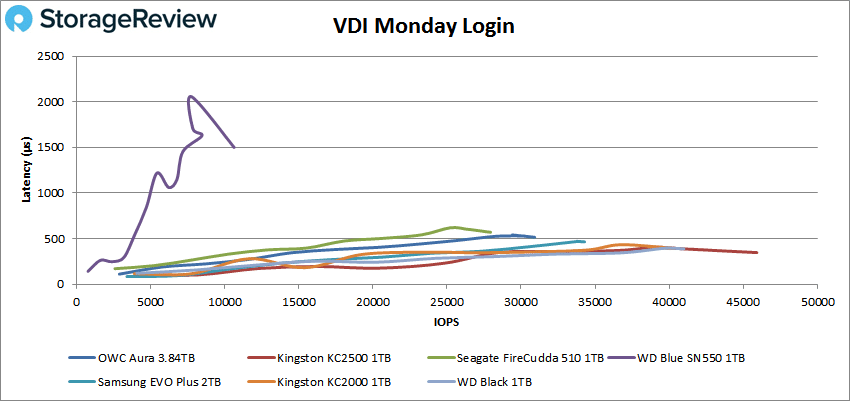
 In our last test, VDI Monday Login, the Kingston KC2500 finished very strong, with a peak performance of 45,907 IOPS at a very stable latency of just 346.6µs.
 Conclusion
 Conclusion
Kingston has expanded the affordable high-performance KC line with the addition of the KC2500, a worthy successor to the KC2000 with noticeable performance improvements. It offers a quality controller, 96-layer 3D TLC NAND, and up to 2TB of storage inside the compact M.2 form factor. The Kingston KC2500 also offers a range of security features, including support for TCG Opal 2.0, XTS-AES 256 bit, and eDrive.
For performance, we saw some pretty impressive results. Beginning with the Application Workload Analysis, the KC2500 hit 3,160.0 TPS with an average latency of 4ms in SQL Server output benchmarks, which was identical to the Intel 900P in both cases. In our VDbench test, the KC2500 continued to show solid results with results that put it among the leaders. Highlights include: 317,501 IOPS in 4K read, 317,501 IOPS in 4K write, 2.56GB/s in 64K read, and 1.0GB/s in 64K write where it beat out the older drive. In our VDI Clone, we saw 95,192 IOPS in boot, 45,969 IOPS in initial login, and 45,907 IOPS in Monday login.
Though there are more premium drives out there, users may be curbed by their more expensive price tags. Ultimately, the KC2500 delivers a very favorable performance profile. This makes it a great choice for users looking for that elusive mix; a cost-effective NVMe SSD that is also a great performer.


 Amazon