

Back at CES 2020, when shows were still a physical event, Seagate announced several new gaming drives. One of the internal drives announced was the Seagate FireCuda 510 SSD. This SSD comes in an M.2 form factor and leverages the NVMe interface. With NVMe PCIe Gen3 ×4 and a 28GB enhanced dynamic SLC cache, this drive is all about performance for gamers.
The Seagate FireCuda 510 SSD comes in capacities of 500GB, 1TB, and 2TB. Leveraging PCIe G3 x4, NVMe 1.3 the SSD can hit speeds upward of 3.45GB/s read and 3.2GB/s write. The drive has the endurance gamers need too with 1.8 million MTBF and up to 2,600 TBW. While it is primarily aimed at gamers, the drive offers performance that works for creative professionals as well.
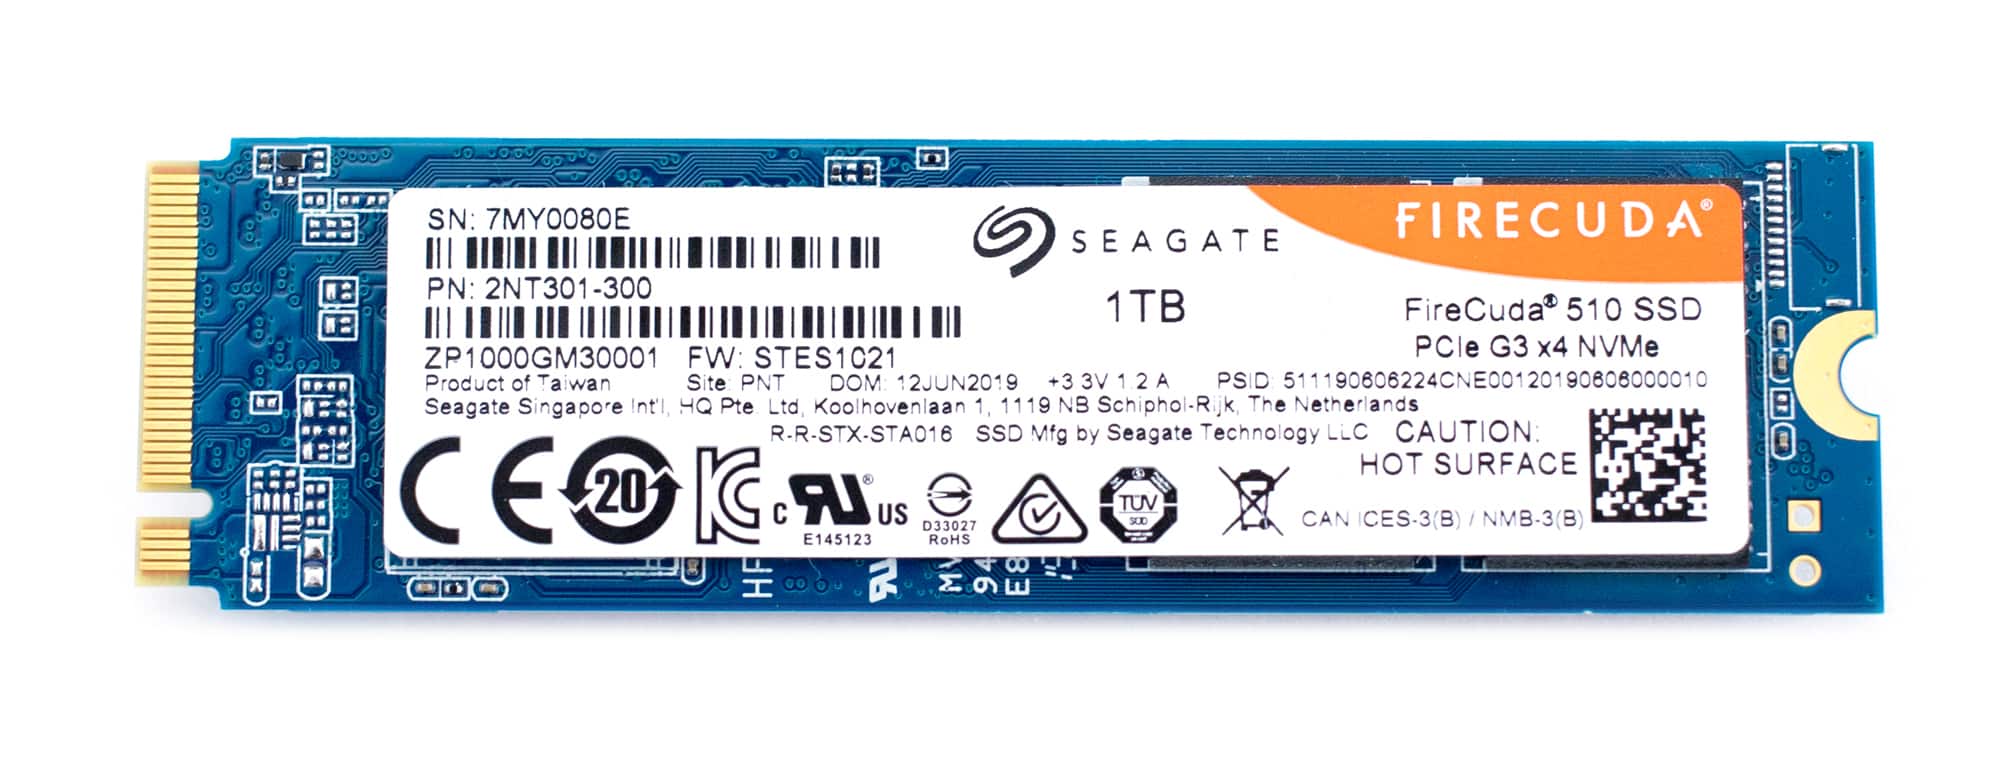
The Seagate FireCuda 510 SSD comes with a 5-year warranty and the smallest capacity can be picked up for about $108. For this review we will be looking at the 1TB.
We also have a video overview of the drive.
Seagate FireCuda 510 SSD Specifications
| Capacity | 2TB | 1TB | 500 GB |
| Standard Model (TCG Pyrite) | ZP2000GM30001 | ZP1000GM30001 | ZP500GM30001 |
| Interface | PCIe G3 ×4, NVMe 1.3 | PCIe G3 ×4, NVMe 1.3 | PCIe G3 ×4, NVMe 1.3 |
| NAND Flash Memory | 3D TLC | 3D TLC | 3D TLC |
| Form Factor | M.2 2280-D2 | M.2 2280-D2 | M.2 2280-D2 |
| Performance | |||
| Sequential Read (Max, MB/s), 128KB1 | 3450 | 3450 | 3450 |
| Sequential Write (Max, MB/s), 128KB1 | 3200 | 3200 | 2500 |
| Random Read (Max, IOPS), 4KB QD32 T81 | 485,000 | 620,000 | 420,000 |
| Random Write (Max, IOPS), 4KB QD32 T81 | 600,000 | 600,000 | 600,000 |
| Endurance/Reliability | |||
| Total Bytes Written (TB) | 2600 | 1300 | 650 |
| Mean Time Between Failures (MTBF, hours) | 1,800,000 | 1,800,000 | 1,800,000 |
| Warranty, Limited (years) | 5 | 5 | 5 |
| Power Management | |||
| Active Power, Average (W) | 6.0 | 5.5 | 4.7 |
| Idle Power PS3, Average (mW) | 26.4 | 20 | 16 |
| Low Power L1.2 mode (mW) | 2 | 2 | 2 |
| Environmental | |||
| Temperature, Operating Internal (°C) | 0 to 70 | 0 to 70 | 0 to 70 |
| Temperature, Nonoperating (°C) | –40 to 85 | –40 to 85 | –40 to 85 |
| Shock, Nonoperating: 0.5ms (Gs) | 1500 | 1500 | 1500 |
| Special Features | |||
| TRIM | Yes | Yes | Yes |
| S.M.A.R.T. | Yes | Yes | Yes |
| Halogen Free | Yes | Yes | Yes |
| RoHS Compliance | Yes | Yes | Yes |
| Physical | |||
| Length (mm/in, max) | 80.15mm/3.156in | 80.15mm/3.156in | 80.15mm/3.156in |
| Width (mm/in, max) | 22.15mm/0.872in | 22.15mm/0.872in | 22.15mm/0.872in |
| Height (mm/in, max) | 3.58mm/0.140in | 3.58mm/0.140in | 3.58mm/0.140in |
| Weight (g/lb) | 8.7g/0.019lb | 8.5g/0.018lb | 8.0g/0.017lb |
Seagate FireCuda 510 SSD Performance
Testbed
The test platform leveraged in these tests is a Dell PowerEdge R740xd server. We measure SATA performance through a Dell H730P RAID card inside this server, although we set the card in HBA mode only to disable the impact of RAID card cache. NVMe is tested natively through an M.2 to PCIe adapter card. The methodology used better reflects end-user workflow with the consistency, scalability and flexibility testing within virtualized server offers. A large focus is put on drive latency across the entire load range of the drive, not just at the smallest QD1 (Queue-Depth 1) levels. We do this because many of the common consumer benchmarks don’t adequately capture end-user workload profiles.
Comparables
For this review we will be comparing the Seagate FireCuda 510 SSD to several other M.2 SSD. Our Houdini test compares a majority of the SSD we’ve reviewed of the last few years in various form factors to give readers a good idea of how different drives place on the test. For our VDBench tests we will be comparing the FireCuda to the following:
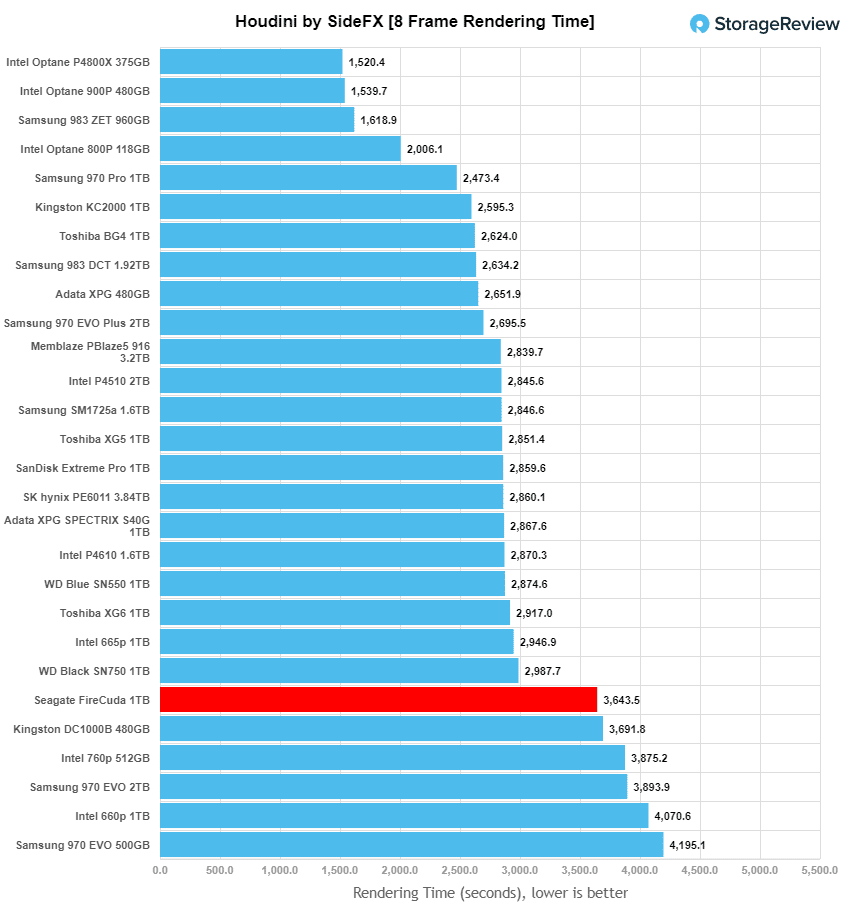
Houdini by SideFX
The Houdini test is specifically designed to evaluate storage performance as it relates to CGI rendering. The test bed for this application is a variant of the core Dell PowerEdge R740xd server type we use in the lab with dual Intel 6130 CPUs and 64GB DRAM. In this case we installed Ubuntu Desktop (ubuntu-16.04.3-desktop-amd64) running bare metal. Output of the benchmark is measured in seconds to complete, with fewer being better.
The Maelstrom demo represents a section of the rendering pipeline that highlights the performance capabilities of storage by demonstrating its ability to effectively use the swap file as a form of extended memory. The test does not write out the result data or process the points in order to isolate the wall-time effect of the latency impact to the underlying storage component. The test itself is composed of five phases, three of which we run as part of the benchmark, which are as follows:
- Loads packed points from disk. This is the time to read from disk. This is single threaded, which may limit overall throughput.
- Unpacks the points into a single flat array in order to allow them to be processed. If the points do not have dependency on other points, the working set could be adjusted to stay in-core. This step is multi-threaded.
- (Not Run) Process the points.
- Repacks them into bucketed blocks suitable for storing back to disk. This step is multi-threaded.
- (Not Run) Write the bucketed blocks back out to disk.
The Seagate FireCuda 510 SSD didn’t do great here, falling to near the bottom of the pack. The drive finished with 3,643.5 seconds.
VDBench Workload Analysis
When it comes to benchmarking storage devices, application testing is best, and synthetic testing comes in second place. While not a perfect representation of actual workloads, synthetic tests do help to baseline storage devices with a repeatability factor that makes it easy to do apples-to-apples comparison between competing solutions. These workloads offer a range of different testing profiles ranging from “four corners” tests, common database transfer size tests, to trace captures from different VDI environments. All of these tests leverage the common vdBench workload generator, with a scripting engine to automate and capture results over a large compute testing cluster. This allows us to repeat the same workloads across a wide range of storage devices, including flash arrays and individual storage devices. Our testing process for these benchmarks fills the entire drive surface with data, then partitions a drive section equal to 5% of the drive capacity to simulate how the drive might respond to application workloads. This is different than full entropy tests which use 100% of the drive and take them into steady state. As a result, these figures will reflect higher-sustained write speeds.
Profiles:
- 4K Random Read: 100% Read, 128 threads, 0-120% iorate
- 4K Random Write: 100% Write, 64 threads, 0-120% iorate
- 64K Sequential Read: 100% Read, 16 threads, 0-120% iorate
- 64K Sequential Write: 100% Write, 8 threads, 0-120% iorate
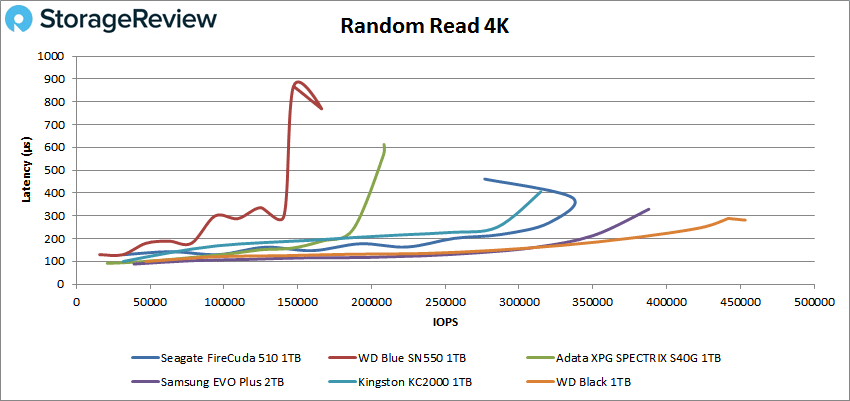
For random 4K read the Seagate FireCuda 510 SSD placed third in our pack with a peak score of about 337K IOPS at a latency of roughly 350µs before falling off. The WD Black took the top spot.
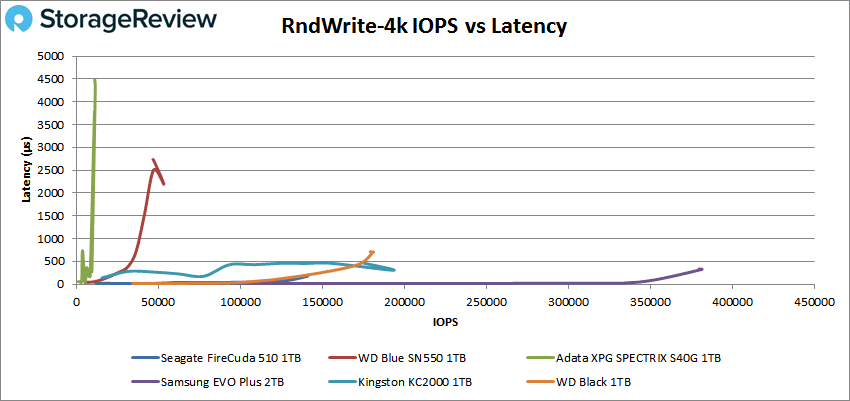
With random 4K write FireCuda had sub-100µs latency performance throughout a majority of our test and peaked at 141,153 IOPS with a latency of 179µs. This places the drive at fourth with the Samsung taking the lead.
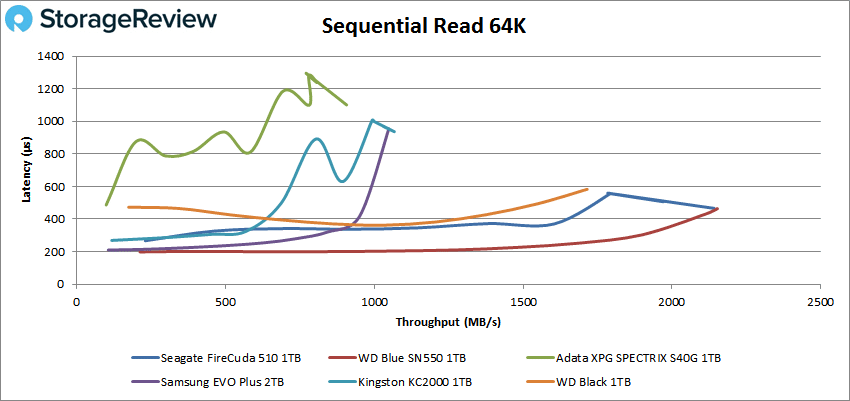
Switching over to sequential workloads, the FireCuda placed second in 64K read with a peak performance of 34,370 IOPS or 2.1GB/s at a latency of 466µs. The WD Blue took the top spot.
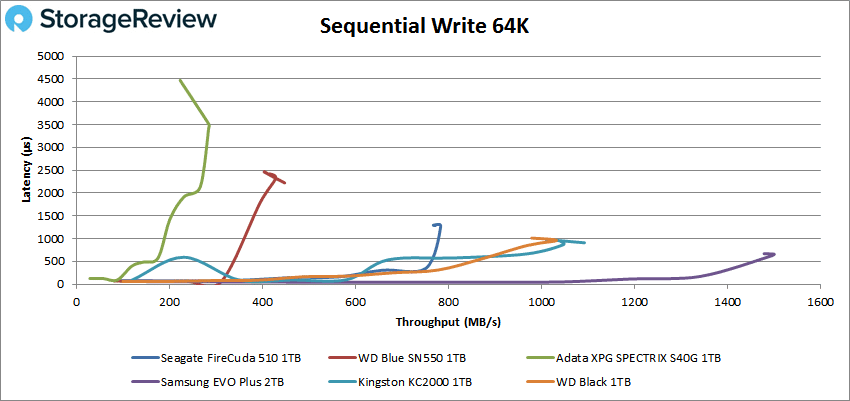
Our 64K write test saw the FireCuda landing fourth with a peak of 12,525 IOPS or 783MB/s at a latency of 1.3ms.
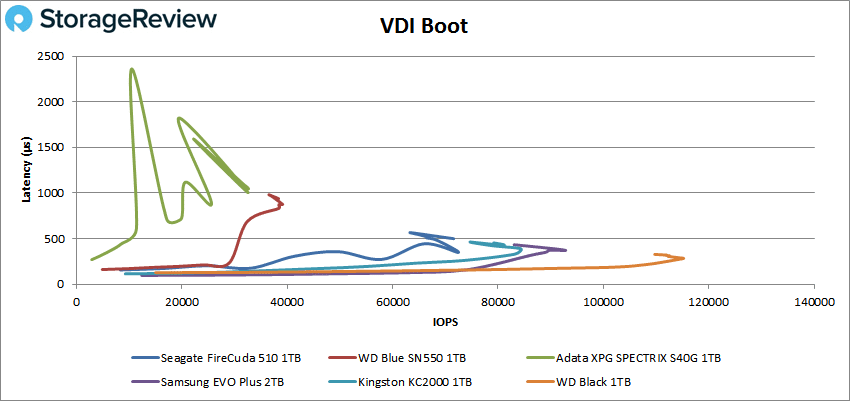
Next, we looked at our VDI benchmarks, which are designed to tax the drives even further. These tests include Boot, Initial Login, and Monday Login. Looking at the Boot test, the Seagate FireCuda 510 SSD came in fourth again with a peak performance of 73,697 IOPS at 262µs before dropping off some. The WD Black took the top spot.
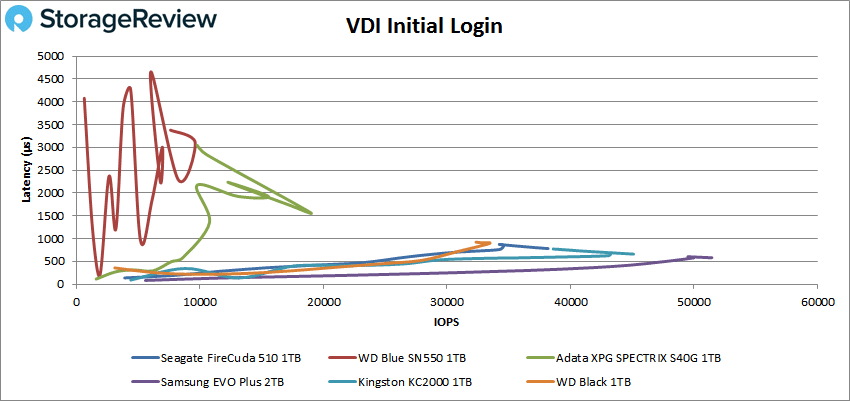
VDI Initial Login saw the FireCuda in third with a peak of 38,600 IOPS with a latency of 782µs. Top honors went to the Samsung.
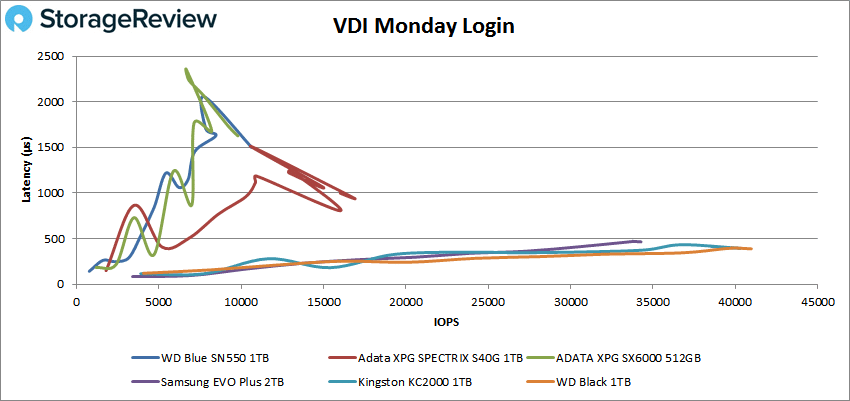
Finally, VDI Monday Login saw the FireCuda once again in fourth with a peak score of 27,940 IOPS at a latency of 570µs. The WD Black took the top spot here.
Conclusion
The Seagate FireCuda 510 is an M.2 SSD that is all about performance and aimed at gamers. The drive comes in capacities as high as 2TB for storing and loading users most played games. The FireCuda has performance claims of 3.45GB/s read and 3.2GB/s write and endurance of 1.8 million hours MTBF and up to 2,600 TBW.
Looking at performance, we compared the FireCuda to several other client M.2 SSDs. The FireCuda never took the top spot in any of our tests though its numbers weren’t bad by any means. In Houdini the drive landing towards the bottom half with 3,643.5 seconds. In our VDBench the FireCuda had highlights of 337K IOPS for 4K read, 141K IOPS for 4K write, 2.1GB/s read in 64K, and 783MB/s write in 64K. In our VDI benchmarks, the FireCuda hit 74K IOPS in boot, 39K IOPS in initial login, and 28K IOPS in Monday login.
Overall, the Seagate FireCuda 510 SSD delivers even overall performance. Users will have to look over the drives available and pick the right price to performance for their use cases. Time will tell if the drives become more competitive price-wise.


 Amazon