

The ThinkPad P1 Gen 8 is designed for engineers, developers, and creative professionals, combining powerful performance with a modern design to handle demanding workflows. Equipped with an Intel Core Ultra 7 255H, the ThinkPad harnesses the power of AI through a built-in NPU that delivers up to 13 TOPS. Lenovo pairs this with NVIDIA’s new RTX PRO 2000 Blackwell GPU (8GB GDDR7), making the system well-suited for CAD, 3D modeling, simulation, GPU-accelerated AI workflows, and high-end video production. Despite these heavy-hitting specs, Lenovo maintains an impressive lightweight feel and premium build quality with robust connectivity.

The ThinkPad P1 Gen 8 targets advanced business and creative professionals who require mobility without sacrificing workstation-class reliability. While not intended for casual users or the ultralight consumer market, it handles the challenges of both environments with ease.
| Processor | Intel H Series Core Ultra 5 235H / 7 255H / 7 265H / 9 285H (Series 2); up to 16 cores; up to 5.4GHz |
| NPU | Integrated Intel AI Boost, up to 13 TOPS |
| Graphics | Integrated Intel Arc 140T GPU; Discrete: NVIDIA RTX PRO 1000 / 2000 Blackwell 8GB GDDR7 |
| Memory | Up to 64GB LPDDR5x-7467 (1x LPCAMM2 slot, dual-channel) |
| Operating System | Windows 11 Pro/Home, Fedora Linux, Ubuntu Linux, RHEL 10 (certified Nov 2025) |
| Display | 16″ WUXGA IPS (500 nits) / 3.2K Tandem OLED Touch (600/1500 nits) / WQUXGA IPS (800 nits) |
| Storage | Up to 8TB (2x M.2 2280 PCIe slots), support PCIe 5.0 x4 SSD & RAID 0/1 |
| WLAN & Bluetooth | Intel Wi-Fi 7 BE201, 802.11be 2×2 + Bluetooth 5.4 |
| Ports | 2x Thunderbolt 5, 1x Thunderbolt 4, 1x USB-A 10Gbps, 1x HDMI 2.1, SD Express 7.0, headphone/mic jack |
| Audio | Stereo speakers (2W x2), Dolby Atmos, dual-microphone array with Dolby Voice |
| Camera | 5.0MP + IR with privacy shutter, Computer Vision Human Presence Detection |
| Keyboard | 6-row, spill-resistant, LED backlight, Copilot key, UltraNav (TrackPoint & glass Haptic Touchpad) |
| Battery | 90Wh, supports Rapid Charge (80% in 1hr), 140W USB-C GaN AC adapter |
| Dimensions & Weight | 354.3 x 241.0 x 9.9/15.8 mm (13.95 x 9.49 x 0.39/0.62 in); Starting at 1.84 kg (4.06 lbs) |
Design and Build
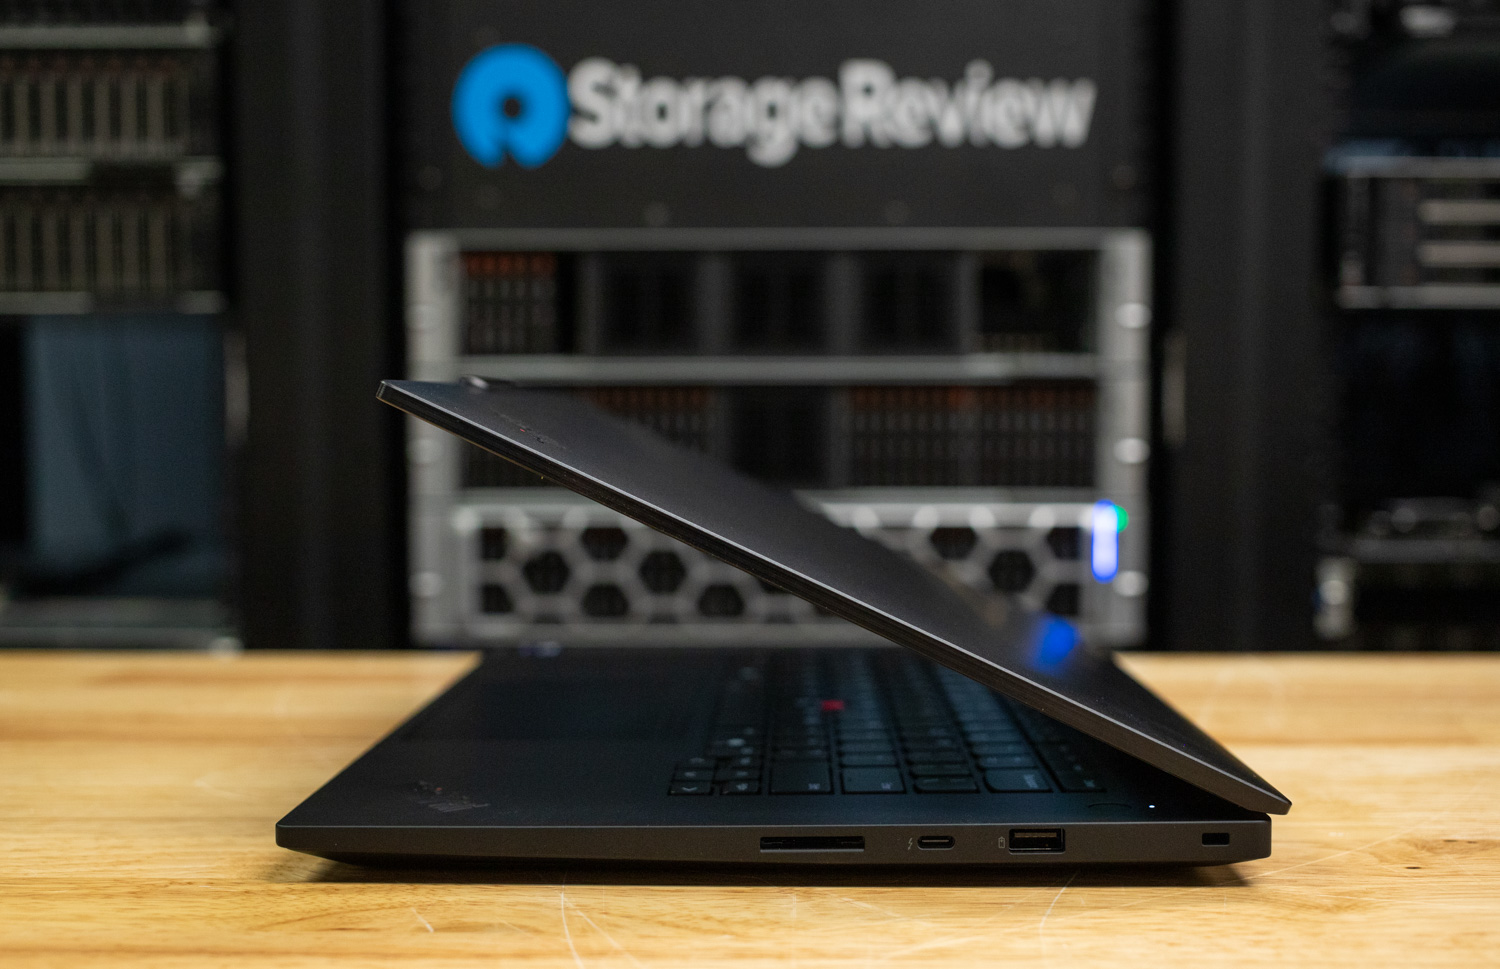
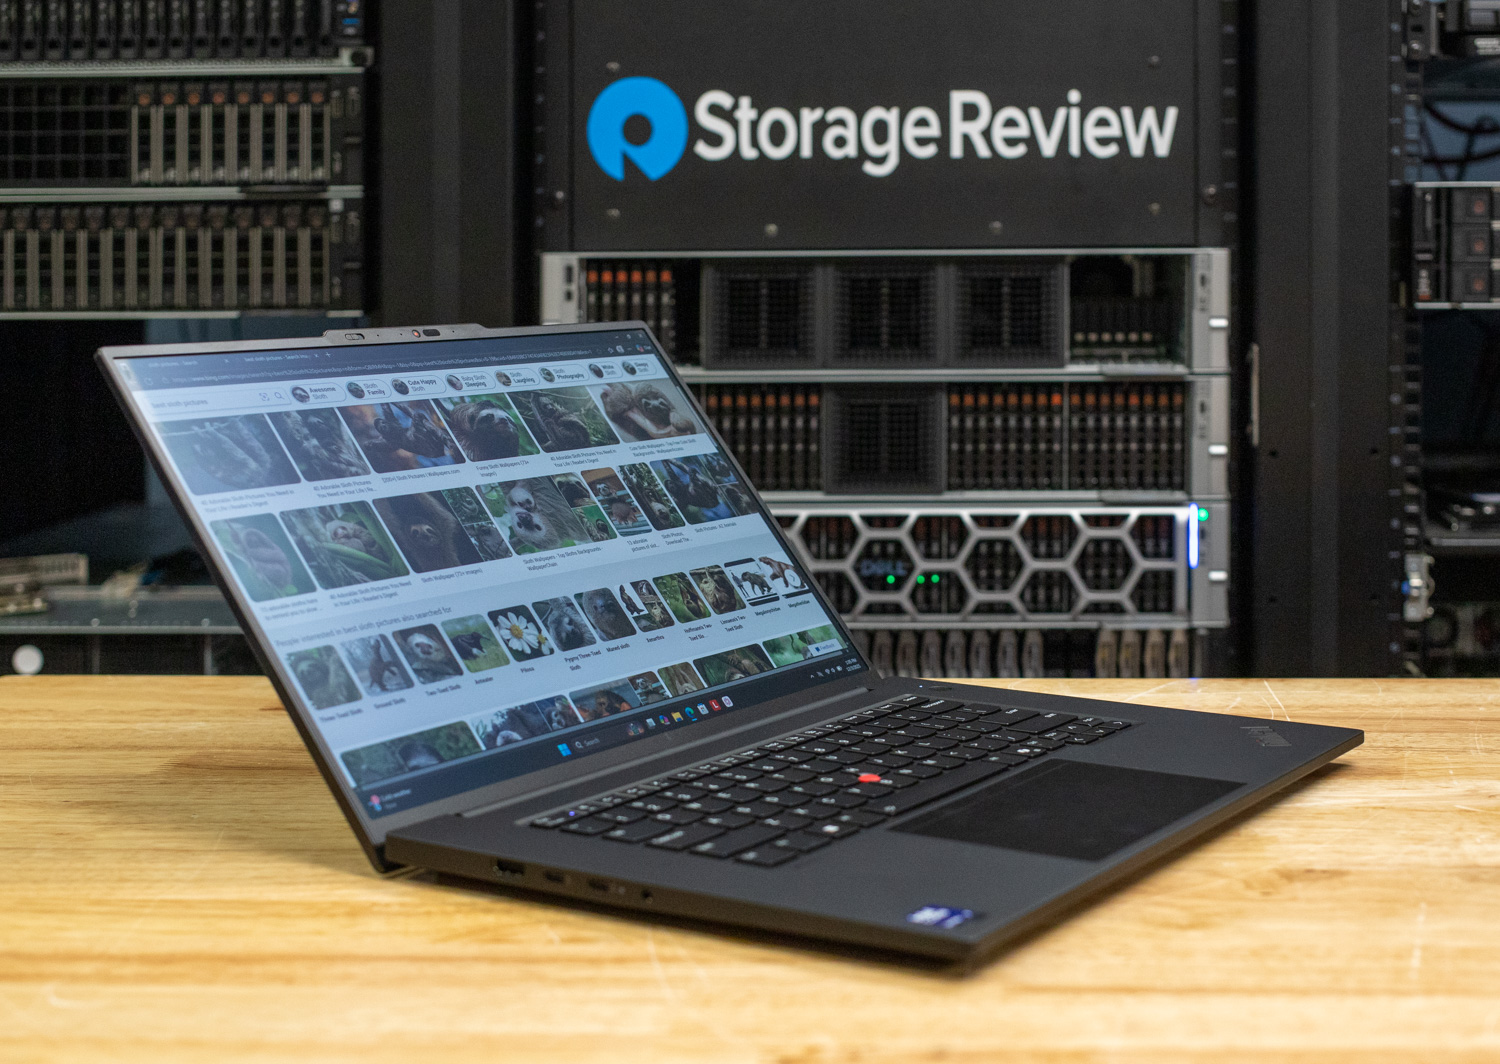
The design of the Gen 8 remains broadly consistent with the Gen 7, retaining the squared-off ThinkPad aesthetic in black while refining construction with sustainable recycled aluminum and magnesium. The build quality is phenomenal, exhibiting minimal chassis flex. With a starting weight of just 1.84 kg (4.06 lbs), the P1 Gen 8 remains one of the lightest workstations to offer high-end discrete graphics, making it noticeably easier to carry than most traditional 16-inch mobile workstations.
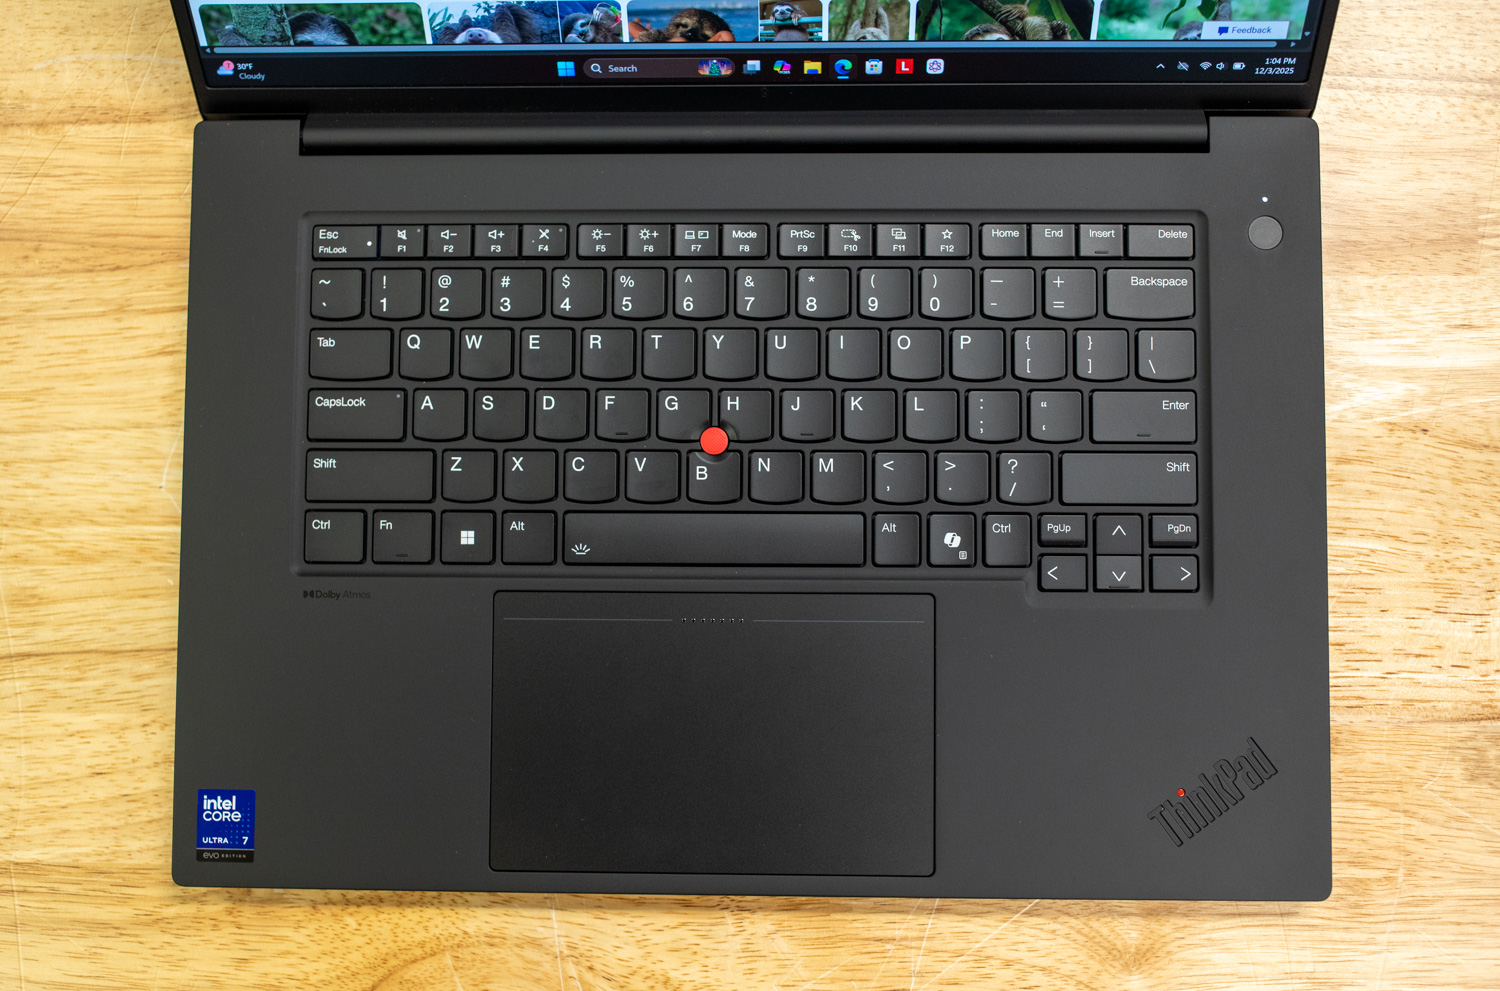
While keyboard preference is subjective, the ThinkPad’s input experience remains a highlight, offering perfect tactile feedback, LED backlighting, and spill resistance. It rivals the Dell Pro Max or XPS in typing quality. A dedicated Copilot key for quick AI access is a new addition to this generation. The UltraNav system, comprising the classic red TrackPoint and a large, glass-surface haptic touchpad, returns unchanged. The stereo speakers (2W x 2) support Dolby Atmos, though in practice, the audio performance is average.
The system offers a comprehensive, forward-looking port selection. The left side features two Thunderbolt 5 ports, a USB-A (10Gbps) port, an HDMI output, and a headphone/mic combo jack. The right side includes a Thunderbolt 4 port, an SD Express 7.0 card reader, and a Kensington Nano Security Slot.

Display options cater to all professional needs. The new flagship 3.2K Tandem OLED panel offers exceptional contrast (1,000,000:1), high brightness (1500 nits peak HDR), and a variable 40–120Hz refresh rate. For color-critical work, the 4K IPS and FHD+ IPS options remain excellent alternatives, all factory-calibrated by X-Rite.
Camera & Security
For remote collaboration, the ThinkPad P1 Gen 8 features a high-resolution 5.0MP webcam, a significant upgrade over standard 1080p sensors, ensuring sharp visuals during video conferences. The camera assembly includes a mechanical privacy shutter and is paired with a dual-microphone array featuring Dolby Voice for optimized audio clarity.

Security on the P1 Gen 8 is robust and enterprise-grade, covering physical, biometric, and firmware layers. For user authentication, the device features an infrared (IR) camera that enables secure, hands-free login via Windows Hello. There’s also a touch-style fingerprint reader integrated into the power button, which utilizes match-on-chip technology for enhanced security. This is cleverly augmented by Computer Vision Human Presence Detection. This innovative feature automatically locks the workstation when the user steps away and wakes it upon their return, enhancing data security and power efficiency.
Data protection begins with the hardware: the system features a dedicated discrete TPM 2.0 security chip, which is TCG and FIPS 140-2 certified, and available M.2 SSD configurations support Opal 2.0 self-encrypting drive technology. Physical theft prevention is addressed via the Kensington Nano Security Slot. The chassis includes bottom-cover tamper detection to alert against unauthorized access to internal components. Furthermore, the firmware is secured by a self-healing BIOS, along with standard features such as power-on, supervisor, and NVMe password support. Select configurations, specifically those with the Core Ultra 7 265H and Core Ultra 9 285H, are also eligible for Intel® vPro® Enterprise technology, providing advanced remote management and security capabilities essential for corporate environments.
Upgradability & Internals
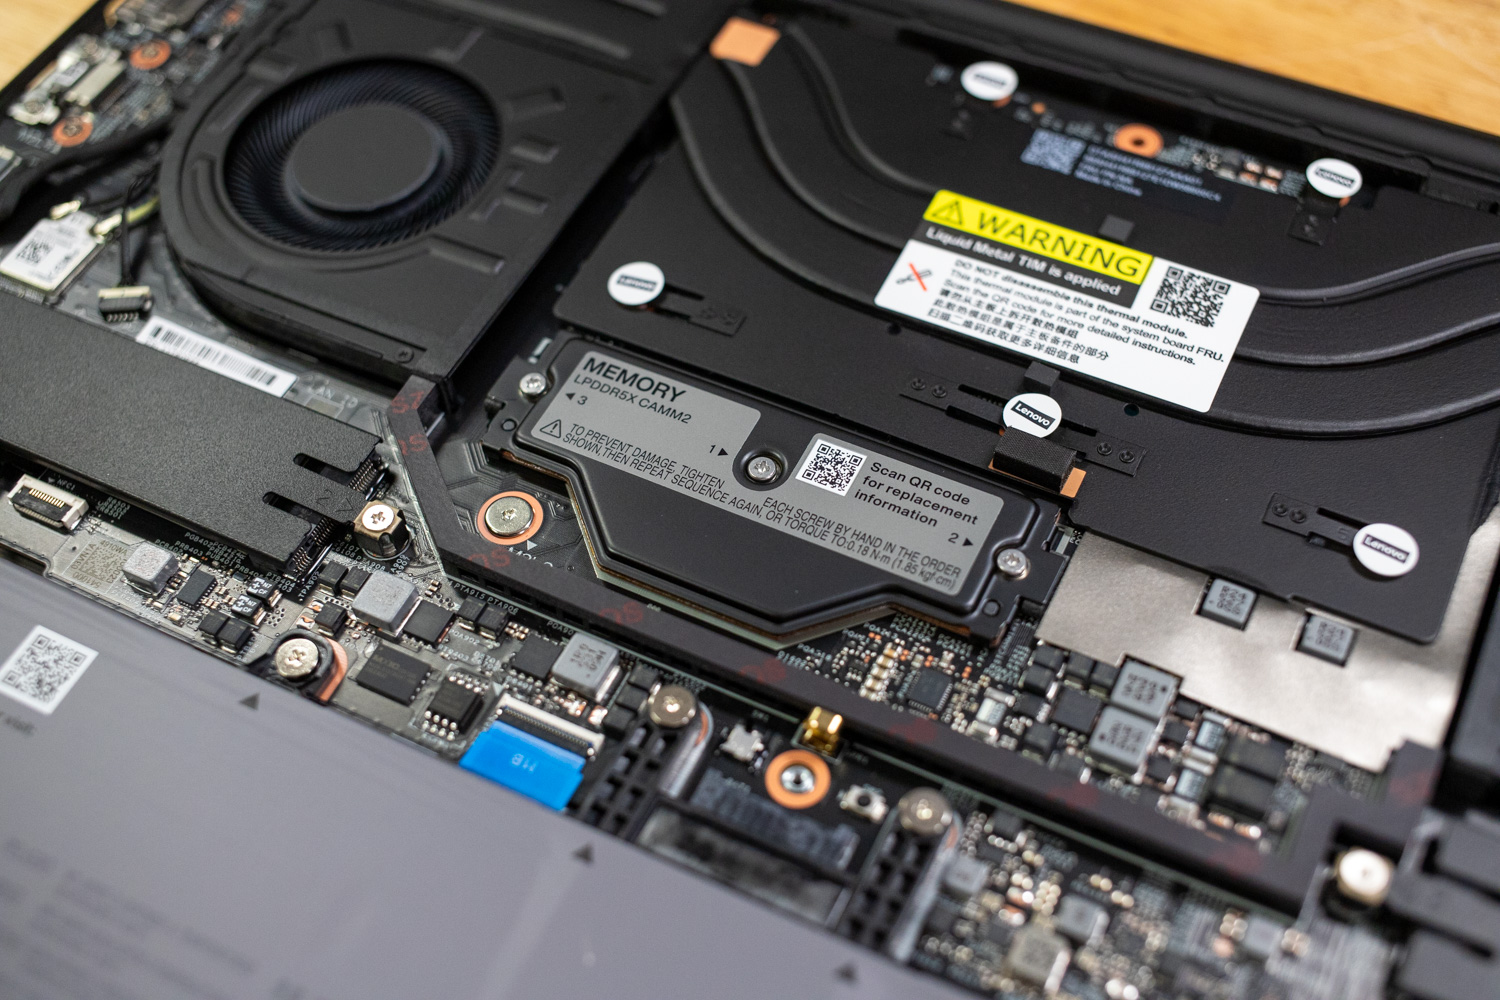
Maintenance is streamlined; six standard Phillips-head screws secure the bottom panel. Inside, users have access to one LPDDR5X CAMM2 memory slot (supporting up to 64GB), offering a balance between upgradability and the efficiency of LPDDR memory. Two Gen 4 M.2 2280 SSD slots support high-speed PCIe 5.0 drives with optional RAID configurations. The 90Wh battery is user-replaceable, ensuring sustainable long-term ownership.

Cooling is managed by a dual-fan thermal system utilizing liquid metal to handle the combined load of the Core Ultra CPU and Blackwell GPU. Fan noise remains modest under light loads, only becoming audible during heavy rendering or AI workloads.
Performance
Our ThinkPad P1 Gen 8 review unit has the following specifications:
- CPU: Intel Core Ultra 7 255H (16-core)
- GPU: NVIDIA RTX PRO 2000 (8GB GDDR7)
- RAM: 32GB LPDDR5X
- Display: 16-inch 3200×2000 Tandem OLED Touch
- Price: ~$4,169.00 (Retail)
We compared the ThinkPad P1 Gen 8 against two configurations of the Dell Pro Max 16: one with an AMD Ryzen AI 9 HX PRO 370 and another with an Intel Core Ultra 7 265H. While the AMD and Intel CPU architectures and GPU tiers differ, these represent the P1’s primary market competition.
Procyon AI Computer Vision
The Procyon AI Computer Vision Benchmark measures AI inference performance across CPUs, GPUs, and dedicated accelerators using a range of state-of-the-art neural networks. It evaluates tasks such as image classification, object detection, segmentation, and super-resolution using models that include MobileNet V3, Inception V4, YOLO V3, DeepLab V3, Real ESRGAN, and ResNet 50. Tests are run on multiple inference engines, including NVIDIA TensorRT, Intel OpenVINO, Qualcomm SNPE, Microsoft Windows ML, and Apple Core ML, providing a broad view of hardware and software efficiency. Results are reported for float- and integer-optimized models, providing a consistent, practical measure of machine vision performance for professional workloads.
The Lenovo ThinkPad P1 Gen 8 outperforms the Dell Pro Max 16 AMD in AI CPU tasks (score: 155 vs. 120) and edges out the Intel Pro Max model (153). The P1 is faster in MobileNet V3 and ResNet 50 tasks, indicating superior CPU efficiency for vision workloads. Using integrated graphics, Lenovo leads significantly with a score of 519, crushing the Intel Pro Max’s score of 275.
| CPU Results (average time in ms) | Lenovo ThinkPad P1 Gen 8 (Intel Core Ultra 7 255H) (NVIDIA RTX PRO 2000) | Dell Pro Max 16 AMD (AMD Ryzen AI 9 HX PRO 370) (NVIDIA RTX PRO 1000) | Dell Pro Max 16 Premium (Intel Core Ultra 7 265H) |
| AI Computer Vision Overall Score | 155 | 120 | 153 |
| MobileNet V3 | 0.93 ms | 1.21 ms | 0.98 ms |
| ResNet 50 | 8.52 ms | 9.75 ms | 8.83 ms |
| Inception V4 | 25.76 ms | 30.81 ms | 25.53 ms |
| DeepLab V3 | 31.79 ms | 57.37 ms | 31.94 ms |
| YOLO V3 | 62.96 ms | 67.98 ms | 63.71 ms |
| REAL-ESRGAN | 2,661.25 ms | 3,470.93 ms | 2,683.72 ms |
| CPU Integrated Graphics Results (average time in ms) | |||
| AI Computer Vision Overall Score | 519 | 439 | 275 |
| MobileNet V3 | 0.80 ms | 0.83 ms | 1.05 ms |
| ResNet 50 | 2.45 ms | 3.20 ms | 4.18 ms |
| Inception V4 | 7.14 ms | 9.43 ms | 10.69 ms |
| DeepLab V3 | 19.59 ms | 19.26 ms | 25.38 ms |
| YOLO V3 | 12.99 ms | 15.63 ms | 28.91 ms |
| REAL-ESRGAN | 224.14 ms | 286.48 ms | 1,033.83 ms |
UL Procyon: AI Text Generation
The Procyon AI Text Generation Benchmark streamlines AI LLM performance testing by providing a concise and consistent evaluation method. It enables repeated testing across multiple LLM models, minimizing the complexity of large model sizes and variable factors. Developed with AI hardware leaders, it optimizes the use of local AI accelerators to deliver more reliable, efficient performance assessments. The results measured below were tested using TensorRT.
For LLM tasks, the P1 Gen 8 dominates. In the Phi benchmark, it scored 2,154 compared to AMD’s 1,709, producing tokens at 77.33 tok/s. This trend holds for Mistral and Llama3 tests, where Lenovo reduces output duration by 20–60% compared to the Dell models.
| UL Procyon: AI Text Generation | Lenovo ThinkPad P1 Gen 8 (Intel Core Ultra 7 255H) (NVIDIA RTX PRO 2000) | Dell Pro Max 16 AMD (AMD Ryzen AI 9 HX PRO 370) (NVIDIA RTX PRO 1000) | Dell Pro Max 16 Premium (Intel Core Ultra 7 265H) |
| Phi Overall Score | 2,154 | 1,709 | 1,057 |
| Phi Output Time To First Token | 0.427 s | 0.543 s | 0.578 s |
| Phi Output Tokens Per Second | 77.332 tok/s | 61.895 tok/s | 25.202 tok/s |
| Phi Overall Duration | 38.047 s | 47.564 s | 110.643 s |
| Mistral Overall Score | 1,998 | 1,538 | 1,001 |
| Mistral Output Time To First Token | 0.663 | 0.865 s | 0.742 s |
| Mistral Output Tokens Per Second | 58.159 tok/s | 44.929 tok/s | 16.311 tok/s |
| Mistral Overall Duration | 50.965 s | 66.150 s | 169.883 s |
| Llama3 Overall Score | 1,745 | 1,375 | 914 |
| Llama3 Output Time To First Token | 0.674 s | 0.848 s | 0.682 s |
| Llama3 Output Tokens Per Second | 50.569 tok/s | 39.475 tok/s | 14.034 tok/s |
| Llama3 Overall Duration | 58.518 s | 75.026 s | 196.199 s |
| Llama2 Overall Score | – | – | 937 |
| Llama2 Output Time To First Token | – | – | 1.341 s |
| Llama2 Output Tokens Per Second | – | – | 8.712 tok/s |
| Llama2 Overall Duration | – | – | 316.035 s |
UL Procyon: AI Image Generation
The Procyon AI Image Generation Benchmark provides a consistent and accurate method for measuring AI inference performance across a range of hardware, from low-power NPUs to high-end GPUs. It includes three tests: Stable Diffusion XL (FP16) for high-end GPUs, Stable Diffusion 1.5 (FP16) for moderately powerful GPUs, and Stable Diffusion 1.5 (INT8) for low-power devices. The benchmark uses the optimal inference engine for each system, ensuring fair and comparable results.
In Image Generation (Stable Diffusion 1.5 FP16), the P1 scored 1,291, well above the AMD (1,027) and Intel Pro Max (334), completing images roughly 3–4x faster than the Intel Pro Max unit.
| UL Procyon: AI Image Generation | Lenovo ThinkPad P1 Gen 8 (Intel Core Ultra 7 255H) (NVIDIA RTX PRO 2000) | Dell Pro Max 16 AMD (AMD Ryzen AI 9 HX PRO 370) (NVIDIA RTX PRO 1000) | Dell Pro Max 16 Premium (Intel Core Ultra 7 265H) |
| Stable Diffusion 1.5 (FP16) – Overall Score | 1,291 | 1,027 | 334 |
| Stable Diffusion 1.5 (FP16) – Overall Time | 77.457 s | 97.301 s | 298.677 s |
| Stable Diffusion 1.5 (FP16) – Image Generation Speed | 4.841 s/image | 6.081 s/image | 18.667 s/image |
| Stable Diffusion 1.5 (INT8) – Overall Score | 15,336 | 13,504 | 1,934 |
| Stable Diffusion 1.5 (INT8) – Overall Time | 16.301 s | 18.512 s | 129.216 s |
| Stable Diffusion 1.5 (INT8) – Image Generation Speed | 2.038 s/image | 2.314 s/image | 16.152 s/image |
| Stable Diffusion XL (FP16) – Overall Score | 1,008 | 785 | 356 |
| Stable Diffusion XL (FP16) – Overall Time | 594.719 s | 763.666 s | 1683.796 s |
| Stable Diffusion XL (FP16) – Image Generation Speed | 37.170 s/image | 47.729 s/image | 105.237 s/image |
SPECviewperf 15
SPECviewperf 15 is the industry-standard benchmark for evaluating 3D graphics performance across OpenGL, DirectX, and Vulkan APIs. It introduces new workloads, including blender-01 (Blender 3.6), unreal_engine-01 (Unreal Engine 5.4, DirectX 12), and enscape-01 (Enscape 4.0, Vulkan ray tracing), along with updated traces for 3ds Max, CATIA, Creo, Maya, and SolidWorks. With its redesigned GUI, modern application support, and advanced rendering workloads, SPECviewperf 15 provides consistent, real-world insights into professional graphics performance.
Lenovo leads in professional graphics workloads. In 3ds Max, the P1 scored 31.52, significantly higher than AMD (20.84) and Intel Pro Max (8.50). Across Blender, CATIA, and Maya, the P1 consistently delivers markedly higher scores, demonstrating superior GPU acceleration for CAD and 3D modeling.
| SPECviewperf (higher is better) | Lenovo ThinkPad P1 Gen 8 (Intel Core Ultra 7 255H) (NVIDIA RTX PRO 2000) | Dell Pro Max 16 AMD (AMD Ryzen AI 9 HX PRO 370) (NVIDIA RTX PRO 1000) | Dell Pro Max 16 Premium (Intel Core Ultra 7 265H) |
| 3dsmax-08 | 31.52 | 20.84 | 8.50 |
| blender-01 | 43.10 | 34.79 | 6.55 |
| catia-07 | 56.04 | – | 9.86 |
| creo-04 | 149.12 | 115.03 | 23.65 |
| energy-04 | 64.32 | 52.27 | 8.09 |
| enscape-01 | 32.92 | 26.16 | 2.98 |
| maya-07 | 124.26 | 108.05 | 27.67 |
| medical-04 | 116.47 | 90.64 | 14.50 |
| solidworks-08 | 73.04 | 57.16 | 12.06 |
| unreal_engine-01 | 63.83 | 51.95 | 17.17 |
LuxMark
LuxMark is a GPU benchmark that uses LuxRender, an open-source ray-tracing renderer, to evaluate a system’s performance with highly detailed 3D scenes. This benchmark is relevant for assessing the graphical rendering capabilities of servers and workstations, especially for visual effects and architectural visualization applications, where accurate light simulation is crucial.
The P1’s NVIDIA RTX PRO 2000 GPU achieves 17,505 in Hallbench and 6,676 in Food tests, outperforming the AMD (12,664 / 4,680) and Intel Pro Max (5,116 / 2,055). Lenovo’s ray-tracing performance is clearly superior for professional rendering workloads.
| LuxMark (higher is better) | Lenovo ThinkPad P1 Gen 8 (Intel Core Ultra 7 255H)(NVIDIA RTX PRO 2000) | Dell Pro Max 16 AMD (AMD Ryzen AI 9 HX PRO 370)(NVIDIA RTX PRO 1000) | Dell Pro Max 16 Premium (Intel Core Ultra 7 265H) |
| Hallbench | 17,505 | 12,664 | 5,116 |
| Food | 6,676 | 4,680 | 2,055 |
7-Zip Compression
The 7-Zip Compression Benchmark evaluates CPU performance during compression and decompression, measuring GIPS (Giga Instructions Per Second) and CPU usage. Higher GIPS and efficient CPU usage indicate superior performance.
CPU performance is competitive. Lenovo shows a compression rating of 8.63 GIPS, surpassing the AMD (4.95 GIPS) and slightly exceeding the Intel Pro Max (8.28 GIPS). For decompression, Lenovo achieves 8.19 GIPS, compared with 6.02 GIPS for AMD and 8.06 GIPS for Intel, indicating strong single-threaded and multithreaded CPU efficiency for file compression tasks.
| 7-Zip Compression Benchmark (higher is better) | Lenovo ThinkPad P1 Gen 8 (Intel Core Ultra 7 255H) (NVIDIA RTX PRO 2000) | Dell Pro Max 16 AMD (AMD Ryzen AI 9 HX PRO 370) (NVIDIA RTX PRO 1000) | Dell Pro Max 16 Premium (Intel Core Ultra 7 265H) |
| Compression | |||
| Current CPU Usage | 1,304% | 2,230% | 1,307% |
| Current Rating/Usage | 8.630 GIPS | 4.953 GIPS | 8.284 GIPS |
| Current Rating | 112.570 GIPS | 110.458 GIPS | 108.266 GIPS |
| Resulting CPU Usage | 1,304% | 2,231% | 1,310% |
| Resulting Rating/Usage | 8.599 GIPS | 4.966 GIPS | 8.649 GIPS |
| Resulting Rating | 112.105 GIPS | 110.798 GIPS | 113.252 GIPS |
| Decompression | |||
| Current CPU Usage | 1,371% | 2,109% | 1,248% |
| Current Rating/Usage | 8.037 GIPS | 6.023 GIPS | 7.745 GIPS |
| Current Rating | 110.156 GIPS | 127.034 GIPS | 96.626 GIPS |
| Resulting CPU Usage | 1,274% | 2,106% | 1,257% |
| Resulting Rating/Usage | 8.187 GIPS | 6.017 GIPS | 8.057 GIPS |
| Resulting Rating | 104.292 GIPS | 126.735 GIPS | 101.205 GIPS |
| Total Rating | |||
| Total CPU Usage | 1,289% | 2,169% | 1,283% |
| Total Rating/Usage | 8.393 GIPS | 5.491 GIPS | 8.353 GIPS |
| Total Rating | 108.198 GIPS | 118.766 GIPS | 107.229 GIPS |
Blackmagic RAW Speed Test
The Blackmagic RAW Speed Test is a performance benchmark that measures a system’s capabilities for video playback and editing with the Blackmagic RAW codec. It evaluates how well a system decodes and plays back high-resolution video files, reporting frame rates for both CPU- and GPU-based processing.
Lenovo handles GPU decoding exceptionally well, scoring 144 FPS in 8K OPENCL playback, well above AMD (46 FPS) and Intel Pro Max (54 FPS), though CPU-only playback is similar (81 FPS). This makes the P1 highly suited for GPU-accelerated video workflows.
| Blackmagic RAW Speed Test | Lenovo ThinkPad P1 Gen 8 (Intel Core Ultra 7 255H) (NVIDIA RTX PRO 2000) | Dell Pro Max 16 AMD (AMD Ryzen AI 9 HX PRO 370) (NVIDIA RTX PRO 1000) | Dell Pro Max 16 Premium (Intel Core Ultra 7 265H) |
|---|---|---|---|
| 8K CPU | 81 | 75 | 82 |
| 8K OPENCL | 144 | 46 | 54 |
Blackmagic Disk Speed Test
The Blackmagic Disk Speed Test evaluates storage performance by measuring read and write speeds, providing insights into a system’s ability to handle data-intensive tasks, such as video editing and large file transfers.
The Lenovo P1 offers fast storage with read speeds of 5,316 MB/s and write speeds of 4,728 MB/s, slightly ahead of the AMD model (5,037 / 4,923 MB/s) but below the Intel Pro Max (6,938 / 6,684 MB/s).
| Disk Speed Test (higher is better) | Lenovo ThinkPad P1 Gen 8 (Intel Core Ultra 7 255H) (NVIDIA RTX PRO 2000) | Dell Pro Max 16 AMD (AMD Ryzen AI 9 HX PRO 370) (NVIDIA RTX PRO 1000) | Dell Pro Max 16 Premium (Intel Core Ultra 7 265H) |
| Read | 5,316.0MB/s | 5,037.0MB/s | 6,938.6MB/s |
| Write | 4,728.4MB/s | 4,923.1MB/s | 6,684.1MB/s |
Blender 4.5
Blender is an open-source 3D modeling application. This benchmark was run using the Blender Benchmark utility. The score is measured in samples per minute, with higher values indicating better performance.
This CPU test is intense and rewards the stronger Core HX chips found in the Pro Max Plus laptops. The Pro Max 16 Premium’s numbers were slightly better than those of the Pro Max 14 Premium, although only marginally more than half as good as the Pro Max 16 Plus.
For CPU rendering in Blender, Lenovo performs solidly, with Monster scenes at 124.07 samples/min, compared to AMD (135.1) and Intel Pro Max (107.9). Lenovo generally outpaces Intel Pro Max across all scene types, though the AMD HX CPU retains a slight edge in multithreaded workloads.
| Blender CPU (samples per minute, higher is better) | Lenovo ThinkPad P1 Gen 8 (Intel Core Ultra 7 255H) (NVIDIA RTX PRO 2000) | Dell Pro Max 16 AMD (AMD Ryzen AI 9 HX PRO 370) (NVIDIA RTX PRO 1000) | Dell Pro Max 16 Premium (Intel Core Ultra 7 265H) |
| Monster | 124.07 | 135.1 | 107.9 |
| Junkshop | 85.67 | 92.5 | 73.1 |
| Classroom | 65.83 | 75.3 | 53.8 |
y-cruncher
y-cruncher is a multithreaded and scalable program that can compute Pi and other mathematical constants to trillions of digits. Since its launch in 2009, it has become a popular benchmarking and stress-testing application for overclockers and hardware enthusiasts.
Lenovo computes Pi quickly, completing 1 billion digits in 26.666 s, versus 21.856 s for AMD and 40.370 s for Intel Pro Max, highlighting strong multithreaded integer performance—faster than Intel Pro Max but slightly slower than AMD HX chips in high-thread workloads.
| Y-Cruncher (Total Computation Time) | Lenovo ThinkPad P1 Gen 8 (Intel Core Ultra 7 255H) (NVIDIA RTX PRO 2000) | Dell Pro Max 16 AMD (AMD Ryzen AI 9 HX PRO 370)(NVIDIA RTX PRO 1000) (NVIDIA RTX PRO 1000) | Dell Pro Max 16 Premium (Intel Core Ultra 7 265H) |
|---|---|---|---|
| 1 Billion | 26.666 s | 21.856 s | 40.370 s |
| 2.5 Billion | 78.836 s | 61.851 s | 109.487 s |
| 5 Billion | 177.286 | 137.051 s | – |
| 10 Billion | – | 313.942 s | – |
Geekbench 6
Geekbench 6 is a cross-platform benchmark that measures overall system performance. The Pro Max 16 proved competitive in single-core testing against the Premium models and their Core Ultra 2-series H-class chips, although it wasn’t directly compared to the higher-clocked HX chips in the Plus models. The multi-core numbers weren’t in the Pro Max 16’s favor; it finished noticeably behind the Premium models and wasn’t in the same class as the Plus laptops. The OpenCL test followed patterns observed in other tests, with the Pro Max 16 finishing behind the Pro Max 14 Premium, although ahead of the integrated-GPU Pro Max 16 Premium.
In single-core performance, the ThinkPad P1 Gen 8 (2,719) trails the Dell configurations slightly, falling just behind both the AMD (2,875) and Intel Pro Max (2,844) models. However, the ThinkPad recovers significantly in multi-core workloads; with a score of 16,899, it surpasses the Dell AMD unit (15,319) and sits just shy of the Dell Intel Pro Max (17,310), proving it can handle heavy multitasking despite its thinner chassis. The standout metric, however, is the GPU performance: the ThinkPad’s NVIDIA RTX PRO 2000 achieves a massive OpenCL score of 102,494, dominating both the Dell AMD (81,098) and more than doubling the score of the Dell Intel Pro Max (43,255).
| Geekbench 6 (higher is better) | Lenovo ThinkPad P1 Gen 8 (Intel Core Ultra 7 255H) (NVIDIA RTX PRO 2000) | Dell Pro Max 16 AMD (AMD Ryzen AI 9 HX PRO 370) (NVIDIA RTX PRO 1000) | Dell Pro Max 16 Premium (Intel Core Ultra 7 265H) |
|---|---|---|---|
| CPU Single-Core | 2,719 | 2,875 | 2,844 |
| CPU Multi-Core | 16,899 | 15,319 | 17,310 |
| GPU OpenCL | 102,494 | 81,098 | 43,255 |
Topaz Video AI
Topaz Video AI is a professional application for enhancing and restoring video using advanced AI models. It supports various tasks, including upscaling footage to 4K or 8K, sharpening blurry content, reducing noise, enhancing facial details, colorizing black-and-white footage, and interpolating frames for smoother motion. The suite includes an onboard benchmark that measures system performance across its different video-enhancing algorithms, giving a clear view of how well hardware platforms handle demanding AI video processing workloads.
Lenovo excels in AI video enhancement. For the Artemis model at 1X, it achieves 9.92 FPS, compared with 5.74 FPS on AMD and 4.81 FPS on Intel Pro Max, and similar improvements are seen across Iris, Proteus, and other models. The P1 consistently delivers ~2x–3x higher FPS than AMD and significantly more than Intel Pro Max for demanding AI video tasks.
| Topaz Video AI Benchmark (Frames per second, higher is better) | Lenovo ThinkPad P1 Gen 8 (Intel Core Ultra 7 255H) (NVIDIA RTX PRO 2000) | Dell Pro Max 16 AMD (AMD Ryzen AI 9 HX PRO 370) (NVIDIA RTX PRO 1000) | Dell Pro Max 16 Premium (Intel Core Ultra 7 265H) | ||||||
|---|---|---|---|---|---|---|---|---|---|
| Model | 1X | 2X | 4X | 1X | 2X | 4X | 1X | 2X | 4X |
| Artemis | 9.92 | 7.47 | 2.64 | 5.74 | 3.99 | 1.47 | 4.81 | 3.35 | 1.20 |
| Iris | 12.29 | 7.16 | 2.27 | 5.89 | 3.70 | 1.47 | 3.87 | 2.37 | 0.75 |
| Proteus | 9.97 | 7.58 | 2.76 | 5.63 | 4.31 | 1.47 | 4.96 | 3.71 | 1.47 |
| Gaia | 3.27 | 2.28 | 1.66 | 2.43 | 1.64 | 0.93 | 1.95 | 1.33 | 0.93 |
| Nyx | 4.81 | 4.10 | – | 2.42 | 2.12 | – | .93 | 0.73 | – |
| Nyx Fast | 10.50 | – | – | 4.51 | – | – | 1.71 | – | – |
| Rhea | – | – | 1.78 | – | – | 0.33 | – | – | 0.56 |
| RXL | – | – | 1.75 | – | – | 0.30 | – | – | 0.58 |
| Hyperion HDR | 19.74 | – | – | 14.39 | – | – | 2.04 | – | – |
| Apollo | 14.32 | – | – | 8.77 | – | – | 4.23 | – | – |
| Aion | 17.91 | – | – | – | – | – | – | – | – |
| APFast | 56.57 | – | – | 27.34 | – | – | 13.47 | – | – |
| Chronos | 8.06 | – | – | 1.17 | – | – | 2.88 | – | – |
| CHFast | 12.72 | – | – | 6.71 | – | – | 4.04 | – | – |
3DMark CPU
The 3DMark CPU Profile evaluates processor performance across six threading levels: 1, 2, 4, 8, 16, and max threads. Each test runs the same boid-based simulation workload to assess how well the CPU scales under different thread counts, with minimal GPU involvement. The benchmark helps identify single-thread efficiency and multithreaded potential for tasks such as gaming, content creation, and rendering. Scores across 8 threads often align with modern DirectX 12 gaming performance, while 1–4-thread results reflect older or esports game scenarios.
Lenovo scales well in multithreaded workloads, scoring 11,558 on max threads and 7,822 on 8 threads, slightly above AMD (10,396 / 7,214) but slightly below Intel Pro Max (11,593 / 7,984). Single-thread performance is strong, with 1,230 versus 1,173 AMD and 1,225 Intel Pro Max.
| 3DMark CPU Profile (higher is better) | Lenovo ThinkPad P1 Gen 8 (Intel Core Ultra 7 255H) (NVIDIA RTX PRO 2000) | Dell Pro Max 16 AMD (AMD Ryzen AI 9 HX PRO 370) (NVIDIA RTX PRO 1000) | Dell Pro Max 16 Premium (Intel Core Ultra 7 265H) |
|---|---|---|---|
| Max Threads | 11,558 | 10,396 | 11,593 |
| 16 Threads | 11,562 | 9,879 | 11,658 |
| 8 Threads | 7,822 | 7,214 | 7,984 |
| 4 threads | 4,593 | 4,445 | 4,604 |
| 2 threads | 2,403 | 2,310 | 2,391 |
| 1 threads | 1,230 | 1,173 | 1,225 |
3DMark Storage
The 3DMark Storage Benchmark tests your SSD’s gaming performance by measuring tasks like loading games, saving progress, installing game files, and recording gameplay. It evaluates how well your storage performs in real-world gaming and supports the latest storage technologies to provide accurate performance insights.
Lenovo’s storage performs solidly at 1,897, faster than Intel Pro Max (1,014) but below AMD (2,459), making it competitive for game loading and file-intensive tasks.
| 3DMark Storage (higher is better) | Lenovo ThinkPad P1 Gen 8 (Intel Core Ultra 7 255H) (NVIDIA RTX PRO 2000) | Dell Pro Max 16 AMD (AMD Ryzen AI 9 HX PRO 370) (NVIDIA RTX PRO 1000) | Dell Pro Max 16 Premium (Intel Core Ultra 7 265H) |
|---|---|---|---|
| Score | 1,897 | 2,459 | 1,014 |
V-Ray
The V-Ray Benchmark measures rendering performance for CPUs, NVIDIA GPUs, or both using advanced V-Ray 6 engines. It utilizes quick tests and a simple scoring system to enable users to evaluate and compare their systems’ rendering capabilities. It’s an essential tool for professionals seeking efficient performance insights.
For CPU/GPU rendering, Lenovo scores 3,518, ahead of AMD (2,787) and Intel Pro Max (3,186), demonstrating superior combined rendering performance for professional VFX and architectural visualization.
| Vray (higher is better) | Lenovo ThinkPad P1 Gen 8 (Intel Core Ultra 7 255H) (NVIDIA RTX PRO 2000) | Dell Pro Max 16 AMD (AMD Ryzen AI 9 HX PRO 370) (NVIDIA RTX PRO 1000) | Dell Pro Max 16 Premium (Intel Core Ultra 7 265H) |
|---|---|---|---|
| Score | 3,518 | 2,787 | 3,186 |
PCMark battery
To measure battery life in mobile systems, we use PCMark 10. It includes a Modern Office benchmark, providing a realistic assessment of battery life during typical workday tasks. It simulates everyday office activities, such as writing documents, browsing the web, and participating in video conferences, with built-in periods of inactivity to mirror how people use their laptops. This isn’t just about peak performance; it focuses on sustained usage under a moderate workload. It helps you understand how long you can expect a laptop to last through a day of office work.
The test operates in 10-minute cycles, balancing active tasks with periods of inactivity. Specifically, the Writing and Web Browsing workloads involve roughly 4.5 minutes of activity followed by 5.5 minutes of inactivity, while Video Conferencing is lighter, at 2 minutes of busy time and 8 minutes of idle time. This approach provides a more accurate representation of real-world battery drain than running demanding tasks continuously, giving you a better idea of longevity for everyday productivity.
The Lenovo P1 provides excellent endurance at 12 hr 59 min, shorter than the AMD (16 hr 2 min) but notably better than the Intel Pro Max (10 hr 2 min), offering a balance between performance and real-world battery life.
| PCMark Battery (higher is better) | Lenovo ThinkPad P1 Gen 8 (Intel Core Ultra 7 255H) (NVIDIA RTX PRO 2000) | Dell Pro Max 16 AMD (AMD Ryzen AI 9 HX PRO 370) (NVIDIA RTX PRO 1000) | Dell Pro Max 16 Premium (Intel Core Ultra 7 265H) |
|---|---|---|---|
| Time Elapsed | 12 Hr 59 Min | 16 Hr 2 Min | 10 Hr 2 Min |
Conclusion
The Lenovo ThinkPad P1 Gen 8 successfully defends its title as the premier choice for professionals who demand workstation-grade power in a chassis that travels like an ultrabook. By pairing the Intel Core Ultra 7 with NVIDIA’s RTX PRO 2000 Blackwell architecture, Lenovo has created a machine that punches above its weight class.
Throughout our testing, the P1 Gen 8 consistently distinguished itself from the competition. Whether handling complex generative AI tasks or rendering high-fidelity 3D scenes, this system consistently outperformed Dell Pro Max 16 configurations. However, this performance comes at a cost. With a retail price of ~$4,169, the ThinkPad commands a noticeable premium over the Dell Pro Max 16 AMD and Intel variants.
Yet, for power users, the return on that investment is clear. You are paying for a 3.2K OLED visual feast, a fantastic typing experience, and nearly 13 hours of battery life, all packed into a frame starting at just 1.84 kg. While the cost of entry is high compared to its rivals, for engineers and creatives who refuse to be tethered to a desk, the P1 Gen 8 justifies the expense as an uncompromising engineering triumph.


 Amazon