

The Lenovo ThinkStation P3 Tiny Gen 2 is the next evolution of last year’s powerhouse, delivering impressive performance in an incredibly compact 1-liter design. Built for professionals who need serious speed and reliability, it comes equipped with the latest Intel Core processors, NVIDIA RTX workstation graphics, high-speed memory, and advanced storage options. As usual, Lenovo sets the standard for reliability and enterprise support. Designed for power users in Media & Entertainment, STEM fields, and Healthcare, including both professionals and students, it offers outstanding performance in a compact, space-efficient form.
CPU Support
The P3 Tiny is powered by Intel’s latest Core Ultra (Series 2) processors, offering a balance of performance and efficiency for modern business workloads. It supports a range of options from the Core Ultra 5 up to the Core Ultra 9, giving users flexibility to choose the right level of power for their needs. These processors feature Intel’s hybrid architecture with up to 24 cores, 36 MB of Intel Smart Cache, and strong integrated graphics performance.
Processor Options
The P3 Tiny has a reasonable but less diverse selection of Intel Core Ultra Processors (Series 2), allowing businesses to choose an ideal setup based on their workload needs. The following table shows a breakdown of supported CPUs:
| Intel Core Ultra Processor | Cores / Threads | Base Frequency | Max Turbo Frequency | Cache |
|---|---|---|---|---|
| Intel Core Ultra 5 225 Processor | 10 (6 P-core + 4 E-core) 10 Threads |
P-core 3.3 GHz / E-core 2.7 GHz | P-core 4.9 GHz / E-core 4.4 GHz | 20 MB Intel® Smart Cache |
| Intel Core Ultra 5 225T Processor | 10 (6 P-core + 4 E-core) 10 Threads |
P-core 2.5 GHz / E-core 1.9 GHz | P-core 4.9 GHz / E-core 4.4 GHz | 20 MB Intel® Smart Cache |
| Intel Core Ultra 5 235 Processor | 14 (6 P-core + 8 E-core) 14 Threads |
P-core 3.4 GHz / E-core 2.9 GHz | P-core 5.0 GHz / E-core 4.4 GHz | 24 MB Intel® Smart Cache |
| Intel Core Ultra 5 235T Processor | 14 (6 P-core + 8 E-core) 14 Threads |
P-core 2.2 GHz / E-core 1.6 GHz | P-core 5.0 GHz / E-core 4.4 GHz | 24 MB Intel® Smart Cache |
| Intel Core Ultra 5 245 Processor | 14 (6 P-core + 8 E-core) 14 Threads |
P-core 3.5 GHz / E-core 3.0 GHz | P-core 5.1 GHz / E-core 4.5 GHz | 24 MB Intel® Smart Cache |
| Intel Core Ultra 5 245T Processor | 14 (6 P-core + 8 E-core) 14 Threads |
P-core 2.2 GHz / E-core 1.7 GHz | P-core 5.1 GHz / E-core 4.5 GHz | 24 MB Intel® Smart Cache |
| Intel Core Ultra 7 265 Processor | 20 (8 P-core + 12 E-core) 20 Threads |
P-core 2.4 GHz / E-core 1.8 GHz | P-core 5.2 GHz / E-core 4.6 GHz | 30 MB Intel® Smart Cache |
| Intel Core Ultra 7 265T Processor | 20 (8 P-core + 12 E-core) 20 Threads |
P-core 1.5 GHz / E-core 1.2 GHz | P-core 5.2 GHz / E-core 4.6 GHz | 30 MB Intel® Smart Cache |
| Intel Core Ultra 9 285 Processor | 24 (8 P-core + 16 E-core) 24 Threads |
P-core 2.5 GHz / E-core 1.9 GHz | P-core 5.4 GHz / E-core 4.6 GHz | 36 MB Intel® Smart Cache |
| Intel Core Ultra 9 285T Processor | 24 (8 P-core + 16 E-core) 24 Threads |
P-core 1.4 GHz / E-core 1.2 GHz | P-core 5.3 GHz / E-core 4.6 GHz | 36 MB Intel® Smart Cache |
Build and Design
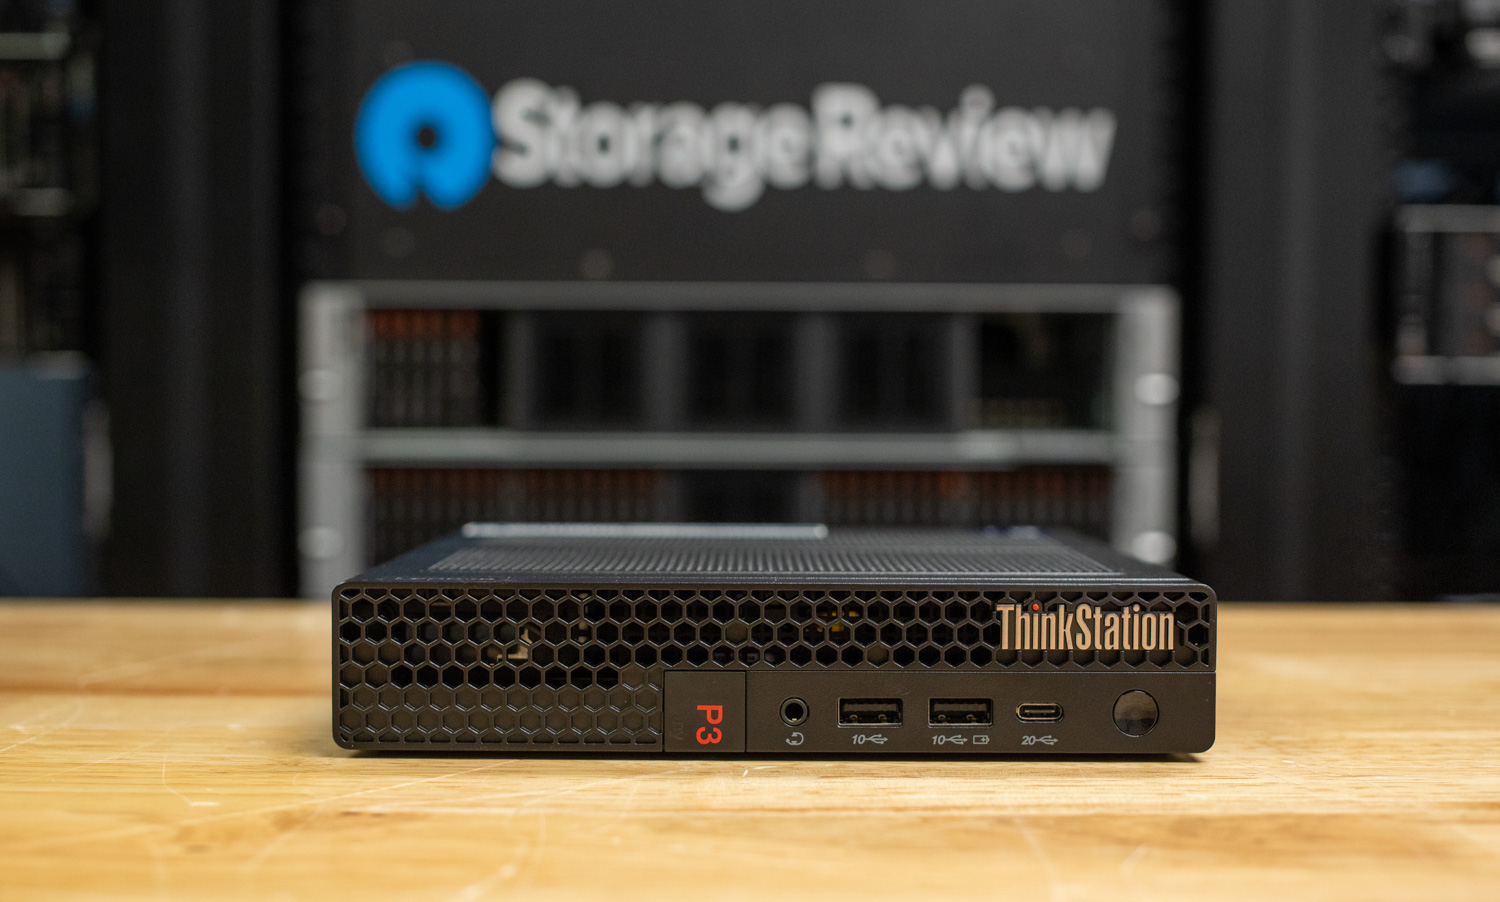
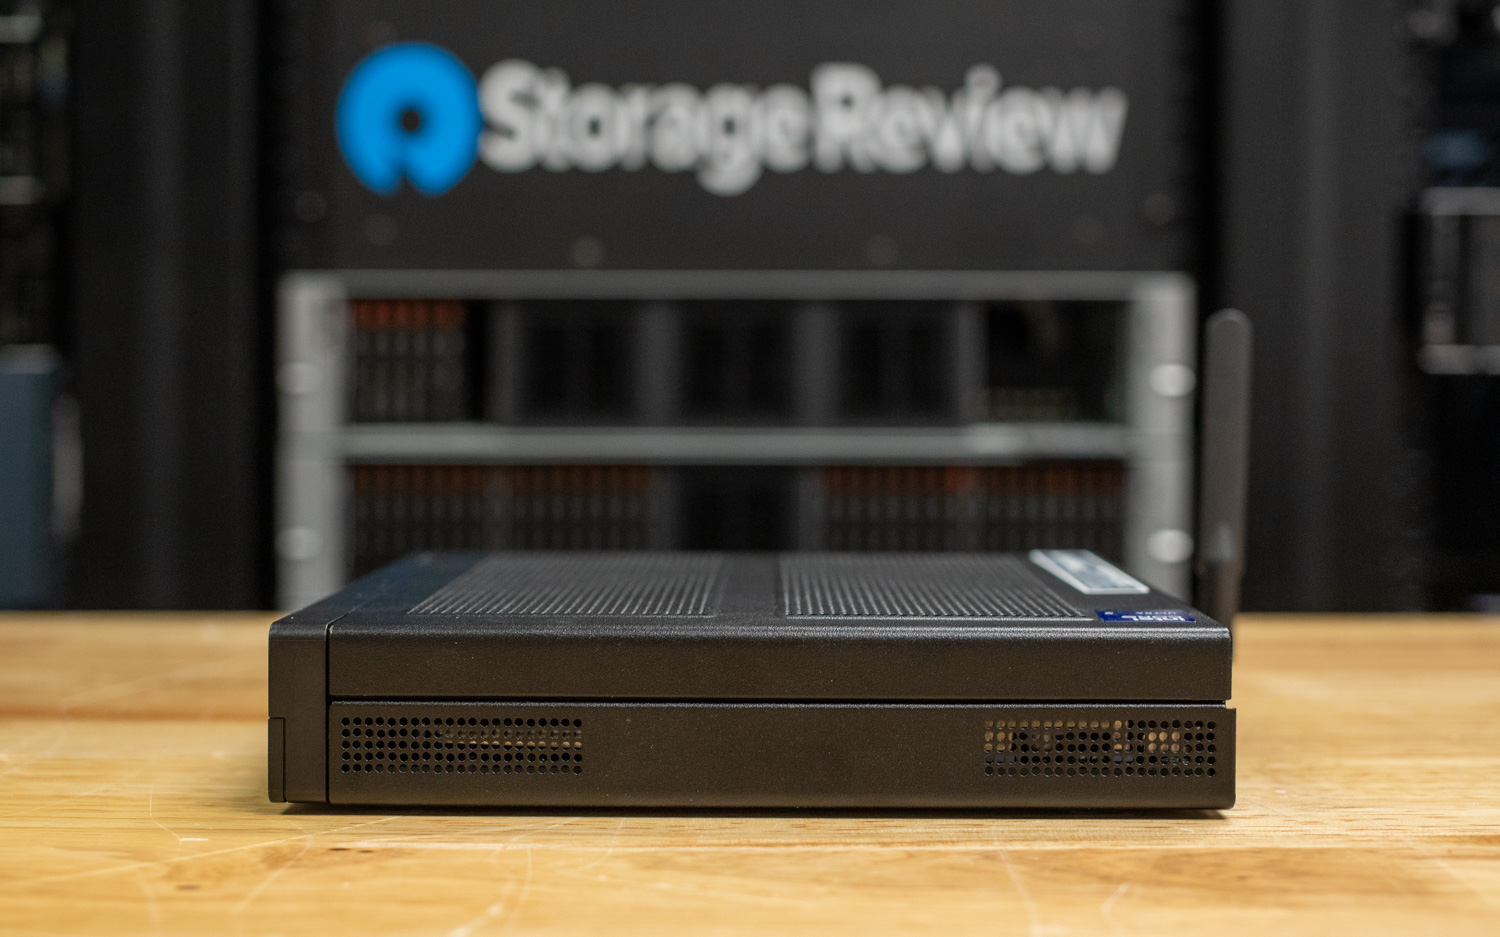
The ThinkStation P3 Tiny Gen 2 continues Lenovo’s mastery of compact engineering, delivering workstation-grade performance in a remarkably small form factor. Measuring just 179 x 182.9 x 37mm, this 1-liter system easily fits into tight office setups or on crowded desks without compromising power or cooling. The design remains understated, with clean lines, a matte black finish, and subtle red accents that maintain Lenovo’s familiar professional aesthetic.
Despite its size, the P3 Tiny packs serious hardware. Our configuration includes an NVIDIA RTX A1000 GPU, providing workstation-grade performance for CAD, 3D modeling, rendering, and light AI workloads. One limitation, however, is the lack of VESA mounting support, which prevents it from attaching directly to a monitor. Lenovo mitigates this by including a vertical stand, which helps conserve desk space while improving airflow through the top and rear vents.
On the front panel, the layout mirrors last year’s P3 Tiny. It includes:
- A 3.5mm combo audio jack (headphone/mic)
- Two USB-A 10Gbps ports (one with always-on charging)
- A USB-C 10Gbps port for quick data transfers or accessories
- Power button and a disk activity LED
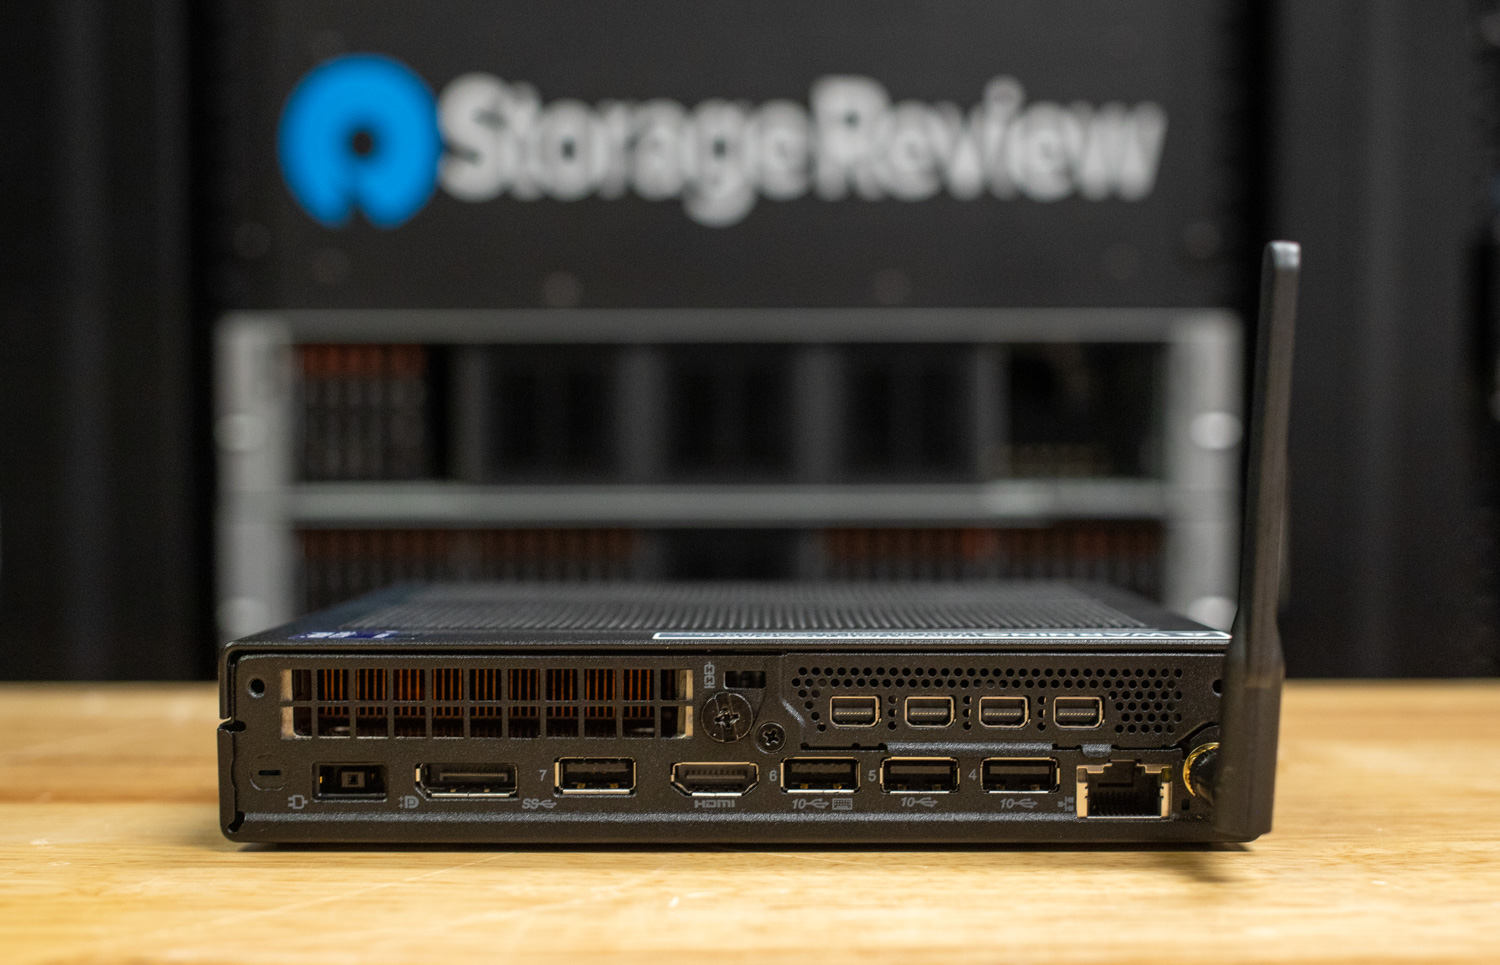
The rear I/O is equally practical, with a full spread of connectivity, including:
- Power connector
- DisplayPort 1.4 and HDMI 2.1 TMDS
- One USB-A 5Gbps and three USB-A 10Gbps ports (one featuring Smart Power On)
- Ethernet (RJ-45) for wired networking
- Two punch-out expansion slots that offer flexibility for future configurations (in this model, they are occupied by the RTX A1000)
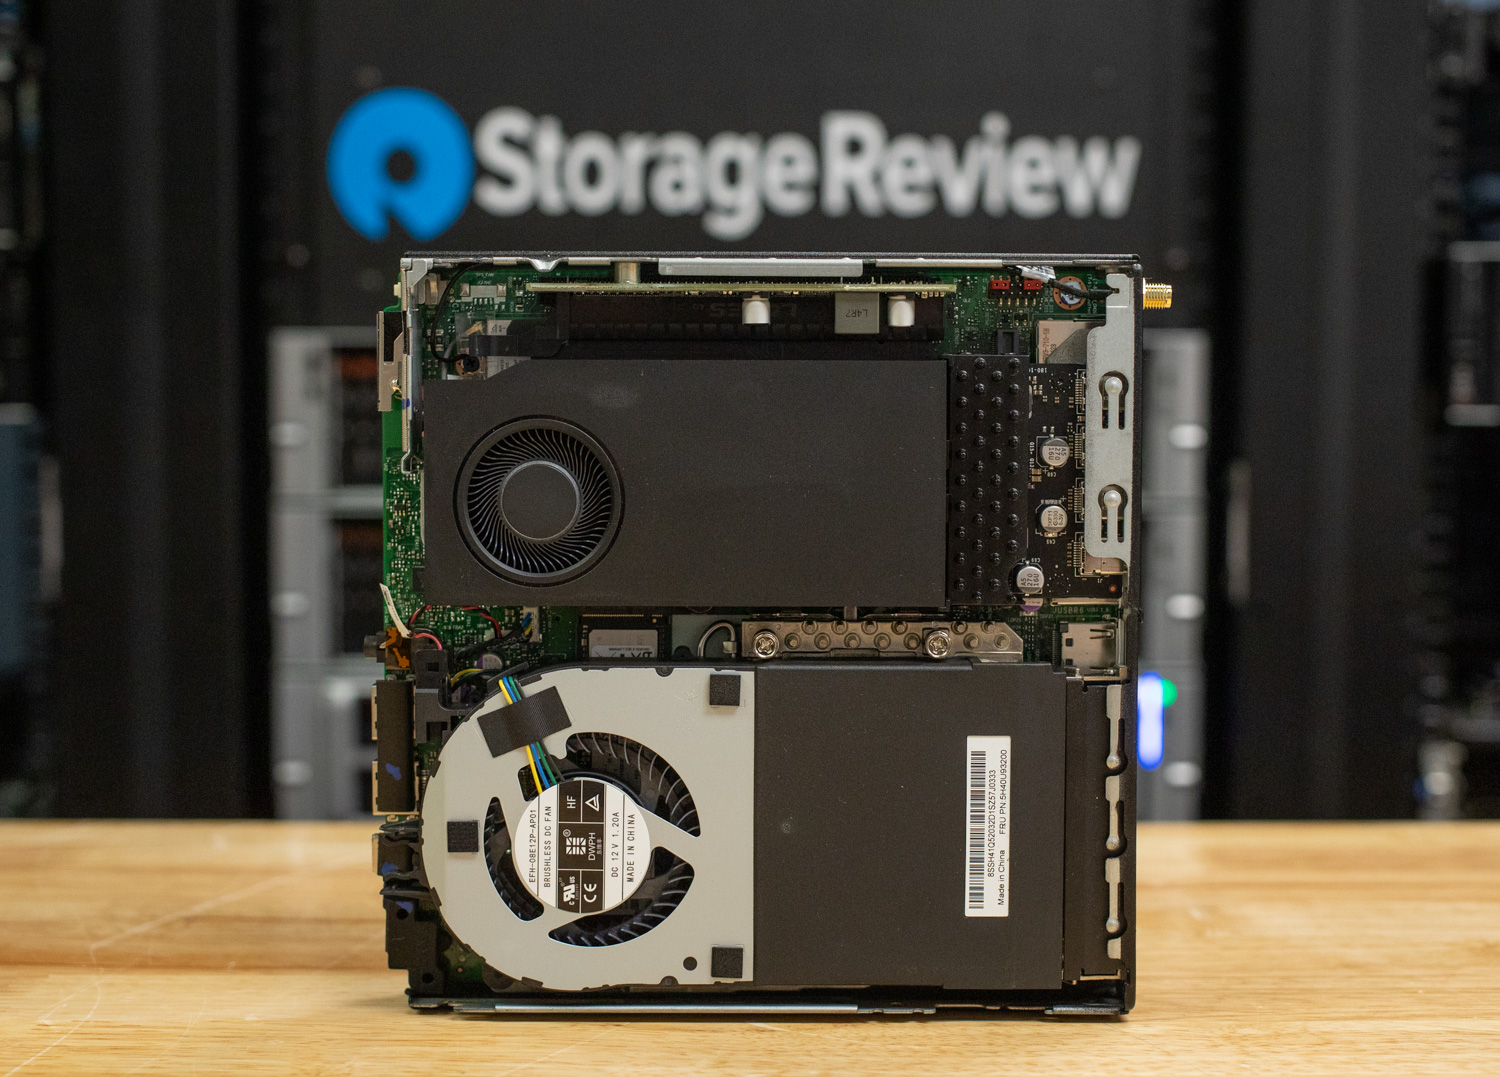
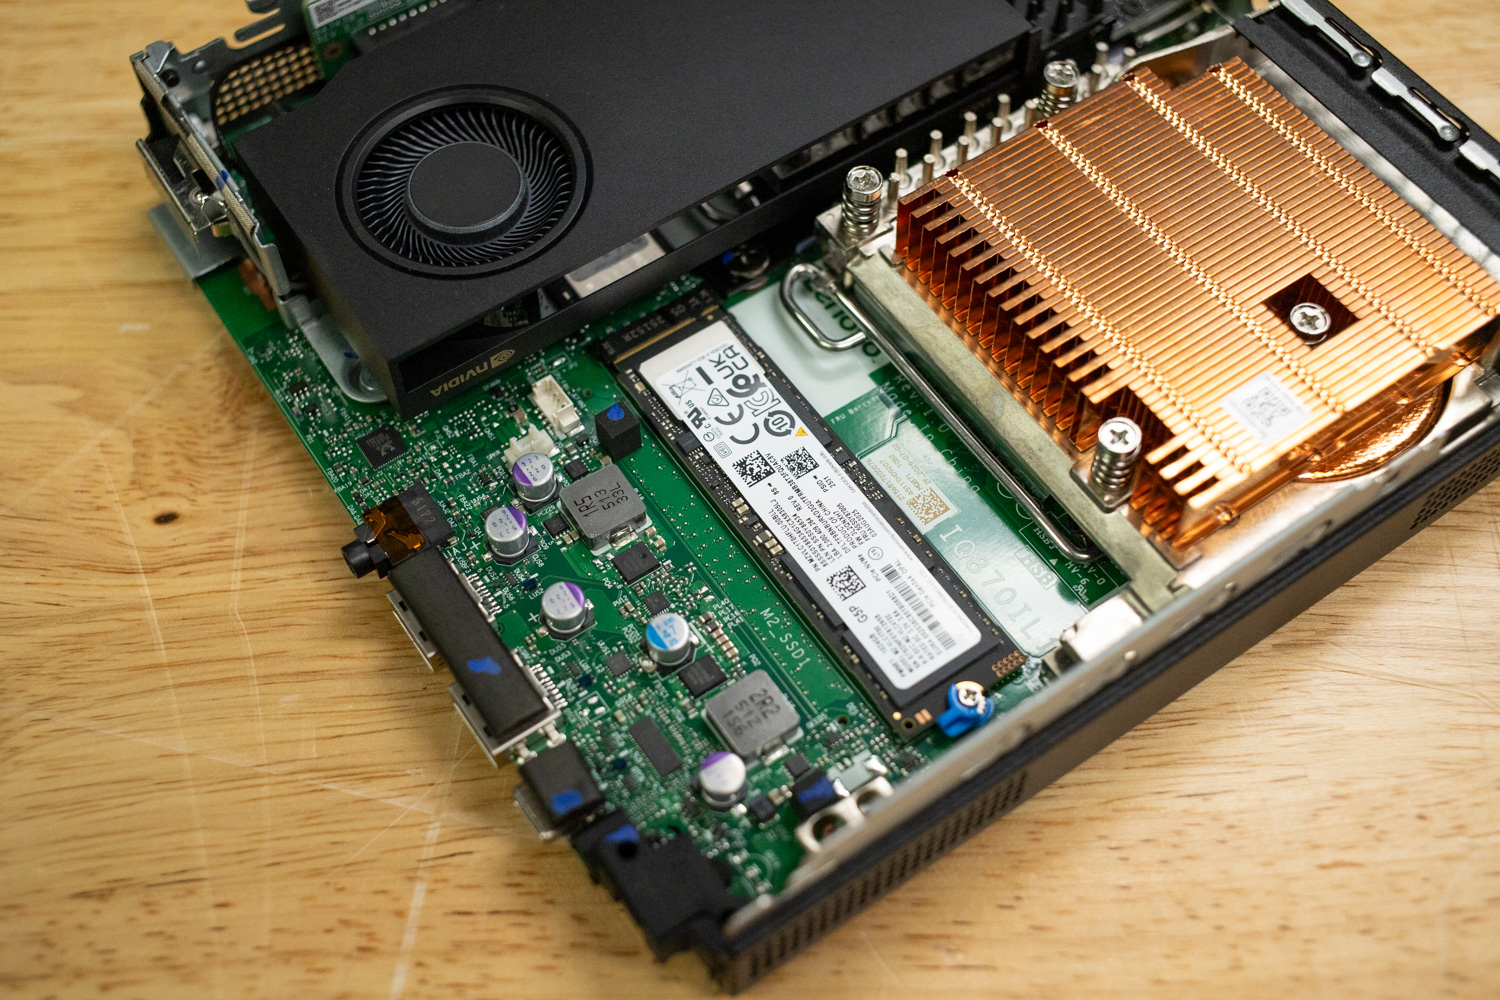
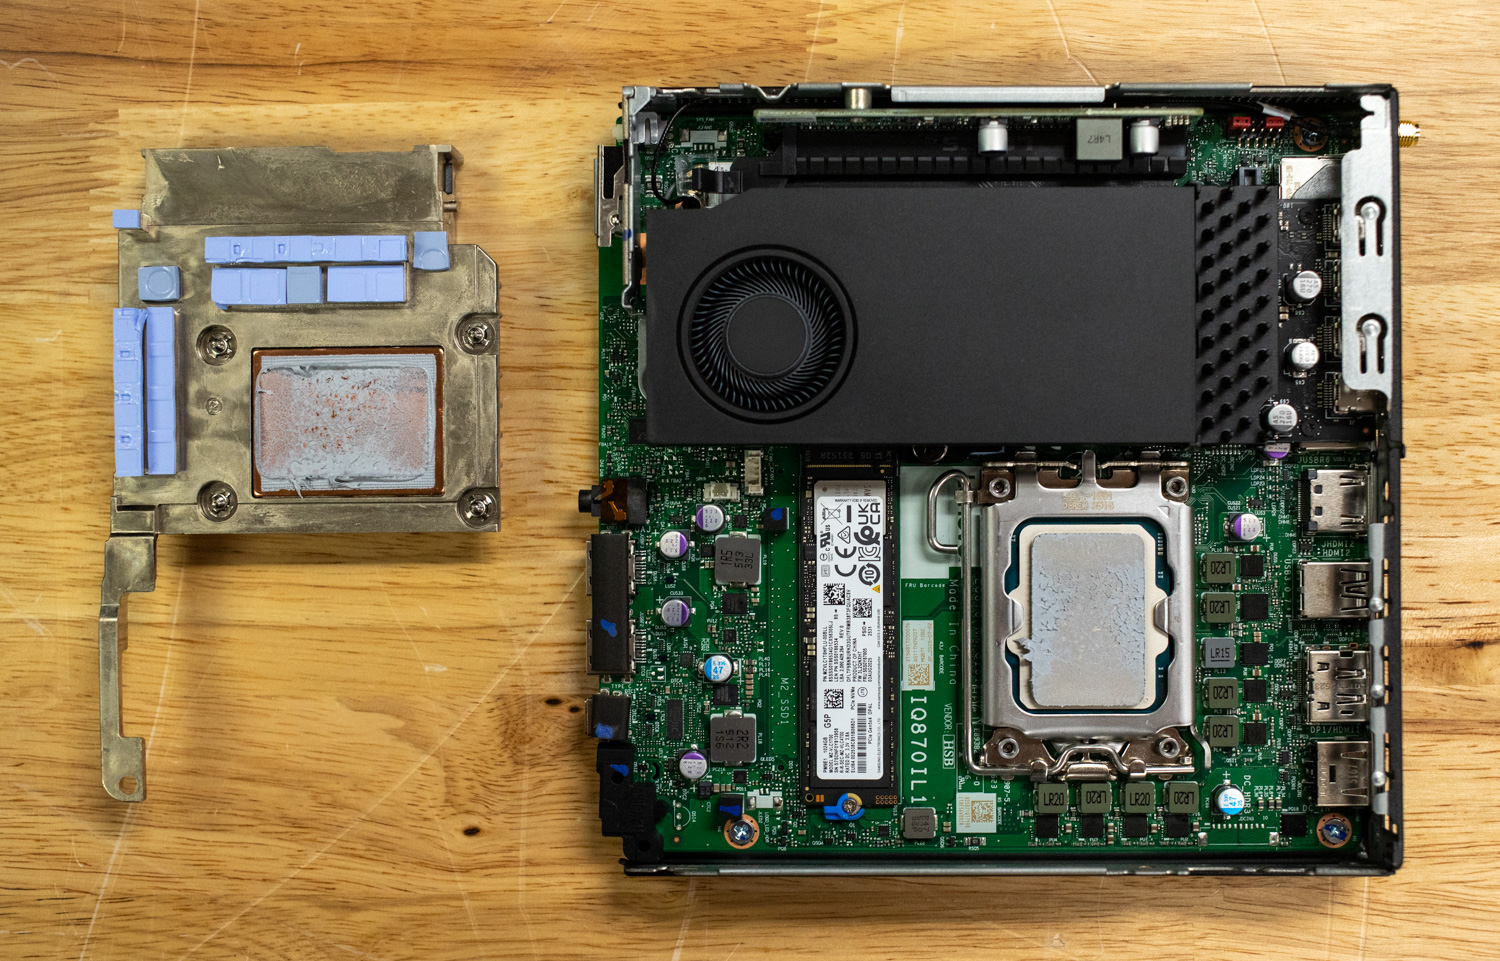
Removing the lid reveals how Lenovo maximizes every cubic centimeter inside. The internal layout has a custom-designed cooling assembly for the CPU. Unlike off-the-shelf coolers, these components are precision-engineered for the P3 Tiny’s tight airflow path.
- The CPU uses a compact, low-profile heatsink and blower fan that channels air straight through a dense fin stack, exhausting it out the rear.
- The GPU has its own dedicated cooling shroud, which prevents thermal interference between components.
Turning the system over, you will find the upgrade-friendly layout that Lenovo is known for. The bottom cover removes tool-free, revealing clearly labeled slots for memory and storage. There are two DDR5 SO-DIMM sockets, supporting dual-channel configurations and up to 128GB of DDR5 memory (2 x 64GB). DDR5 up to 6400 CSODIMM modules are supported.
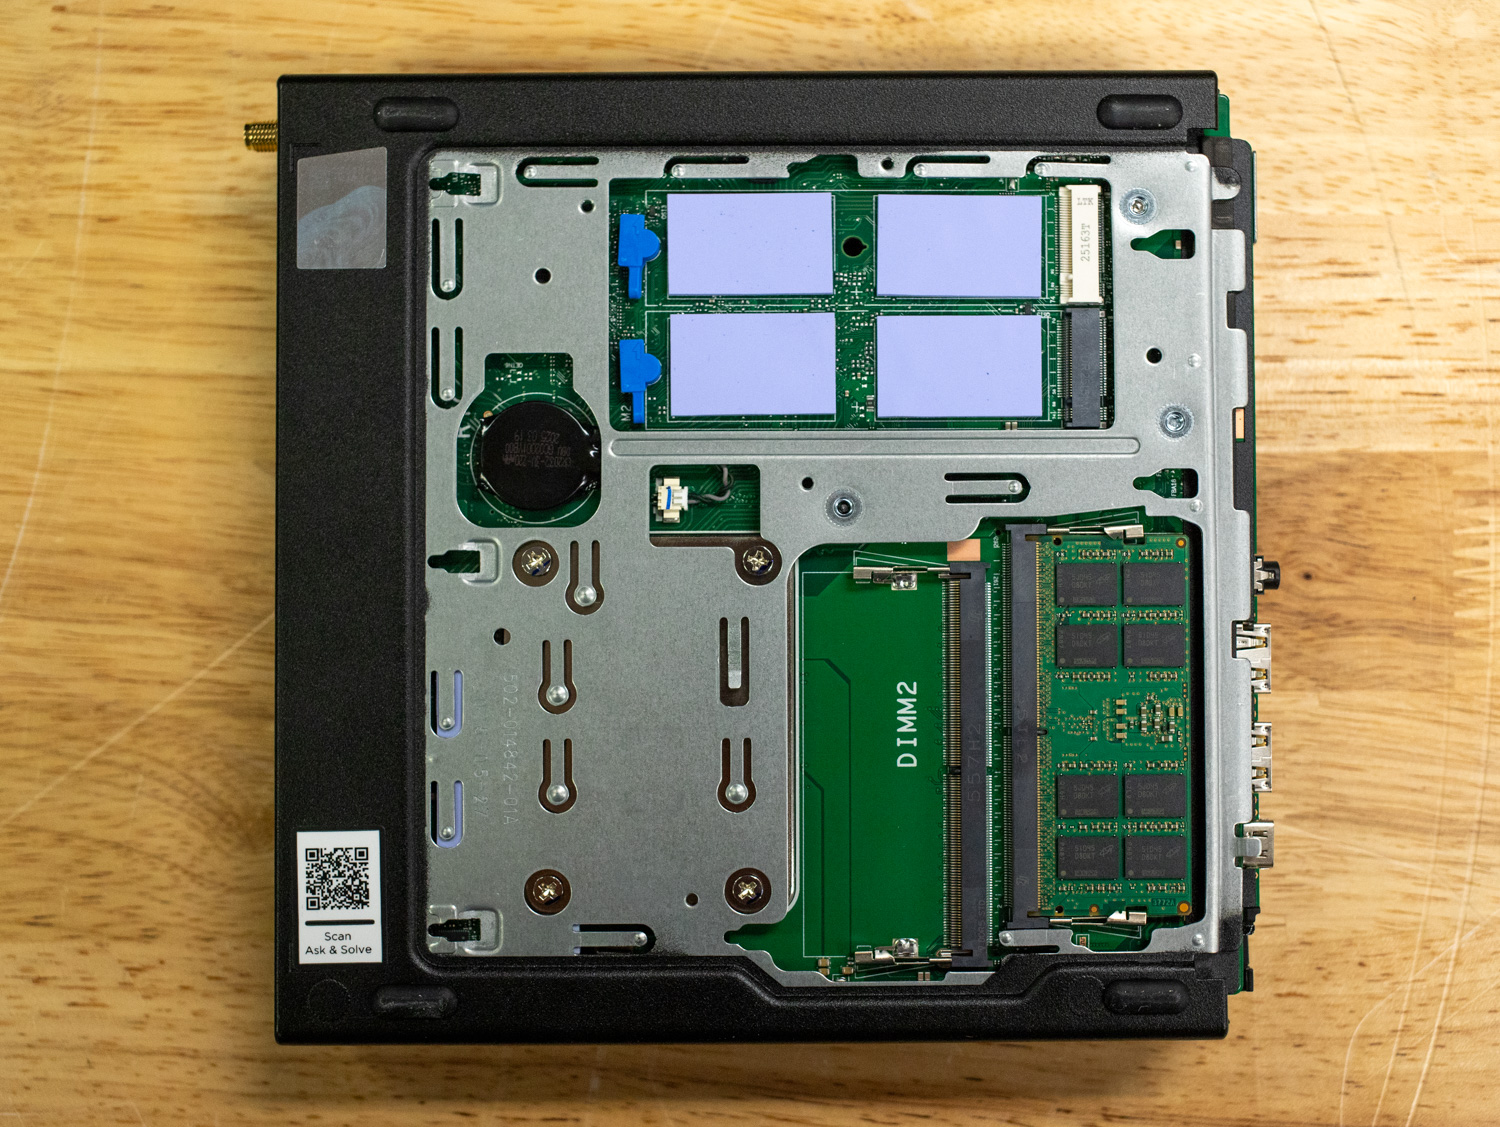
For storage, the P3 Tiny Gen 2 supports up to three M.2 NVMe SSDs using either PCIe 4.0 or PCIe 5.0 interfaces. Each PCIe 5.0 drive supports capacities up to 2TB, while Gen 4 drives go up to 1TB each. This allows up to 6TB when fully populated. These drives are cooled by small thermal pads and a shared metal shield, which helps maintain stable temperatures during large file transfers or database operations. RAID 0, 1, and 5 configurations are supported for added performance or redundancy.
Our review unit includes a single 32GB DDR5-6400 module and one 1TB PCIe 5.0 x4 NVMe SSD, leaving both the second memory slot and two additional M.2 bays open for expansion. This modular design makes future upgrades straightforward, with no hidden screws and quick access to standard components.
Surprisingly, this small-form-factor system doesn’t sacrifice CPU flexibility either. Unlike many compact workstations and mini PCs that solder the processor directly to the motherboard, the P3 Tiny Gen 2 features an actual CPU socket. This means the processor can be swapped or upgraded down the line, extending the machine’s lifespan and giving power users more control over performance. While that kind of upgrade might not be practical for large-scale deployments, smaller businesses or individual professionals looking to stretch the value of their investment will appreciate the option. Combined with its mostly tool-free access and modular internal layout, Lenovo’s engineering feels impressively forward-thinking for such a compact workstation.
ISV Certifications
The P3 Tiny Gen 2 ensures a flawless professional workflow with a massive suite of ISV certifications. This powerhouse is rigorously tested and validated by industry titans, including Adobe, ANSYS, Autodesk, Bentley, Dassault Systèmes, Nemetschek, PTC, and Siemens. This guarantees seamless and uninterrupted operation of your mission-critical applications. This is how Lenovo sets the ultimate standard for professional-grade compatibility and enterprise-level reliability.
| ISV Certifications |
|---|
| Adobe |
| Altair |
| ANSYS |
| Autodesk |
| Bentley |
| Dassault Systèmes |
| Nemetschek |
| PTC |
| Siemens |
Workstation Specifications
| Component | Specification |
|---|---|
| Processor |
|
| Operating System |
|
| Graphics |
|
| Memory |
|
| Storage |
|
| Audio |
|
| Connectivity / Ports |
|
| Wireless |
|
| Design |
|
| Sustainability |
|
| Certifications / Registries |
|
| Power Supply |
|
| Security & Manageability |
|
| Warranty |
|
| What’s in the Box |
|
Hardware Breakdown
In our testing, we utilized the ThinkStation P3 Tiny configuration that Lenovo sent. Our unit is equipped with an Intel Core Ultra 9 285 processor featuring 24 cores (8 performance and 16 efficiency cores) with a Max Turbo speed of up to 5.6GHz. Paired with 32GB of DDR5-6400 memory and a 1TB PCIe 5.0 x4 NVMe SSD, this configuration delivers a strong balance of raw processing power, multitasking capability, and fast storage performance. It’s designed to handle everything from demanding professional workloads to everyday computing with speed and stability.
Specifications:
- Processor: Intel Core Ultra 9 285, 24 (8 P-core + 16 E-core) 24 Threads, Max Turbo up to 5.1GHz
- Operating System: Windows 11 Pro 64-bit
- Graphics: NVIDIA RTX A1000 8GB
- Memory: 1x 32GB SO-DIMM DDR5-6400 Non-ECC
- Storage: 1x 1TB SSD M.2 2280 PCIe 5.0 x4 Performance NVMe Opal
- WLAN: Intel Wi-Fi 7 BE200 2×2 BE vPro & Bluetooth 5.4
- Power Supply: 330W, 90% efficiency
UL Procyon AI Inference Benchmark
The Procyon AI Inference Benchmark delivers reliable and efficient performance testing by streamlining AI Inference evaluation across diverse platforms. Developed in collaboration with leading AI hardware vendors, it minimizes complexity from variable models and system configurations to enable consistent, repeatable benchmarking. Optimized to measure CPU, GPU, or AI accelerators, it offers meaningful insights into how well different systems handle real-world AI tasks.
The P3 Tiny Gen 2 trails its larger siblings, scoring 184 in CPU inference, compared to 157 on the P3 Ultra and 196 on the Tower. GPU-side, it delivers 294, which is less than half of the Ultra (627) and a quarter of the Tower (1,168). TensorRT tests show the same scaling: 532 for the Tiny, 1,031 (Ultra), and 1,706 (Tower). Overall, the A1000 GPU inside the Tiny performs decently but clearly lacks the AI throughput of the RTX 4000 and 5000 Ada cards.
| CPU Results (Average Time in ms) | Lenovo ThinkStation P3 Tiny Gen 2 (Intel Core Ultra 9 285) (NVIDIA RTX A1000) | Lenovo ThinkStation P3 Ultra SFF Gen 2 (Intel Core Ultra 9 285) (NVIDIA RTX 4000 Ada) | Lenovo ThinkStation P3 Tower Gen 2 (Intel Core Ultra 9 285)(NVIDIA RTX 5000 Ada Generation) |
| AI Computer Vision Overall Score | 184 | 157 | 196 |
| MobileNet V3 | 0.98 ms | 0.99 ms | 0.94 ms |
| ResNet 50 | 7.47 ms | 8.52 ms | 6.83 ms |
| Inception V4 | 18.94 ms | 25.57 ms | 19.66 ms |
| DeepLab V3 | 24.97 ms | 31.42 ms | 24.89 ms |
| YOLO V3 | 44.46 ms | 58.88 ms | 43.43 ms |
| REAL-ESRGAN | 2,586.87 ms | 2,565.34 ms | 2,019.39 ms |
| GPU Results (Average Time in ms) | Lenovo ThinkStation P3 Tiny Gen 2 (Intel Core Ultra 9 285) (NVIDIA RTX A1000) | Lenovo ThinkStation P3 Ultra SFF Gen 2 (Intel Core Ultra 9 285) (NVIDIA RTX 4000 Ada) | Lenovo ThinkStation P3 Tower Gen 2 (Intel Core Ultra 9 285)(NVIDIA RTX 5000 Ada Generation) |
| AI Computer Vision Overall Score | 294 | 627 | 1,168 |
| MobileNet V3 | 1.11 ms | 0.56 ms | 0.46 ms |
| ResNet 50 | 4.99 ms | 2.26 ms | 1.07 ms |
| Inception V4 | 14.49 ms | 6.04 ms | 2.71 ms |
| DeepLab V3 | 23.79 ms | 14.73 ms | 12.27 ms |
| YOLO V3 | 23.02 ms | 9.17 ms | 4.63 ms |
| REAL-ESRGAN | 538.75 ms | 246.78 ms | 81.82 ms |
| TensorRT Results (Average Time in ms) | Lenovo ThinkStation P3 Tiny Gen 2 (Intel Core Ultra 9 285) (NVIDIA RTX A1000) | Lenovo ThinkStation P3 Ultra SFF Gen 2 (Intel Core Ultra 9 285) (NVIDIA RTX 4000 Ada) | Lenovo ThinkStation P3 Tower Gen 2 (Intel Core Ultra 9 285)(NVIDIA RTX 5000 Ada Generation) |
| AI Computer Vision Overall Score | 532 | 1,031 | 1,706 |
| MobileNet V3 | 0.55 ms | 0.31 ms | 0.24 ms |
| ResNet 50 | 2.45 ms | 1.42 ms | 0.94 ms |
| Inception V4 | 7.43 ms | 4.41 ms | 2.76 ms |
| DeepLab V3 | 9.44 ms | 4.52 ms | 3.92 ms |
| YOLO V3 | 12.01 ms | 5.22 ms | 3.09 ms |
| REAL-ESRGAN | 602.72 ms | 278.46 ms | 84.04 ms |
UL Procyon: AI Text Generation
The Procyon AI Text Generation Benchmark streamlines AI LLM performance testing by providing a concise and consistent evaluation method. It allows repeated testing across multiple LLM models while minimizing the complexity of large models and variable factors. Developed with AI hardware leaders, it optimizes the use of local AI accelerators to deliver more reliable, efficient performance assessments. The results measured below were tested using TensorRT.
For LLM tasks, the P3 Tiny is far slower, scoring 1,117 (Phi) compared to 2,303 and 4,344 on the higher-end models. It generates tokens at about 39 tokens/s, versus 81 on the Ultra and 161 on the Tower. Similar scaling happens across Mistral and Llama models, with roughly 2–4x slower token generation speeds on the Tiny. The RTX A1000 just doesn’t have the raw FP16 tensor power that the Ada cards offer.
| UL Procyon: AI Text Generation | Lenovo ThinkStation P3 Tiny Gen 2 (Intel Core Ultra 9 285) (NVIDIA RTX A1000) | Lenovo ThinkStation P3 Ultra SFF Gen 2 (Intel Core Ultra 9 285) (NVIDIA RTX 4000 Ada) | Lenovo ThinkStation P3 Tower Gen 2 (Intel Core Ultra 9 285)(NVIDIA RTX 5000 Ada Generation) |
| Phi Overall Score | 1,117 | 2,303 | 4,344 |
| Phi Output Time To First Token | 0.808 s | 0.395 s | 0.218 s |
| Phi Output Tokens Per Second | 39.379 tokens/s | 81.784 tokens/s | 160.757 tokens/s |
| Phi Overall Duration | 27.734 s | 35.869 s | 18.356 s |
| Mistral Overall Score | 3,045 | 1,977 | 4,136 |
| Mistral Output Time To First Token | 1.398 s | 0.666 s | 0.314 s |
| Mistral Output Tokens Per Second | 27.734 tokens/s | 57.102 tokens/s | 117.784 tokens/s |
| Mistral Overall Duration | 107.361 s | 51.942 s | 25.142 s |
| Llama3 Overall Score | 837 | 1,759 | 3,611 |
| Llama3 Output Time To First Token | 1.412 s | 0.628 s | 0.301 s |
| Llama3 Output Tokens Per Second | 24.323 tokens/s | 47.884 tokens/s | 96.565 tokens/s |
| Llama3 Overall Duration | 121.980 s | 61.189 s | 30.285 s |
| Llama2 Overall Score | – | 1,770 | 3,942 |
| Llama2 Output Time To First Token | – | 1.106 s | 0.502 s |
| Llama2 Output Tokens Per Second | – | 25.617 tokens/s | 57.623 tokens/s |
| Llama2 Overall Duration | – | 112.746 s | 50.269 s |
UL Procyon: AI Image Generation
The Procyon AI Image Generation Benchmark provides a consistent and accurate method for measuring AI inference performance across a range of hardware, from low-power NPUs to high-end GPUs. It includes three tests: Stable Diffusion XL (FP16) for high-end GPUs, Stable Diffusion 1.5 (FP16) for moderately powerful GPUs, and Stable Diffusion 1.5 (INT8) for low-power devices. The benchmark uses the optimal inference engine for each system, ensuring fair and comparable results.
The P3 Tiny scored 558 on the Stable Diffusion 1.5 (FP16) test, with 11.2 s per image, compared to 4.7 s on the Ultra and 1.7 s on the Tower. INT8 inference shows the same pattern with 4.6 s per image vs. 1.8 s and 0.68 s. The RTX A1000 performs at roughly 25% the speed of the RTX 4000 Ada and about 15% of the RTX 5000 Ada in image generation workloads.
| UL Procyon: AI Image Generation | Lenovo ThinkStation P3 Tiny Gen 2 (Intel Core Ultra 9 285) (NVIDIA RTX A1000) | Lenovo ThinkStation P3 Ultra SFF Gen 2 (Intel Core Ultra 9 285) (NVIDIA RTX 4000 Ada) | Lenovo ThinkStation P3 Tower Gen 2 (Intel Core Ultra 9 285)(NVIDIA RTX 5000 Ada Generation) |
| Stable Diffusion 1.5 (FP16) – Overall Score | 558 | 1,316 | 3,734 |
| Stable Diffusion 1.5 (FP16) – Overall Time | 179.144 s | 75.986 s | 26.779 s |
| Stable Diffusion 1.5 (FP16) – Image Generation Speed | 11.196 s/image | 4.749 s/image | 1.674 s/image |
| Stable Diffusion 1.5 (INT8) – Overall Score | 6,793 | 17,263 | 45,881 |
| Stable Diffusion 1.5 (INT8) – Overall Time | 36.798 s | 14.482 s | 5.449 s |
| Stable Diffusion 1.5 (INT8) – Image Generation Speed | 4.600 s/image | 1.810 s/image | 0.681 s/image |
| Stable Diffusion XL (FP16) – Overall Score | – | 1,061 | 3,293 |
| Stable Diffusion XL (FP16) – Overall Time | – | 565.015 s | 182.179 s |
| Stable Diffusion XL (FP16) – Image Generation Speed | – | 35.313 s/image | 11.386 s/image |
SPECworkstation 4
The SPECworkstation 4.0 benchmark is a comprehensive tool for evaluating all key aspects of workstation performance. It provides a real-world measure of CPU, graphics, accelerator, and disk performance, enabling professionals to make informed decisions about their hardware investments. The benchmark includes a dedicated set of tests focused on AI/ML workloads, including data science tasks and ONNX runtime-based inference tests, reflecting the growing importance of AI/ML in workstation environments. It encompasses seven industry verticals and four hardware subsystems, providing a detailed and relevant measure of the performance of today’s workstations.
The P3 Tiny delivers balanced but modest performance, averaging around 1.3–1.9 across verticals, while the Ultra hits 1.3–2.5 and the Tower goes slightly higher at 1.5–2.8. This reflects Tiny’s limited GPU acceleration and smaller cooling headroom, making it more of a compact performer than a heavy-duty workstation.
| SPECworkstation 4.0.0 (Higher is better) | Lenovo ThinkStation P3 Tiny Gen 2 (Intel Core Ultra 9 285) (NVIDIA RTX A1000) | Lenovo ThinkStation P3 Ultra SFF Gen 2 (Intel Core Ultra 9 285) (NVIDIA RTX 4000 Ada) | Lenovo ThinkStation P3 Tower Gen 2 (Intel Core Ultra 9 285) (NVIDIA RTX 5000 Ada Generation) |
| Energy | 1.33 | 2.11 | 2.49 |
| Financial Services | 1.62 | 1.52 | 2.44 |
| Life Sciences | 1.80 | 2.51 | 2.84 |
| Media & Entertainment | 1.89 | 2.28 | 2.69 |
| Product Design | 1.77 | 2.28 | 2.46 |
| Productivity & Development | 1.29 | 1.29 | 1.50 |
Luxmark
Luxmark is a GPU benchmark that uses LuxRender, an open-source ray-tracing renderer, to evaluate a system’s performance with highly detailed 3D scenes. This benchmark is relevant for assessing the graphical rendering capabilities of servers and workstations, especially for visual effects and architectural visualization applications, where accurate light simulation is crucial.
The Tiny’s A1000 GPU scores 7,423 (Hallbench) and 2,860 (Food), compared to 15,054 / 5,612 on the RTX 4000 and 26,792 / 12,562 on the RTX 5000. That’s a roughly 2–4x performance gap, typical of moving from an entry-level pro GPU to mid- and high-end workstation cards.
| Luxmark (Higher is better) | Lenovo ThinkStation P3 Tiny Gen 2 (Intel Core Ultra 9 285) (NVIDIA RTX A1000) | Lenovo ThinkStation P3 Ultra SFF Gen 2 (Intel Core Ultra 9 285) (NVIDIA RTX 4000 Ada) | Lenovo ThinkStation P3 Tower Gen 2 (Intel Core Ultra 9 285)(NVIDIA RTX 5000 Ada Generation) |
| Hallbench | 7,423 | 15,054 | 26,792 |
| Food | 2,860 | 5,612 | 12,562 |
7-Zip Compression
The 7-Zip Compression Benchmark evaluates CPU performance during compression and decompression, measuring GIPS (Giga Instructions Per Second) and CPU usage. Higher GIPS and efficient CPU usage indicate superior performance.
CPU-based compression is consistent across all systems, since they all use the same Core Ultra 9 285. The Tiny’s total rating is ~110–144 GIPS, slightly behind the Ultra’s ~162 GIPS but close enough that real-world differences are most likely minor. Multi-core scaling seems more thermally constrained on the Tiny, which explains the gap.
| 7-Zip Compression Benchmark (Higher is Better) | Lenovo ThinkStation P3 Tiny Gen 2 (Intel Core Ultra 9 285) (NVIDIA RTX A1000) | Lenovo ThinkStation P3 Ultra SFF Gen 2 (Intel Core Ultra 9 285) (NVIDIA RTX 4000 Ada) | Lenovo ThinkStation P3 Tower Gen 2 (Intel Core Ultra 9 285)(NVIDIA RTX 5000 Ada Generation) |
| Compression | |||
| Current CPU Usage | 2,030% | 2,129% | 1,899% |
| Current Rating / Usage | 5.369 GIPS | 7.590 GIPS | 6.970 GIPS |
| Current Rating | 109.008 GIPS | 161.558 GIPS | 132.461 GIPS |
| Resulting CPU Usage | 2,007% | 2,116% | 1,894% |
| Resulting Rating / Usage | 5.492 GIPS | 7.689 GIPS | 7.115 GIPS |
| Resulting Rating | 110.189 GIPS | 162.405 GIPS | 134.748 GIPS |
| Decompression | |||
| Current CPU Usage | 2,243% | 2,263% | 2,191% |
| Current Rating / Usage | 6.049 GIPS | 7.184 GIPS | 6.937 GIPS |
| Current Rating | 135.698 GIPS | 162.532 GIPS | 152.009 GIPS |
| Resulting CPU Usage | 2,232% | 2,243% | 1,979% |
| Resulting Rating / Usage | 6.479 GIPS | 7.239 GIPS | 7.209 GIPS |
| Resulting Rating | 144.454 GIPS | 162.405 GIPS | 142.655 GIPS |
| Total Rating | |||
| Total CPU Usage | 2,120% | 2,179% | 1,937% |
| Total Rating / Usage | 5.985 GIPS | 7.464 GIPS | |
Blackmagic RAW Speed Test
The Blackmagic RAW Speed Test is a performance benchmarking tool that measures a system’s capabilities for handling video playback and editing using the Blackmagic RAW codec. It evaluates how well a system decodes and plays back high-resolution video files, reporting frame rates for both CPU- and GPU-based processing.
For 8K playback, the Tiny manages 86 fps (CPU) and 61 fps (GPU), while the Ultra delivers 114/129 fps, and the Tower delivers 125/179 fps. GPU decoding scales almost 3x between the A1000 and the RTX 5000 Ada, showing clear benefits for high-resolution video workflows on the larger systems.
| Blackmagic RAW Speed Test | Lenovo ThinkStation P3 Tiny Gen 2 (Intel Core Ultra 9 285) (NVIDIA RTX A1000) | Lenovo ThinkStation P3 Ultra SFF Gen 2 (Intel Core Ultra 9 285) (NVIDIA RTX 4000 Ada) | Lenovo ThinkStation P3 Tower Gen 2 (Intel Core Ultra 9 285)(NVIDIA RTX 5000 Ada Generation) |
| 8K CPU | 86 | 114 | 125 |
| 8K OpenCL | 61 | 129 | 179 |
Blackmagic Disk Speed Test
The Blackmagic Disk Speed Test evaluates storage performance by measuring read and write speeds, providing insights into a system’s ability to handle data-intensive tasks, such as video editing and large file transfers.
Storage performance is solid across the board. The P3 Tiny’s 6,742 MB/s read and 5,782 MB/s write speeds are only about 10% slower than the Tower’s 7,304/7,006 MB/s, showing that Lenovo used similarly high-speed NVMe drives across the lineup.
| Disk Speed Test (Higher is Better) | Lenovo ThinkStation P3 Tiny Gen 2 (Intel Core Ultra 9 285) (NVIDIA RTX A1000) | Lenovo ThinkStation P3 Ultra SFF Gen 2 (Intel Core Ultra 9 285) (NVIDIA RTX 4000 Ada) | Lenovo ThinkStation P3 Tower Gen 2 (Intel Core Ultra 9 285)(NVIDIA RTX 5000 Ada Generation) |
| Read | 6,742.0 MB/s | 7,229.8 MB/s | 7,304.2 MB/s |
| Write | 5,781.6 MB/s | 6,094.6 MB/s | 7,006.2 MB/s |
Blender 4.3
Blender is an open-source 3D modeling application. This benchmark was run using the Blender Benchmark utility. The score is measured in samples per minute, with higher values indicating better performance.
On CPU rendering, the Tiny performs respectably (e.g., 179 samples/min on Monster vs. 202 on the Ultra). GPU rendering, though, widens the gap massively, with 581 samples/min on the Tiny, 1,763 on the Ultra, and 3,885 on the Tower. That’s about 3x to 7x faster rendering on the higher-end GPUs.
| Blender CPU (Samples per Minute, Higher is Better) | Lenovo ThinkStation P3 Tiny Gen 2 (Intel Core Ultra 9 285) (NVIDIA RTX A1000) | Lenovo ThinkStation P3 Ultra SFF Gen 2 (Intel Core Ultra 9 285) (NVIDIA RTX 4000 Ada) | Lenovo ThinkStation P3 Tower Gen 2 (Intel Core Ultra 9 285) (NVIDIA RTX 5000 Ada Generation) |
| Monster | 179.31 | 202.9 | 163.7 |
| Junkshop | 110.79 | 133.4 | 106.8 |
| Classroom | 77.45 | 100.0 | 80.9 |
| Blender GPU (Samples per Minute, Higher is Better) | Lenovo ThinkStation P3 Tiny Gen 2 (Intel Core Ultra 9 285)(NVIDIA RTX A1000) | Lenovo ThinkStation P3 Ultra SFF Gen 2 (Intel Core Ultra 9 285) ( NVIDIA RTX 4000 Ada) | Lenovo ThinkStation P3 Tower Gen 2 (Intel Core Ultra 9 285) (NVIDIA RTX 5000 Ada Generation) |
| Monster | 581.75 | 1,763.2 | 3,884.68 |
| Junkshop | 363.47 | 888.7 | 1,743.56 |
| Classroom | 323.37 | 906.0 | 1,876.89 |
y-cruncher
y-cruncher is a multithreaded and scalable program that can compute Pi and other mathematical constants to trillions of digits. Since its launch in 2009, it has become a popular benchmarking and stress-testing application for overclockers and hardware enthusiasts.
For number-crunching, the Tiny computes 1B digits in 24.1s, slower than the Ultra’s 19.5s but similar to the Tower’s 22.1s. The Ultra stays consistently faster through the 5B test range, showing better thermal headroom and sustained CPU boost clocks.
| y-cruncher (Total Computation Time) | Lenovo ThinkStation P3 Tiny Gen 2 (Intel Core Ultra 9 285) (NVIDIA RTX A1000) | Lenovo ThinkStation P3 Ultra SFF Gen 2 (Intel Core Ultra 9 285) (NVIDIA RTX 4000 Ada) | Lenovo ThinkStation P3 Tower Gen 2 (Intel Core Ultra 9 285) (NVIDIA RTX 5000 Ada Generation) |
| 1 Billion | 24.063 s | 19.524 s | 22.112 s |
| 2.5 Billion | 67.223 s | 55.207 s | 68.345 s |
| 5 Billion | 154.892 s | 122.528 s | 146.977 s |
| 10 Billion | – | 273.903 s | 340.904 s |
| 25 Billion | – | – | – |
| 50 Billion | – | – | – |
Geekbench 6
Geekbench 6 is a cross-platform benchmark that measures overall system performance, covering both CPU and GPU workloads.
CPU results are nearly identical: 3,194 single-core and 17,572 multi-core for the Tiny, compared to 3,155/20,334 and 3,175/21,033 on the others. GPU OpenCL scores, though, show significant gaps: 55,345 (Tiny) vs. 122,981 (Ultra) and 244,185 (Tower), confirming the A1000’s entry-level standing.
| Geekbench 6 (Higher is Better) | Lenovo ThinkStation P3 Tiny Gen 2 (Intel Core Ultra 9 285) (NVIDIA RTX A1000) | Lenovo ThinkStation P3 Ultra SFF Gen 2 (Intel Core Ultra 9 285) (NVIDIA RTX 4000 Ada) | Lenovo ThinkStation P3 Tower Gen 2 (Intel Core Ultra 9 285)(NVIDIA RTX 5000 Ada Generation) |
| CPU Single-Core | 3,194 | 3,155 | 3,175 |
| CPU Multi-Core | 17,572 | 20,334 | 21,033 |
| GPU OpenCL | 55,345 | 122,981 | 244,185 |
Cinebench 2024
Cinebench 2024 extends R23’s benchmark capabilities by adding GPU performance evaluation. It continues to test CPU performance while incorporating GPU-based rendering workloads to measure GPU performance.
CPU performance remains steady across systems, with 1,551 (multi-core) and 138 (single-core) on the Tiny. The GPU test tells a different story with 4,399 versus 12,222 (Ultra) and 23,746 (Tower). The A1000 achieves around 18% of the RTX 5000 Ada’s render score, again consistently underlining the GPU tier difference.
| Cinebench 2024 (Higher is Better) | Lenovo ThinkStation P3 Tiny Gen 2 (Intel Core Ultra 9 285) (NVIDIA RTX A1000) | Lenovo ThinkStation P3 Ultra SFF Gen 2 (Intel Core Ultra 9 285) (NVIDIA RTX 4000 Ada) | Lenovo ThinkStation P3 Tower Gen 2 (Intel Core Ultra 9 285)(NVIDIA RTX 5000 Ada Generation) |
| Multi-Core | 1,551 | 1,727 | 1,851 |
| Single-Core | 138 | 139 | 142 |
| GPU | 4,399 | 12,222 | 23,746 |
Conclusion
The Lenovo ThinkStation P3 Tiny Gen 2 ends up being one of those systems that is just fun to work with. In a 1-liter chassis, you still get a socketed Intel Core Ultra CPU, serviceable DDR5 memory, and room for up to three NVMe drives. That combination gives this box a much longer useful life than most compact desktops, whether you are dropping in more RAM, expanding storage to 6TB, or even swapping processors within the supported stack.
Day to day, the P3 Tiny Gen 2 feels like a “real” workstation rather than a shrunken compromise. The RTX A1000 is clearly an entry-level GPU, but it is perfectly adequate for CAD, visualization, and lighter content creation, especially when paired with fast PCIe Gen5 storage. ISV certifications and enterprise features like TPM, vPro options, and strong Linux support also make it easy to drop into professional environments. Our unit shipped with a vertical stand, which keeps the footprint small and airflow clean, and Lenovo also offers VESA and TIO style mounting options for setups that need the system off the desk entirely.
The tradeoffs are straightforward. If you live in heavy 3D, large-scale AI, or dense GPU rendering, the P3 Ultra or P3 Tower with higher-tier graphics will make more sense. For everyone else who wants a compact workstation with real upgrade paths and predictable behavior under load, the ThinkStation P3 Tiny Gen 2 hits a very attractive balance of size, performance, and serviceability.


 Amazon