

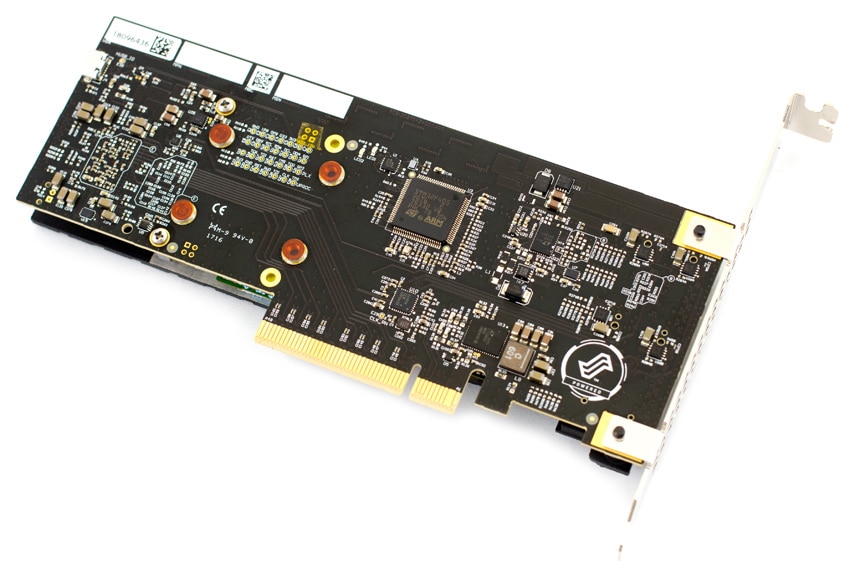
The Liqid Element AIC is an extreme performance, high capacity PCIe SSD, incorporating four m.2 NVMe SSDs and a PCIe switch in a HHHL package. It is designed to handle performance-demanding workloads and offer full compatibility with existing systems that support NVMe devices. Available in the half-height half-length standard form factor, the Element sports a Gen 3.0 x8 PCIe interface that utilizes the latest NVMe protocol. The Element has both Data Center and Enterprise models available, with capacities up to 15.40TB and 12.80TB, and offers incredible performance up to 1.25M IOPS or 7GB/s in bandwidth.
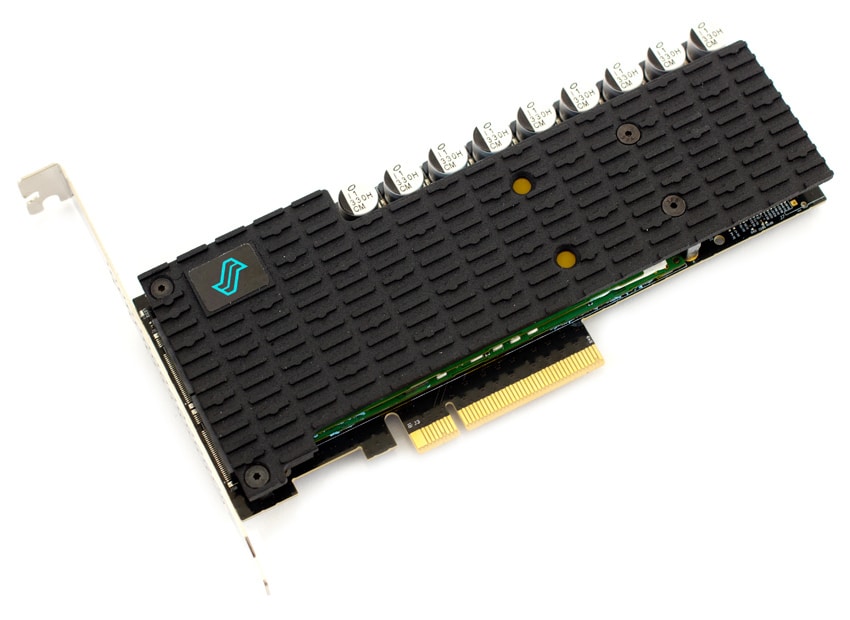
Mentioned above, the Liqid Element AIC is designed for Data Center and Enterprise environments. Because of these mission-critical environments the Element is meant to be leveraged in, one would expect significant performance results. Liqid claims the Element AIC can reach up to 7,000MB/s sequential read and 6,300MB/s sequential write speeds. For random 4KB read/write, they claim 1,250,000 and 900,000 IOPS, respectively. Finally, they state 80μs read and 20μs write on the latency front.
In this review, we’ll see if the Liqid Element AIC can hold up to its claims, and how it stacks up against the competition. We will be testing the Liqid PCIe switch with four Samsung SM963 1.92TB SSDs on it for a total of 7.68TB. As supplied, each drive is over-provisioned down to 1.6TB for increased performance.
Liqid Element AIC Specifications
| Form Factor | Standard Form Factor HHHL Card |
| Raw Capacity | Up to 16 TB |
| NAND Type | TLC 3D NAND |
| Interface | PCI Express 3.0 x8 |
| Protocol | NVMe 1.2.1 |
| Performance | |
| Sequential Read | 7.0 GB/s |
| Sequential Write | 6.3 GB/s |
| Random Read (4K) | 1,250,000 IOPS |
| Random Write (4K) | 900,000 IOPS |
| Random Write (4K) (SS) | 275,000 IOPS |
| Latency (Read/Write) | 80/20μs |
| Endurance | |
| Terabytes Written (TBW) | 884 – 30,765 |
| Power | |
| Active | ~25W Typical |
| Input | 12 V Only (optional aux power cabel) |
| Air Flow | Min 400 LFM |
| Humidity | 5% to 95% (non-condensing) |
| Weight | 6-10 oz |
| Temperature | |
| Op | 0 to 55 deg C |
| Non-Op | -40 to 75 deg C |
| Warranty | 3 years or maximum endurance used |
Performance
Testbed
Our Enterprise SSD reviews leverage a Lenovo ThinkSystem SR850 for application tests and a Dell PowerEdge R740xd for synthetic benchmarks. The ThinkSystem SR850 is a well-equipped quad-CPU platform, offering CPU power well in excess of what's needed to stress high-performance local storage. Synthetic tests that don't require a lot of CPU resources use the more traditional dual-processor server. In both cases, the intent is to showcase local storage in the best light possible that aligns with storage vendor maximum drive specs.
Lenovo ThinkSystem SR850
- 4 x Intel Platinum 8160 CPU (2.1GHz x 24 Cores)
- 16 x 32GB DDR4-2666Mhz ECC DRAM
- 2 x RAID 930-8i 12Gb/s RAID Cards
- 8 NVMe Bays
- VMware ESXI 6.5
Dell PowerEdge R740xd
- 2 x Intel Gold 6130 CPU (2.1GHz x 16 Cores)
- 16 x 16GB DDR4-2666MHz ECC DRAM
- 1x PERC 730 2GB 12Gb/s RAID Card
- Add-in NVMe Adapter
- Ubuntu-16.04.3-desktop-amd64
Testing Background and Comparables
The StorageReview Enterprise Test Lab provides a flexible architecture for conducting benchmarks of enterprise storage devices in an environment comparable to what administrators encounter in real deployments. The Enterprise Test Lab incorporates a variety of servers, networking, power conditioning, and other network infrastructure that allows our staff to establish real-world conditions to accurately gauge performance during our reviews.
We incorporate these details about the lab environment and protocols into reviews so that IT professionals and those responsible for storage acquisition can understand the conditions under which we have achieved the following results. None of our reviews are paid for or overseen by the manufacturer of equipment we are testing. Additional details about the StorageReview Enterprise Test Lab and an overview of its networking capabilities are available on those respective pages.
Comparables for this review:
- Huawei ES3000 v5 3.2TB
- Samsung PM1725a 1.6TB
- Memblaze PBlaze5 910 AIC 7.68TB
- Memblaze PBlaze5 900 3.2TB
- Toshiba PX04 1.6TB
- Memblaze PBlaze5 910 3.84TB
- Intel P4510 2TB
Application Workload Analysis
In order to understand the performance characteristics of enterprise storage devices, it is essential to model the infrastructure and the application workloads found in live-production environments. Our benchmarks for the Liqid Element AIC are therefore the MySQL OLTP performance via SysBench and Microsoft SQL Server OLTP performance with a simulated TCP-C workload. For our application workloads, each drive will be running 2-4 identically configured VMs.
SQL Server Performance
Each SQL Server VM is configured with two vDisks: 100GB volume for boot and a 500GB volume for the database and log files. From a system-resource perspective, we configured each VM with 16 vCPUs, 64GB of DRAM and leveraged the LSI Logic SAS SCSI controller. While our Sysbench workloads tested previously saturated the platform in both storage I/O and capacity, the SQL test is looking for latency performance.
This test uses SQL Server 2014 running on Windows Server 2012 R2 guest VMs, and is stressed by Quest's Benchmark Factory for Databases. StorageReview’s Microsoft SQL Server OLTP testing protocol employs the current draft of the Transaction Processing Performance Council’s Benchmark C (TPC-C), an online transaction-processing benchmark that simulates the activities found in complex application environments. The TPC-C benchmark comes closer than synthetic performance benchmarks to gauging the performance strengths and bottlenecks of storage infrastructure in database environments. Each instance of our SQL Server VM for this review uses a 333GB (1,500 scale) SQL Server database and measures the transactional performance and latency under a load of 15,000 virtual users.
SQL Server Testing Configuration (per VM)
- Windows Server 2012 R2
- Storage Footprint: 600GB allocated, 500GB used
- SQL Server 2014
- Database Size: 1,500 scale
- Virtual Client Load: 15,000
- RAM Buffer: 48GB
- Test Length: 3 hours
- 2.5 hours preconditioning
- 30 minutes sample period
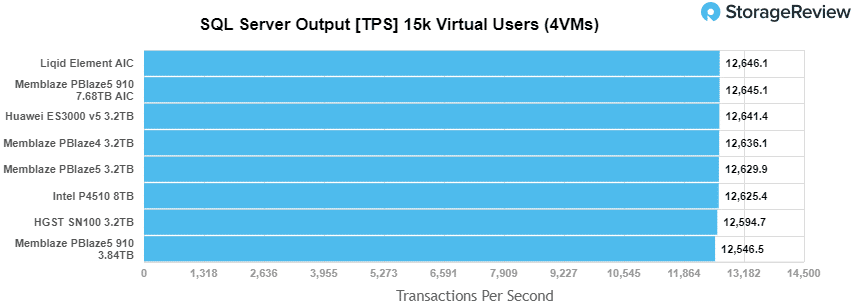
For our SQL Server transactional benchmark, the Liqid Element AIC found itself at the top of the charts at 12,646.1 TPS, outperforming the Memblaze PBlaze5 910 7.68TB AIC, which saw 12,645.1 TPS.
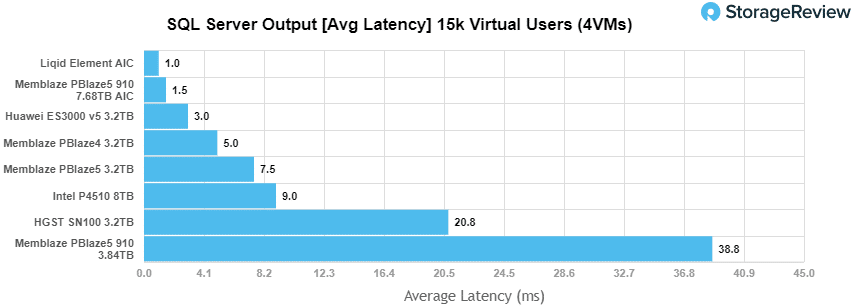
The Liqid Element AIC topped our SQL Server test, ranking first with in Avg Latency at 1.0ms.
Sysbench Performance
The next application benchmark consists of a Percona MySQL OLTP database measured via SysBench. This test measures average TPS (Transactions Per Second), average latency, and average 99th percentile latency as well.
Each Sysbench VM is configured with three vDisks: one for boot (~92GB), one with the pre-built database (~447GB), and the third for the database under test (270GB). From a system-resource perspective, we configured each VM with 16 vCPUs, 60GB of DRAM and leveraged the LSI Logic SAS SCSI controller.
Sysbench Testing Configuration (per VM)
- CentOS 6.3 64-bit
- Percona XtraDB 5.5.30-rel30.1
- Database Tables: 100
- Database Size: 10,000,000
- Database Threads: 32
- RAM Buffer: 24GB
- Test Length: 3 hours
- 2 hours preconditioning 32 threads
- 1 hour 32 threads
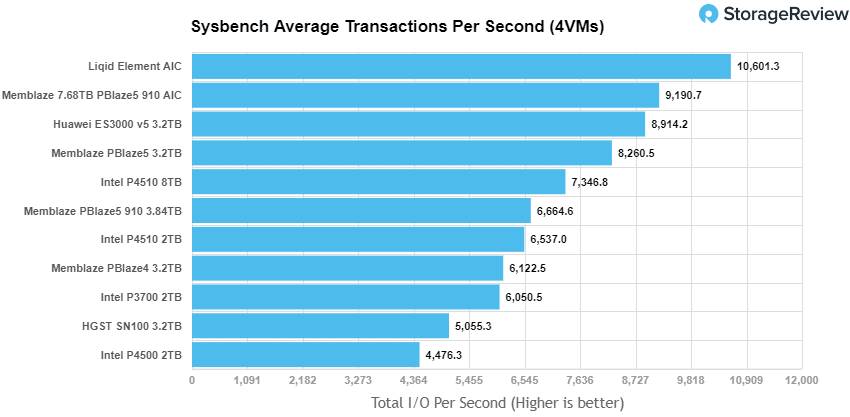
With the Sysbench transactional benchmark, we see the Liqid Element once again takes the top spot with 10,601.3 TPS.
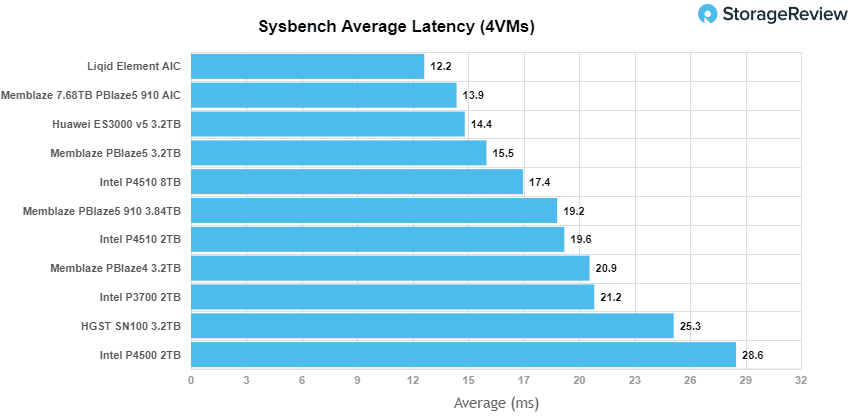
With Sysbench average latency, the Liqid Element takes the lead with an impressive 12.2ms latency.
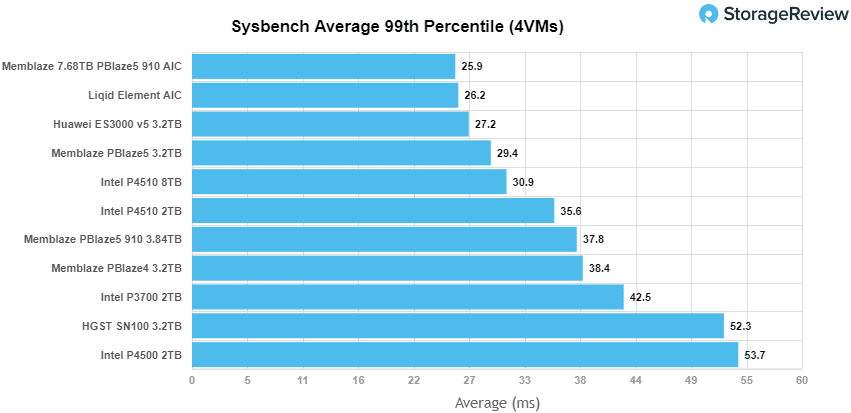
Finally, in our worst-case scenario latency benchmark, the Element AIC was edged out slightly from its top position by the Memblaze 7.68TB PBlaze 910 AIC, which ranked at 25.9ms. At only 0.3ms behind, the Liqid Element AIC hit 26.2ms.
Houdini by SideFX
The Houdini test is specifically designed to evaluate storage performance as it relates to CGI rendering. The test bed for this application is a variant of the core Dell PowerEdge R740xd server type we use in the lab with dual Intel 6130 CPUs and 64GB DRAM. In this case, we installed Ubuntu Desktop (ubuntu-16.04.3-desktop-amd64) running bare metal. Output of the benchmark is measured in seconds to complete, with fewer being better.
The Maelstrom demo represents a section of the rendering pipeline that highlights the performance capabilities of storage by demonstrating its ability to effectively use the swap file as a form of extended memory. The test does not write out the result data or process the points in order to isolate the wall-time effect of the latency impact to the underlying storage component. The test itself is composed of five phases, three of which we run as part of the benchmark, which are as follows:
- Loads packed points from disk. This is the time to read from disk. This is single threaded, which may limit overall throughput.
- Unpacks the points into a single flat array in order to allow them to be processed. If the points do not have dependency on other points, the working set could be adjusted to stay in-core. This step is multi-threaded.
- (Not Run) Processes the points.
- Repacks them into bucketed blocks suitable for storing back to disk. This step is multi-threaded.
- (Not Run) Writes the bucketed blocks back out to disk.
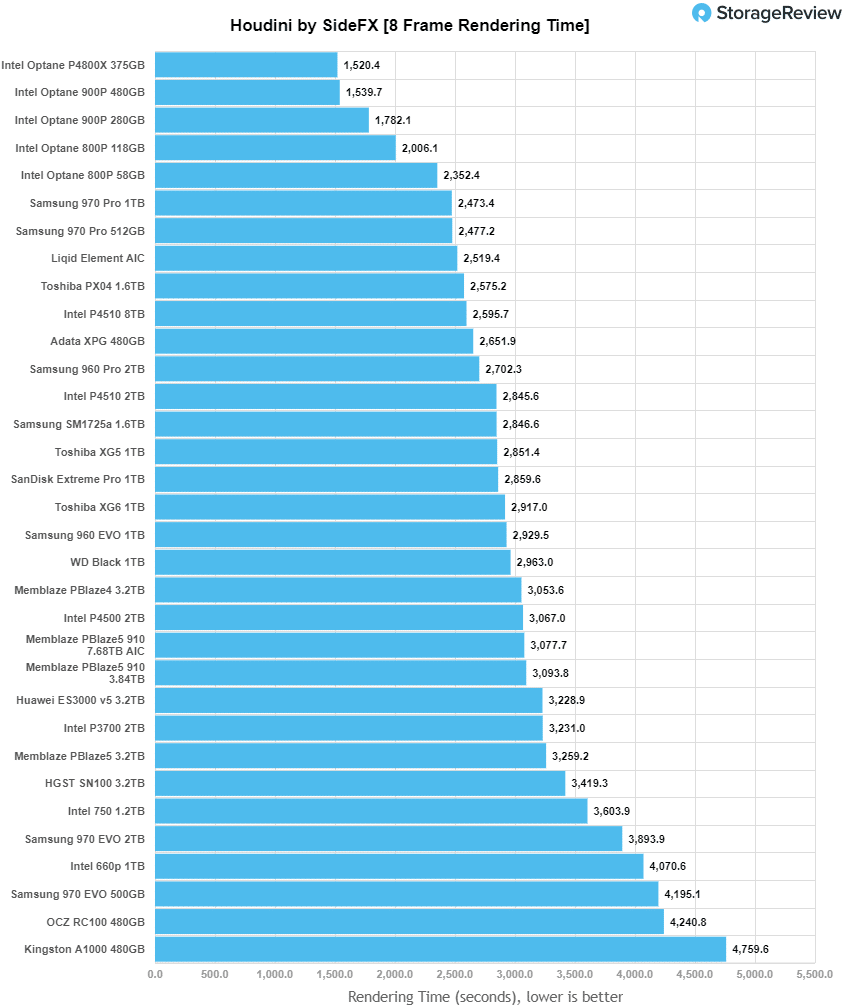
The Element AIC did very well on the Houdini test, placing third among the non-Optane drives and eighth overall with 2,519.4 seconds.
VDBench Workload Analysis
When it comes to benchmarking storage devices, application testing is best, and synthetic testing comes in second place. While not a perfect representation of actual workloads, synthetic tests do help to baseline storage devices with a repeatability factor that makes it easy to do apples-to-apples comparison between competing solutions. These workloads offer a range of different testing profiles ranging from "four corners" tests, common database transfer size tests, to trace captures from different VDI environments. All of these tests leverage the common vdBench workload generator, with a scripting engine to automate and capture results over a large compute testing cluster. This allows us to repeat the same workloads across a wide range of storage devices, including flash arrays and individual storage devices. Our testing process for these benchmarks fills the entire drive surface with data, then partitions a drive section equal to 25% of the drive capacity to simulate how the drive might respond to application workloads. This is different than full entropy tests which use 100% of the drive and takes them into steady state. As a result, these figures will reflect higher-sustained write speeds.
Profiles:
- 4K Random Read: 100% Read, 128 threads, 0-120% iorate
- 4K Random Write: 100% Write, 64 threads, 0-120% iorate
- 64K Sequential Read: 100% Read, 16 threads, 0-120% iorate
- 64K Sequential Write: 100% Write, 8 threads, 0-120% iorate
- Synthetic Database: SQL and Oracle
- VDI Full Clone and Linked Clone Traces
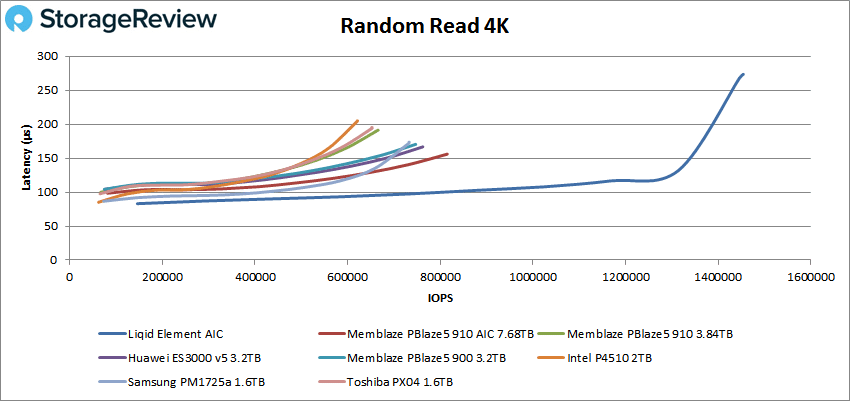
In our first VDBench Workload Analysis, we looked at random 4K read performance. The Liqid Element outperformed the competition with peak performance of 1,454,406 IOPS with a latency of 273.4μs.
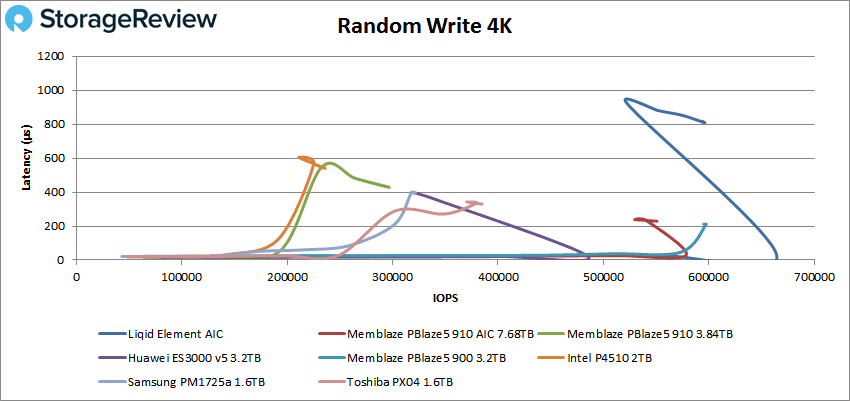
Next we looked at 4K random write performance, where the Element reached 664,399 IOPS at a latency of 30.7μs, which is extremely impressive. When over-saturated, it backtracked a bit and finished off with 593,364 IOPS at a latency of 818.2μs.
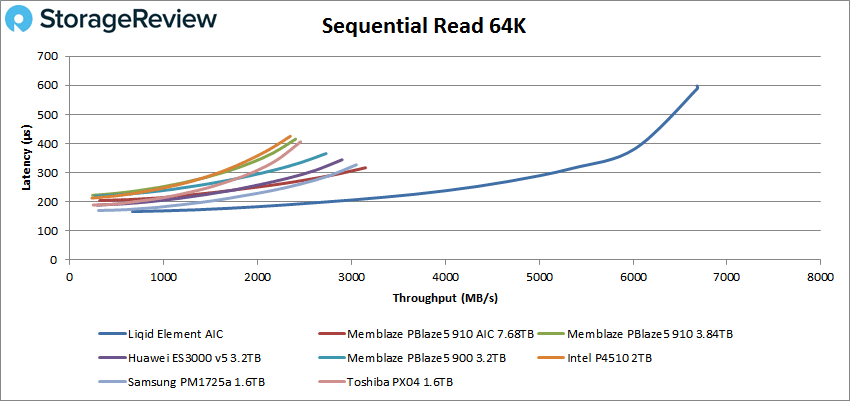
Switching over to sequential workloads, the Element surpassed all, finishing with 106,935 IOPS, or 6.68GB/s, with a latency of 597μs.
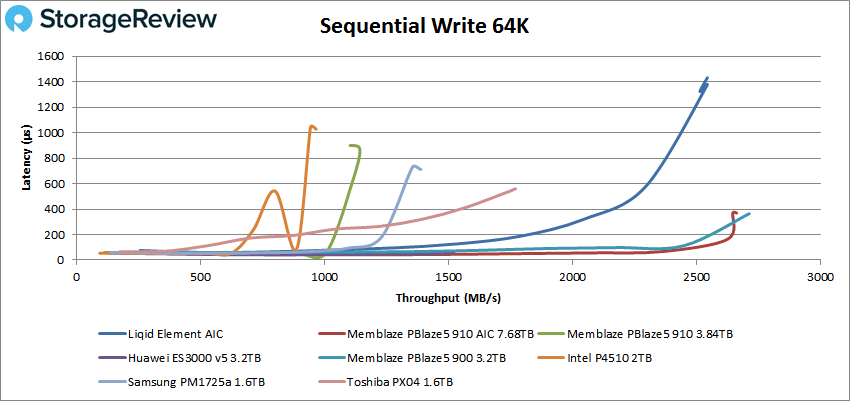
In 64K sequential write, the Element moved back to third place in terms of latency, peaking at 40,679 IOPS, or 2.54GB/s, with a latency of 1,431.1μs.
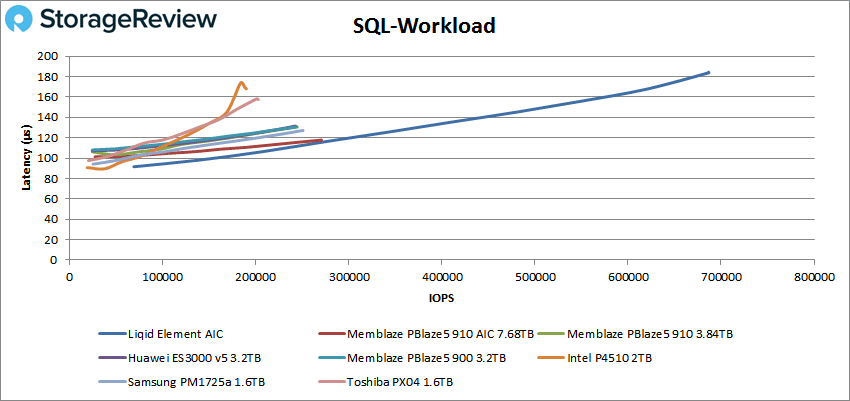
Next, we look at our SQL Workload. Here, the Element came in first by an extremely wide margin with a peak performance of 686,486 IOPS at a latency of 184.5μs.
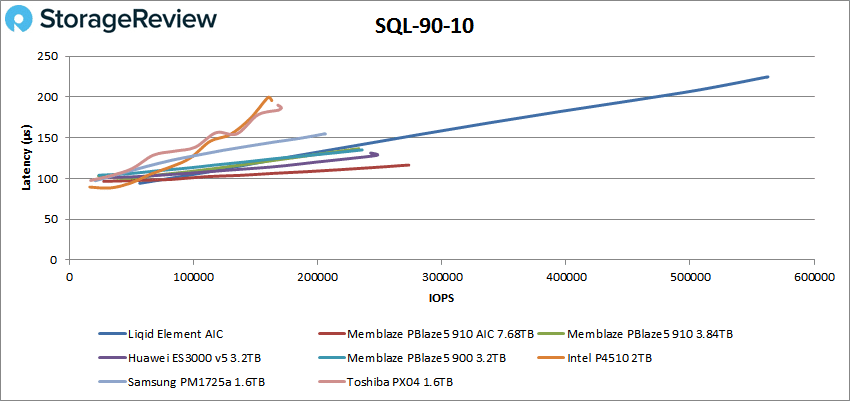
Moving on to SQL 90-10, the Element finished at 561,899 IOPS with a latency of 224.2μs, again far beyond any of the other drives tested.
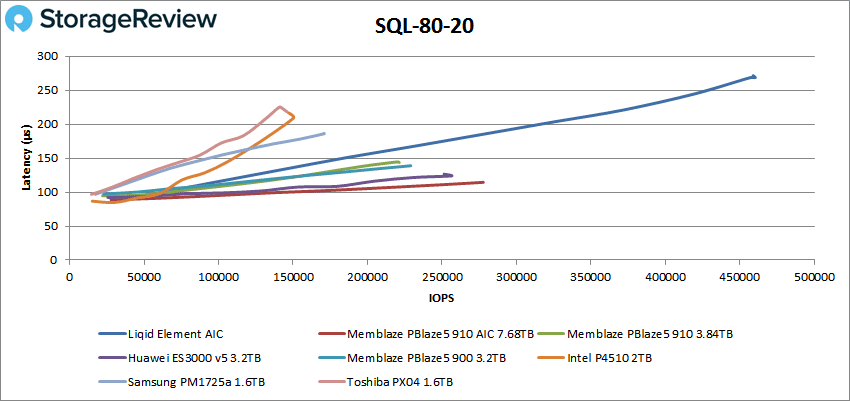
In SQL 80-20, the Element stayed well out in front with at 459,010 IOPS with a latency of 271.4 μs.
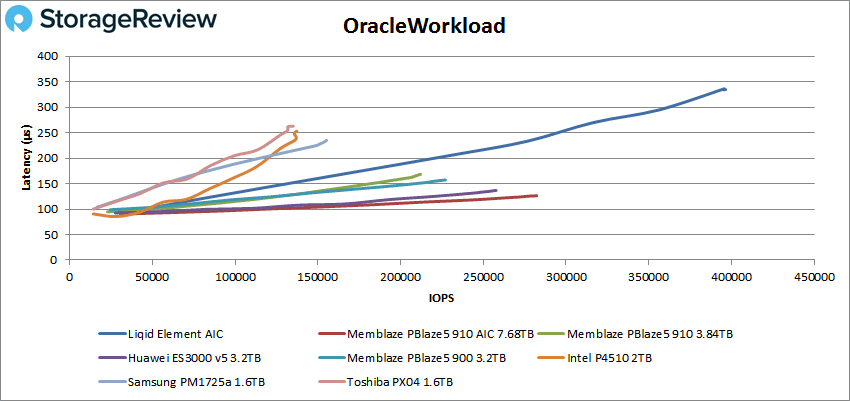
For our Oracle tests, the Element started off a bit behind in latency. For the first test, the Oracle Workload, the Element took fifth in latency at 334.5μs, peaking at 396,492 IOPS, roughly 120K IOPS higher than the next place drive.
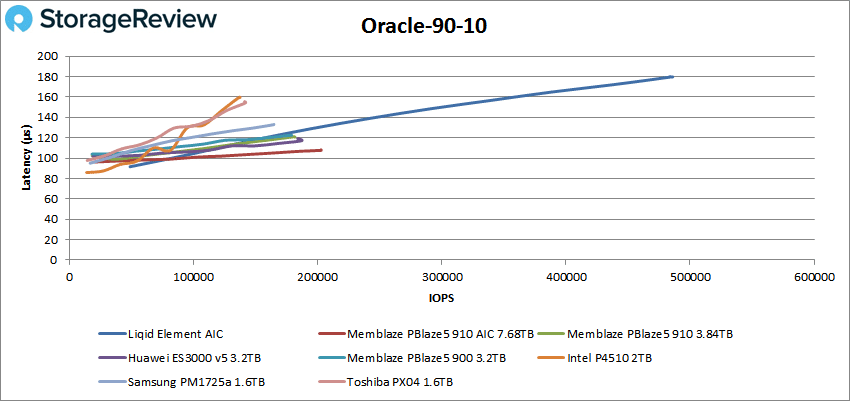
The Oracle 90-10 showed the drive hitting 486,053 IOPS and a latency of 179.7μs.
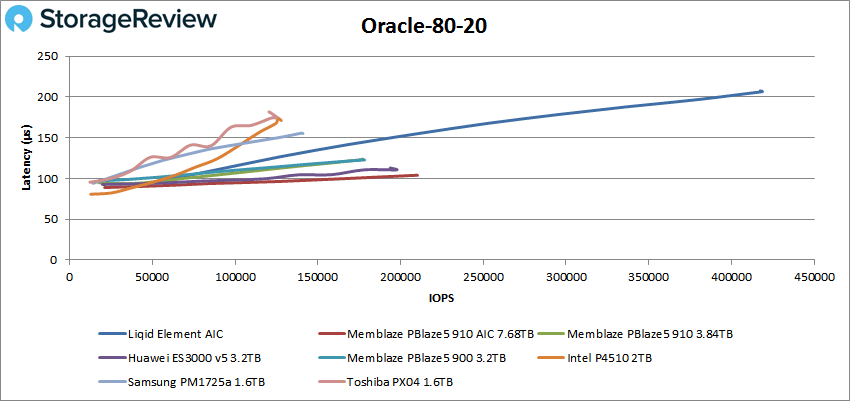
The Liqid measured 207.6μs in the Oracle 80-20 test, showing 417,434 IOPS at its peak.
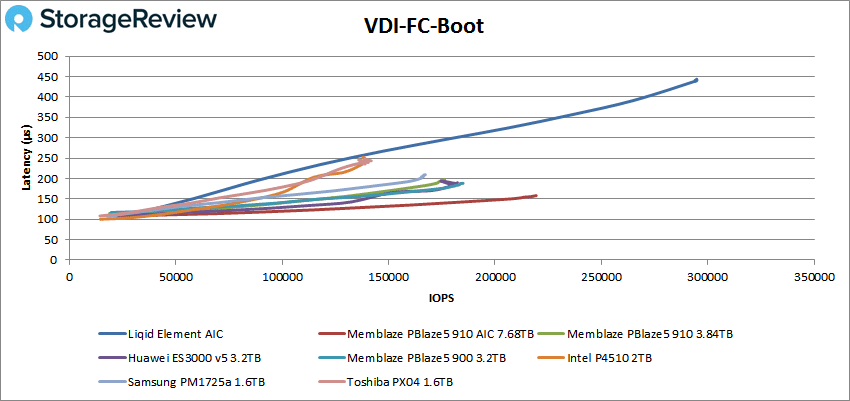
Next, we switched over to our VDI clone tests, Full Clone (FC) and Linked Clone (LC). For VDI FC Boot, the Element finished at 294,803 IOPS with the highest latency of the pack with 443.7μs.
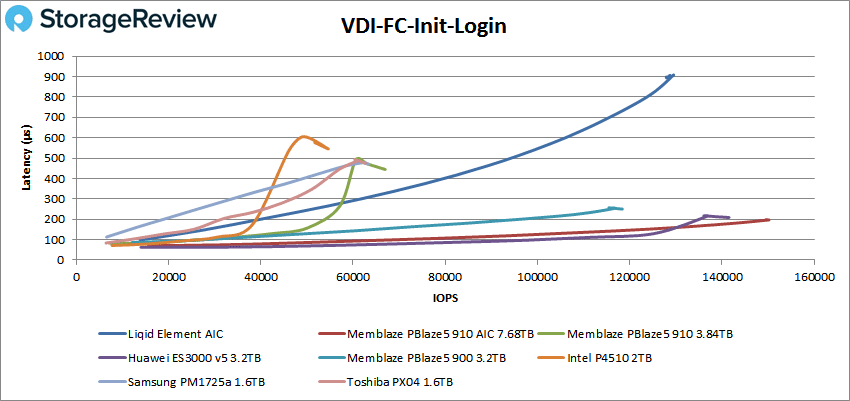
We finished the VDI Initial Login test at 128,741 IOPS and a latency of 906.5μs.
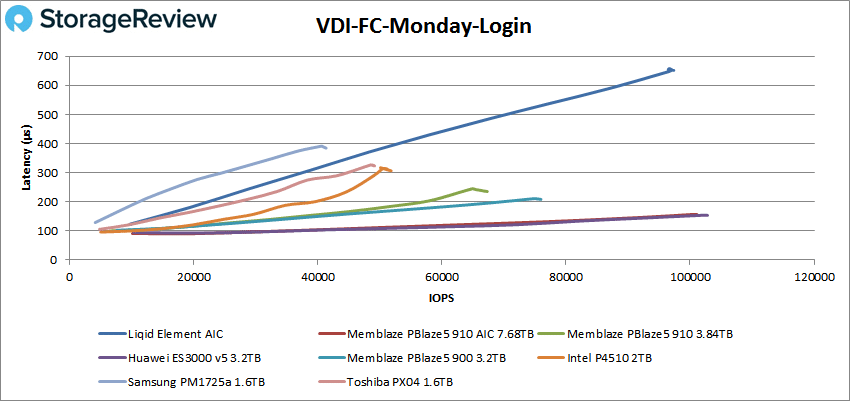
The Element fell behind in latency on the VDI FC Monday Login, with 97,380 IOPS at a latency level of 651.5μs.
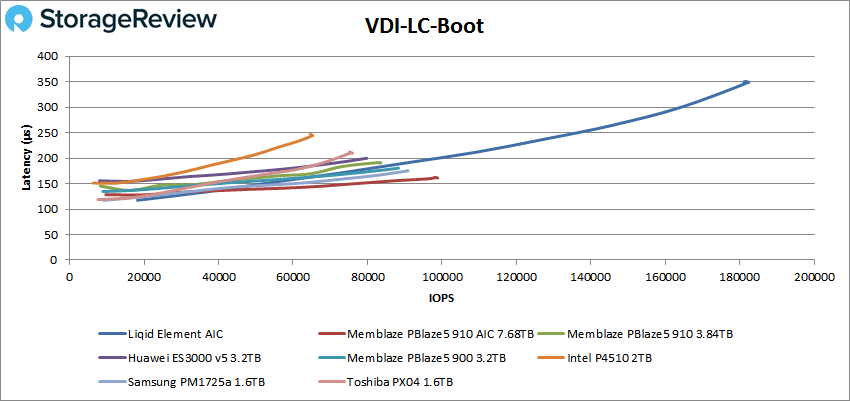
Switching over to Linked Clone (LC), we first looked at the boot test. In this scenario, the Element placed fourth in latency with 348.7μs, peaking with 182,415 IOPS.
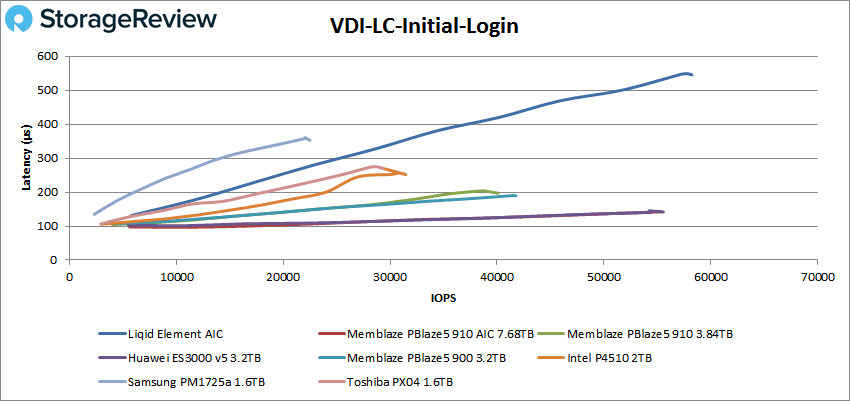
VDI LC Initial Login had the drive peak at 57,987 IOPS and 547.8μs latency.
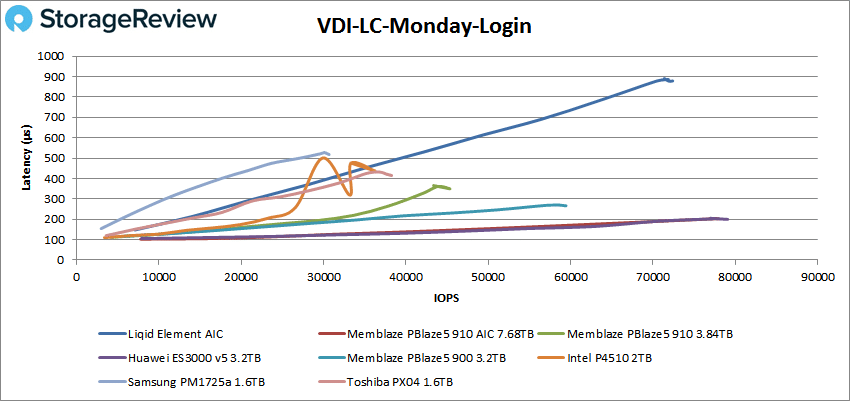
For our final test, VDI LC Monday Login the Element finished with 72,412 IOPS at a 878.9μs latency level.
Conclusion
The Element AIC is a showcase of Liqid’s PCIe switching technology, showing incredible performance and is not locked in to a specific SSD, giving users more freedom to choose which SSD they’d like to use. The low profile, standard form factor HHHL card provides extreme performance, high-grade reliability, power loss data protection, active telemetry monitoring, thermal throttling, power management, and a low overhead architecture.
On the performance side, the Element AIC really lived up to Liqid’s claims. On our Application workload Analysis performance tests, the Element topped the charts on almost every test. In SQL Sever the Liqid had the highest transactional score with 12,646.1 TPS and the lowest latency at 1ms. Sysbench had the Liqid at 10,601.3 TPS, an average latency of 12.2ms, and a worst-case scenario latency of 26.2ms. On the Houdini side, aside from the Optane drives, it placed third for non-Optane drives with 2,519.4 seconds.
With our VDBench Workload Analysis was a bit of a mixed bag. The Liqid had the highest performance in most cases but tended to run higher in latency (though it never went above 1ms). Some highlights include 1.45 million IOPS in 4K read, 664K IOPS in 4K write, 6.68GB/s in 64K read, 2.54GB/s in 64K write, 686K IOPS in SQL, 562K IOPS in SQL 90-10, 459K IOPS in SQL 90-10, 396K IOPS in Oracle, 486K IOPS in Oracle 90-10, 417K IOPS in Oracle 80-20, 295K IOPS in VDI FC Boot, and 182K IOPS in VDI LC Boot.
The Liqid Element AIC provided impressive performance figures, making it an ideal candidate for data centers and enterprise environments. Given the flexibility of the card's design, allowing for an agnostic approach to the underlying SSDs leveraged, users will see variation in performance depending on the SSDs chosen.


 Amazon